Abstract
Oil-coolers are necessary components in high performance diesel engines. The heat removed by the cooler is a component in the total heat rejection via the engine coolant. Oil-cooler absorbs the heat rejected during the piston cooling and engine rubbing friction power loss. During flows of both coolant and engine oil via the oil-cooler, some flow resistances occur. The aim of the study is to determine values of the flow resistance coefficient for oil going through the cooler at various temperatures. The test stand was developed to determine time needed to empty tanks from liquids flowing through oil-cooler. The flow model was elaborated to study the mentioned flow resistance coefficient with respect to changing liquid temperature. The 20 °C increase in liquid temperature resulted in a flow resistance coefficient decrease of 30% for coolant and of the much more for engine oil. It was found that better results would be achieved with flows forced by means of pumps instead of using gravitational forces on the test stand.
1. Introduction
To provide their high performances and low emissions many heavy-duty direct injection (DI) compress ignition (CI) engines possess oil-coolers utilizing the engine coolant for heat transfer therein. The heat took out by the oil-cooler is a component in the total heat rejection via an engine coolant. Oil-cooler obtains the heat rejected during the piston cooling and the one resulted from the engine rubbing friction power loss.
According to [1] the total rubbing friction can be estimated by subtracting the numerically determined pumping loss and accessory power from the measured engine motoring power.
The engine accessories’ power comprises ones of the water pump, the oil pump, the fuel pump, and the alternator.
The motoring power can be estimated using the Willan’s line [2], where a chart of fuel flow rate as a function of the brake mean effective pressure (BMEP) allows an extrapolation to zero fuel flow rate. Such rate is needed to estimate the motoring mean effective pressure (MEP) or power.
Taraza et al. [3] elaborated a global friction model considering the individual friction components (e.g., piston assembly, bearings, valvetrain) and auxiliaries (injection pump, oil one, and coolant one). This global model allowed an enhancement in simulation accuracy both for steady state and transient engine operations.
Elaborating the engine friction model for the turbocharged CI engines with the Common Rail system, Ceausu et al. [4] utilized the generic friction models for the engine piston-ring-liner assembly, bearings, and valve train. The authors elaborated the separate models for the mechanical losses introduced by the injection system, the oil and water pumps. The similar models were utilized in a study presented in [5].
The heat rejection from the engine exhaust port is a part of such rejection from the base engine coolant. Methods for its determination were reported in [6,7,8].
Bannister et al. [9] elaborated an exhaust system model comprised of 11 sections arranged in a series and representing a range of configurations seen in production exhaust systems. Such sections included differences in the wall thickness, diameter, and bend angle and radius.
Cylinder head cooling was investigated by Brasmer et al. [10] and Norris et al. [11,12].
Piston cooling and heat rejection was discussed in [9,10,11,12,13,14,15,16,17,18,19].
Oil-cooler design and testing were reported in [20,21,22,23,24].
Various investigations on the engine coolant heat rejection were described in [25,26,27,28,29,30,31,32,33,34,35,36,37,38,39,40,41,42,43,44,45,46,47,48].
During heat transfer in oil-coolers the flowing coolants and engine oils encounter increased resistance to flow [49] which can be characterized by the coefficients of the resistance to flow. Therefore, the goal of the present study was to determine values of such coefficients under various conditions, namely temperatures of coolant and engine oil.
1.1. Some Considerations Relative to the Engine Oil Systems, Properties, and Components
Heavy-duty diesel engine lubrication system design was discussed by Kluck et al. [50]. The researchers applied such process to the lubrication system for a John Deere 400 Series engine. Such lubrication system comprised a gear oil pump, a plate-type oil-cooler, full-flow oil filter, and a feedback pressure regulating valve, belonging to the ‘supply side’ pumping and conditioning the oil. The system comprised also the journal bearings and piston spray jets belonging to the ‘demand side’ consuming the oil.
Using the flow simulation Liu [51] developed the lubrication system model of BJ493ZLQ4A diesel engine. The author studied the properties of this lubrication system, such as the oil flow rate and pressure at different rotational speeds for various schemes involving large- and small–scale oil filters.
According to Clark et al. [52] the physical properties of diesel engine oil can be quantified through direct, real–time measurements using an onboard sensor measuring the oil temperature, density, dynamic viscosity, and dielectric constant.
Qasim et al. [53] studied various properties of Pakistani fresh and used monograde (SAE–40, SAE–50) and multigrade (SAE–20W/50) engine oils.
Besergil et al. [54] studied the service life of the lubricant utilizing the base oils of Aliaga Plant, Izmir, in spark-ignition (SI) and CI engines. Team also investigated high-temperature oxidation, engine-protective properties, and variations of the lubricant characteristics in performance time.
Kim et al. [55] studied the effect of engine oil composition on particulate matter (PM) emission from a light-duty CI engine.
Various defects in engine systems may contaminate engine oil with fuel and change properties of such an oil [56,57,58].
Engine oils often contain various additives [59]. Those additives are mixtures of inorganic and/or organic combinations ameliorating the oil features [60]. On average, the additives make up to 7% of a typical lubricant base [61]. Therefore, an engine oil often comprises dithiophosphates, over-based calcium sulphonates, succinimidic dispersants, and polymer VI improvers [62]. Examples of organic additives comprise viscosity modifiers decreasing the rate of viscosity variations with temperature, friction modifiers and dispersants stabilizing the dispersion of insoluble contaminants in oil. Metallo–organic compounds, such as zinc dialkyl dithiophosphate (ZDDP), are utilized to improve the packages [60,63]. Various detergent packages comprise metallo–organic compounds of sodium, calcium, and magnesium (among others) preventing surfaces from various deposits [60]. The sulfur compounds can play antioxidant role [64]. Various nanoparticles added to engine oils decrease friction and increase a resistance to wear [65,66,67,68,69].
Mitan et al. [70] studied the effect of commercial oil additive (COA) to mineral and semi-synthetic lubricants performance in four-stroke motorcycle engine.
A complex tribological model of piston-assembly lubrication dynamics was reported in [71].
1.2. Application of the Oil-Coolers
According to Wittebrood et al. [72] vehicle engines often utilize plate-type oil-coolers. The plate heat exchangers are commonly applied during vacuum manufacturing. The components of such exchanger are brazed with vacuum brazing. The latter is used for products requiring excellent internal cleanliness. It is needed to prevent any flux residue to be carried into the engine by the cooled oil as it may cause wear. In some cases, it is necessary to avoid the coolant side interaction with residual brazing flux.
Palmgren and Wallborg [73] present five concepts of improved oil-coolers and numerically evaluated their performances.
Sarma et al. [74] studied theoretically the properties of engine oil crossflow heat exchanger cooled with cold air at various flight altitudes. The effect of temperature in the oil ducts on the properties of engine oil was considered there. The results of theoretical predictions were compared with the conventional empirical equations of heat transfer presented in literature. It was found that the calculated effectiveness of the heat exchanger enhanced with the altitude of the flight. Additionally, the thermal properties varied with the altitude and hence the effectiveness of the heat exchanger in turn depended on Reynolds Number of the hot and cold fluids, number of transfer units, and specific heat variations.
Di Battista and Cipollone [75] utilized the heat from exhaust gases to warm up an engine oil. Researchers tested a turbocharged engine (F1C 3L IVECO), with the oil circuit modified to heat up the oil during the cold phase of the driving by the exhaust gases. A significant decrease in fuel consumption and pollutant emissions for an engine tested has been reported.
Rajpoot et al. [76] conducted the optimization of the finned tube oil/water cooler for hydro-electric turbine guide bearing application by effective utilization of fin area.
Azadi and Azadi [77] analyzed the failure of a heat exchanger used for cooling the oil in a marine diesel engine during its operation in the marine environment.
It was found that very little information is available relative to the resistance to flow for liquids flowing via oil-coolers.
2. Materials and Methods
2.1. Oil-Cooler Studied
An engine oil-cooler (Figure 1) using the engine coolant was used for the tests. The flow diagram through that cooler is shown in Figure 2.
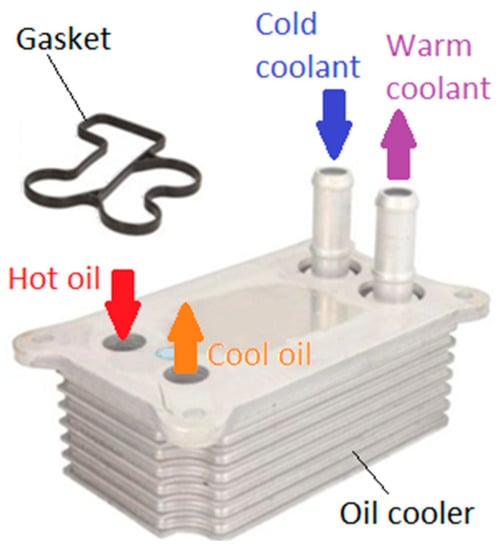
Figure 1.
The engine oil-cooler studied.
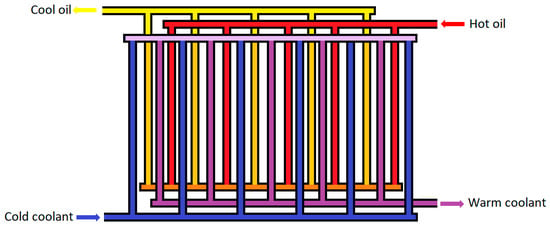
Figure 2.
The diagram of fluid flows through the oil-cooler.
The heated oil from the engine flows into the oil-cooler through one collective channel, which is then divided into several parallel flow paths with complex geometries. Then the cool liquid is led through one collective channel to the oil–cooler and then divided into several parallel flow paths with complex geometry. The portion of surface bounding the volume of the path through which the oil flows in the cooler is circumscribed by extruded aluminum ribs washed by coolant flowing in adjacent flow paths. The upstream and downstream flow paths contain the flowing coolant. The heat from the heated oil is transferred to the cool coolant. The mentioned ribbing intensifies the heat transfer between the flowing oil and the coolant. The cooled oil flows further to the engine lubrication system. The warm coolant flows to the engine radiator. There, the heat from the coolant is picked up by the airflow blowing the radiator.
The tested oil–cooler model was installed in the car models presented in Table 1.

Table 1.
Car models with an engine oil-cooler analogous to the studied one.
The tested oil–cooler model was the one installed in the FORD MONDEO MK3. Such cooler was installed in the engine version given in Table 2.

Table 2.
FORD MONDEO MK3 engine versions with oil-cooler analogous to the studied one.
2.2. The Oil Studied
For the engines applied in FORD Mondeo MK3 one oil type is predestined [78], as specified in Table 3.

Table 3.
Engine oil type applicable to various FORD MONDEO MK3 engine versions.
Such oil can be supplied by various manufacturers. However, its properties, particularly viscosity and density can differ from each other [79], as shown in Table 4.

Table 4.
Properties of engine oil 5W–30 from various manufacturers.
For the tests conducted it was chosen the engine oil ELF Evolution 900 SXR. Its viscosity index (VI) is equal to 170 [80].
The kinematic viscosity is related to the dynamic one via Equation (1)
where —density of oil as a function of temperature, given and tabulated in [81].
To estimate the dynamic viscosity of oil at temperature values different than these equal to 40 or 100 °C the Equation (2) based in the Andrade equation [82] was used
where [Pas]—the proportional factor, [1/K]—the exponent factor.
2.3. The Coolant Studied
For the engines applied in FORD Mondeo MK3 various coolants from various manufacturers [83] can be applied, as specified in Table 5.

Table 5.
Properties of engine coolant from various manufacturers.
For the tests conducted it was chosen the engine coolant MANNOL AF13++, High-performance. It was assumed that it is a mixture contain 50% ethanediol, 0.2% sodium hydroxide, and 49.8% distilled water. Omitting the amount of sodium hydroxide in the mixture, due its small value, the MANNOL coolant can be treated as the 50/50 mixture of ethanediol and distilled water. The dynamic viscosity of such mixture is equal to 3.192 × 10⁻³ Pa⸱s at the temperature of 20 °C and to 0.979 × 10⁻³ Pa⸱s at the temperature of 40 °C [84]. The density of such mixture is equal to 1079 kg/m3 at the temperature of 20 °C and to 1067 kg/m3 at the temperature of 40 °C [84].
2.4. Test Stand
2.4.1. Hydraulic Diagram of the Test Stand
The diagram of the hydraulic system of the test stand is shown in Figure 3. The system comprises the upper oil tank 1, the upper coolant tank 2; thermometers 3; the shut–off valves 4, the oil–cooler studied 5, the lower oil tank 6 and the lower coolant tank 7.
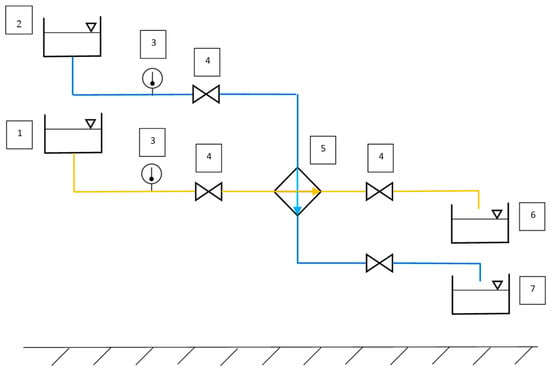
Figure 3.
Diagram of the hydraulic system of the test stand. 1—upper oil tank; 2—upper coolant tank; 3—thermometer; 4—shut–off valve; 5–oil–cooler; 6—lower oil tank; 7—lower coolant tank.
In the test stand, the flows of heat–exchanging fluids in the tested oil–cooler were carried out by gravity, by using the differences in the height of the respective tanks: upper and lower. In addition, thermometers were installed in the hydraulic system of the stand, measuring the temperature of the coolant and oil in characteristic places.
2.4.2. Design of the Test Stand
The completed test stand is presented in Figure 4.
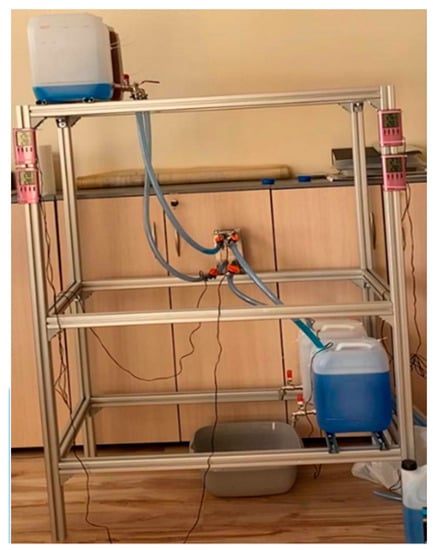
Figure 4.
The completed test stand.
The supporting structure of the test stand was based on a frame made of standard BOSCH 40 × 40 four-groove system profiles connected with each other by means of angle bracket, screws, and nuts. Three horizontal subframes (three levels) were made. Two tanks, called upper tanks, were attached to the upper level, one was filled with oil, the other with coolant. The upper tanks were attached to Fischer FLS 17/1 16 × 20 × 46 C–shaped mounting rails screwed to the frame and sealed with a special adhesive for sealing hydraulic systems. At the outlet of each upper tank there was a shut-off valve connected to a pipe made of plastic.
On the middle level, the tested oil–cooler was attached to the profile with a dedicated adapter. The cooler was attached with DIN EN ISO 7046–1 M6 × 16 screws to the 6 mm thick plates, which were bent at an angle of 90° and fixed to the profile with screws (Figure 5). The cooler has been installed in the same position as it was originally on the engine to maintain proper flow through the oil-cooler. Shut off valves were placed on the inlet and the outlet of the oil-cooler to allow for the entire system to be filled with liquids. The shut-off valves located on the inlet of the oil-cooler are connected to the appropriate shut-off valves at the outlets of the upper tanks. On the other hand, the shut-off valves located on the outlet of the oil-cooler are connected to the appropriate shut-off valves located at the inlets of the lower tanks.
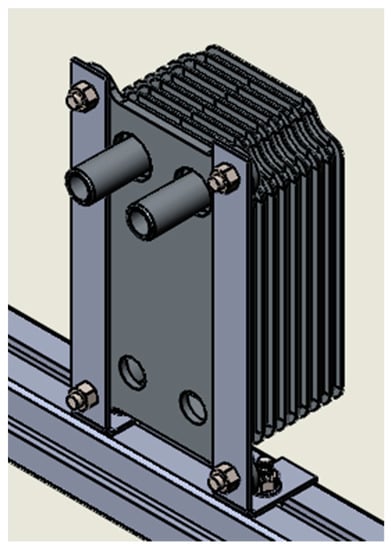
Figure 5.
Mounting of the oil-cooler studied.
On the bottom level, afore mentioned bottom tanks were attached to Fischer FLS 17/1 16 × 20 × 46 C-shaped mounting rails screwed to the subframe and sealed with a special adhesive for sealing hydraulic systems. At the inlet of each bottom tank there was a shut-off valve connected to a pipe made of plastic.
The distance between the levels was 600 mm (Figure 6), which allowed the fluid to flow freely, and the conduit used was routed as straight as possible to limit the flow resistance.
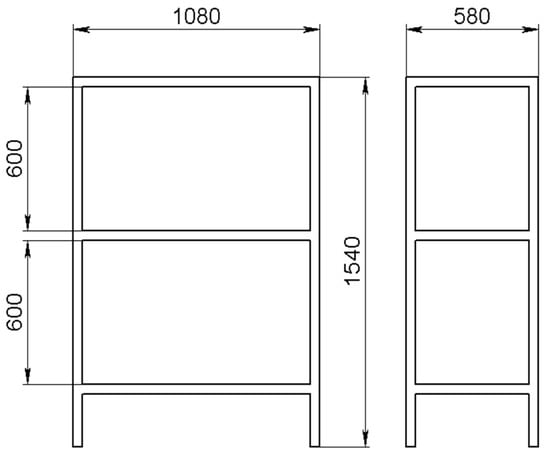
Figure 6.
Dimensions of the test stand.
Four identical digital thermometers were used to monitor the temperature of the liquids. Temperature was measured on the inlet of the oil–cooler and on the inlet of the lower tank (Figure 7). Such setup of thermometers was performed in both two flow lines of the tested liquids.
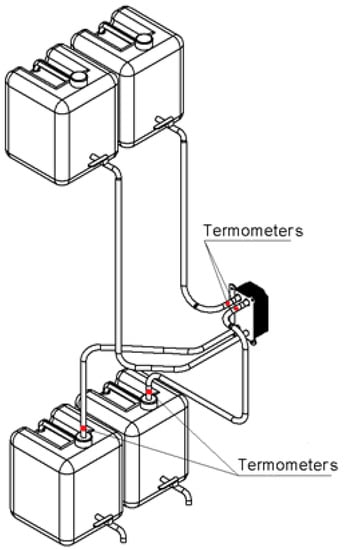
Figure 7.
Location of monitoring thermometers on the test bench.
2.4.3. The Determination of Resistance to Flow through the Oil-Cooler
Determining of resistance to flow of the liquid studied through the oi-cooler or the replacing it short section of plastic pipe was conducted using the model presented in Figure 8. The liquid studied flows from the upper tank successively through:
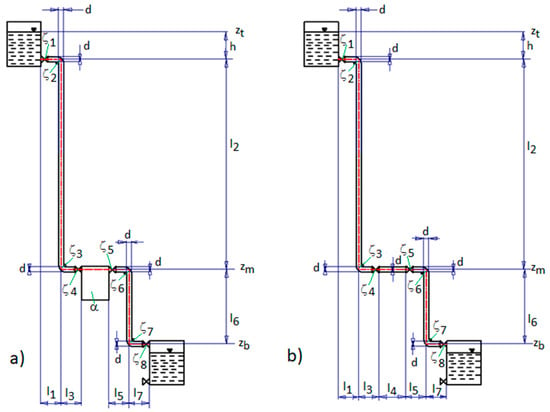
Figure 8.
Model for determining the flow of the liquid studied through (a) oil–cooler, (b) short section of plastic pipe.
- -
- the outlet shut-off valve connected to the upper tank, characterized by the local flow losses factor = 0.24 [85],
- -
- the plastic pipe section with length = 10 mm and inner diameter = 15 mm, characterized by the length loss factor [85],
- -
- the elbow pipe section, characterized by the local flow losses factor = 0.132 [85],
- -
- the plastic pipe section with length = 620 mm and inner diameter , characterized by the length loss factor [85],
- -
- the elbow pipe section, characterized by the local flow losses factor = 0.132 [85],
- -
- the plastic pipe section with length = 250 mm and inner diameter , characterized by the the length loss factor [85],
- -
- the inlet shut–off valve connected to the oil–cooler or to the alternative short section of plastic pipe, characterized by the local flow losses factor = 0.24 [85],
- -
- the oil–cooler characterized by the coefficient of resistance to flow , or the alternative short section of plastic pipe with length = 80 mm and inner diameter , characterized by the length loss factor [85],
- -
- the outlet shut-off valve connected to the oil–cooler or to the alternative short section of plastic pipe, characterized by the local flow losses factor = 0.24 [85],
- -
- the plastic pipe section with length = 200 mm and inner diameter , characterized by the length loss factor [85],
- -
- the elbow pipe section, characterized by the local flow losses factor = 0.132 [85],
- -
- the plastic pipe section with length = 300 mm and inner diameter , characterized by the length loss factor [85],
- -
- the elbow pipe section, characterized by the local flow losses factor [85],
- -
- the plastic pipe section with length = 200 mm and inner diameter , characterized by the length loss factor [85],
- -
- the inlet hole of the bottom tank, characterized by the local flow losses factor = 0.5 [85],
and finally, to the bottom tank.
An unsteady flow of the studied liquid was considered, due to the time-varying height of the liquid column in the upper tank with a constant cross-sectional area along its height. The height values are in the range 0–400 mm.
In the model it was assumed that:
- -
- the liquid studied is incompressible,
- -
- the cross–sectional area of the upper tank much larger than the dimensions of the outlet opening, pipes, valve openings and openings in the oil–cooler (),
- -
- the surface of the liquid table is a free one,
The flow speed of the studied liquid was determined on the two characteristic levels:
- -
- the first positioned on the height corresponding to the location of the center of the outlet shut–off valve connected to the upper tank,
- -
- the second positioned on the height corresponding to the location of the center of the inlet hole of the bottom tank.
It was assumed that both the liquid table in the upper tank and the liquid flowing from the inlet hole of the lower tank were under the atmospheric pressure .
The flow speed of the liquid on the level was marked with .
The Bernoulli equation is given in the form (3) [85]
where = 9.81 m/s2—acceleration due to gravity, —density of the liquid studied, —the sum of the flow losses determined from Equation (4)
where —flow losses in the pipe section of length , determined from Equation (5) [85]
where —the length loss factor for the pipe section of length , —the linear resistance coefficient, for the assumed laminar flow, —Reynolds number, —the kinematic viscosity of liquid studied, —local flow losses at , determined from Equation (6) [85]
where —the local flow losses factor.
The flow speed of liquid studied in the upper tank—due to a much larger cross–sectional area of the upper tank in relation to the cross-sectional area of the inlet hole of the bottom tank ()–is negligible (). Therefore, Equation (3) can be simplified to the form (7)
and then it can be obtained Equation (8) allowing determination of the flow speed
The flow speed can be the solution of the Equation (9)
which is given by the Equation (10)
The flow rate balance is given by Equation (11)
where —cross–sectional area of the inlet hole of the bottom tank, —cross–sectional area of the upper tank, 0.3 m, b = 0.1 m—dimension of cross–section of the upper tank.
The time of emptying the upper tank is estimated from Equation (12)
After rearranging of Equation (12) it was obtained the Formula (13)
For the case of the liquid flowing through the oil-cooler the time of emptying the upper tank was determined from the Equation (14)
where —flow speed for the case of liquid flowing through the oil-cooler.
For the case of the liquid flowing through the alternative short plastic pipe section, the time of emptying the upper tank was determined from the Equation (15)
where —flow speed for the case of liquid flowing through the alternative short plastic pipe section.
From Equations (10), (14) and (15) the parameter can be numerically determined.
After rearrangement of Equation (15) we obtain Equation (16)
Its solution is given by Equation (17)
From the evenness of the flowing volumes of liquid we obtained Equation (18)
After re-arrangement of Equation (14) we obtain Equation (19)
Substituting Equation (18) in Equation (19), after rearrangement we obtained Equation (20) for the coefficient
The flow rate of liquid flowing through the oil-cooler was determined from Equation (21)
where —density of the liquid studied flowing through the oil–cooler, —cross section area of the inlet hole of the oil-cooler, = 12 mm—diameter of the inlet hole of the oil-cooler.
The pressure drops caused by liquid studied flowing through the oil-cooler was estimated from Equation (22)
2.4.4. Measurement Procedure
During the tests, the resistance to the flow of engine oil and engine coolant through the oil-cooler was measured. The measurement took place at two room temperatures of 20 °C and 40 °C.
First, the total flow resistance was determined in the flow lines of the tested liquids on the stand outside the oil-cooler. The mentioned resistances were caused by the presence of shut-off valves and relatively long lines between the tanks and the oil-cooler. During the measurement of those resistances, the oil-cooler was replaced with short sections of plastic pipes with an internal diameter of 15 mm and a length of 80 mm, which were connected to the appropriate shut-off valves.
For two room temperatures of 20 °C and 40 °C, respectively, were measured separately:
- -
- time of flow of a measured amount of coolant without oil flow,
- -
- time of flow of the measured amount of oil without the flow of coolant.
Figure 9 shows a laminar flow of coolant during the measurement of its flow time.
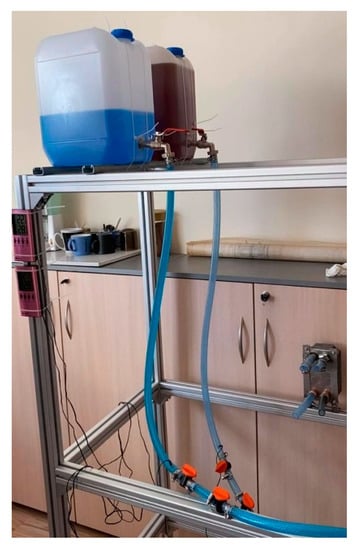
Figure 9.
Laminar flow of coolant during the measurement of its flow time through the alternative short section of plastic pipe replacing the oil-cooler.
In the next phase of testing at the stand, the short sections of plastic pipes were removed, and the shut-off valves were connected to the relevant stub pipes of the oil-cooler.
For a room temperature of 40 °C, it was measured separately:
- -
- the time of the flow of the measured amount of coolant without the flow of oil through the oil-cooler,
- -
- time of flow of the measured amount of oil without the flow of coolant.
For a room temperature of 20 °C, it was only measured:
- -
- time of the flow of a measured amount of coolant without the flow of oil through the oil-cooler.
When the coolant was not circulating through the oil cooler, the time of flow of oil could not be determined with a high confidence level. This was due to an increased flow resistance caused by higher oil density at tested temperature. Air was appearing in the pipes between the upper oil tank and the oil-cooler, and it was very difficult to remove it during the measurement. Therefore, the results of measurements for this case could be considered as the coarse ones.
During all the measurements carried out, the temperature of the fluids was controlled in the designated places. There were no differences between the room temperature and the temperature of the flowing test liquid.
In all tested cases, filling the upper tanks with coolant and engine oil, respectively, took place with the outlet shut-off valves of the upper tanks closed. After the upper tank was half filled with the liquid, the outlet shut-off valve of the upper tank was opened, which allowed for gradual filling of the pipe between the outlet shut-off valve of the upper tank and the inlet shut-off valve connected to the cooler or the alternative short section of plastic pipe. After filling said pipe, the outlet shut-off valve connected to the radiator or to the alternative short piece of plastic pipe was opened. This made it possible to gradually fill the relevant main line in the oil-cooler with liquid or a short section of plastic pipe replacing this cooler. Finally, the outlet shut-off valve connected to the oil-cooler or a short piece of plastic pipe replacing of the oil-cooler was opened and the test liquid gradually drained into the lower tank. Such successive opening of the shut-off valves was dictated by safety considerations to properly identify and early eliminate possible leaks in connections and prevent unnecessary loss of tested liquids. It also partially prevented the formation of air bubbles and facilitated their evacuation to the upper reservoir by deliberately repeatedly moving (deflecting from the original position) the lines filled with the tested liquid. During the flow from the upper to the lower tank, the liquid level in the upper tank was lowered and the tested liquid had to be replenished until the visible air bubbles in the conduits were eliminated. Then the outlet cut-off valve connected to the oil-cooler or a short piece of plastic pipe replacing of the oil-cooler was closed, and the liquid in the upper tank was replenished until the assumed upper (primary) level was reached. At that time, the stand was considered ready for flow time measurement. The test liquid accumulating in the lower tank can be poured through the outlet shut-off valve located at the bottom of the lower tank into a separate canister and re-poured into the upper tank if necessary. The flow time was measured from the moment of reopening the outlet cut-off valve connected to the oil-cooler or a short piece of plastic pipe replacing of the oil-cooler until the assumed lower level of the tested liquid in the upper tank was reached. The time control was carried out with the use of a camera tracking the changes in the position of the liquid surface tested in the upper tank.
3. Results and Discussion
The obtained values of kinematic viscosity of the coolant and oil studied were presented in Table 6. An increase of the temperature with 20 °C resulted in the decrease of the kinematic viscosity, namely, the 3.22-fold one for the coolant and the 2.47-fold one for the engine oil, respectively.

Table 6.
Kinematic viscosity of the liquids studied for various values of its temperature.
The measured values of time needed to empty the upper tank from liquids flowing under various conditions were presented in Table 7. An increase of the temperature with 20 °C resulted in the decrease of the time necessary for the emptying of the upper tank, namely, the 1.25-fold one and the 1.22-fold one for the coolant flowing via oil-cooler and via short plastic pipe section, respectively. Similarly, the mentioned increase in temperature resulted in a much higher decrease of the time needed for the emptying of the upper tank, namely, the 1.56-fold one and the 1.29-fold one for the engine oil flowing via an oil-cooler and via a short plastic pipe section, respectively.

Table 7.
Time values necessary for the emptying of the upper tank from the liquids flowing at various conditions.
The obtained values of the coefficient of resistance to flow were shown in Table 8. An increase of the temperature with 20 °C resulted in the decrease of the coefficient of resistance to flow , namely, the 1.43-fold one and the 61-fold one for the coolant and the engine oil, respectively.

Table 8.
Coefficient of resistance to flow for various values of liquid temperature.
The obtained values of the flow speed for the liquids studied and relative flow rate and pressure drop-in oil-cooler were showed in Table 9.

Table 9.
Flow speed, flow rate, and pressure drop for the liquids flowing via an oil-cooler.
The obtained value of pressure drop caused at 20 °C by an engine oil flowing through the oil-cooler was close to that reported in [49], obtained for the other type of oil-cooler applied in the diesel engine, for the minimal flow rate reported, which was by two orders higher compared to the case of oil analyzed during the present study. However, the temperature of an engine oil supplied to the oil-cooler described in [49] was also much higher resulting in the lower values of the oil viscosity. At the temperature of 40 °C the pressure drop was about 1.4-fold and 1.1-fold lower for a coolant and an engine oil, respectively than that at temperature of 20 °C.
4. Conclusions
Based on the results obtained, we have made some conclusions:
- The analyzed oil-cooler was filled with engine oils SAE 5W–30 viscosity. Considering different manufacturers, the kinematic viscosity and density differed from one another. Apart from that, some manufacturers specified the oil density at 15 °C, while the others used 20 °C. Many manufacturers did not report exact values for the mentioned quantities at all.
- Similarly, the studied oil-cooler was also filled with coolants supplied by different manufacturers. Those coolants differed from one another by its kinematic viscosity and density. Some of manufacturers specified the values of these quantities determined at a temperature of 20 °C, but most of them did not provide such values.
- The test stand allowed for the time estimation of emptying the upper tanks from a coolant and an engine oil flowing via the oil-cooler studied.
- The flow model allowed for estimation of flow resistance coefficient for the coolant and the engine oil flowing through the oil-cooler.
- Obtained values of flow resistance coefficient were affected by the temperature. An increase in temperature from 20 °C to 40 °C resulted in a decrease in flow resistance coefficient , namely, the 1.43-fold one and the 61-fold one for the coolant and the engine oil, respectively.
- As the engines are using pumps to force the fluids, instead of using gravity, the flow model needs to be further developed to consider the possibility of forcing oil and coolant temperature changes.
Author Contributions
Conceptualization, M.W. (Marek Wozniak) and K.S.; Methodology, M.W. (Marek Wozniak); Software, P.K.; Validation, A.O. and B.D.; Formal analysis, K.S.; Investigation, L.G., M.W. (Michal Waleciak) and M.H.; Resources, M.W. (Marek Wozniak); Data curation, A.O.; Writing—original draft preparation, K.S.; Writing—review and editing, P.K.; Visualization, P.K.; Supervision, A.O.; Project administration, B.D.; Funding acquisition, B.D. All authors have read and agreed to the published version of the manuscript.
Funding
This research received no external funding.
Institutional Review Board Statement
Not applicable.
Informed Consent Statement
Not applicable.
Data Availability Statement
Not applicable.
Conflicts of Interest
The authors declare no conflict of interest.
References
- Xin, Q. (Ed.) 12—Diesel engine heat rejection and cooling. In Diesel Engine System Design; Woodhead Publishing: Sawston, UK, 2013; pp. 825–859. [Google Scholar]
- Heywood, J.B. Internal Combustion Engines Fundamentals, 1st ed.; McGraw-Hill, Inc.: New York, NY, USA, 1988. [Google Scholar]
- Taraza, D.; Henein, N.; Bryzik, W. Friction Losses in Multi-Cylinder Diesel Engines; SAE: Warrendale, PA, USA, 2000. [Google Scholar] [CrossRef]
- Ceausu, R.; Taraza, D.; Henein, N.; Bryzik, W. A Generic, Transient Model of a Turbocharged, Multi-Cylinder, Common-Rail Diesel Engine. In Proceedings of the ASME 2005 Internal Combustion Engine Division Spring Technical Conference, Chicago, IL, USA, 5–7 April 2005; pp. 375–386. [Google Scholar] [CrossRef]
- Taraza, D.; Henein, N.; Ceausu, R.; Bryzik, W. Complex Diesel Engine Simulation with Focus on Transient Operation. Energy Fuels 2008, 22, 1411–1417. [Google Scholar] [CrossRef]
- Hires, S.D.; Pochmara, G.L. An Analytical Study of Exhaust Gas Heat Lass in a Piston Engine Exhaust Port. SAE Trans. 1976, 85, 2415–2429. [Google Scholar]
- Rush, J. Exhaust Port Heat Rejection in a Piston Engine a Preliminary Report; SAE: Warrendale, PA, USA, 1976. [Google Scholar] [CrossRef]
- Malchow, G.; Sorenson, S.; Buckius, R. Heat Transfer in the Straight Section of an Exhaust Port of a Spark Ignition Engine; SAE: Warrendale, PA, USA, 1979. [Google Scholar] [CrossRef]
- Bannister, C.; Brace, C.; Taylor, J.; Brooks, T.; Fraser, N. The use of multi-variate models for the prediction of heat transfer in vehicle exhaust systems. Proc. Inst. Mech. Eng. Part D J. Automob. Eng. 2010, 224, 369–385. [Google Scholar] [CrossRef]
- Brasmer, S.; Hoag, K. The Use of Flow Visualization and Computational Fluid Mechanics in Cylinder Head Cooling Jacket Development; SAE: Warrendale, PA, USA, 1989. [Google Scholar] [CrossRef]
- Norris, P.; Wepfer, W.; Hoag, K.; Courtine-White, D. Experimental, and Analytical Studies of Cylinder Head Cooling; SAE: Warrendale, PA, USA, 1993. [Google Scholar] [CrossRef]
- Norris, P.; Hoag, K.; Wepfer, W. Heat transfer regimes in the coolant passages of a diesel engine cylinder head. Exp. Heat Transf. 1994, 7, 43–53. [Google Scholar] [CrossRef]
- French, C. Piston Cooling; SAE: Warrendale, PA, USA, 1972. [Google Scholar] [CrossRef]
- Pimenta, M.M.; Filho, R. Cooling of Automotive Pistons: Study of Liquid-Cooling Jets; SAE: Warrendale, PA, USA, 1993. [Google Scholar] [CrossRef]
- Mian, M. Design and Analysis of Engine Lubrication Systems; SAE: Warrendale, PA, USA, 1997. [Google Scholar] [CrossRef]
- Varghese, M.B.; Goyal, S.K.; Agarwal, A.K. Numerical and Experimental Investigation of Oil Jet Cooled Piston; SAE: Warrendale, PA, USA, 2005. [Google Scholar] [CrossRef]
- Fu, W.S.; Lian, S.H.; Hao, L.Y. An investigation of heat transfer of a reciprocating piston. Int. J. Heat Mass Transf. 2006, 49, 4360–4371. [Google Scholar] [CrossRef]
- Varghese, M.B.; Goyal, S.K.; Agarwal, A.K. Experimental and Numerical Investigations of Jet Impingement Cooling of Piston of Heavy-Duty Diesel Engine for Controlling the No-Tail Pipe Emissions; SAE: Warrendale, PA, USA, 2007. [Google Scholar] [CrossRef]
- Izadi, M.; Hosseini, S.V.; Alaviyoun, S.S.; Mirsalim, S.M. Experimental and numerical analysis of the piston cooling jet’s performance. In Proceedings of the ASME 2010 10th Biennial Conference on Engineering Systems Design and Analysis, Istanbul, Turkey, 12–14 July 2010; pp. 287–293. [Google Scholar] [CrossRef]
- SAE J1244. Oil Cooler Nomenclature and Glossary; SAE: Warrendale, PA, USA, 2008. [Google Scholar]
- SAE J1468. Application Testing of Oil-to-Air Oil Coolers for Heat Transfer Performance; SAE: Warrendale, PA, USA, 2006. [Google Scholar]
- SAE J2414. Application Testing of Oil-to-Water Oil Coolers for Heat Transfer Performance; SAE: Warrendale, PA, USA, 2005. [Google Scholar]
- Adams, M. New Developments in Oil/Coolant Heat Exchangers for Heavy Duty Engine and Transmission Applications; SAE: Warrendale, PA, USA, 1999. [Google Scholar] [CrossRef]
- Adams, M.; Banzhaf, M.; Weiss, E. First-Time Use of Aluminum for Engine Oil Coolers in Heavy Commercial Vehicles; SAE: Warrendale, PA, USA, 1999. [Google Scholar] [CrossRef]
- Alkidas, A. Effects of Operational Parameters on Structural Temperatures and Coolant Heat Rejection of a S.I. Engine; SAE: Warrendale, PA, USA, 1993. [Google Scholar] [CrossRef]
- Imaboppu, S.; Shimonosono, H.; Hirano, Y.; Fujigaya, K.; Inoue, K. Development of a Method for Predicting Heat Rejection to the Engine Coolant. SAE Tech. Pap. 1993, 931114. [Google Scholar] [CrossRef]
- Shayler, P.J.; Chick, J.P.; Ma, T. Effect of Coolant Mixture Composition on Engine Heat Rejection Rate. SAE Trans. 1996, 105, 268–277. [Google Scholar]
- Shayler, P.J.; Chick, J.P.; Ma, T. Correlation of Engine Heat Transfer for Heat Rejection and Warm-Up Modelling. SAE Trans. 1997, 106, 1998–2007. [Google Scholar]
- Porot, P.A.; Ménégazzi, P.; Ap, N.S. Understanding and Improving Evaporative Engine Cooling at High Load, High Speed by Engine Tests and 3D Calculations; SAE: Warrendale, PA, USA, 1997. [Google Scholar] [CrossRef]
- Koch, F.; Haubner, F. Cooling System Development and Optimization for DI Engines; SAE: Warrendale, PA, USA, 2000. [Google Scholar] [CrossRef]
- Campbell, N.A.F.; Hawley, J.G.; Robinson, K.; Leathard, M.J. A review of predictive analysis applied to IC engine coolant heat transfer. J. Inst. Energy 2000, 73, 78–86. [Google Scholar]
- Allen, D.J.; Lasecki, M.P. Thermal Management Evolution and Controlled Coolant Flow; SAE: Warrendale, PA, USA, 2001. [Google Scholar] [CrossRef]
- Brace, C.; Burnham-Slipper, H.; Wijetunge, R.; Vaughan, N.; Wright, K.; Blight, D. Integrated Cooling Systems for Passenger Vehicles; SAE: Warrendale, PA, USA, 2001. [Google Scholar] [CrossRef] [Green Version]
- Lehner, C.; Parker, G.; Arici, O.; Johnson, J. Design and Development of a Model-Based Feedback-Controlled Cooling System for Heavy Duty Diesel Truck Applications Using a Vehicle Engine Cooling System Simulation; SAE: Warrendale, PA, USA, 2001. [Google Scholar] [CrossRef]
- Robinson, K.; Hawley, J.G.; Hammond, G.P.; Owen, N.J. Convective coolant heat transfer in internal combustion engines. Proc. Inst. Mech. Eng. Part D J. Automob. Eng. 2003, 217, 133–146. [Google Scholar] [CrossRef]
- Pang, H.H.; Brace, C.J. Review of engine cooling technologies for modern engines. Proc. Inst. Mech. Eng. Part D 2004, 218, 1209–1215. [Google Scholar] [CrossRef]
- Chalgren, R.; Allen, D. Light Duty Diesel Advanced Thermal Management; SAE: Warrendale, PA, USA, 2005. [Google Scholar] [CrossRef]
- Luptowski, B.; Arici, O.; Johnson, J.; Parker, G. Development of the Enhanced Vehicle and Engine Cooling System Simulation and Application to Active Cooling Control; SAE: Warrendale, PA, USA, 2005. [Google Scholar] [CrossRef]
- Torregrosa, A.J.; Olmeda, P.; Martin, J.; Degraeuwe, B. Experiments on the influence of inlet charge and coolant temperature on performance and emissions of a DI Diesel engine. Exp. Therm. Fluid Sci. 2006, 30, 633–641. [Google Scholar] [CrossRef]
- Torregrosa, A.J.; Broatch, A.; Olmeda, P.; Romero, C. Assessment of the influence of different cooling system configurations on engine warm-up, emissions, and fuel consumption. Int. J. Automot. Technol. 2008, 9, 447–458. [Google Scholar] [CrossRef]
- Antonelli, M.; Martorano, L.; Simi, A.; Di Palma, S.; Carapellucci, C. A Numerical Procedure for the Evaluation of the Engine Head-Cylinder Group Cooling Effectiveness. In Proceedings of the ASME 2009 Heat Transfer Summer Conference Collocated with the InterPACK09 and 3rd Energy Sustainability Conferences, San Francisco, CA, USA, 19–23 July 2009; Volume 2: Theory and Fundamental Research; Aerospace Heat Transfer; Gas Turbine Heat Transfer; Computational Heat Transfer. pp. 723–734. [Google Scholar]
- Singh, O.; Garg, M.; Kumar, V.; Chaudhary, V. Effect of Cooling System Design on Engine Oil Temperature. J. Appl. Fluid Mech. 2013, 6, 61–71. [Google Scholar]
- Krakowski, R. Internal Combustion Engine Cooling System with Elevated Coolant Temperature Research on the Model Test Stand. J. KONES Powertrain Transport 2013, 20, 177–183. [Google Scholar] [CrossRef]
- Kneba, Z. Development trends of automotive engine cooling systems. Combust. Engines 2013, 3, 291–296. [Google Scholar]
- Ramadhas, A.S.; Xu, H. Influence of Coolant Temperature on Cold Start Performance of Diesel Passenger Car in Cold Environment; SAE: Warrendale, PA, USA, 2016. [Google Scholar] [CrossRef]
- Li, T.; Caton, J.A.; Jacobs, T.J. A Numerical Investigation on the Influence of Engine Coolant Temperature under Low Temperature Combustion in a Diesel Engine. Combust. Sci. Technol. 2017, 189, 1992–2011. [Google Scholar]
- Tauzia, X.; Maiboom, A.; Karaky, H.; Chesse, P. Experimental analysis of the influence of coolant and oil temperature on combustion and emissions in an automotive diesel engine. Int. J. Engine Res. 2019, 20, 247–260. [Google Scholar] [CrossRef]
- Rakesh, G.; Senthilkumar, S. Estimation of Heat Transfer Rate to Coolant from Combustion Chamber of Liquid Cooled IC Engine; SAE: Warrendale, PA, USA, 2020. [Google Scholar] [CrossRef]
- Raghavan, G. 1D Transient Simulation of Heavy-Duty Truck Cooling System—HDEP 16 DST, Euro 6. Master’s Thesis, Chalmers University of Technology, Göteborg, Sweden, 2012. [Google Scholar]
- Kluck, C.; Olsen, P.; Skriba, S. Lubrication System Design Considerations for Heavy-Duty Diesel Engines; SAE: Warrendale, PA, USA, 1986. [Google Scholar] [CrossRef]
- Liu, F. Analysis of BJ493 diesel engine lubrication system properties. IOP Conf. Ser. Mater. Sci. Eng. 2017, 283, 012005. [Google Scholar] [CrossRef] [Green Version]
- Clark, R.J.; Fajardo, C.M. Assessment of the Properties of Internal Combustion Engine Lubricants Using an Onboard Sensor. Tribol. Trans. 2012, 55, 458–465. [Google Scholar] [CrossRef]
- Qasim, M.; Ansari, T.M.; Hussain, M. Physico-chemical characteristics of Pakistani used engine oils. J. Pet. Technol. Altern. Fuels 2016, 7, 13–17. [Google Scholar]
- Besergil, B.; Ozer, M.; Eskici, M.; Atik, E. Study on lubricant quality and its effect on engine component performance. Ind. Lubr. Tribol. 2008, 60, 172–177. [Google Scholar] [CrossRef]
- Kim, K.; Si, W.; Jin, D.; Kim, J.-H.; Cho, J.; Baek, S.; Myung, C.-L.; Park, S. Characterization of engine oil additive packages on diesel particulate emissions. J. Mech. Sci. Technol. 2020, 34, 931–939. [Google Scholar] [CrossRef]
- Lim, Y.K.; Lee, J.E.; Na, Y.G.; Kim, J.R.; Ha, J.H. Change in Physical Properties of Engine oil Contaminated with Diesel. J. Korean Soc. Tribol. Lubr. Eng. 2017, 33, 45–51. [Google Scholar]
- Wolak, A.; Zajac, G.; Zolty, M. Changes of properties of engine oils diluted with diesel oil under real operating conditions. Combust. Engines 2018, 57, 34–40. [Google Scholar] [CrossRef]
- Green, D.A.; Lewis, R. The effects of soot-contaminated engine oil on wear and friction: A review. Proc. Inst. Mech. Eng. Part D J. Automob. Eng. 2008, 222, 1669–1689. [Google Scholar] [CrossRef]
- Willermet, P. Some engine oil additives and their effects on antiwear film formation. Tribol. Lett. 1998, 5, 41–47. [Google Scholar] [CrossRef]
- Wilkins, A.J.J. Engine Oils and Additives. Platinum Met. Rev. 2003, 47, 140. [Google Scholar]
- Nguele, R.; Al-Salim, H.S.; Mohammad, K. Modeling and Forecasting of Depletion of Additives in Car Engine Oils Using Attenuated Total Reflectance Fast Transform Infrared Spectroscopy. Lubricants 2014, 2, 206–222. [Google Scholar] [CrossRef] [Green Version]
- Herdan, J.M. Lubricating oil additives and the environment—An overview. Lubr. Sci. 1997, 9, 161–172. [Google Scholar] [CrossRef]
- Huynh, K.K.; Tieu, K.A.; Pham, S.T. Synergistic and Competitive Effects between Zinc Dialkyldithiophosphates and Modern Generation of Additives in Engine Oil. Lubricants 2021, 9, 35. [Google Scholar] [CrossRef]
- Amat, S.; Braham, Z.; Le Dreau, Y.; Kister, J.; Dupuy, N. Simulated aging of lubricant oils by chemometric treatment of infrared spectra: Potential antioxidant properties of sulfur structures. Talanta 2013, 107, 219–224. [Google Scholar] [CrossRef]
- Shahnazat, S.; Bagheri, S.; Hamid, S. Enhancing lubricant properties by nanoparticles additives. Int. J. Hydrog. Energy 2016, 1, 3153–3170. [Google Scholar] [CrossRef]
- Laad, M.; Jatti, V.K.S. Titanium oxide nanoparticles as additives in engine oil. J. King Saud Univ. Eng. Sci. 2018, 30, 116–122. [Google Scholar] [CrossRef] [Green Version]
- Demas, N.G.; Erck, R.A.; Lorenzo-Martin, C.; Ajayi, O.O.; Fenske, G.R. Experimental Evaluation of Oxide Nanoparticles as Friction and Wear Improvement Additives in Motor Oil. J. Nanomater. 2017, 2017. [Google Scholar] [CrossRef]
- Mohamed, K.A.A.; Hou, X.; Turkson, R.F.; Peng, Z.; Chen, X. Enhancing the thermophysical properties and tribologi-cal behaviour of engine oils using nano-lubricant additives. RSC Adv. 2016, 6, 77913–77924. [Google Scholar]
- Mousavi, S.B.; Heris, S.Z.; Estellé, P. Experimental comparison between ZnO and MoS2 nanoparticles as additives on performance of diesel oil-based nano lubricant. Sci. Rep. 2020, 10, 5813. [Google Scholar] [CrossRef] [PubMed]
- Mitan, N.M.M.; Ramlan, M.S.; Nawawi, M.Z.H.; Kindamas, Z. Preliminary study on effect of oil additives in engine lubricant on four-stroke motorcycle engine. Mater. Today Proc. 2018, 5, 21737–21743. [Google Scholar] [CrossRef]
- Xin, Q. (Ed.) 10—Friction and lubrication in diesel engine system design. In Diesel Engine System Design; Woodhead Publishing: Sawston, UK, 2013; pp. 651–758. [Google Scholar]
- Wittebrood, A.; Bürger, A.; Kirkham, S. Flux free brazing of aluminium heat exchangers. In Vehicle Thermal Management Systems Conference and Exhibition (VTMS10); Woodhead Publishing: Sawston, UK, 2011; pp. 35–43. [Google Scholar]
- Palmgren, J.; Wallborg, M.H. Improving Engine Oil Cooler Performance—For Future Vehicle Applications; Uppsala University: Uppsala, Sweden, 2015. [Google Scholar]
- Sarma, P.K.; Krishna, D.R.; Ramanarayanan, C.P.; DharmaRao, V.; Srinivas, V. Analysis of engine oil cooler of an unmanned aeroengine at various altitudes. Int. J. Heat Technol. 2012, 30, 45–50. [Google Scholar]
- Di Battista, D.; Cipollone, R. Improving Engine Oil Warm-Up through Waste Heat Recovery. Energies 2018, 11, 10. [Google Scholar] [CrossRef] [Green Version]
- Rajpoot, A.S.; Sahu, H.S.; Saxena, N.V.; Kumar, P.; Pagariya, V. Optimization of Finned Tube Oil Cooler by Effective Utilization of Area within the Space Available. Int. J. Sci. Technol. Eng. 2017, 3, 23–30. [Google Scholar]
- Azadi, M.; Azadi, M. Corrosion Failure Study in an Oil Cooler Heat Exchanger in Marine Diesel Engine. Int. J. Eng. 2016, 29, 1604–1611. [Google Scholar]
- Oil Specification—All Models. Available online: https://www.fordwiki.co.uk/index.php/Oil_Specification_-_All_Models (accessed on 19 June 2021).
- Engine Oil for FORD MONDEO. Available online: https://www.autodoc.co.uk/car-parts/engine-oil-12094/ford/mondeo/ (accessed on 19 June 2021).
- Elf Evolution 900 SXR 5w30 Engine Oil. Available online: https://www.finol.ie/wp-content/uploads/2017/04/ELF_EVOLUTION_900_SXR_5w30_Engine_Oil.pdf (accessed on 19 June 2021).
- Engineering ToolBox. Density of Lubricating Oil as Function of Temperature. 2017. Available online: https://www.engineeringtoolbox.com/temperature-density-petroleum-lubricating-oil-lubricant-volume-correction-ASTM-D1250-d_1943.html (accessed on 19 June 2021).
- Reid, R.C.; Prausnitz, J.M.; Poling, B.E. The Properties of Gases and Liquids; McGraw-Hill: New York, NY, USA, 1987. [Google Scholar]
- Antifreeze for FORD MONDEO. Available online: https://www.autodoc.co.uk/car-parts/antifreeze-12305/ford/mondeo (accessed on 19 June 2021).
- Ethylene Glycol Heat-Transfer Fluid. Available online: https://www.engineeringtoolbox.com/ethylene-glycol-d_146.html (accessed on 19 June 2021).
- Kudela, H. Hydraulic losses in pipes. Available online: https://docplayer.net/21248931-Hydraulic-losses-in-pipes.html (accessed on 19 June 2021).
Publisher’s Note: MDPI stays neutral with regard to jurisdictional claims in published maps and institutional affiliations. |
© 2021 by the authors. Licensee MDPI, Basel, Switzerland. This article is an open access article distributed under the terms and conditions of the Creative Commons Attribution (CC BY) license (https://creativecommons.org/licenses/by/4.0/).