


Abstract
High-speed turning of AISI 304 stainless steel is limited by rapid tool wear driven by thermal accumulation and tribological instability. This study compares five cooling/lubrication strategies (dry, flood cooling, MQL, internally cooled tools—ICT, and ICT + MQL) under a fixed severe cutting regime (Vc = 400 m/min, f = 0.1 mm/rev, ap = 0.2 mm) and develops a low-complexity tool end-of-life predictor using cutting power as the sole monitoring signal. Dry machining produced the highest cutting forces 26.7 N), whereas lubricated/cooled conditions showed statistically similar force levels (≈11 6 – 118 N). Cutting force and derived power increased monotonically with wear, supporting power as an indirect tool-state indicator. A binary XGBoost classifier trained on statistical and trend descriptors of one-second power windows achieved accuracies of 96.5% (training), 95.9% (test), and 93.3% (validation) with AUC–ROC values of 0.988, 0.993, and 0.959, respectively, despite moderate class imbalance (≈85 % healthy/15% worn). SHAP analysis identified average power and distributional descriptors (skewness and amplitude ratios) as dominant predictors, providing interpretable links between signal statistics and wear progression. The results demonstrate that reliable end-of-life detection can be achieved using a single energetic signal across heterogeneous cooling environments, supporting scalable monitoring compatible with low-fluid and closed-loop cooling strategies.
1. Introduction
High-speed turning of austenitic stainless steels remains a persistent challenge in production machining due to the coupled effects of low thermal diffusivity [1], strong strain hardening [2], and pronounced adhesion at the tool–chip interface [3]. These characteristics promote localized heat accumulation in the primary and secondary shear zones, accelerate tribological instability (e.g., built-up edge formation), and intensify diffusionand oxidation-assisted wear mechanisms in cemented-carbide tools [4,5,6]. As a result, tool life can degrade rapidly, limiting achievable productivity and compromising dimensional accuracy and surface integrity, particularly when cutting speeds are increased to meet industrial throughput requirements.
Cooling and lubrication strategies are, therefore, central to improving process stability and tool utilization in stainless-steel turning. Conventional flood cooling can reduce bulk temperatures, but its effectiveness diminishes at higher cutting speeds because coolant penetration into the tool–chip interface becomes restricted by vapor barriers [7,8] and hydrodynamic shielding [9]. In addition to the practical limitations, flood cooling increases fluid consumption and generates waste streams that raise health, environmental, and disposal burdens [10]. Minimum quantity lubrication (MQL) has emerged as a more sustainable alternative by drastically reducing fluid use while improving lubrication through the formation of a thin tribological film; however, its convective heat-removal capacity is limited, which can be insufficient for severe thermal loads at the cutting edge during high-speed cutting of austenitic grades [11,12,13].
Internally cooled tools has recently gained attention as a promising route to localized thermal management. Unlike external coolant delivery, ICT circulates a coolant through internal channels positioned close to the cutting edge, enabling continuous heat extraction from the tool body in a closed-loop system without dispersing fluid into the machining environment. Prior investigations combining numerical and experimental approaches have reported substantial reductions in peak tool temperature and flank-wear rate, indicating that internal cooling can mitigate temperature-driven wear processes and potentially expand the feasible cutting-speed envelope [9,14,15]. These advantages are particularly relevant for austenitic stainless steels, where thermal accumulation and adhesive–diffusive interactions dominate tool degradation at elevated speeds.
While improvements in thermal management can extend tool life, the economic benefit depends strongly on when the tool is actually replaced. Premature tool changes increase tooling cost and machine downtime, whereas delayed replacement risks catastrophic wear, scrap generation, and unplanned stoppages. This motivates the development of reliable tool-condition monitoring (TCM) and end-of-life prediction frameworks that can operate in real time and remain robust across distinct cooling environments. Because tool wear evolves through nonlinear transitions, often shifting from relatively steady adhesion-dominated wear to accelerated diffusion/oxidation stages, purely deterministic or threshold-based strategies frequently fail to provide consistent warning margins across different operating contexts. Data-driven methods, supported by measurable process signals, are therefore increasingly used to infer tool condition and predict end-of-life.
Among the available monitoring signals (forces, vibrations, acoustic emission, spindle current, and power), cutting power offers a compelling balance between information content and deployability. Power integrates mechanical load and frictional dissipation into a single energetic descriptor, and it can often be obtained non-intrusively from machine-tool controllers or embedded sensors, reducing hardware complexity compared with multi-sensor systems. Moreover, as tool wear progresses, edge rounding and flank wear increase contact area and friction, which in turn drives systematic changes in force and power signatures, making power-based features physically meaningful proxies for wear progression. This creates a practical pathway to scalable monitoring solutions, particularly when combined with feature engineering that captures not only mean power but also distributional shape and temporal variability associated with instabilities during wear evolution [16].
Machine learning (ML) approaches have become central to modern TCM because they can model nonlinearity and interactions that are difficult to represent analytically. Gradient-boosting methods, especially Extreme Gradient Boosting (XGBoost), have demonstrated strong performance on machining datasets while offering fast training and native interpretability via feature importance measures [17,18,19,20]. In industrial settings, interpretability is not merely desirable: transparent decision logic supports operator trust, facilitates debugging of false alarms, and strengthens the case for deployment in production lines where process interruptions are expensive. Explainable AI tools, such as Shapley Additive Explanations (SHAP), further enhance transparency by quantifying the direction and magnitude of feature contributions to individual predictions [21,22].
Despite this progress, two gaps remain that directly motivate the present work. First, most ICT studies emphasize thermal fields, wear volumes, or macroscopic tool-life gains, while providing limited insight into how internal cooling alters the statistical structure of energetic monitoring signals that would be used in real-time prognostics [23,24,25]. Second, many ML-based monitoring solutions rely on multi-sensor architectures (e.g., force + vibration + acoustic emission), which increase cost, data-synchronization requirements, and maintenance overhead—factors that can hinder industrial adoption [26]. Single-sensor approaches based on energetic signals are attractive, but they are rarely validated across distinctly different thermal management strategies (dry, flood, MQL, ICT, and hybrid approaches), where the signal distribution can shift due to changes in friction, heat removal, and chip–tool interaction [27,28].
Accordingly, a systematic high-speed turning campaign on AISI 304 stainless steel is conducted under five machining atmospheres: dry, flood cooling, MQL, ICT, and hybrid ICT+MQL. Process forces are measured and used to derive cutting power, which is subsequently treated as the sole monitoring signal for a binary end-of-life classification task. An XGBoost classifier is trained using power-derived statistical and trend descriptors, and model decisions are interpreted using feature relevance and SHAP analysis to link predictive features with plausible wear mechanisms and process instabilities.
2. Methodology
2.1. Internally Cooled Tooling System—ICT
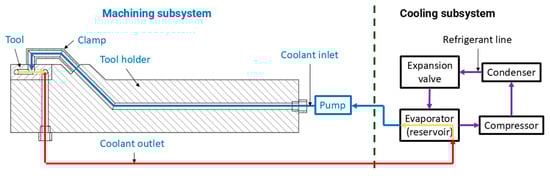
Internally Cooled Tools utilize a cooling system to cool their structure through the circulation of secondary fluid that flows through the internal channels of the insert and the tool holder. This fluid circulates in a closed circuit, without dispersion to the atmosphere.
The basic operation of the ICTs system is relatively simple. For better understanding, the system has been divided into two subsystems, as illustrated in Figure 1, consisting of the Primary Heat Exchanger (PHE) and the Secondary Heat Exchanger (SHE). The SHE corresponds to the machining system, located to the left of the dashed line and highlighted in green in the figure, while the PHE is the unit responsible for cooling the fluid and is located on the right. The interface between these two subsystems occurs in the fluid reservoir, where the thermal exchange of the secondary fluid to the primary fluid takes place.
Figure 1.
PHE and SHE Subsystems.
2.1.1. Primary Heat Exchanger (PHE)
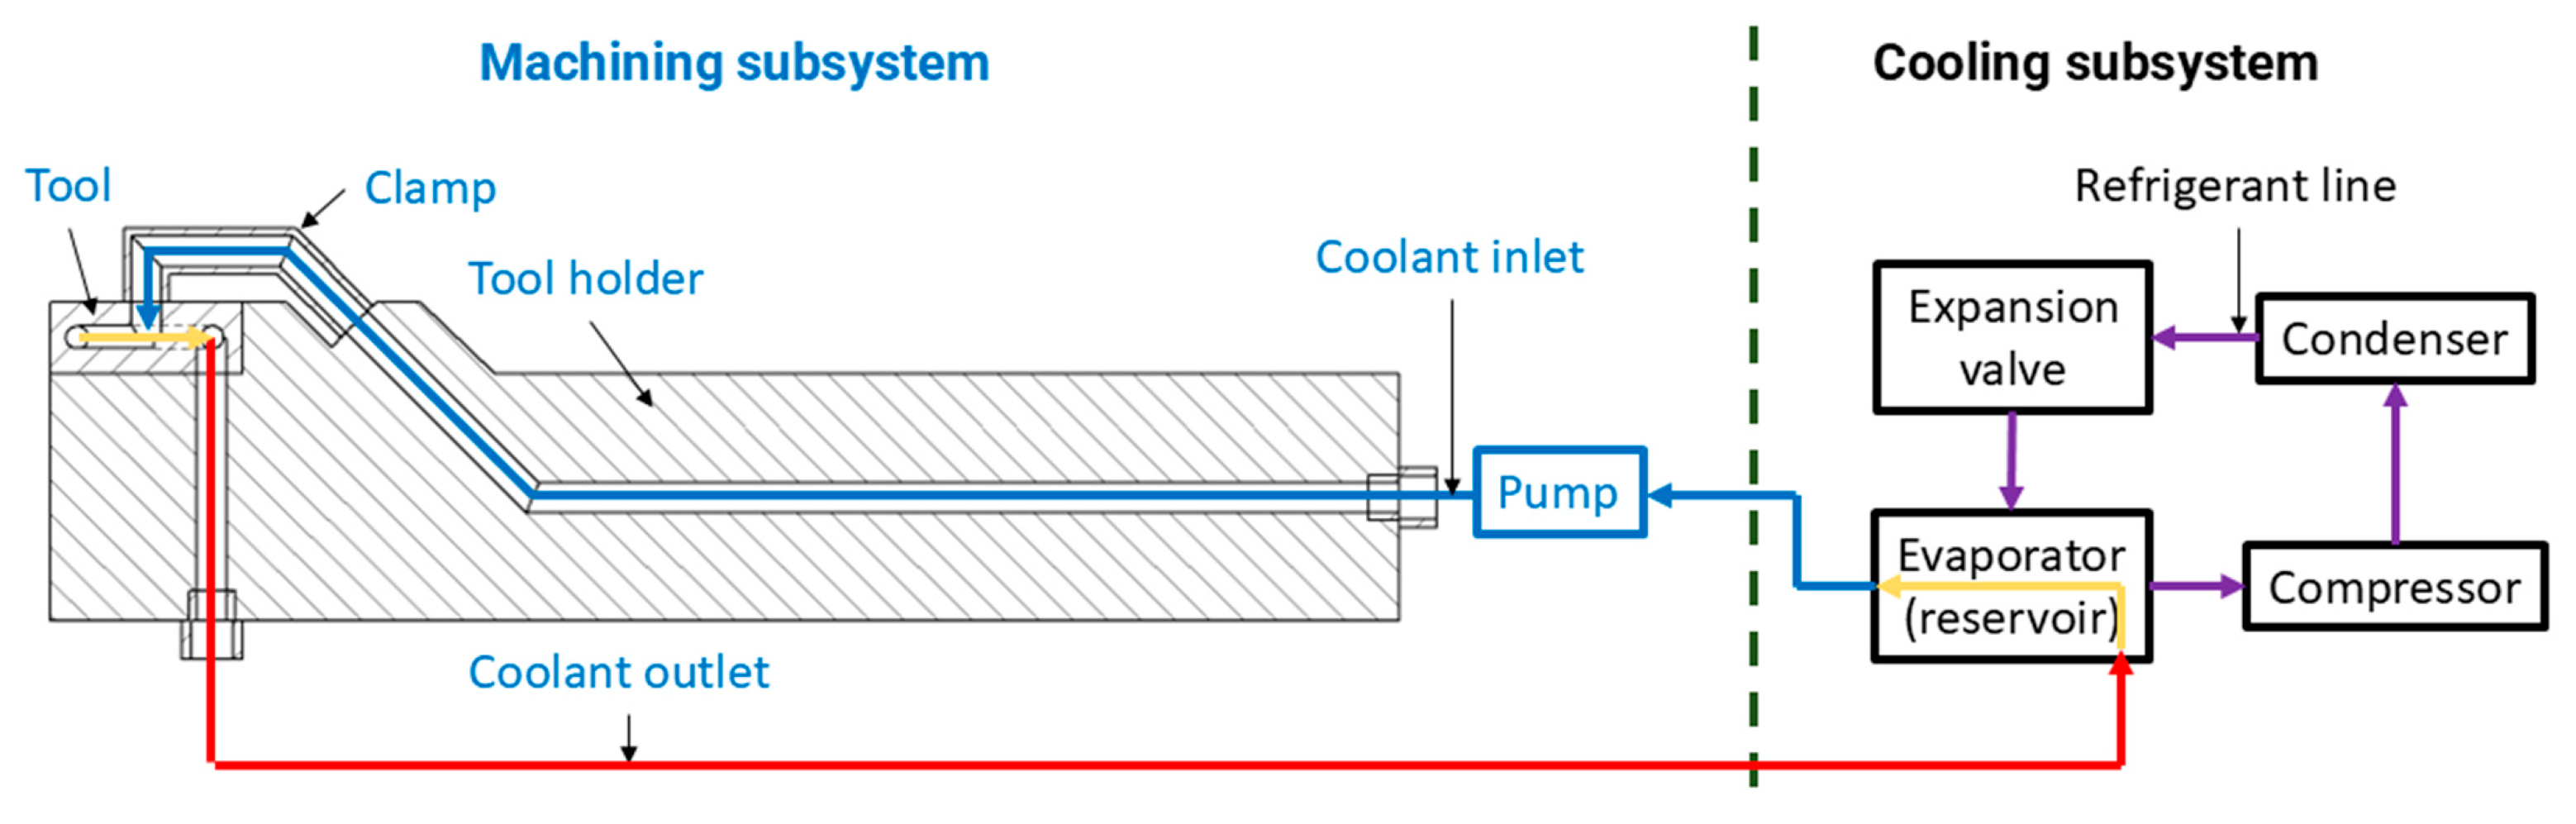
The PHE acts as a cooling system for the fluid that goes to the SHE. Figure 2 shows the computer-aided design (CAD) of the PHE. It consists of a vertical freezer, model 04180CBC201 from the brand Prosdócimo (São Paulo, Brazil). This freezer was adapted to reduce the temperature of the circulating fluid in the ICT. The main modification occurred in the evaporator unit, where a spiral coil was embedded inside a fluid reservoir with an approximate capacity of 20 L. In this way, heat exchange occurs through the transfer of heat from the secondary fluid to the primary fluid.
Figure 2.
Schematic diagram of the PHE.
In this study, the fluid used in the SHE was a solution composed of 90% water and 10% monoethylene glycol. This choice was due to water’s excellent heat exchange capacity, combined with its sustainability. The addition of 10% monoethylene glycol aims to prevent possible oxidation in the system.
To pump the fluid from the reservoir into the SHE, a diaphragm pump, model P142-30 from Propumps (São Paulo, Brazil), was used, with a maximum pressure of 0.7 MPa and a maximum flow rate of 3 L/min, with a power of 30 W. This pump was powered by a universal power supply from Nativa (China)®, with an adjustable voltage from 12 to 24 V. In all experiments, a voltage of 12 V was used.
To measure the water temperature in the reservoir, a digital thermometer, model TA21 from TSSHOP (China), was installed near the pump discharge, with a nominal range of −50 °C to 110 °C, a resolution of 0.1 °C, and an accuracy of ± 1 °C.
2.1.2. Secondary Heat Exchanger (SHE)
The Secondary Heat Exchanger (SHE) corresponds to the machining subsystem and is composed of the cutting insert and the tool holder, both incorporating internal cooling channels, as illustrated in Figure 3. The coolant was supplied to the tool holder through a 6 mm diameter polyvinyl chloride (PVC) hose.
Figure 3.
SHE assembly (cutting insert and tool holder).
Upon entering the internal channels of the tool holder, the coolant flows toward the clamping system, subsequently reaching the insert, and finally returns to the fluid reservoir, thereby completing a closed-loop circulation cycle. This configuration enables continuous heat removal from the cutting zone without direct dispersion of fluid into the machining environment.
2.1.3. Tool Holder and Modified Insert
The modified tools used in this work are SNMG code 120408EN-M34 CTPX710, Ceratizit (Brazil) and coated with AlCrN by Oerlikon Balzers (Jundiai, Brazil). Details of the geometry of the original and adapted inserts are presented in Table 1.
Table 1.
Cemented carbide tools specifications [29].
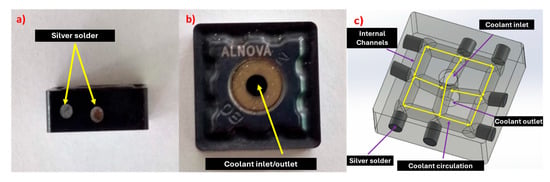
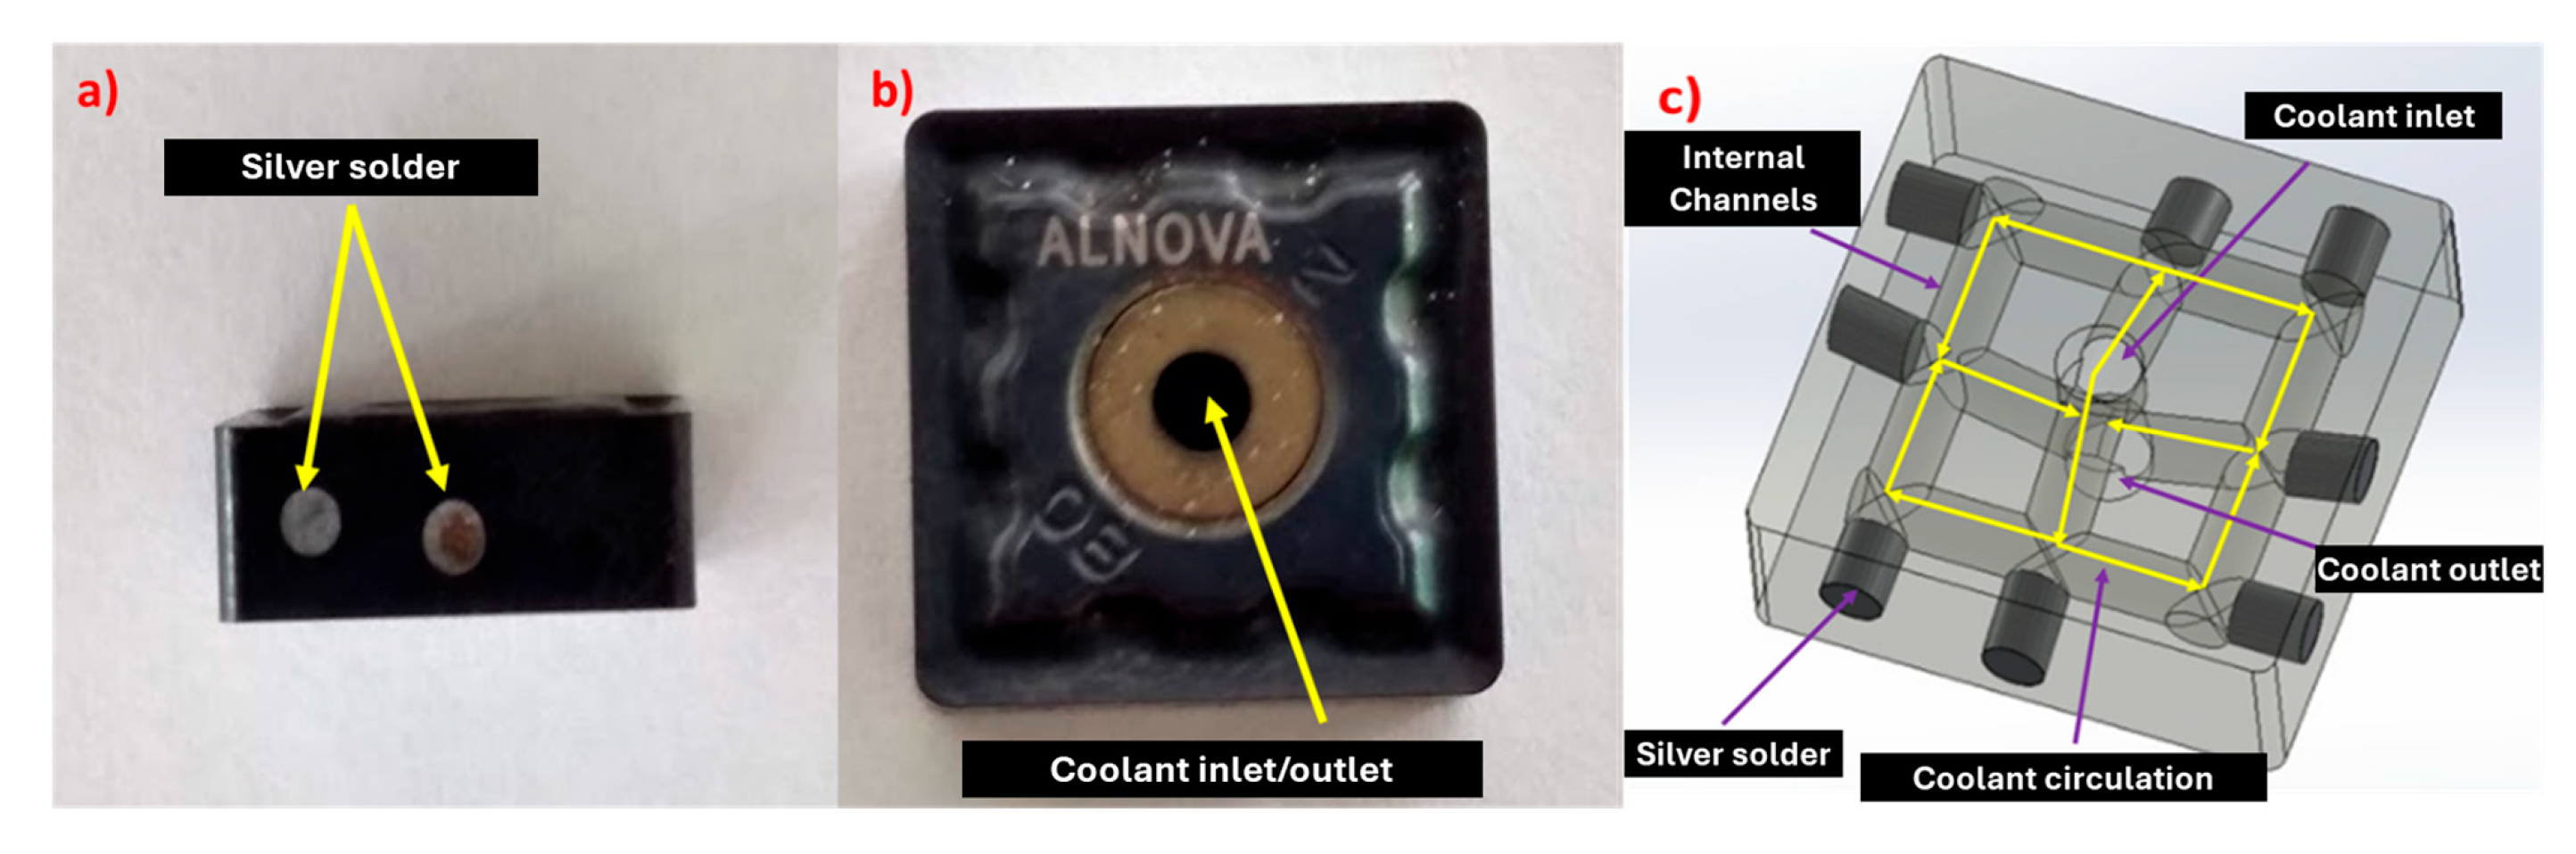
The internal cooling channels were manufactured by the company Mapal do Brasil (Ibirité, Brazil) through the process of electro-erosion by rotating wire. Figure 4a,b depict these modified tools, and Figure 4c presents a schematic that represents the entire path that the coolant takes in the inner region of the inserts.
Figure 4.
(a) Channels capped by silver solder; (b) Coolant inlet/outlet; (c) Schematic design of the tools with internal coolant channels.
The fluid inlet occurs on the upper face, through the central hole connected to the clamp, identified as “Fluid Inlet” (in purple). Internally, the flow of fluid in the tool channels follows the direction indicated by the yellow arrows, exiting through the hole located on the opposite face, marked “Fluid Outlet”.
It is worth noting that this configuration of the internal grooves is symmetrical, which means that both the input and output holes can play the same role, depending on the position in which the insert is fitted to the tool holder.
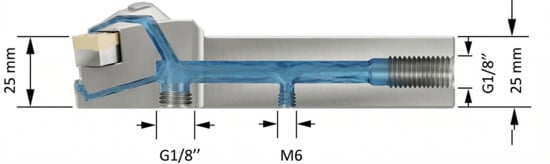
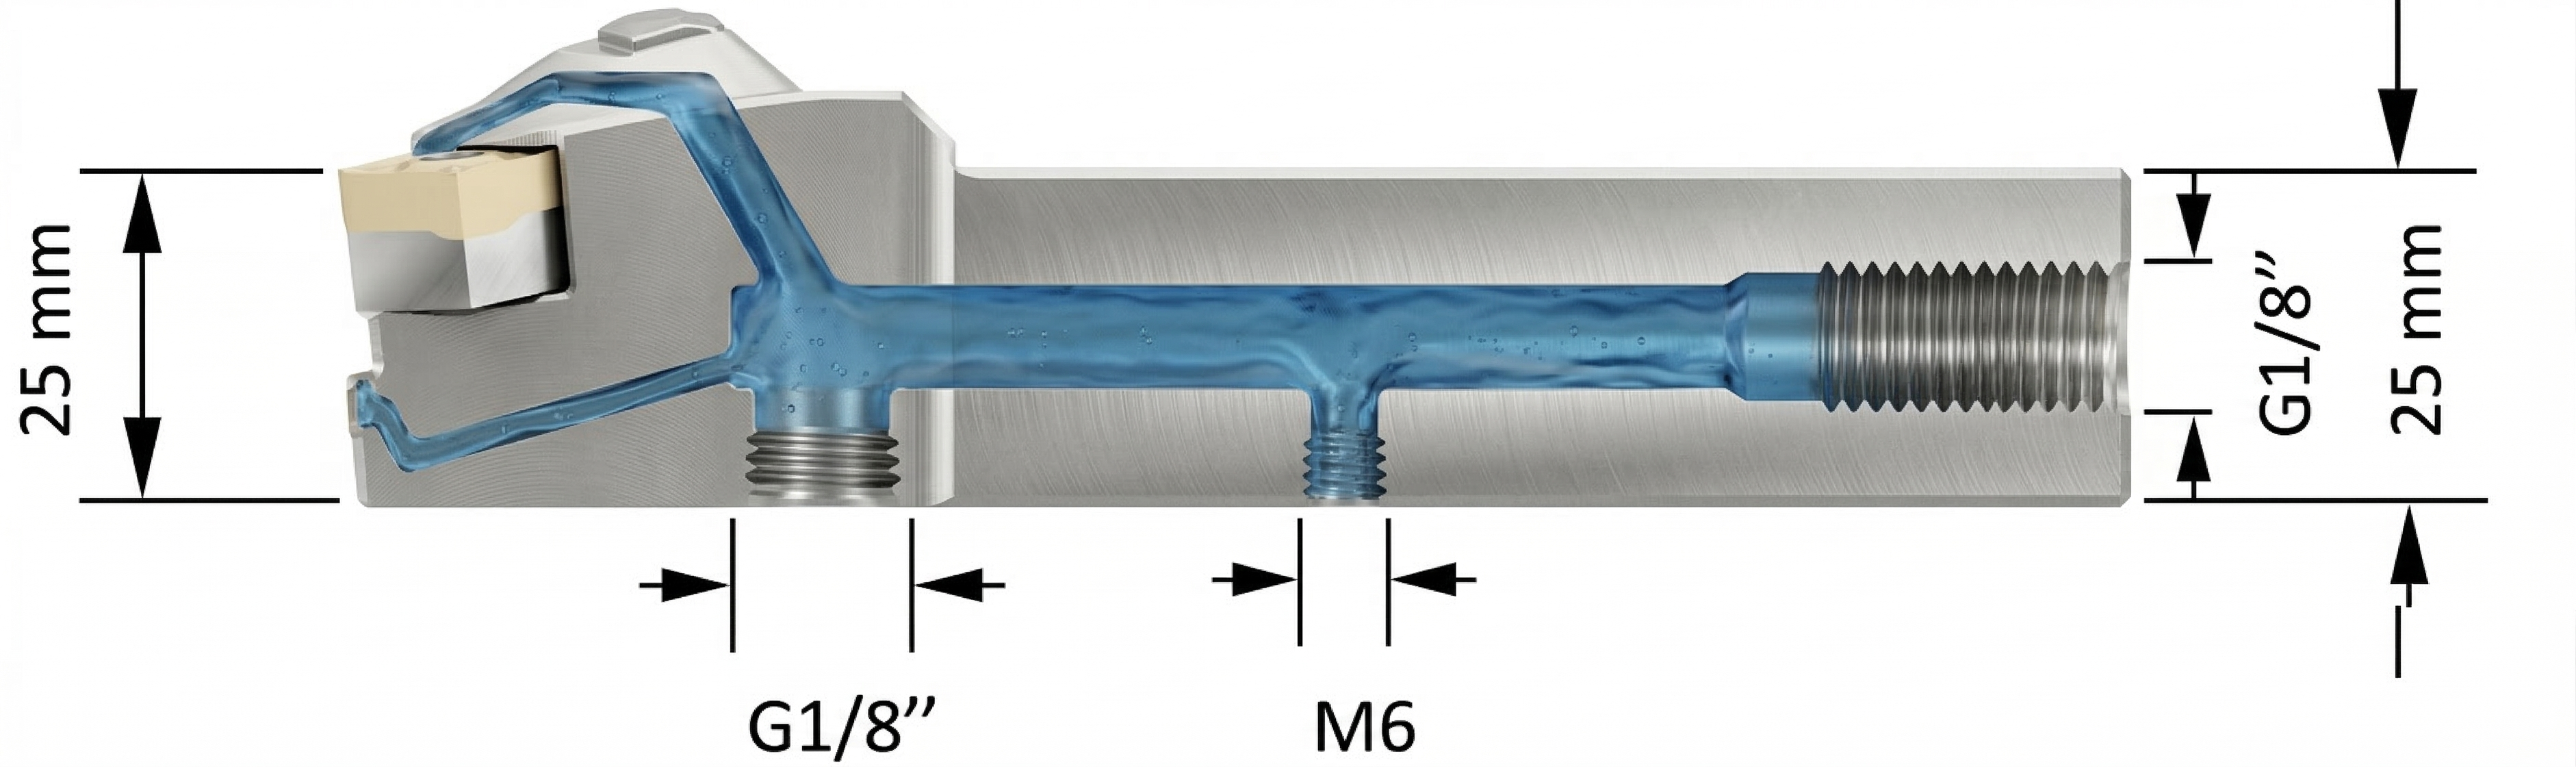
The tool holder used to carry out the tests was manufactured by Walter Tools (Brazil), model DSSNL2525 × 12-P. This tool holder already had internal cooling channels, but during the realization of the project, this support underwent changes in its structure. Originally, it had a fluid channel directed to the tool exit surface and another channel directed to the clearance surface, as illustrated in Figure 5, where the blue parts represent the internal channels in the tool holder.
Figure 5.
Original internal tool holder channels.
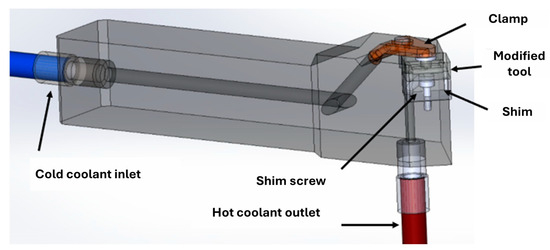
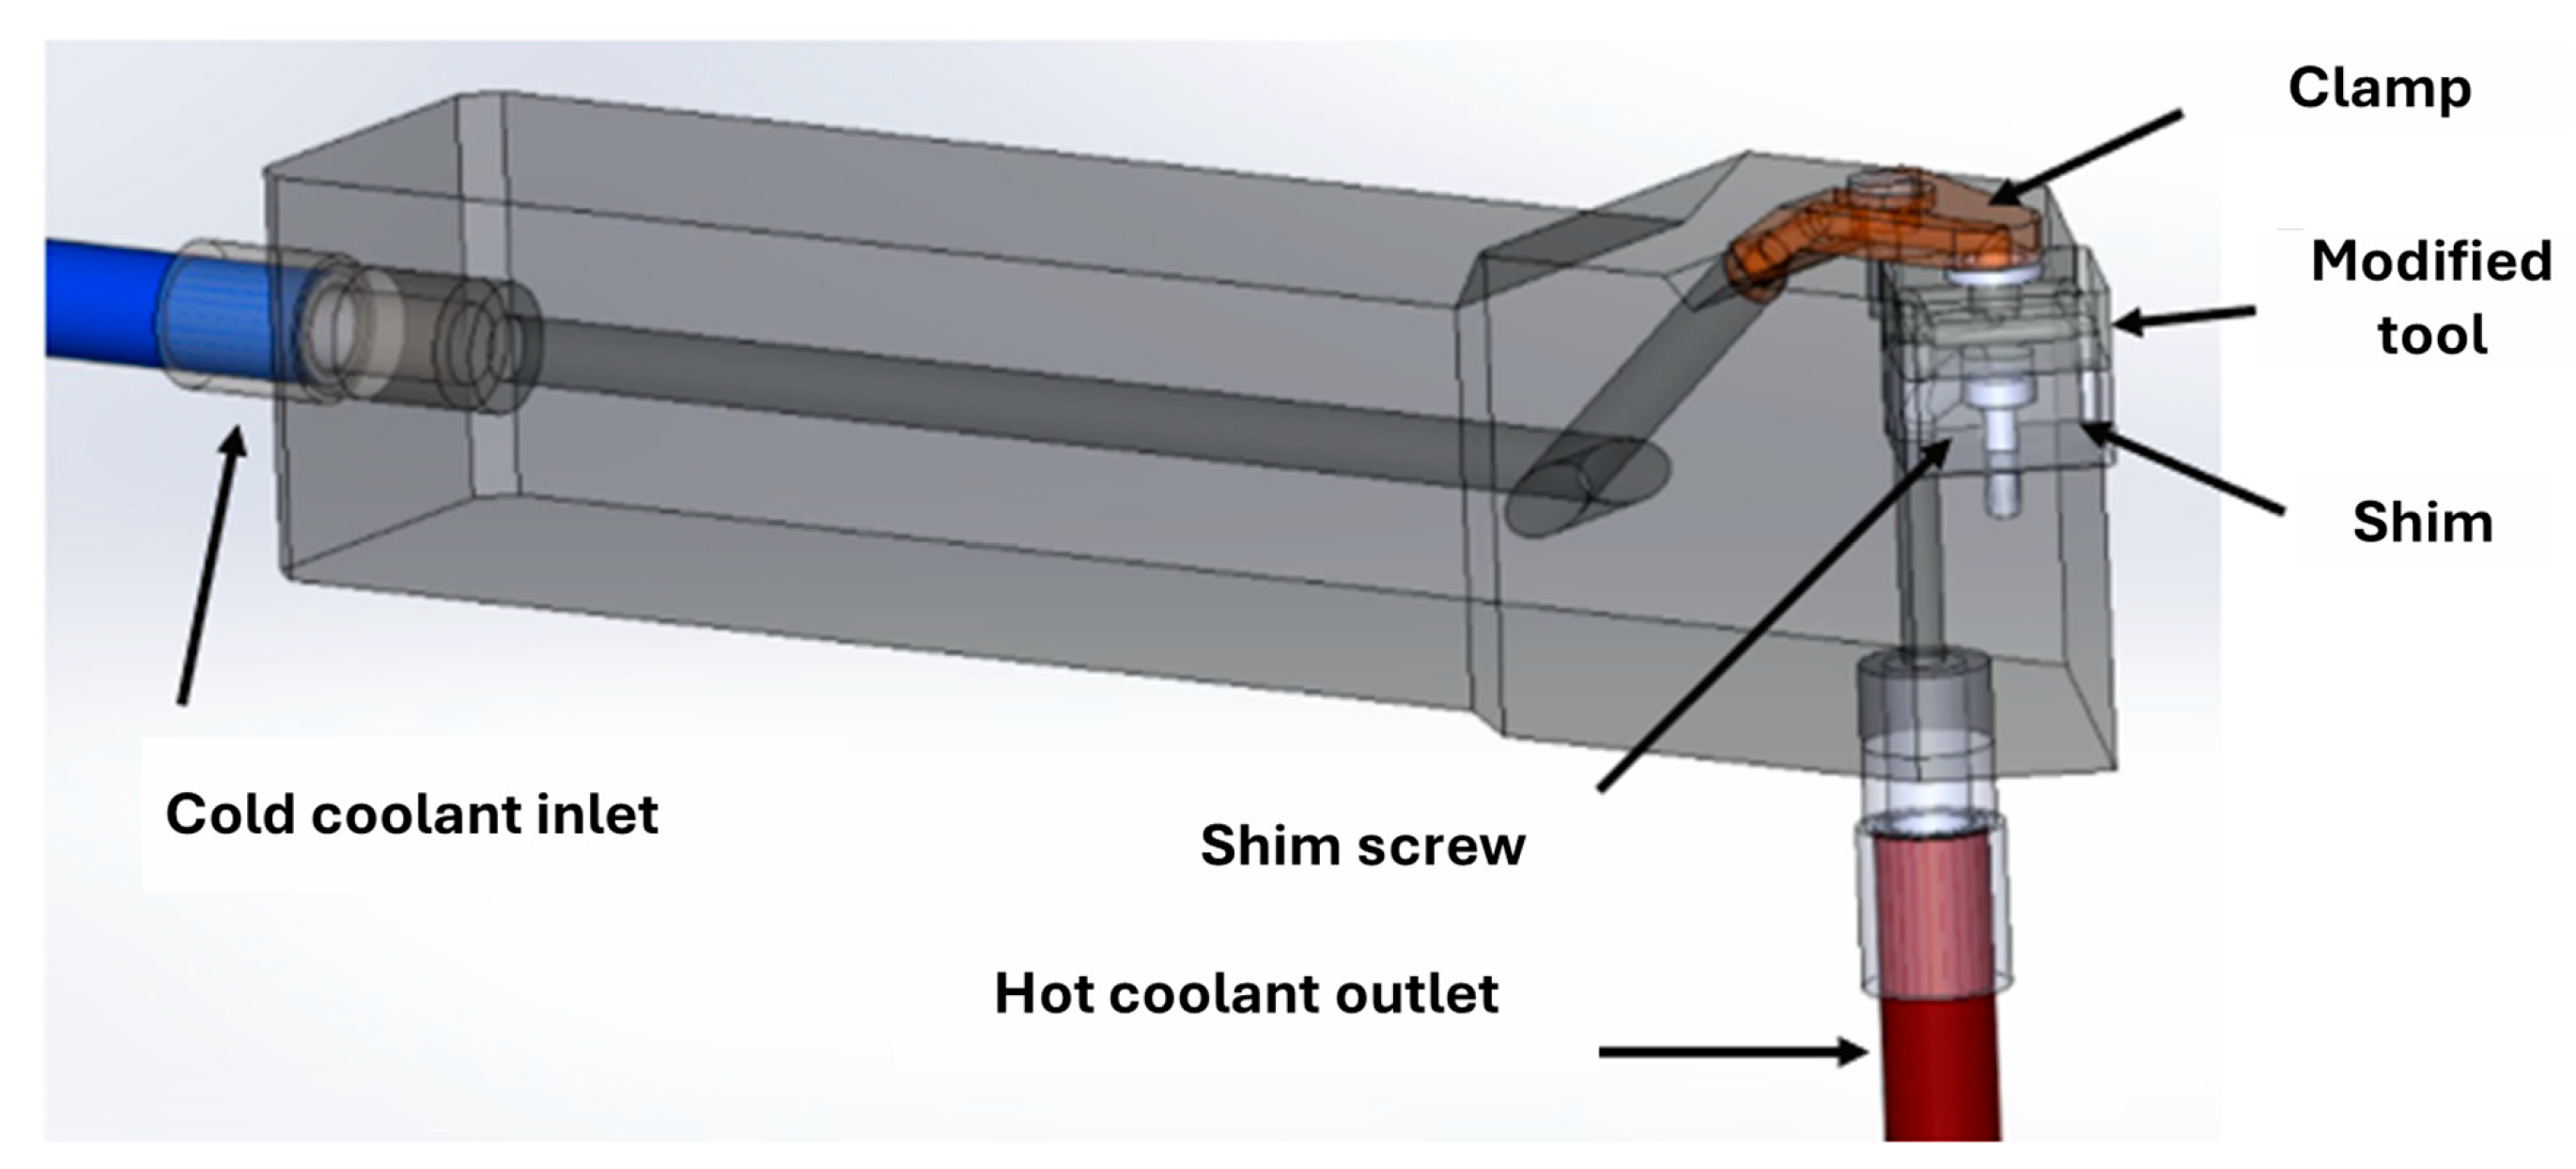
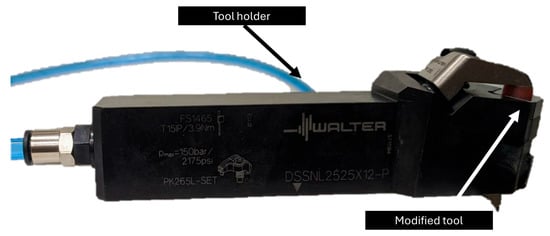
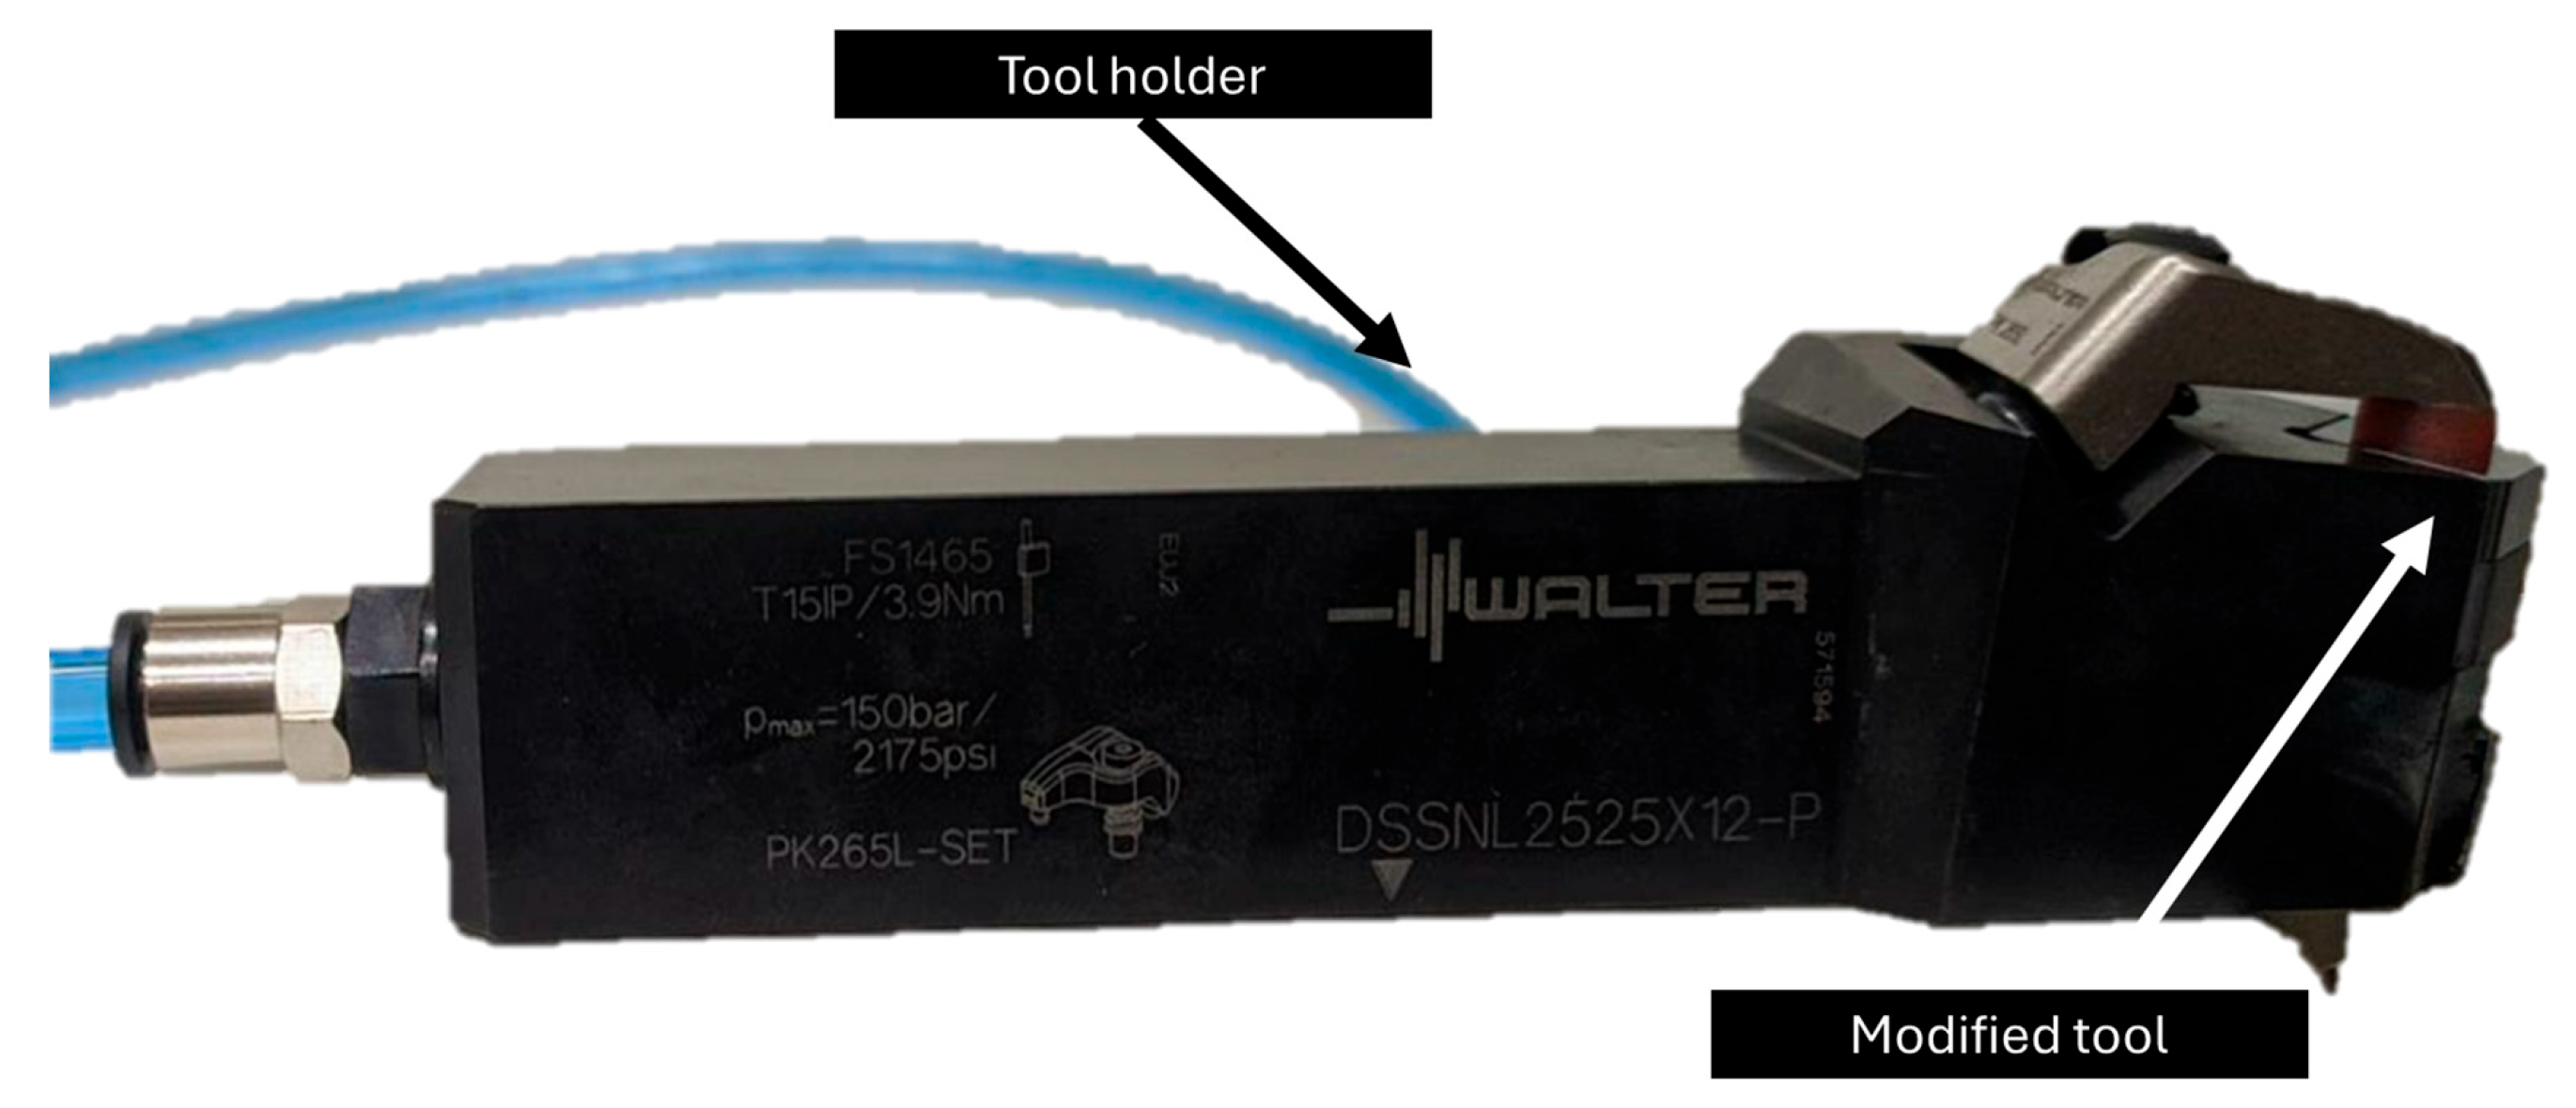
In the tool holder, the left channel of the lower face was capped, and the clamp was changed so that the fluid entered through the upper face of the tool. Figure 6 shows the path of the fluid, which enters the tool holder (blue hose) and travels through the internal channels of its structure, passing through the clamping clamp, then through the upper part of the tool and exiting through the lower region (red hose). Figure 6 illustrates the modified tool holder assembly attached to an insert.
Figure 6.
Tool holder and insert assembly after modifications.
2.2. Materials, Equipment and Methods
2.2.1. Material Used and Characterization
All machining tests were conducted on AISI 304 austenitic stainless-steel bars with an initial diameter of 90 mm and a length of 520 mm. The nominal chemical composition of the material is presented in Table 2, confirming its conformity with the standard composition range for AISI 304 stainless steel.
Table 2.
Chemical Composition (% by mass) of Austenitic Stainless Steel 304.
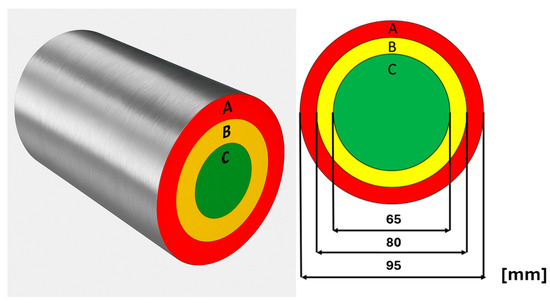
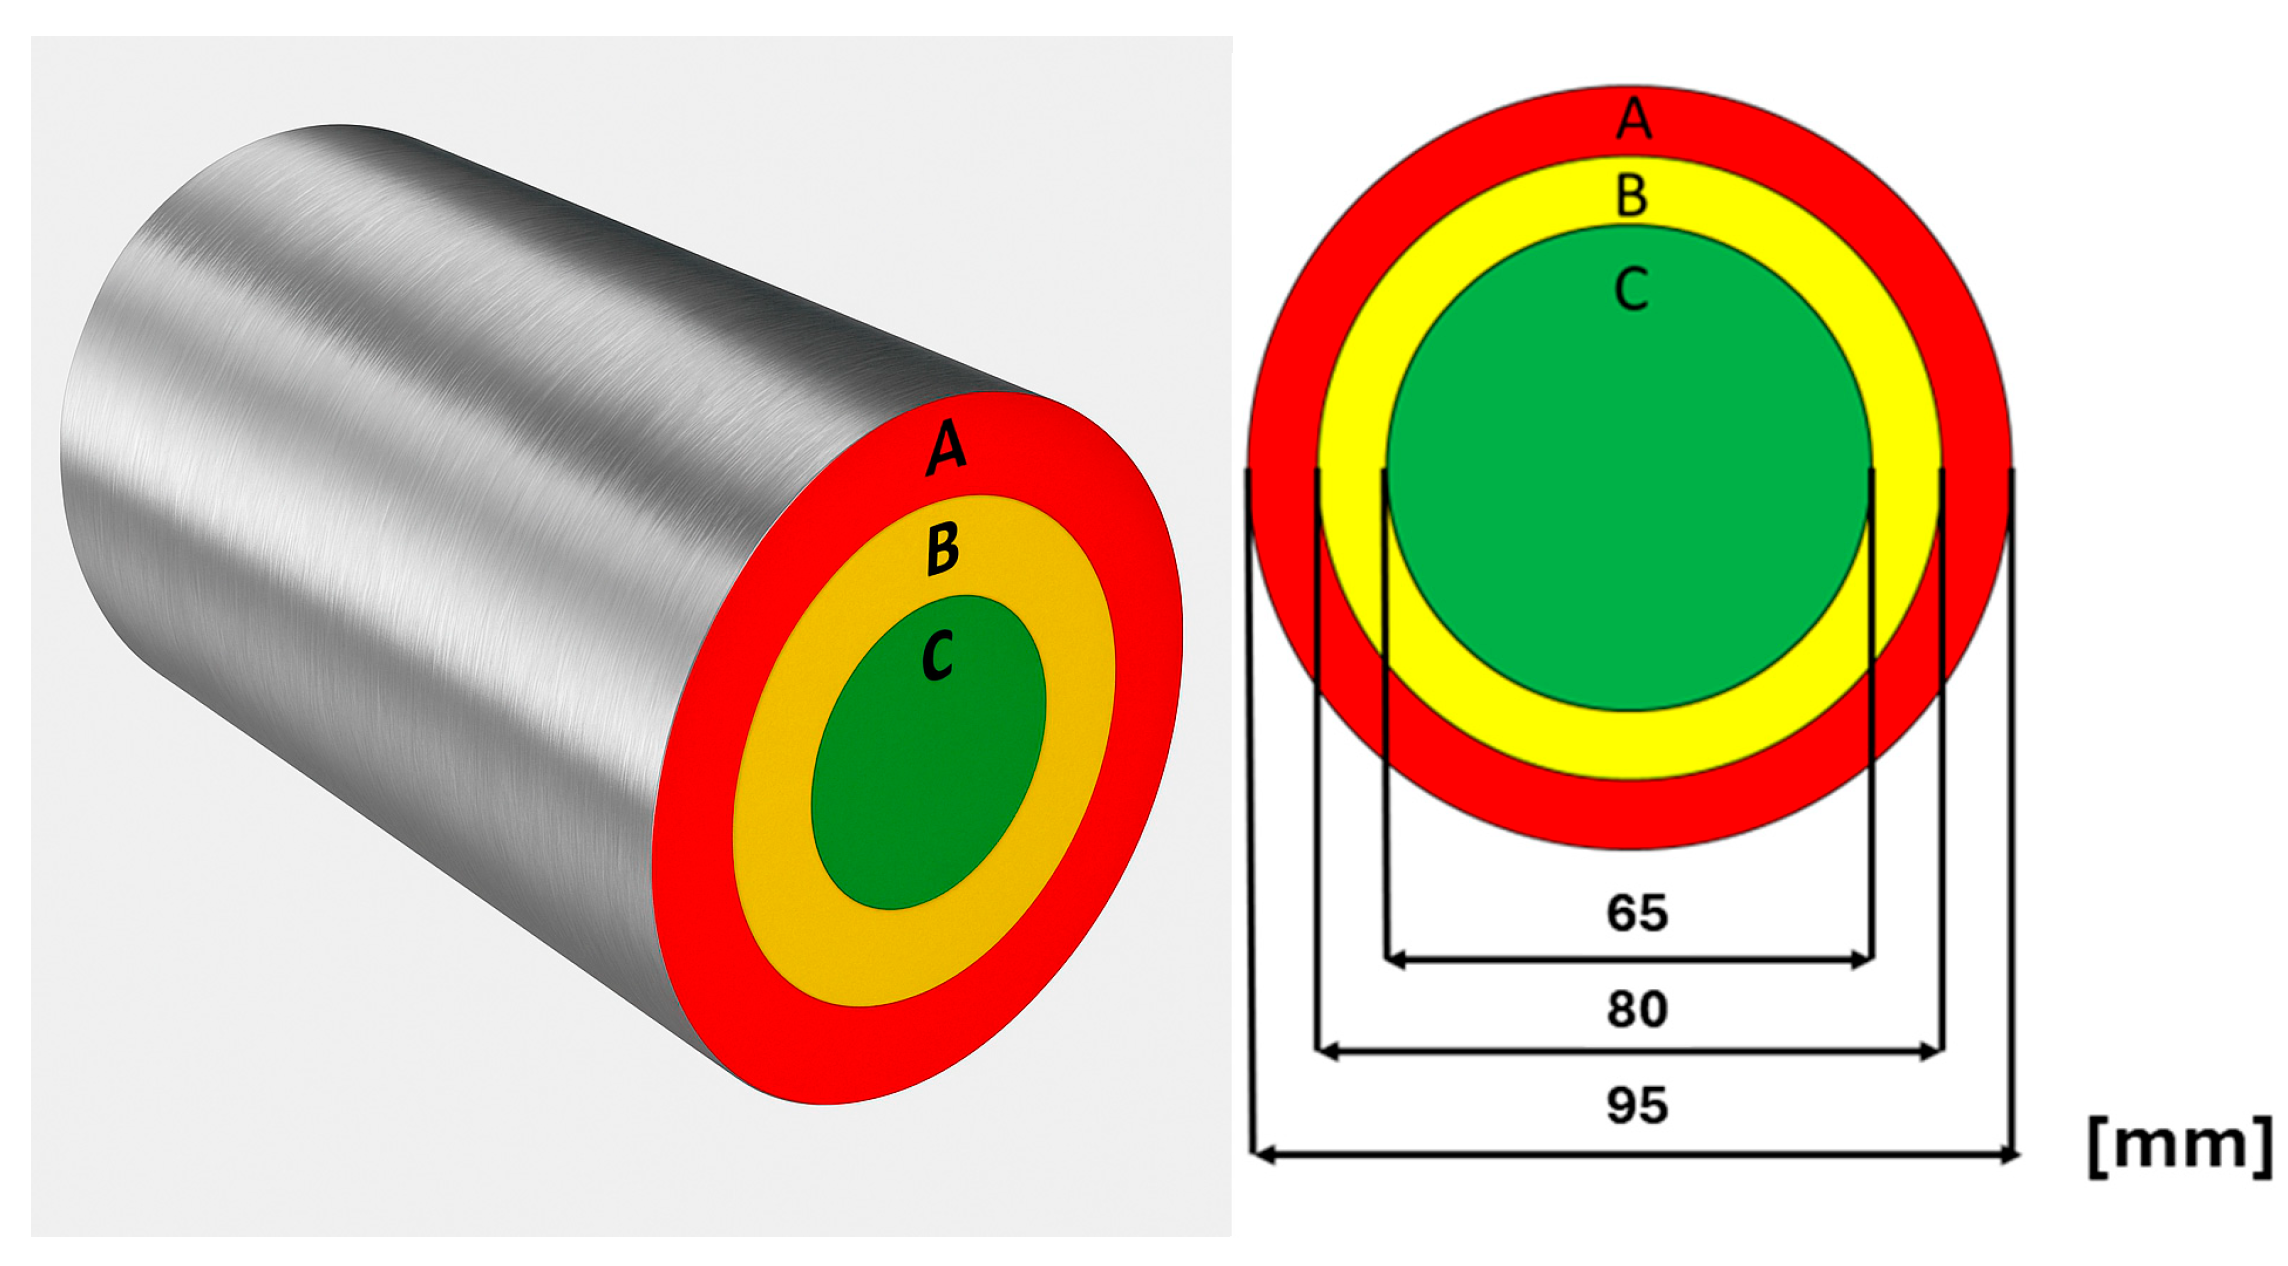
Since turning performance may be influenced by radial hardness gradients caused by manufacturing and thermomechanical history, the bars were preliminarily characterized to quantify possible hardness variations across the cross-section. Hardness measurements were performed in three radial regions: peripheral (Region A), intermediate (Region B), and central (Region C), as illustrated in Figure 7.
Figure 7.
Separation of hardness measurement regions.
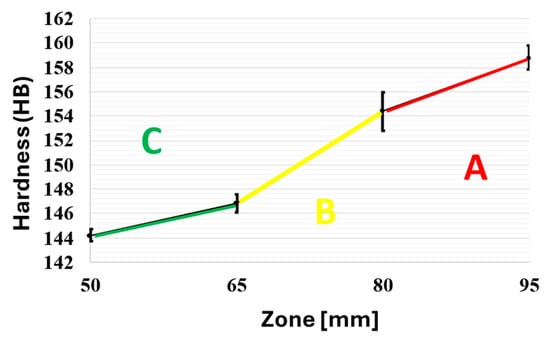
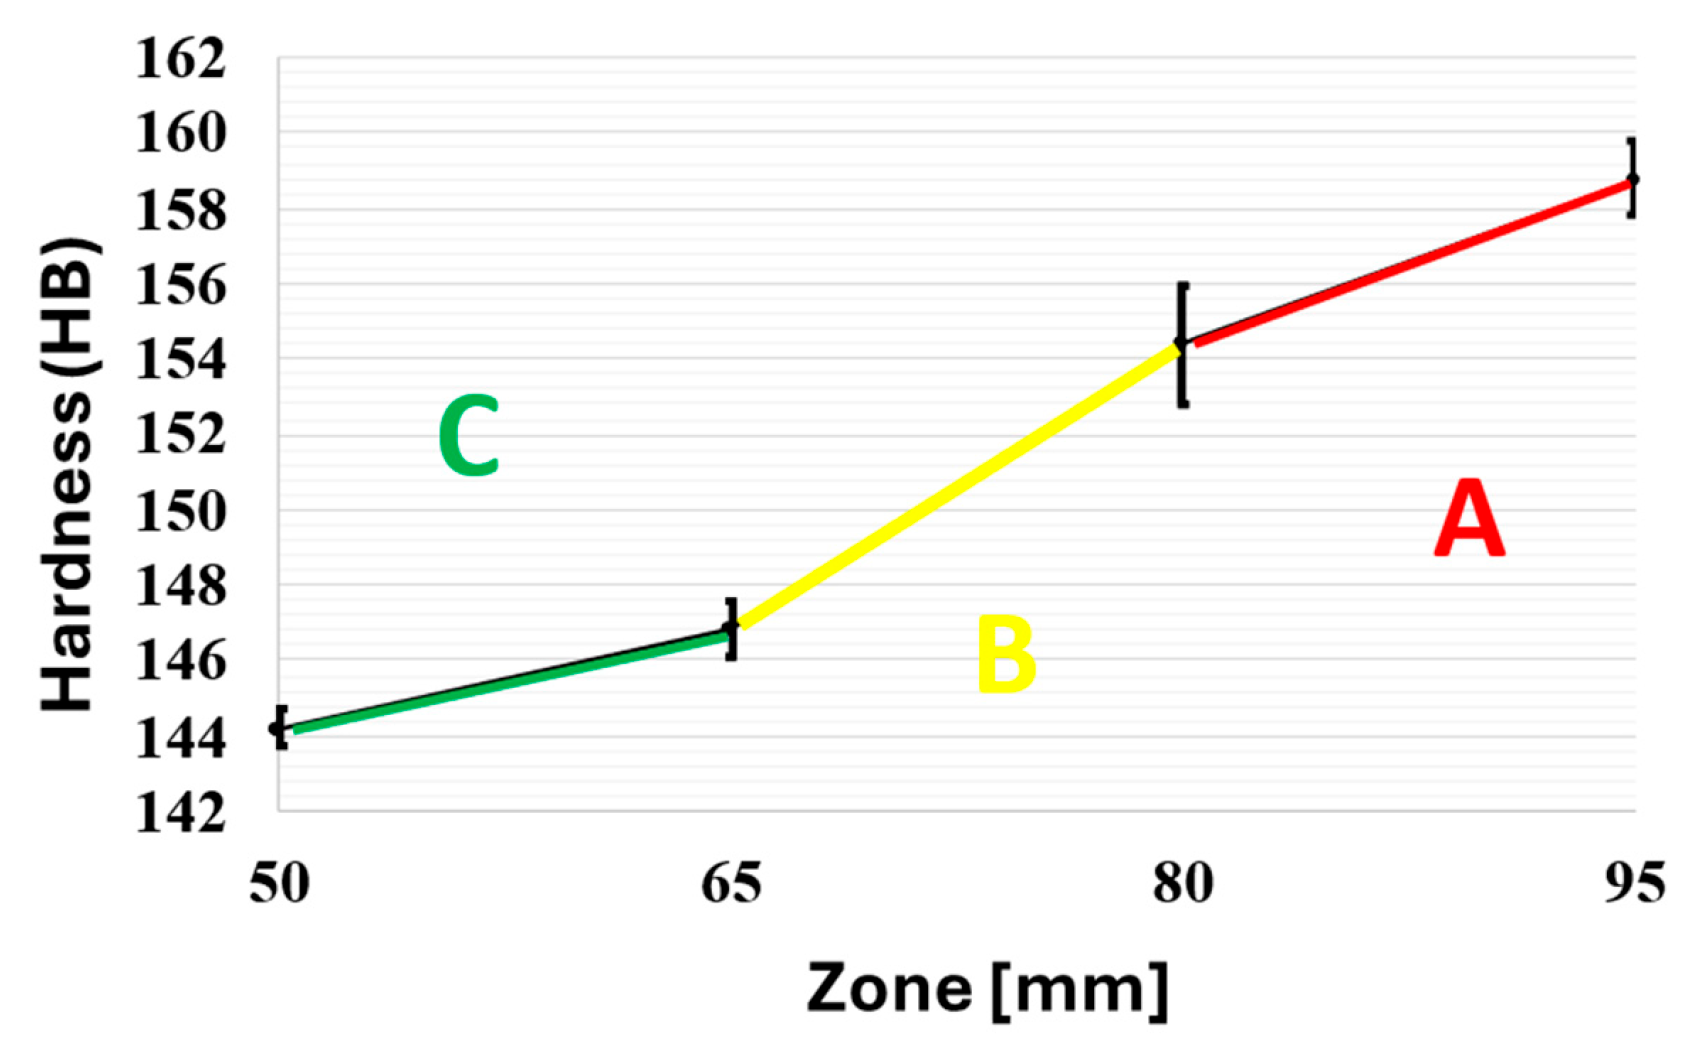
For the Brinell tests, an Otto Wolpert-Werke universal hardness tester with a 2.5 mm ball and 187.5 kg load was used. Five measurements were performed, maintaining a contact time of 30 s between the indenter and the specimen. The graph in Figure 8 illustrates the values of the hardness measurements.
Figure 8.
Hardness values of AISI 304 stainless steel bars along regions A, B and C obtained by the Brinell test.
The results indicate a systematic hardness gradient across the bar radius, with the peripheral region exhibiting approximately 9% higher hardness compared with the central region in the Brinell measurements. This heterogeneity is consistent with cold working effects and local microstructural variations typically observed in austenitic stainless steels. To minimize the influence of this variability on machinability results, all machining tests were restricted to Regions A and B, which presented smaller hardness differences and greater repeatability.
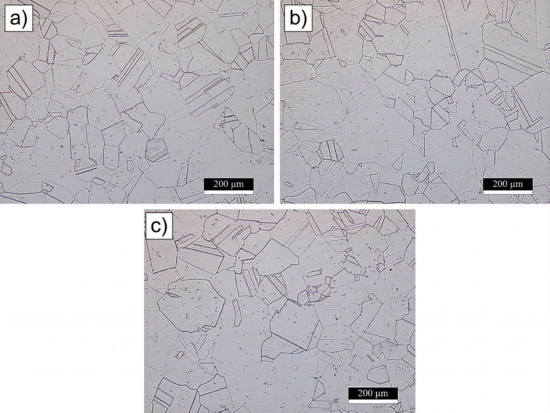
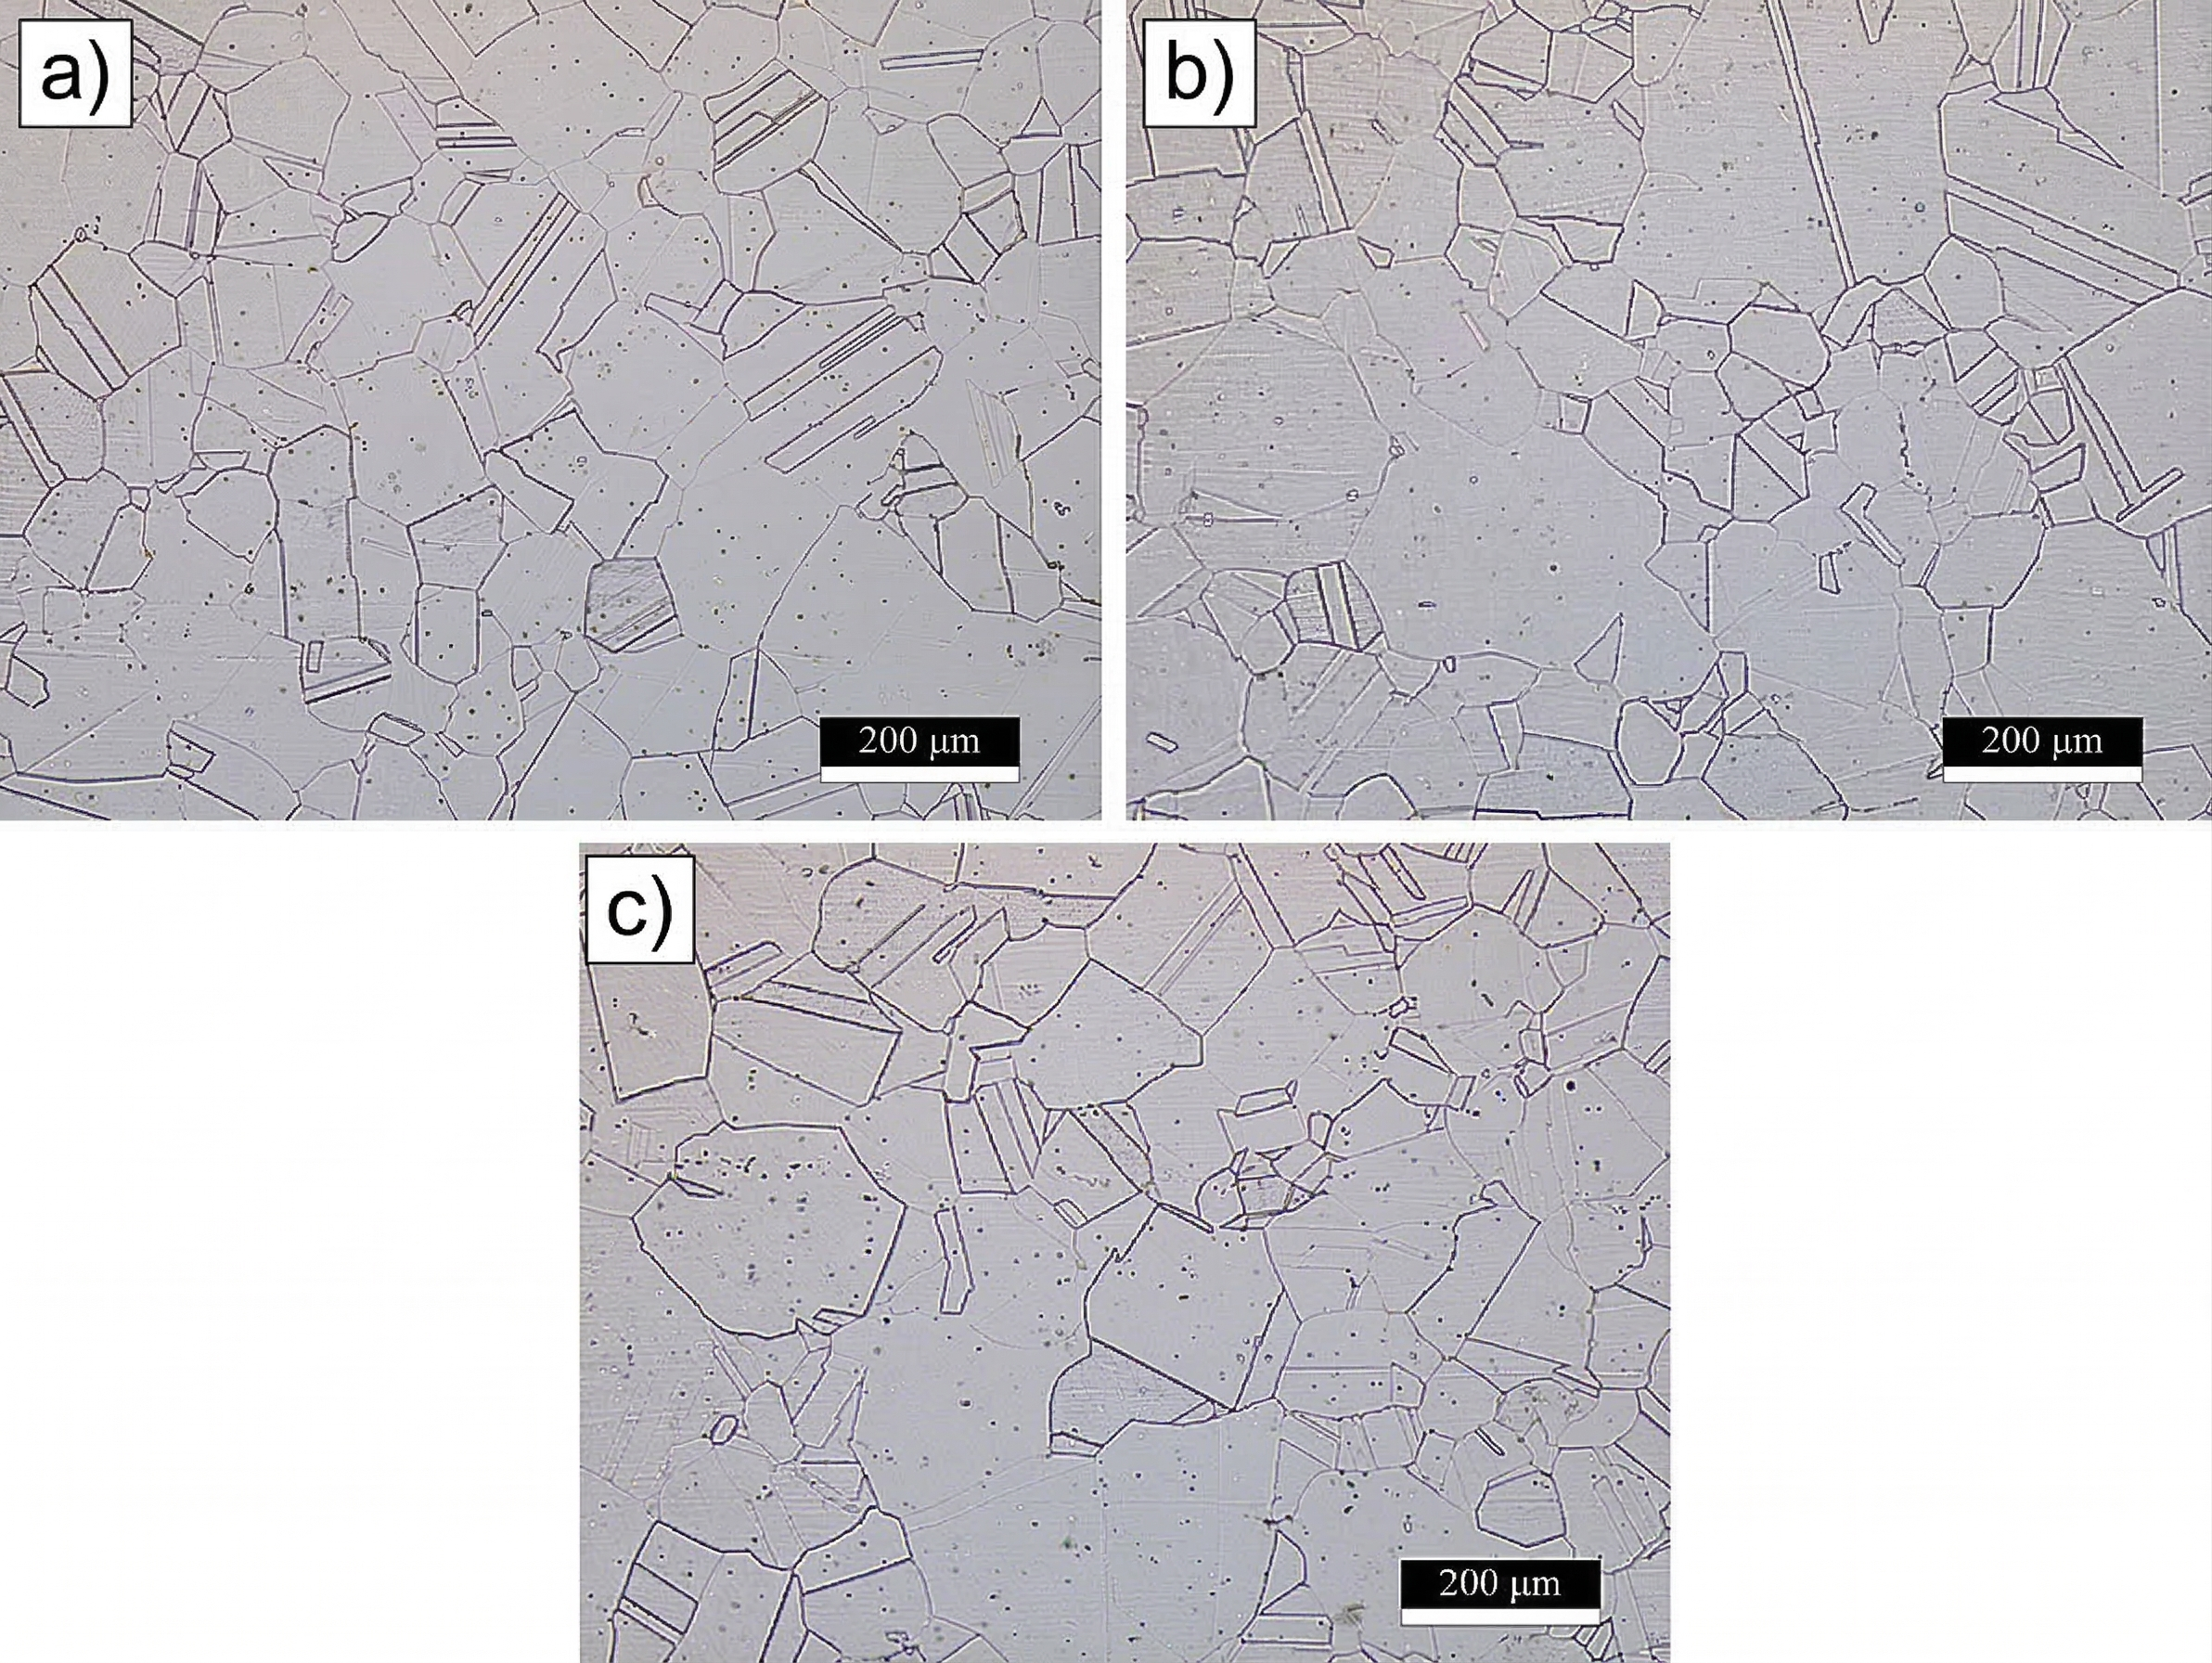
Metallographic characterization was performed to verify the microstructural homogeneity among the analyzed regions. Samples were sectioned from Regions A, B, and C, ground under water lubrication, polished with 1 μm alumina suspension, and chemically etched using a 10% aqua regia solution (90% hydrochloric acid and 10% nitric acid). Optical micrographs, shown in Figure 9, reveal a typical fully austenitic microstructural heterogeneity. This observation supports the conclusion that the hardness gradient is driven by strain hardening induced during the bar manufacturing process, rather than by phase transformations or compositional segregation.
Figure 9.
Optical micrographs of the microstructure of AISI 304 stainless steel: (a) Peripheral region; (b) Intermediate region; (c) Central region.
2.2.2. Experimental Design
The machining experiments were performed on a ROMI® Multiplic 35D CNC lathe (Brazil), equipped with an 11 kW spindle motor and a maximum rotational speed of 3000 rpm. The selection of cutting parameters was based on preliminary trials and on previous studies addressing the machinability of AISI 304 stainless steel under high-speed conditions [23,30,31,32,33,34]. In addition, earlier investigations on internally cooled tools indicated that the thermal benefits of internal cooling become more pronounced at elevated cutting speeds [35].
To ensure direct comparability among the different cooling strategies and to isolate their influence on process behavior, a single set of cutting parameters was adopted throughout the experimental campaign: cutting speed /min, feed rate m/rev, and depth of cut m. These parameters represent a severe but industrially relevant cutting regime for austenitic stainless steels. The selection of the cutting parameters was based on tool manufacturer recommendations and values reported in the literature for machining this class of material, ensuring both industrial relevance and experimental repeatability. This approach enables a direct comparison among the evaluated conditions while minimizing cross-effects between cutting parameters.
Five machining atmospheres were evaluated: dry cutting, minimum quantity lubrication (MQL), conventional flood cooling (cutting fluid), internally cooled tooling (ICT), and hybrid ICT combined with MQL (ICT + MQL). Modified internally cooled inserts were employed exclusively in the ICT and ICT + MQL conditions. For each atmosphere, three repetitions were conducted to ensure repeatability. The order of the experiments was randomized to minimize the influence of uncontrolled variables such as material heterogeneity, bar eccentricity, and thermal drift. The atmospheric conditions used are listed in Table 3.
Table 3.
Atmospheric conditions studied.
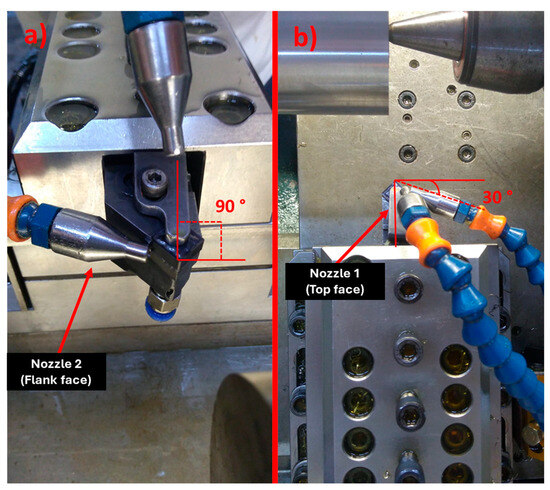
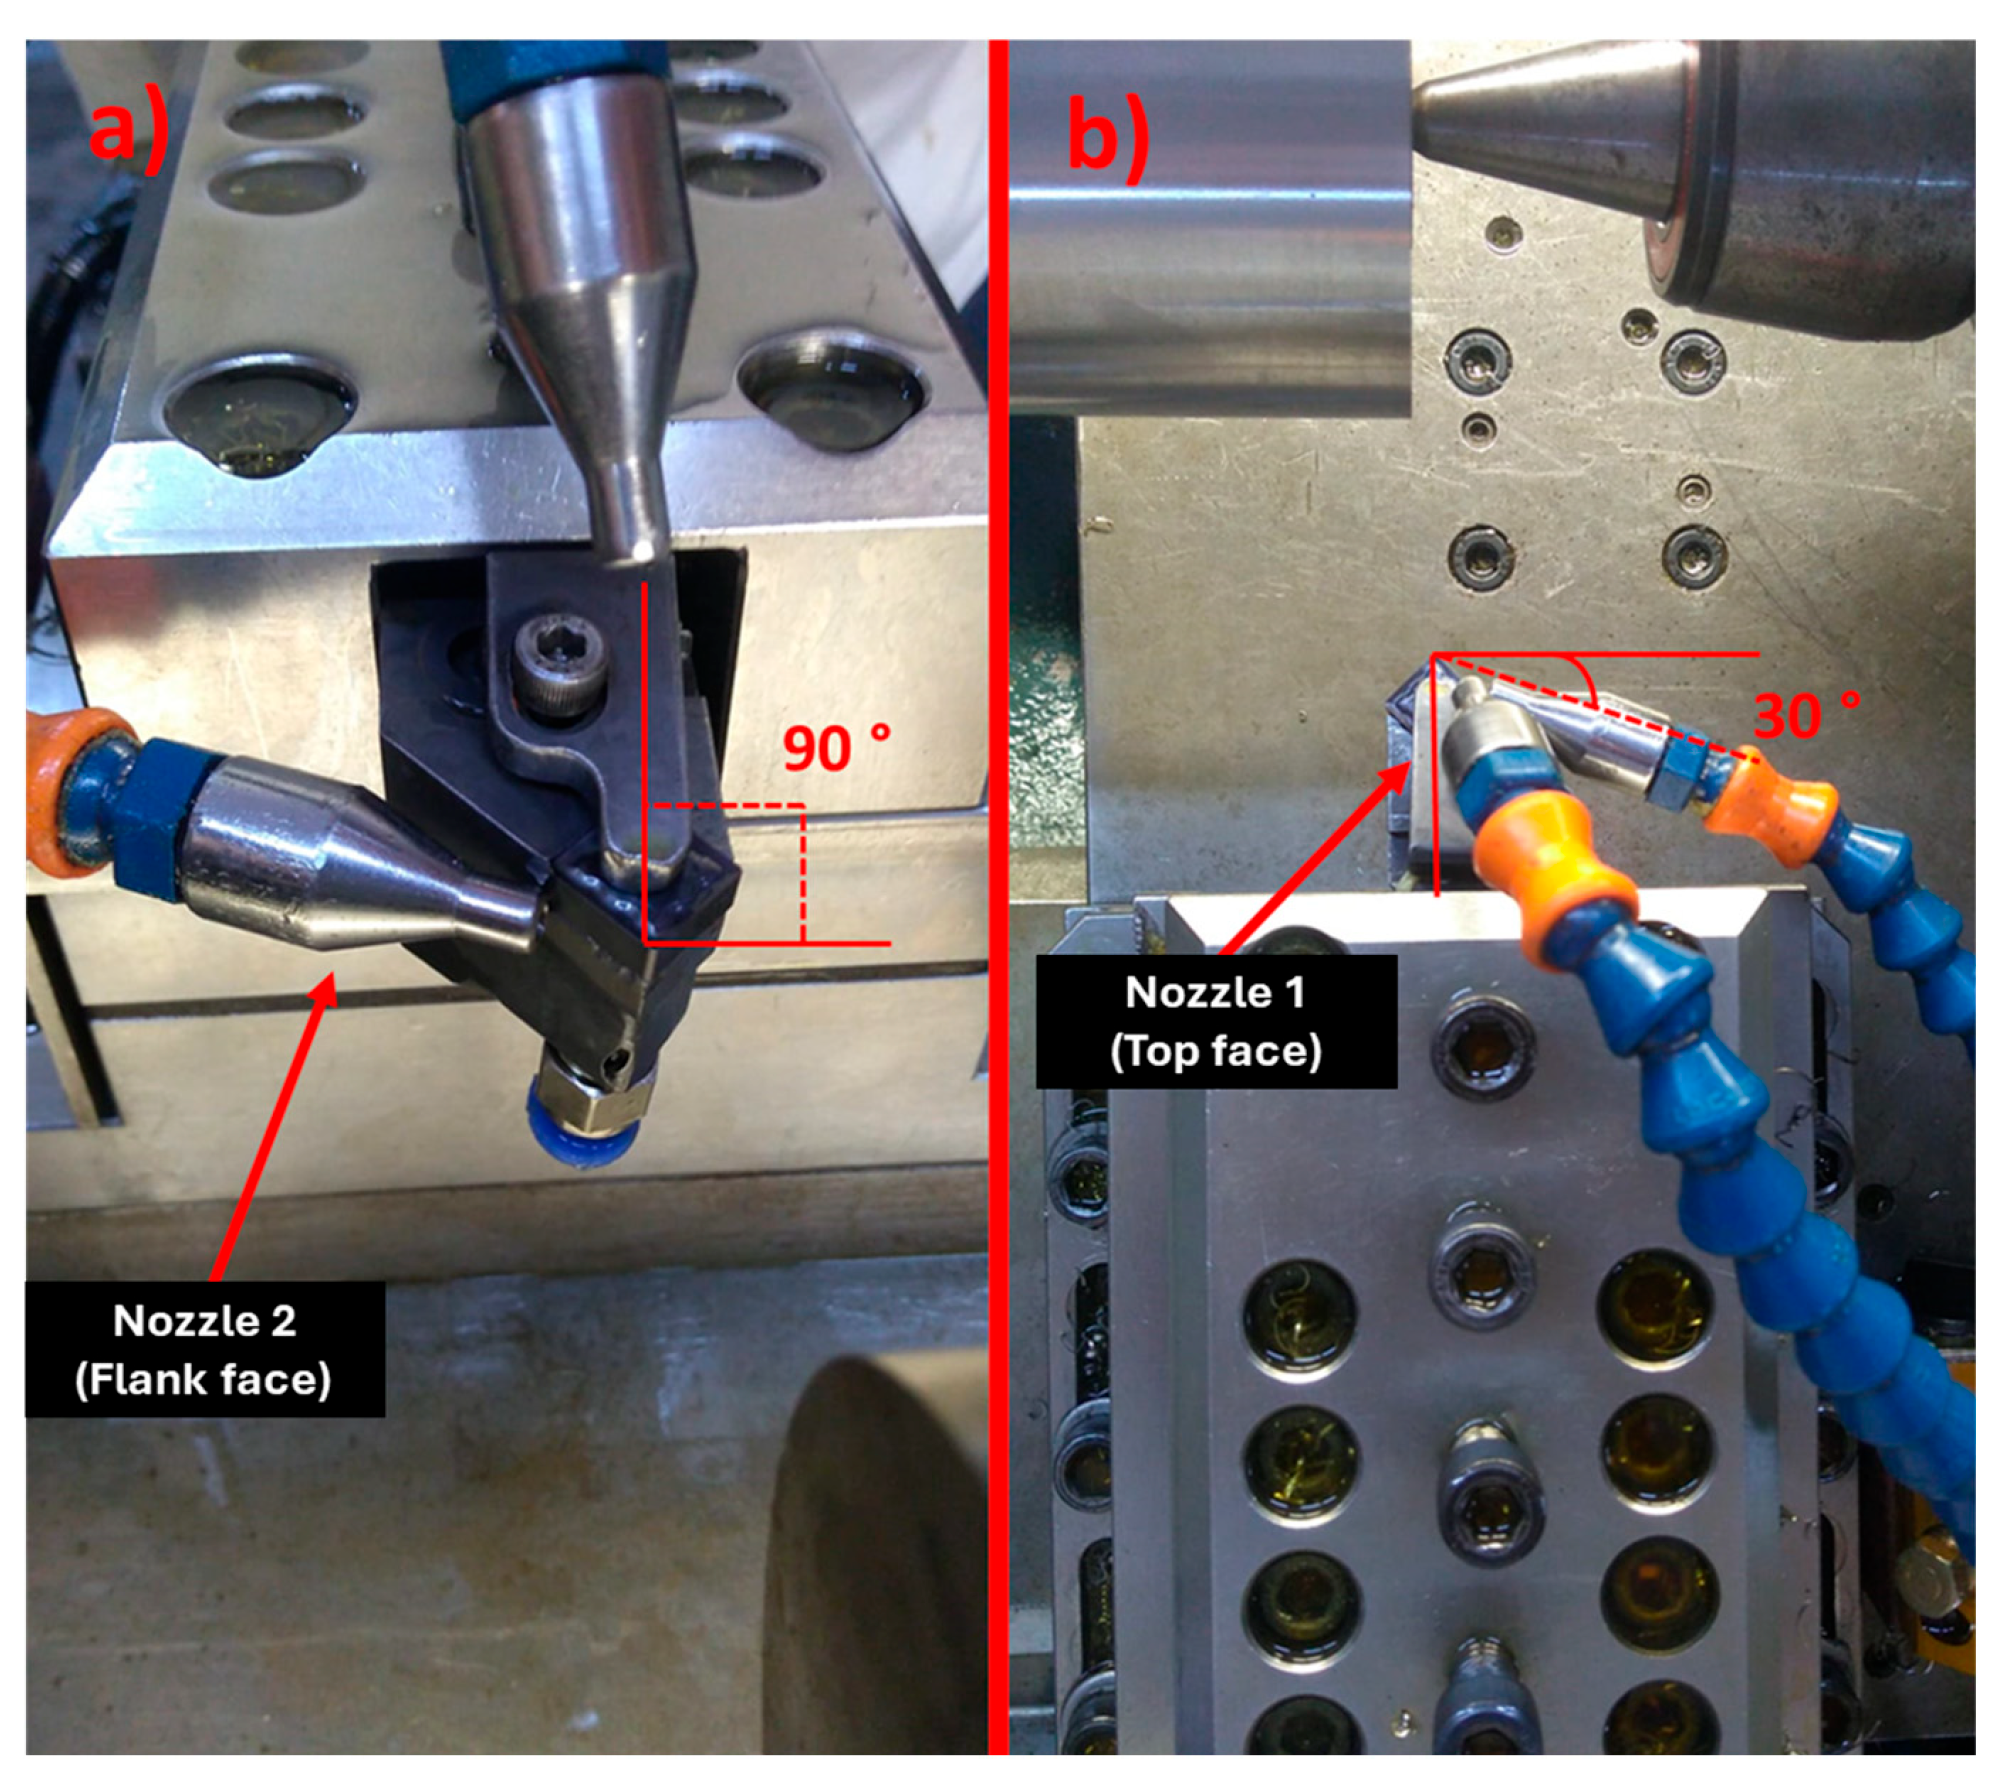
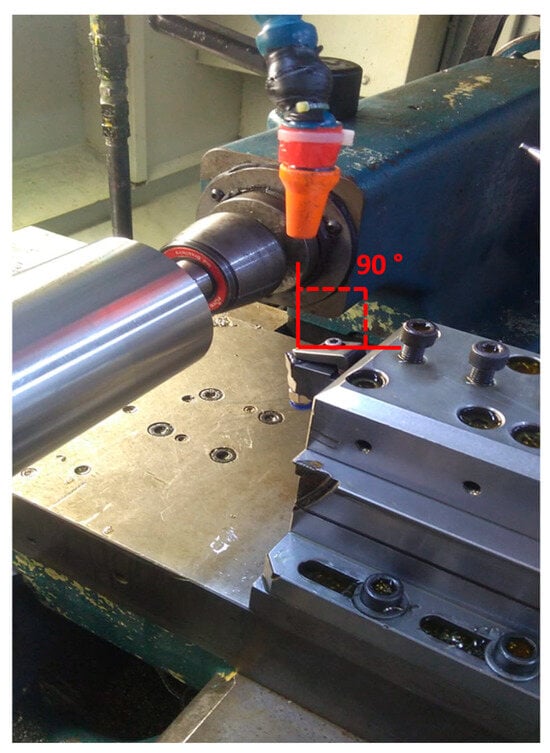
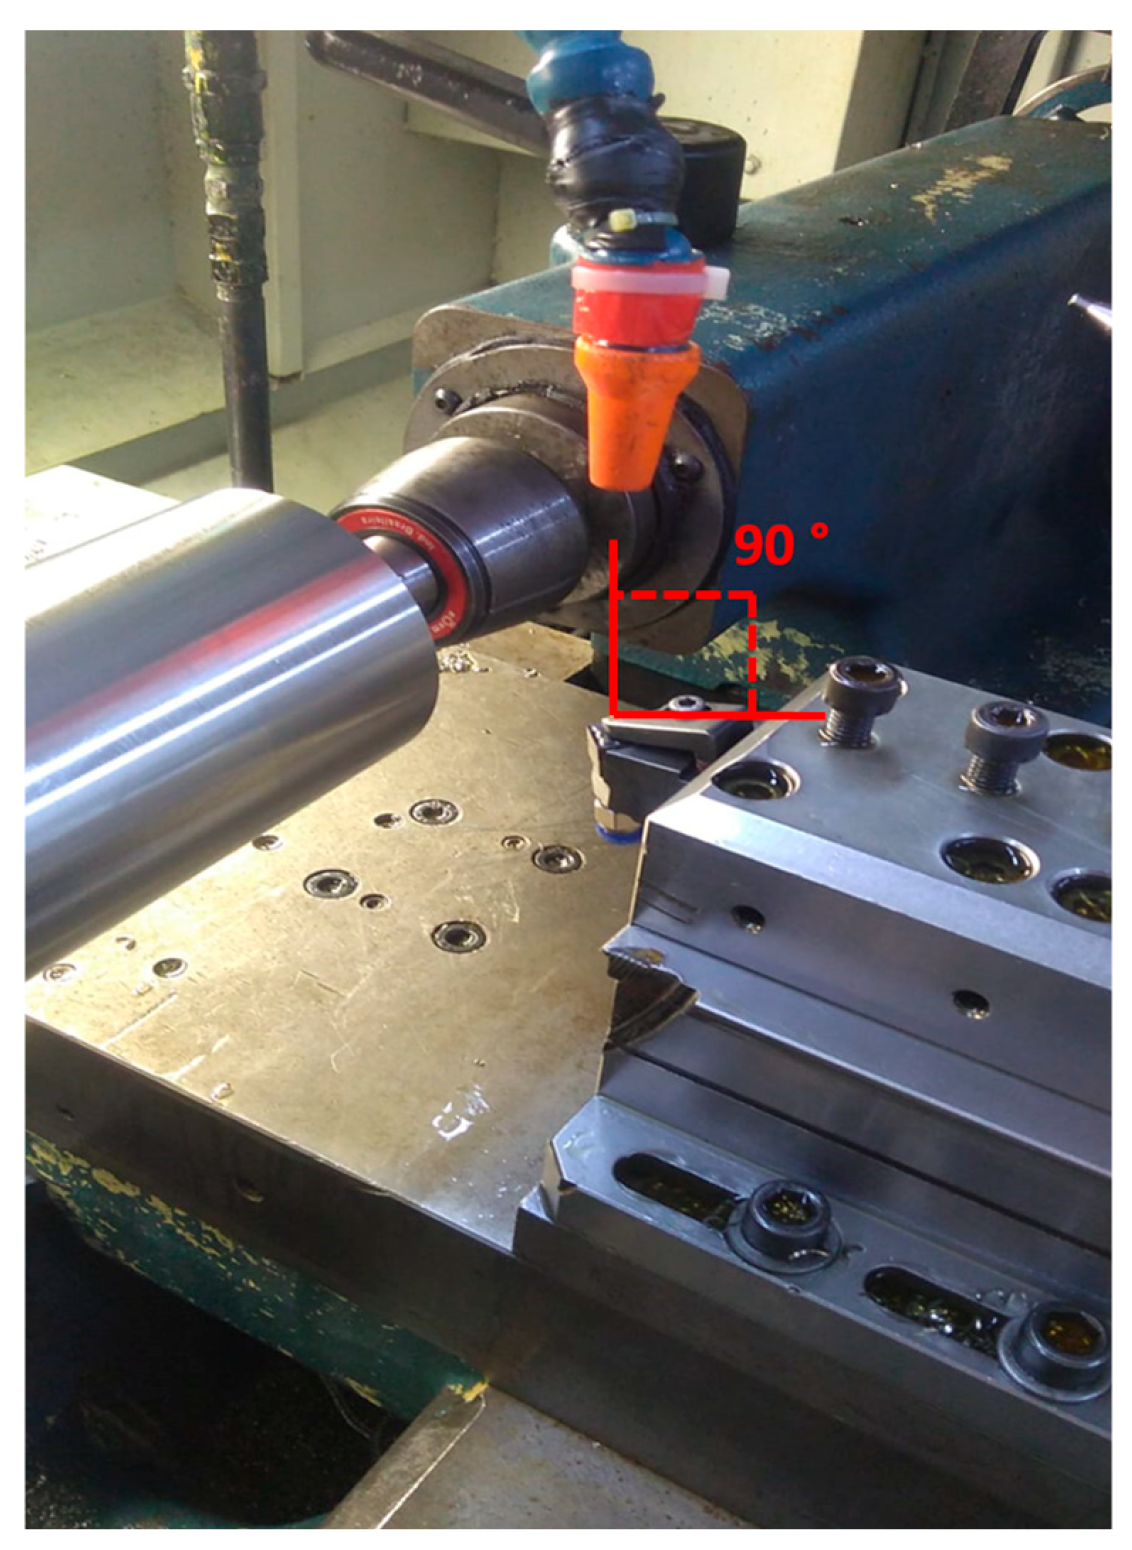
Under MQL conditions, the synthetic ester-based lubricant was supplied at a flow rate of 40 mL/h and an air pressure of 5.5 bar, following recommendations reported in the literature for stainless steel machining [36]. Two nozzles were used to optimize lubricant delivery and chip evacuation: nozzle 1 was oriented toward the rake face region, while nozzle 2 was directed toward the flank face. The respective nozzle orientations were set at approximately 90° and 30° relative to the feed direction, as illustrated in Figure 10.
Figure 10.
(a) Front view of the positioning of nozzles 1 and 2; (b) Top view of the positioning of nozzles 1 and 2.
For the flood cooling condition, a water-miscible cutting-fluid concentrate from the was diluted in water to 8 % and directed perpendicularly to the rake face at atmospheric pressure, as shown in Figure 11. The fluid water-miscible cutting fluids are designed to provide effective cooling and flushing, outstanding lubricity, wear and corrosion protection, and low-foaming behavior under machining conditions. This configuration represents a conventional industrial practice for emulsion-based cooling.
Figure 11.
Cutting fluid application direction.
2.2.3. Machining Force
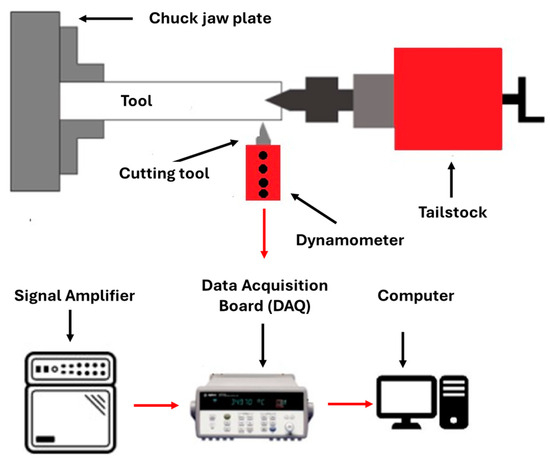
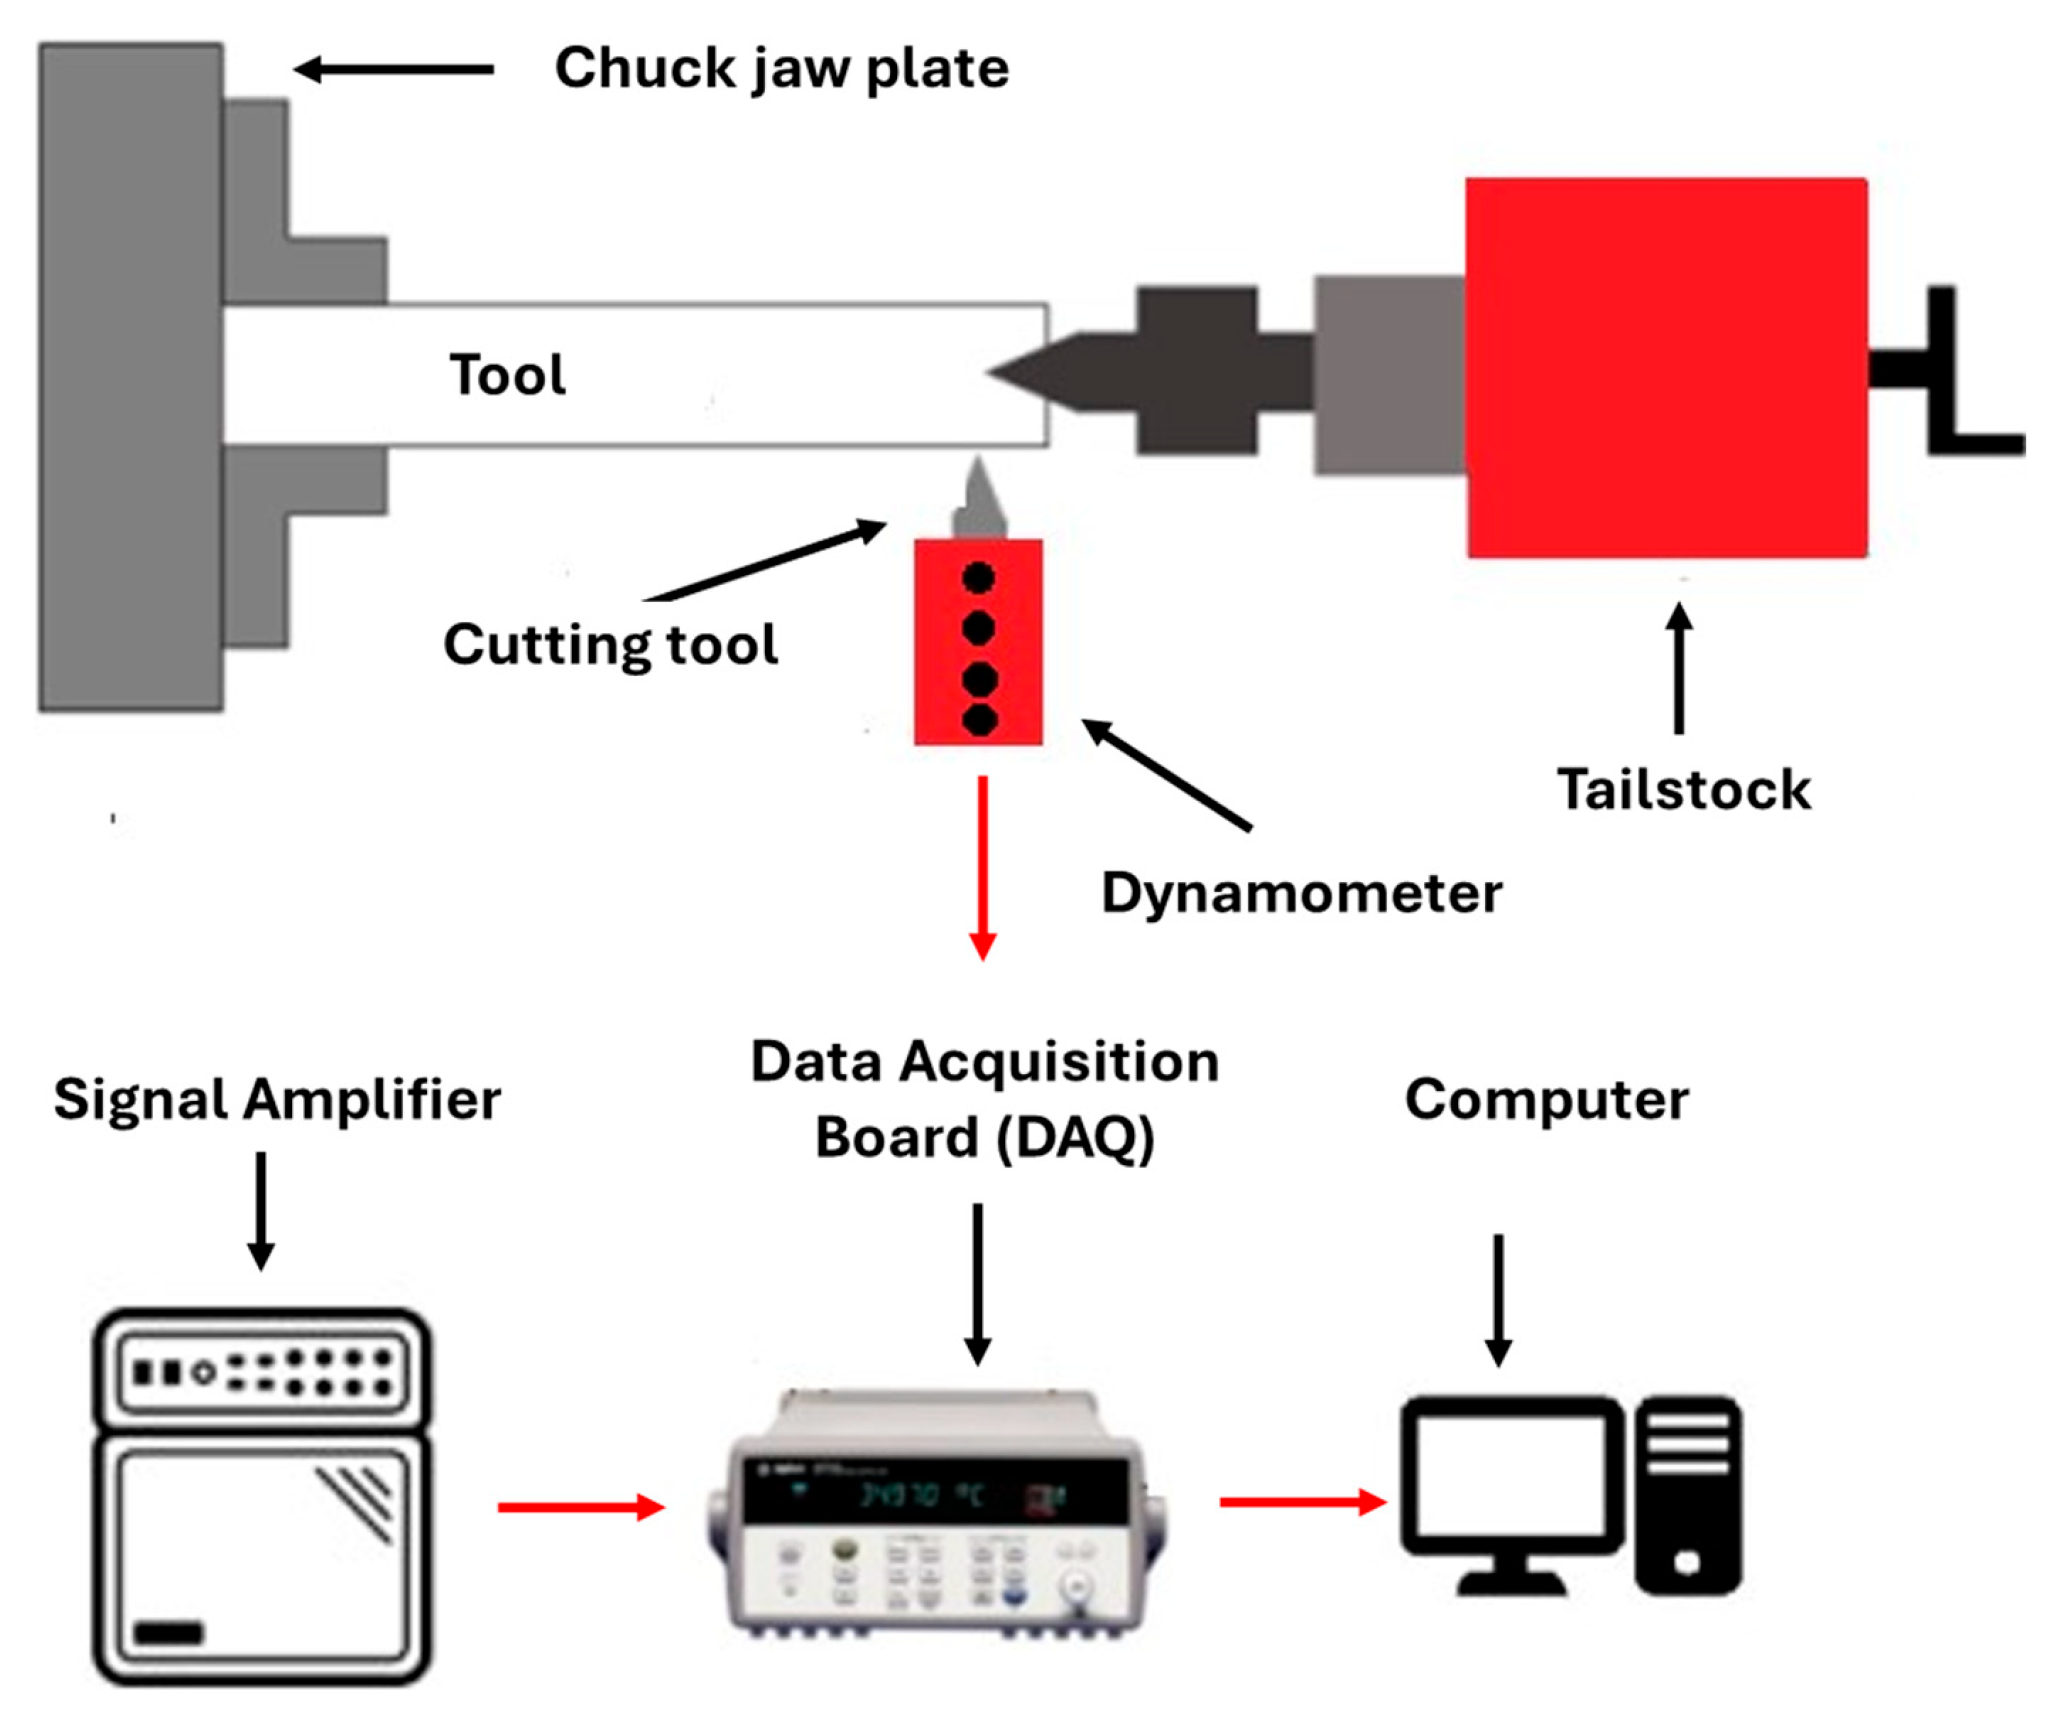
Cutting force measurements were performed using a Kistler® 9265-B (São Caetano do Sul, Brazil) piezoelectric dynamometer, equipped with four quartz crystal sensors for three-component force acquisition. The sensor signals were amplified using a Kistler® 5070A charge amplifier and transmitted to a National Instruments® USB-DAQPad 6251 data acquisition board. Data acquisition and real-time monitoring were performed using LabVIEW® software (2026, Q1). A schematic of the measurement chain is presented in Figure 12.
Figure 12.
Schematic drawing of the force measurement system.
The three orthogonal force components were acquired: cutting force (), feed force (), and passive force (). For each machining pass, signals were recorded during the first 10 s of steady state cutting at a sampling rate of 100 Hz, resulting in 1000 data points per force component. The resultant machining force () was calculated according to Equation (1).
This acquisition window was selected to ensure stable cutting conditions while avoiding transient effects associated with tool entry and exit. The measured force signals were subsequently used for two purposes: (i) comparative analysis of machining performance under different cooling strategies and material regions; and (ii) derivation of cutting power for the development of the machine learning model described in Section 2.2.4.
All force measurements were performed under identical sensor calibration and mounting conditions to ensure consistency and repeatability across experimental runs.
2.2.4. Building an Artificial Intelligence Model Using XGBoost
An artificial intelligence model based on the Extreme Gradient Boosting (XGBoost) algorithm was developed to predict tool end-of-life using cutting power as the sole input signal. The objective was to evaluate the feasibility of a low-cost, single-sensor monitoring strategy capable of real-time deployment in industrial environments.
Although cutting power can be directly obtained from machine controllers or embedded sensors in practical applications, in this study, it was computed from experimentally measured cutting force to ensure higher accuracy and signal fidelity. Cutting power () was calculated according to Equation (2), where is the cutting force measured by the dynamometer and is the cutting speed.
- •
- Fc represents the cutting force measured directly by the dynamometer.
- •
- Vc corresponds to the cutting speed used in each experiment.
Force signals were continuously acquired throughout each machining test. Periodic interruptions were performed to measure physical tool wear, surface roughness, and chip morphology. The wear value measured at each interruption was assigned to all force data collected during the preceding machining interval, generating a labeled dataset that represents the temporal evolution of tool degradation.
A total of 15 experimental tests were conducted. For each test, force data were recorded during the first 10 s of machining at a sampling frequency of 100 Hz, yielding 1000 samples per test. To eliminate transient effects associated with tool engagement and signal stabilization, the first second of each record was discarded. Consequently, only the interval from 1 to 9 s was retained, resulting in 13,500 valid samples.
To reduce data dimensionality and improve robustness, temporal aggregation was applied by computing one-second averages of the cutting power signal. This procedure generated 1350 observations (9 s × 15 tests), each representing the mean power over a one-second window.
No signal filtering, smoothing, or outlier removal was applied in order to preserve the natural variability of the machining process and emulate realistic industrial conditions, where measurement noise, transient disturbances, and process fluctuations are unavoidable.
Five machining atmospheres were included in the dataset: dry, MQL, flood cooling, ICT, and ICT+MQL. The cooling condition was intentionally excluded as an explicit input variable to avoid biasing the model and to improve generalization across different operational contexts. A single global model was, therefore, trained using pooled data from all machining conditions.
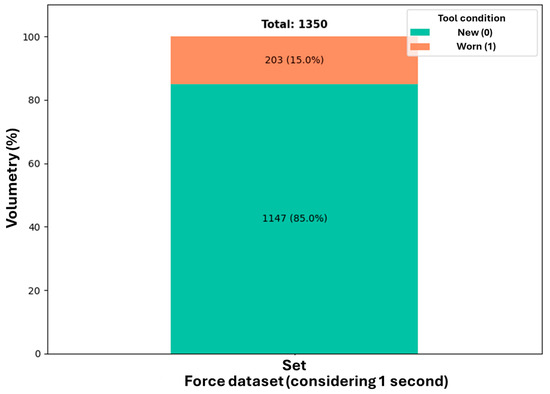
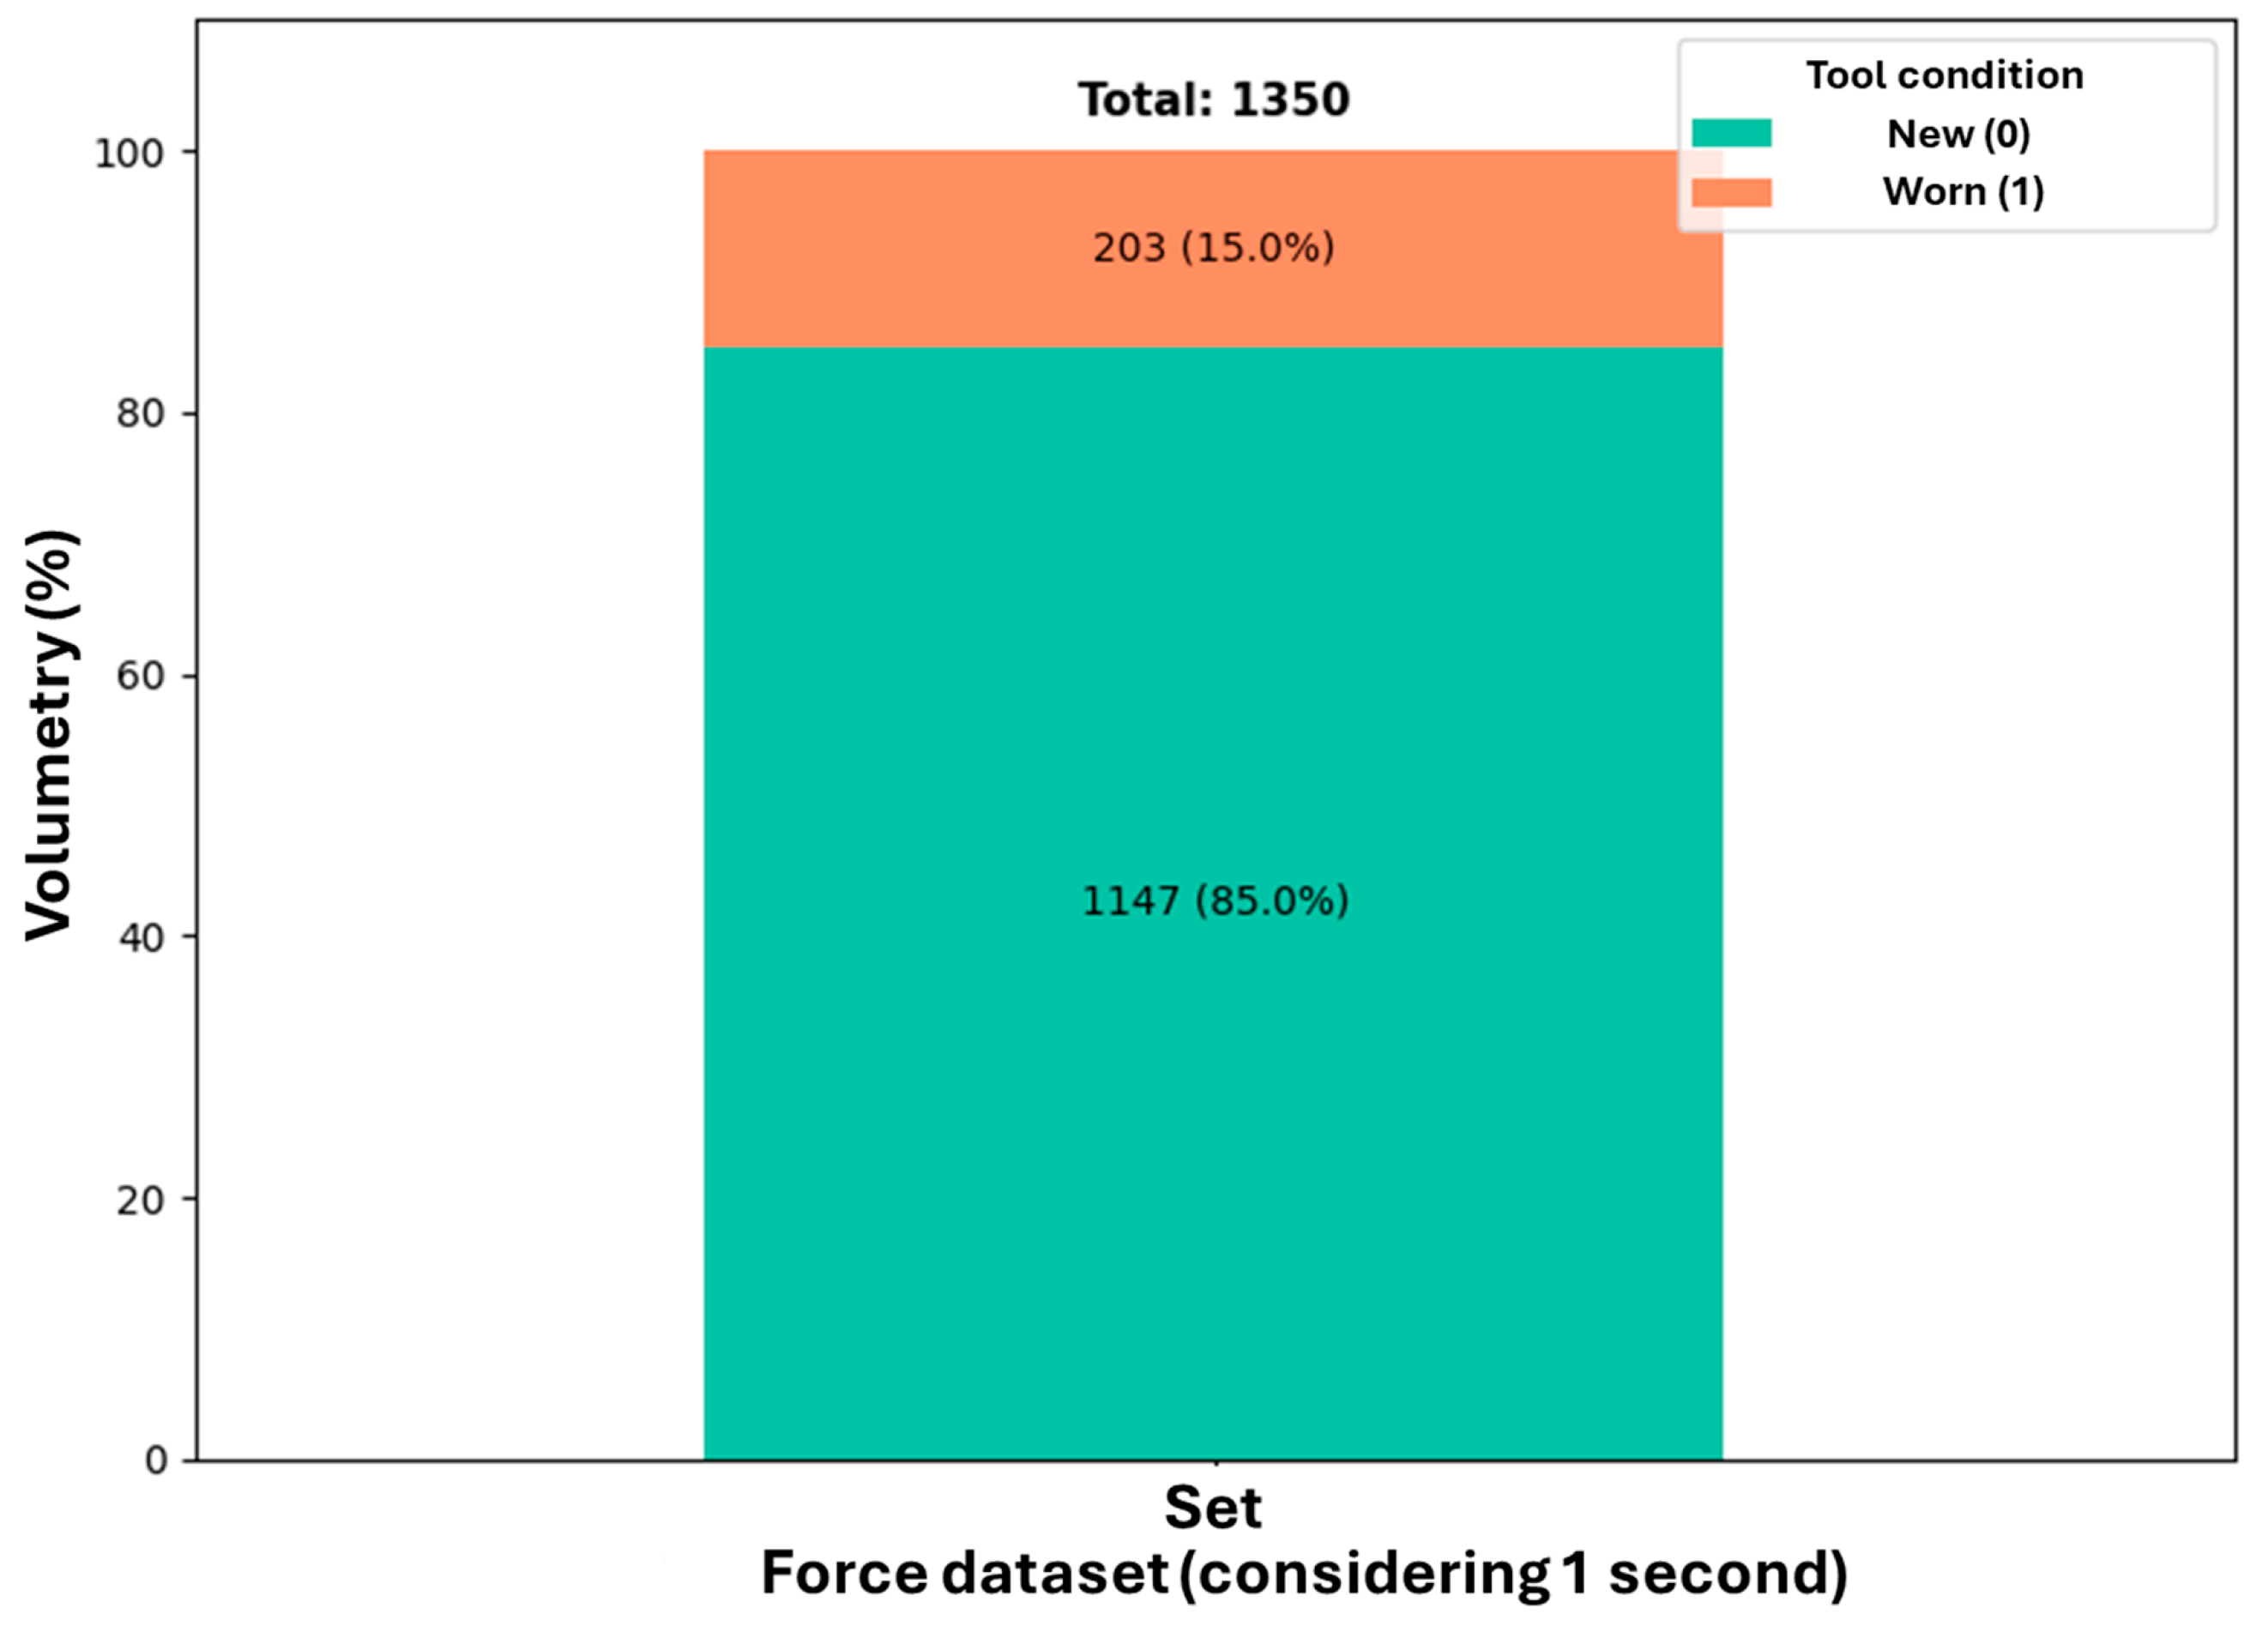
The prediction task was formulated as a binary classification problem. The target variable represented the tool condition relative to the end-of-life criterion. Samples corresponding to flank wear below 0.6 mm were labeled as “healthy” (class 0), while samples exceeding this threshold were labeled as “worn” (class 1). The resulting dataset exhibited a moderate class imbalance, with approximately 85% healthy and 15% worn samples.
From each one-second power segment, a set of 20 statistical and trend-based features was extracted (Table 4), capturing central tendency, dispersion, amplitude, distribution shape, temporal variability, and global trends of the signal.
Table 4.
Variables taken from the power data.
The dataset was stratified into training (70%), testing (20%), and validation (10%) subsets to preserve class proportions. Model development and hyperparameter tuning were performed using the training and testing sets, while the validation set was reserved exclusively for unbiased performance assessment.
Recursive Feature Elimination with Cross-Validation (RFECV) was applied to identify the most informative features and reduce model complexity, improving computational efficiency and robustness for potential real-time deployment. The final XGBoost model was retrained using the selected feature subset.
Model performance was evaluated using accuracy, precision, recall, F1-score, AUC–ROC, and Kolmogorov–Smirnov (KS) metrics. Model interpretability was achieved using feature importance ranking and SHAP (Shapley Additive Explanations) analysis, enabling physical interpretation of how power signal characteristics influence tool wear prediction.
Figure 13 shows the volume of the database used in the modeling, highlighting the proportion between the records labeled as unworn tool (85%) and worn tool (15%). The 100% stacked bar graph shows both the percentage distribution and the absolute sample count by class. There is a moderate imbalance between the two categories of the target variable, where most of the data represent signs where the tools were still in acceptable operating conditions.
Figure 13.
Percentage and absolute distribution of data from the study base used in the construction of the model.
Tool wear evaluation was restricted to flank wear (VB) measurement using optical microscopy . Detailed morphological or chemical characterization of wear mechanisms was not performed, as the primary objective of this work was quantitative wear progression and energetic signal correlation.
3. Results and Discussion
3.1. Machining Forces Analysis
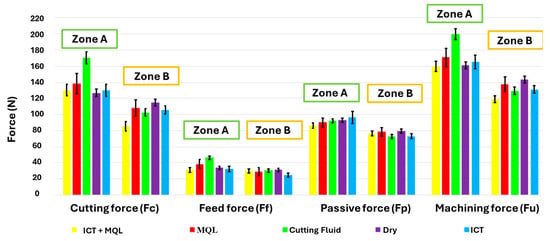
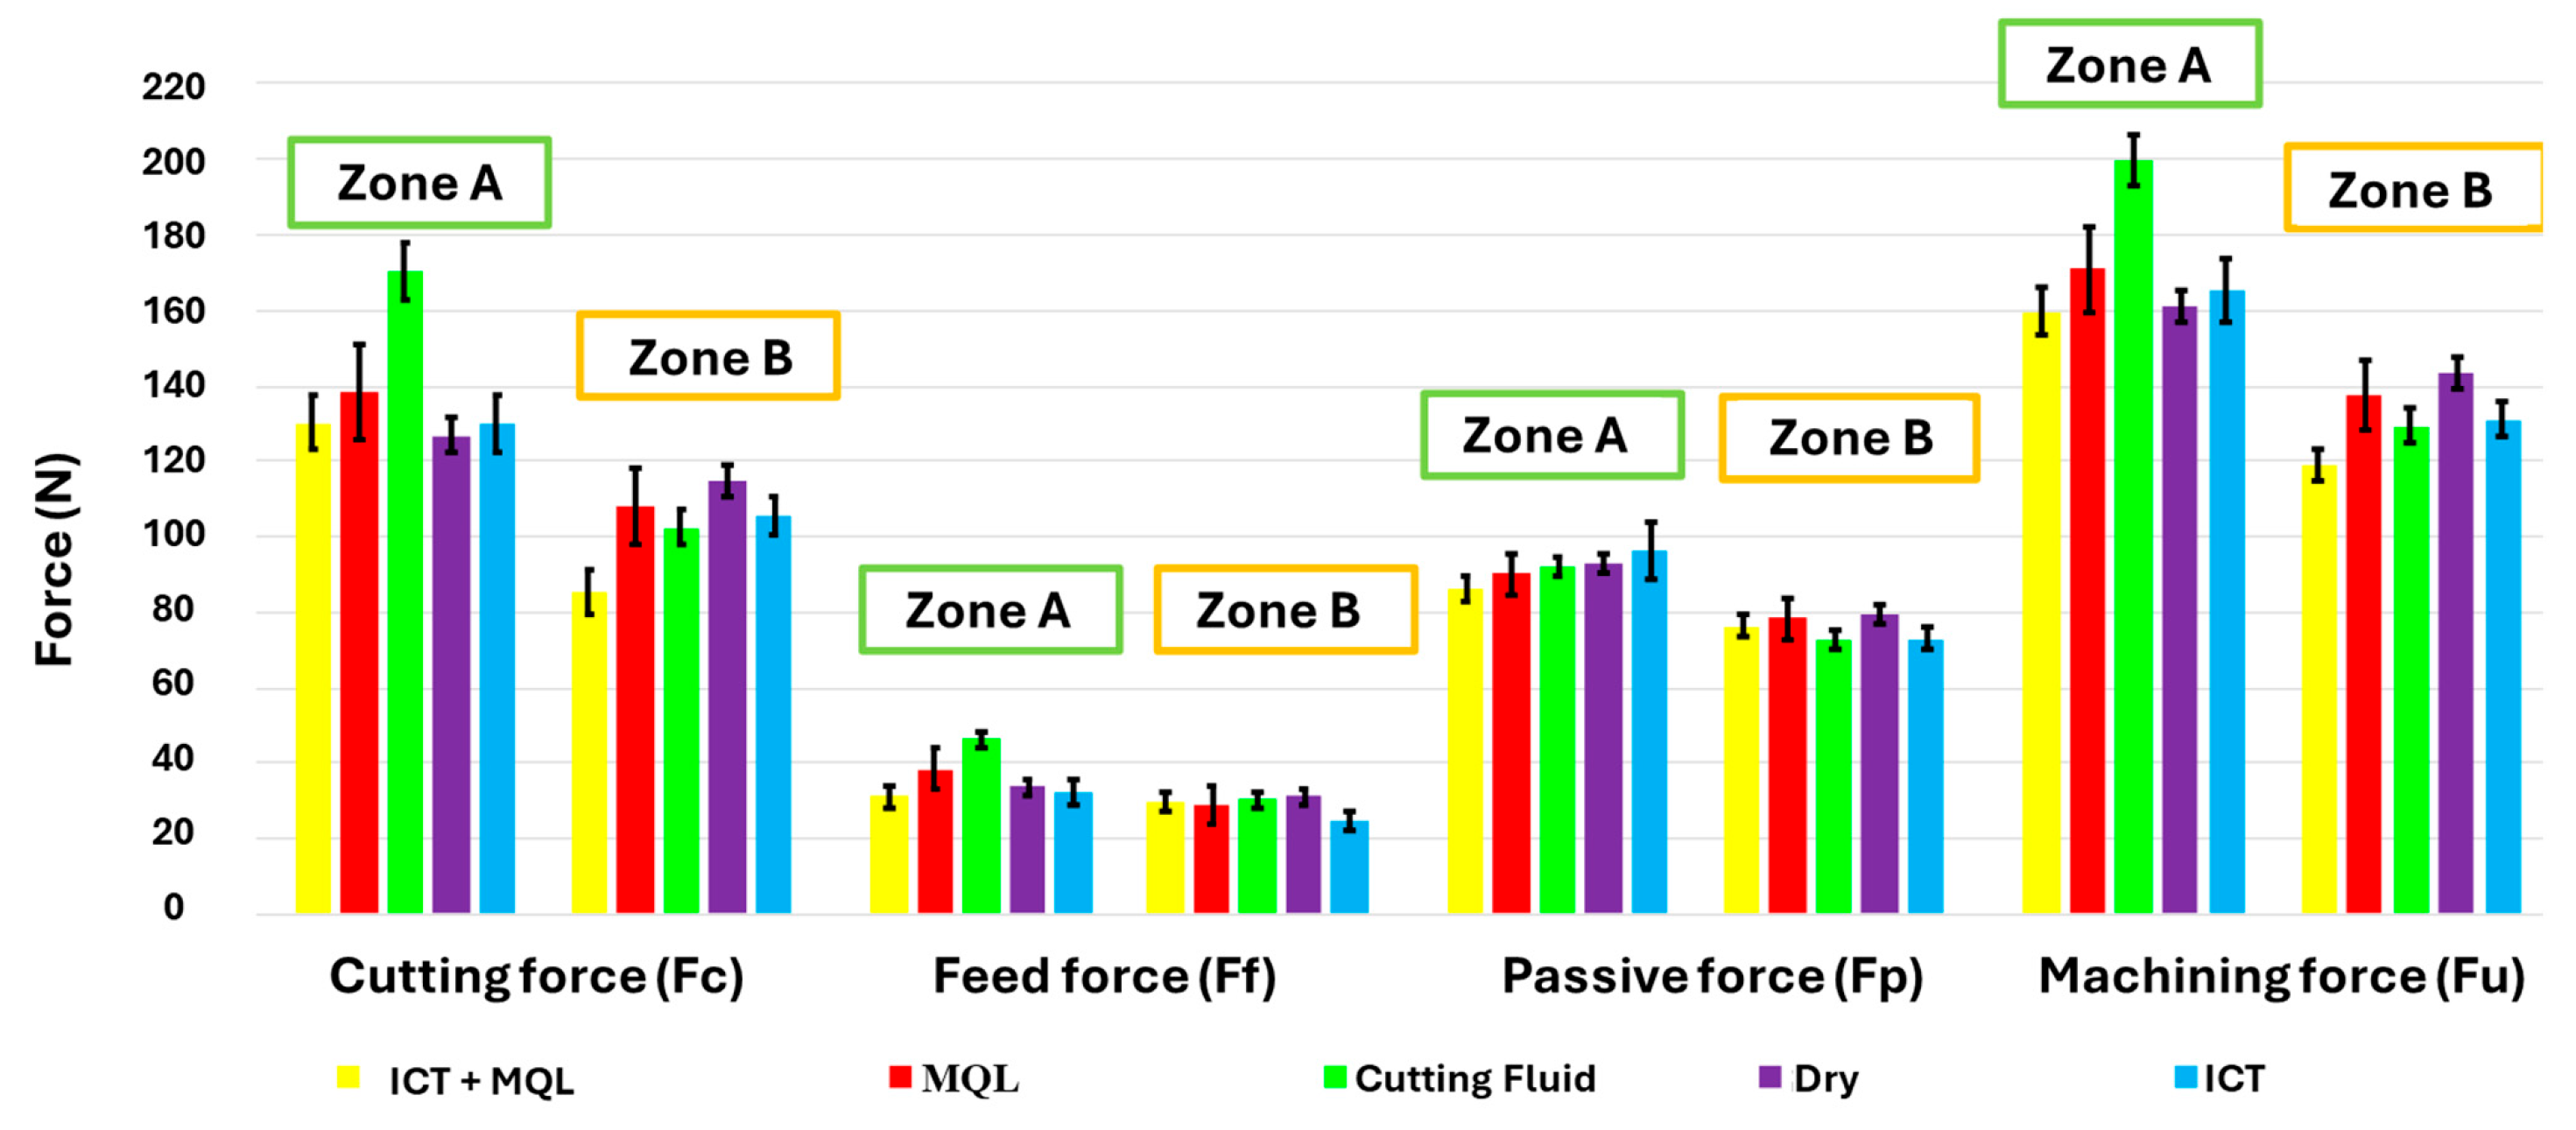
The analysis of machining forces provides fundamental insight into the thermo-mechanical behavior of the cutting process and the effectiveness of different cooling strategies. Figure 14 presents the average values of the cutting force (), feed force (), passive force (), and resultant force () obtained during the first machining pass with a new tool, segregated according to material region (A and B) and lubrication condition.
Figure 14.
Average values of cutting force for different zones and atmospheric conditions.
As expected, the cutting force () was the dominant component under all conditions, followed by and . This hierarchy reflects the predominance of shear deformation energy in chip formation, while feed and passive forces are primarily associated with frictional effects, elastic recovery, and tool–workpiece contact mechanics [37,38]. Nevertheless, both material heterogeneity and lubrication strategy exerted a statistically significant influence on force levels, as confirmed by the ANOVA results.
3.1.1. Effect of Material Hardness on Machining Forces
For all lubrication conditions, force magnitudes were systematically higher in Zone A (peripheral zone) compared with Zone B (intermediate zone). This behavior is directly attributed to the higher hardness measured in the peripheral region (Section 2.2.1), which increases the resistance to plastic deformation and elevates the shear stress required for chip formation. In austenitic stainless steels, this effect is further amplified by their high strain-hardening coefficient, which promotes rapid strengthening of the material ahead of the cutting edge and increases both the shear and ploughing components of the cutting force [2,5].
The increase observed in the passive force component () is particularly relevant, as it reflects higher resistance to tool penetration and elastic recovery of the workpiece surface. Elevated values are commonly associated with harder surface layers, reduced compliance, and increased contact length between tool flank and machined surface, which accelerates flank wear and contributes to thermal accumulation in the cutting zone [32,37]. Similar trends have been reported when machining heterogeneous or work-hardened stainless steels, where radial hardness gradients directly translate into measurable differences in force demand and tool degradation rates [39,40].
These findings justify the experimental decision to restrict machining tests to Regions A and B, minimizing excessive variability while still capturing realistic material heterogeneity effects typical of industrial bars.
3.1.2. Influence of Lubri-Refrigeration Conditions
Two-factor ANOVA (Table 5) indicates that lubrication/cooling condition (“Atmosphere”) and tool wear level have statistically significant effects on cutting force (p < 0.05), confirming that both thermal/tribological management and progressive edge degradation influence process loads. The interaction term (Atmosphere × tool wear) is not statistically significant (p > 0.05), indicating that the effect of tool wear on cutting force follows a comparable overall trend across the evaluated cooling strategies under the adopted cutting regime. Accordingly, Tukey’s post hoc comparisons (Table 6) were used to identify which atmospheres differ significantly in mean cutting force.
Table 5.
Analysis of variance of cutting force.
Table 6.
Tukey’s test of shear forces.
The superior performance of any lubrication or cooling strategy relative to dry machining is primarily associated with two coupled mechanisms: (i) friction reduction at the tool-chip and tool-workpiece interfaces, and (ii) enhanced heat dissipation from the cutting zone [4,11,41]. In dry cutting of austenitic stainless steels, severe adhesion, built-up edge formation, and limited thermal dissipation promote localized softening of the cutting edge and intensification of ploughing, leading to elevated force levels and unstable cutting conditions [42,43].
The effectiveness of MQL in reducing forces can be attributed to the formation of a thin tribological film that reduces interfacial friction, while the compressed air jet assists chip evacuation and localized convective cooling [44,45,46]. Cutting fluids also reduce forces by improving heat removal and lubrication, although their penetration into the tool–chip interface becomes limited at high cutting speeds due to vapor barrier formation and hydrodynamic shielding [7,9].
Internally cooled tools achieves force mitigation through direct heat extraction from the tool body, reducing thermal softening, diffusion-driven wear, and temperature-dependent friction mechanisms at the cutting edge [47,48,49]. The absence of statistically significant differences between ICT, MQL, flood cooling, and ICT + MQL indicates that, under the present cutting parameters, all cooling strategies were sufficient to suppress the dominant thermal-tribological degradation mechanisms relative to dry cutting. Similar convergence of force levels among advanced cooling strategies has been reported in high-speed machining regimes, where thermal saturation effects dominate the force response [9,15,37].
From a sustainability perspective, this result is particularly relevant, as it suggests that low-fluid strategies such as MQL or closed-loop ICT can achieve comparable mechanical performance to conventional flood cooling while substantially reducing environmental burden and fluid consumption [4,12,13,24].
3.1.3. Evolution of Cutting Force with Tool Wear
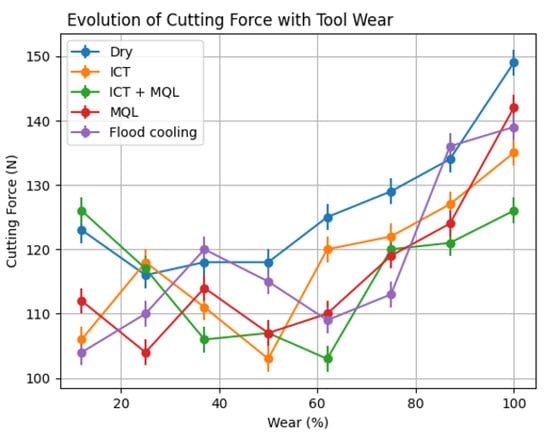
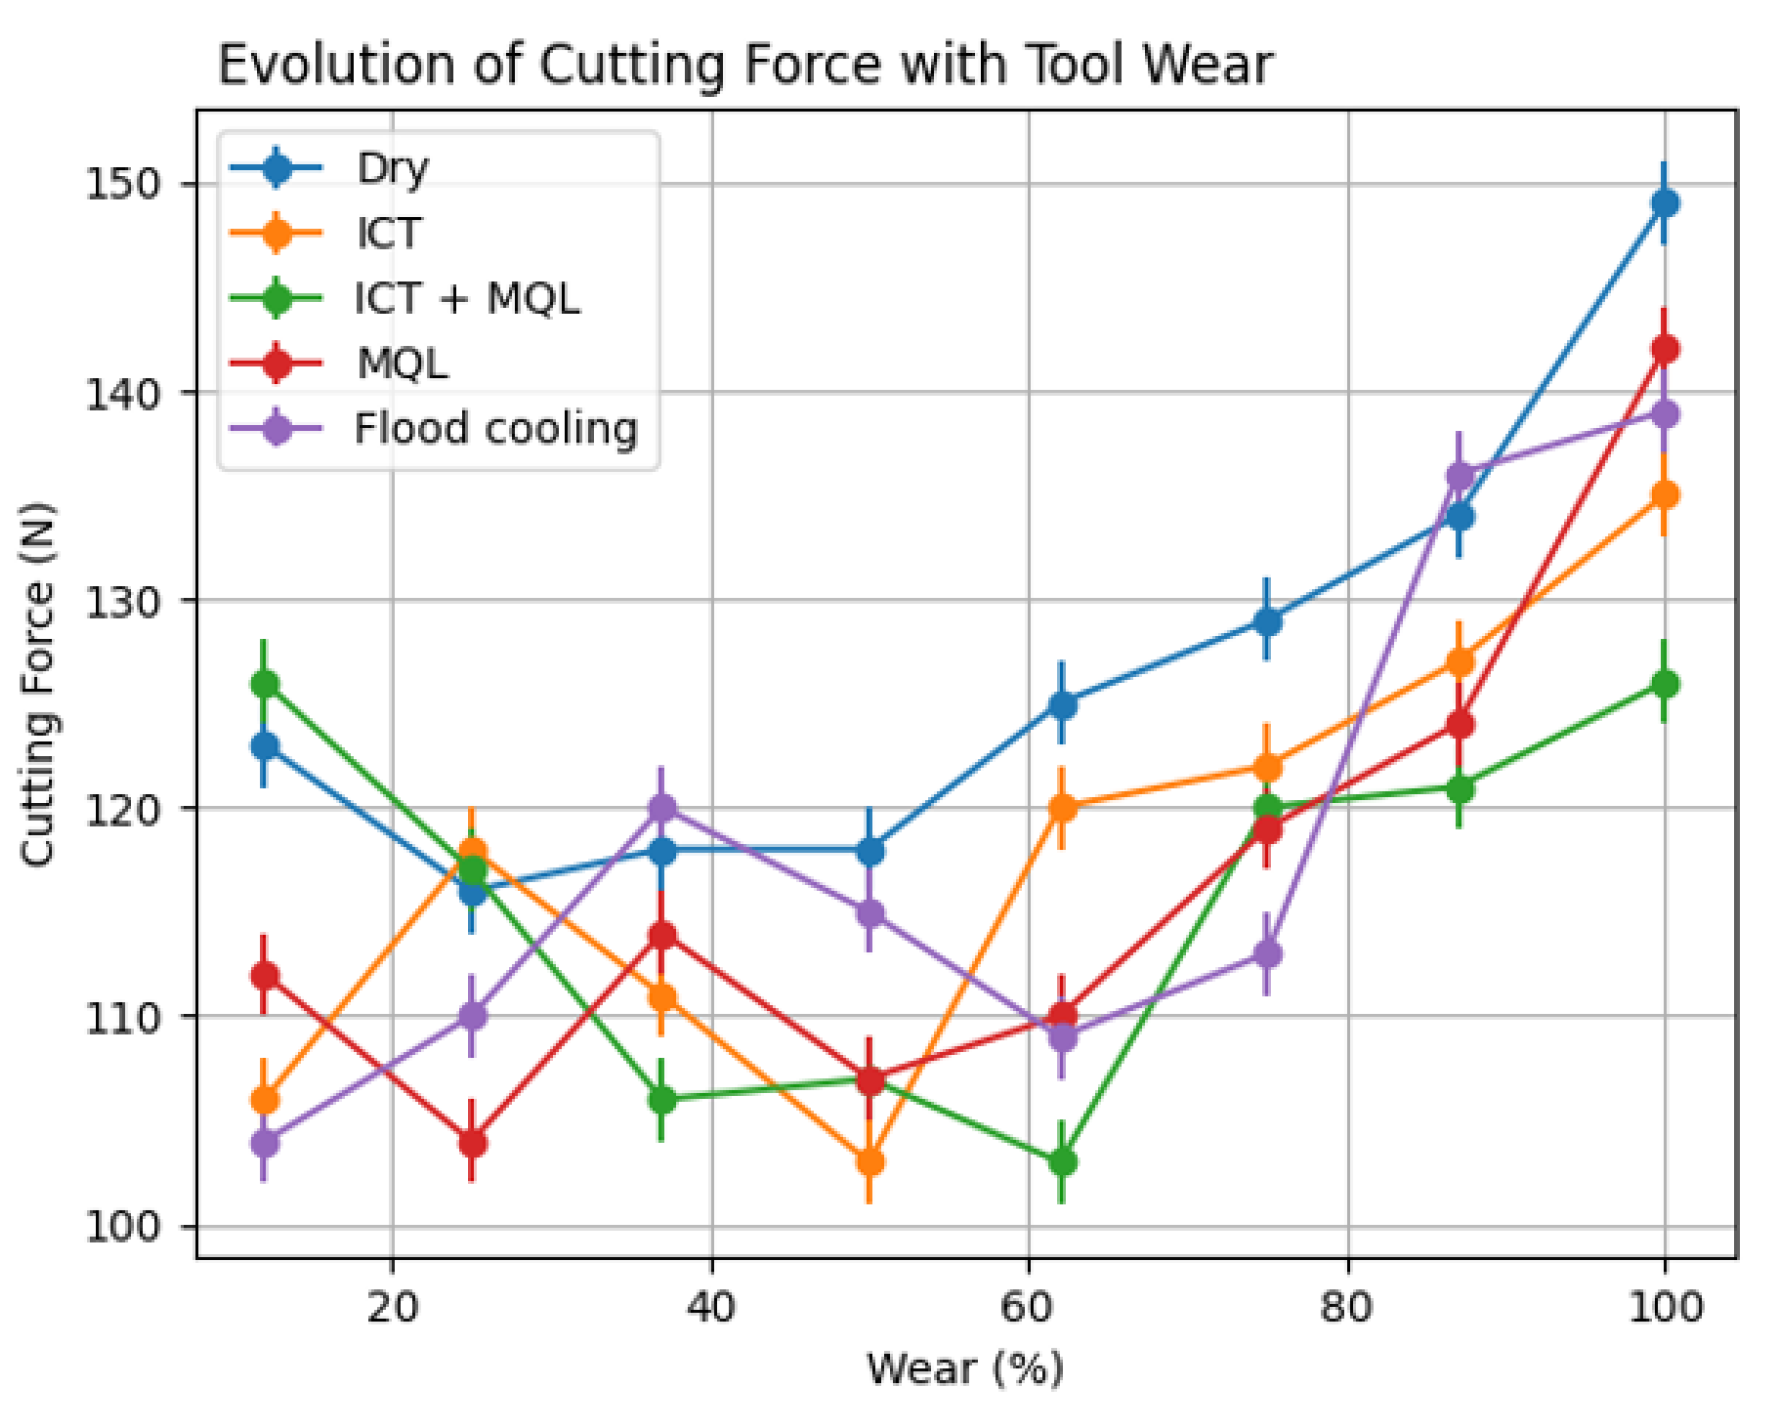
Figure 15 illustrates the evolution of cutting force as a function of tool wear, revealing a clear monotonic increase after the mid-life stage of the tool across all lubrication conditions. This trend reflects progressive degradation of cutting-edge geometry, including flank wear enlargement, crater formation, and edge rounding, which collectively increase the effective contact area and frictional resistance [5,32,38].
Figure 15.
Behavior of cutting force over tool wear.
As wear progresses, the increase in cutting force is consistent with mechanisms commonly reported in the literature for austenitic stainless steel machining, such as enhanced ploughing and frictional interaction at the tool–workpiece interface. Under these conditions, material removal transitions from ideal shearing to partial elastic–plastic deformation and surface ploughing, resulting in a nonlinear escalation of cutting forces [38]. Under high-speed turning of AISI 304, literature reports indicate that adhesive and oxidation-assisted wear may occur; however, in the present study, wear evaluation was limited to quantitative flank wear (VB) measurements.
The strong correlation between cutting force and wear progression reinforces the suitability of energetic metrics, such as cutting power, as indirect indicators for tool condition monitoring. Several recent studies have demonstrated that power-based features exhibit high sensitivity to tool degradation while offering practical advantages for sensor integration and industrial deployment [16,27,28].
In addition to force evolution, the experimental flank wear (VB) progression revealed distinct wear growth regimes under the evaluated cooling strategies.
Under dry conditions, wear growth exhibited an early transition from a mild wear stage to an accelerated regime, indicating severe thermal–adhesive interaction and rapid degradation of the cutting edge.
In contrast, MQL, ICT, flood cooling, and ICT+MQL conditions showed: (1) A longer quasi-linear wear stage; (2) Delayed onset of accelerated wear; (3) Reduced wear growth rate before reaching VB = 0.6 mm.
The ICT-based strategies demonstrated improved wear stabilization, suggesting more effective thermal management at the tool body level, reducing diffusion-driven and oxidation-assisted degradation.
These experimental observations confirm that cooling strategies not only reduce force levels but also directly influence wear kinetics, which in turn modulate energetic signatures used in the machine learning framework.
Although ester-based MQL oils typically provide superior boundary lubrication compared to water-based emulsions, the significantly lower fluid volume in MQL limits its convective heat removal capability. Under high-speed turning of AISI 304, where thermal accumulation strongly influences friction behavior, the balance between lubrication efficiency and cooling capacity may shift depending on wear stage. Consequently, localized increases in force under MQL relative to flood cooling are physically consistent with differences in heat dissipation rather than solely lubricant chemistry.
Overall, the machining force analysis highlights three central mechanisms: (i) material hardness heterogeneity directly modulates mechanical load demand; (ii) tool wear progressively amplifies frictional and ploughing contributions to force; and (iii) lubrication and cooling strategies effectively suppress thermally driven force escalation relative to dry cutting. These findings provide a physical foundation for the machine learning-based monitoring framework developed in the subsequent section.
3.2. Artificial Intelligence for Tool Life
The predictive performance of the proposed XGBoost model was assessed using accuracy, precision, recall, F1-score, AUC–ROC, and Kolmogorov–Smirnov (KS) metrics (Table 7). Across the training, test, and validation datasets, the model consistently achieved high discriminative capability, with AUC–ROC values above 0.95, indicating strong class separability despite moderate class imbalance. Similar performance levels have been reported for gradient-boosting approaches applied to tool condition monitoring under variable machining conditions, often surpassing traditional neural networks in terms of robustness, convergence speed, and interpretability [19,20,50,51].
Table 7.
Comparative metrics used in the model.
While global accuracy exceeded 93% in all subsets, recall and F1-score are more relevant for predictive maintenance applications, as they quantify the model’s sensitivity to failure states under imbalanced datasets. The relatively stable recall observed across datasets confirms that the model preserves sensitivity to worn-tool detection when exposed to unseen data. This behavior is essential for avoiding missed detections that could lead to catastrophic tool failure, dimensional errors, or machine downtime [26,52,53].
The high KS values further confirm strong statistical separation between healthy and worn classes, reflecting well-defined decision boundaries. From an industrial standpoint, such statistical separation reduces the probability of false alarms while ensuring early detection of tool degradation, which is critical for closed-loop process control and autonomous machining systems [21,22,54].
Notably, the proposed framework achieves this performance using a single energetic signal, whereas most reported studies rely on multi-sensor architectures combining vibration, acoustic emission, current, and force signals, which significantly increase integration cost, data synchronization complexity, and maintenance overhead [26,52,55]. Recent investigations have demonstrated that power and current-based signals alone can provide competitive predictive performance when combined with robust feature engineering and ensemble learning techniques [56].
Rather than predicting force fluctuations alone, the proposed model is effectively learning the energetic signature of experimentally measured wear transitions. The monotonic increase in cutting power with VB, particularly after the mid-life stage, reflects: (1) increased flank contact length; (2) enhanced ploughing contribution; (3) reduced effective rake angle; and (4) greater frictional dissipation.
Therefore, Pc_Mean is not merely a statistical descriptor, but a physically grounded proxy of wear progression.
3.2.1. Feature Relevance and Physical Interpretation
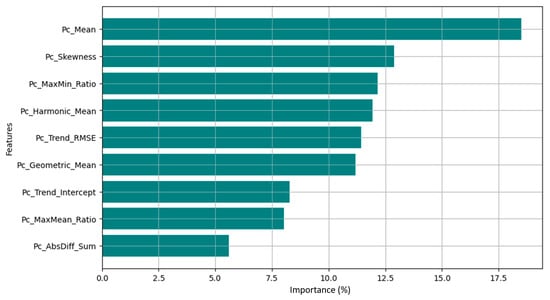
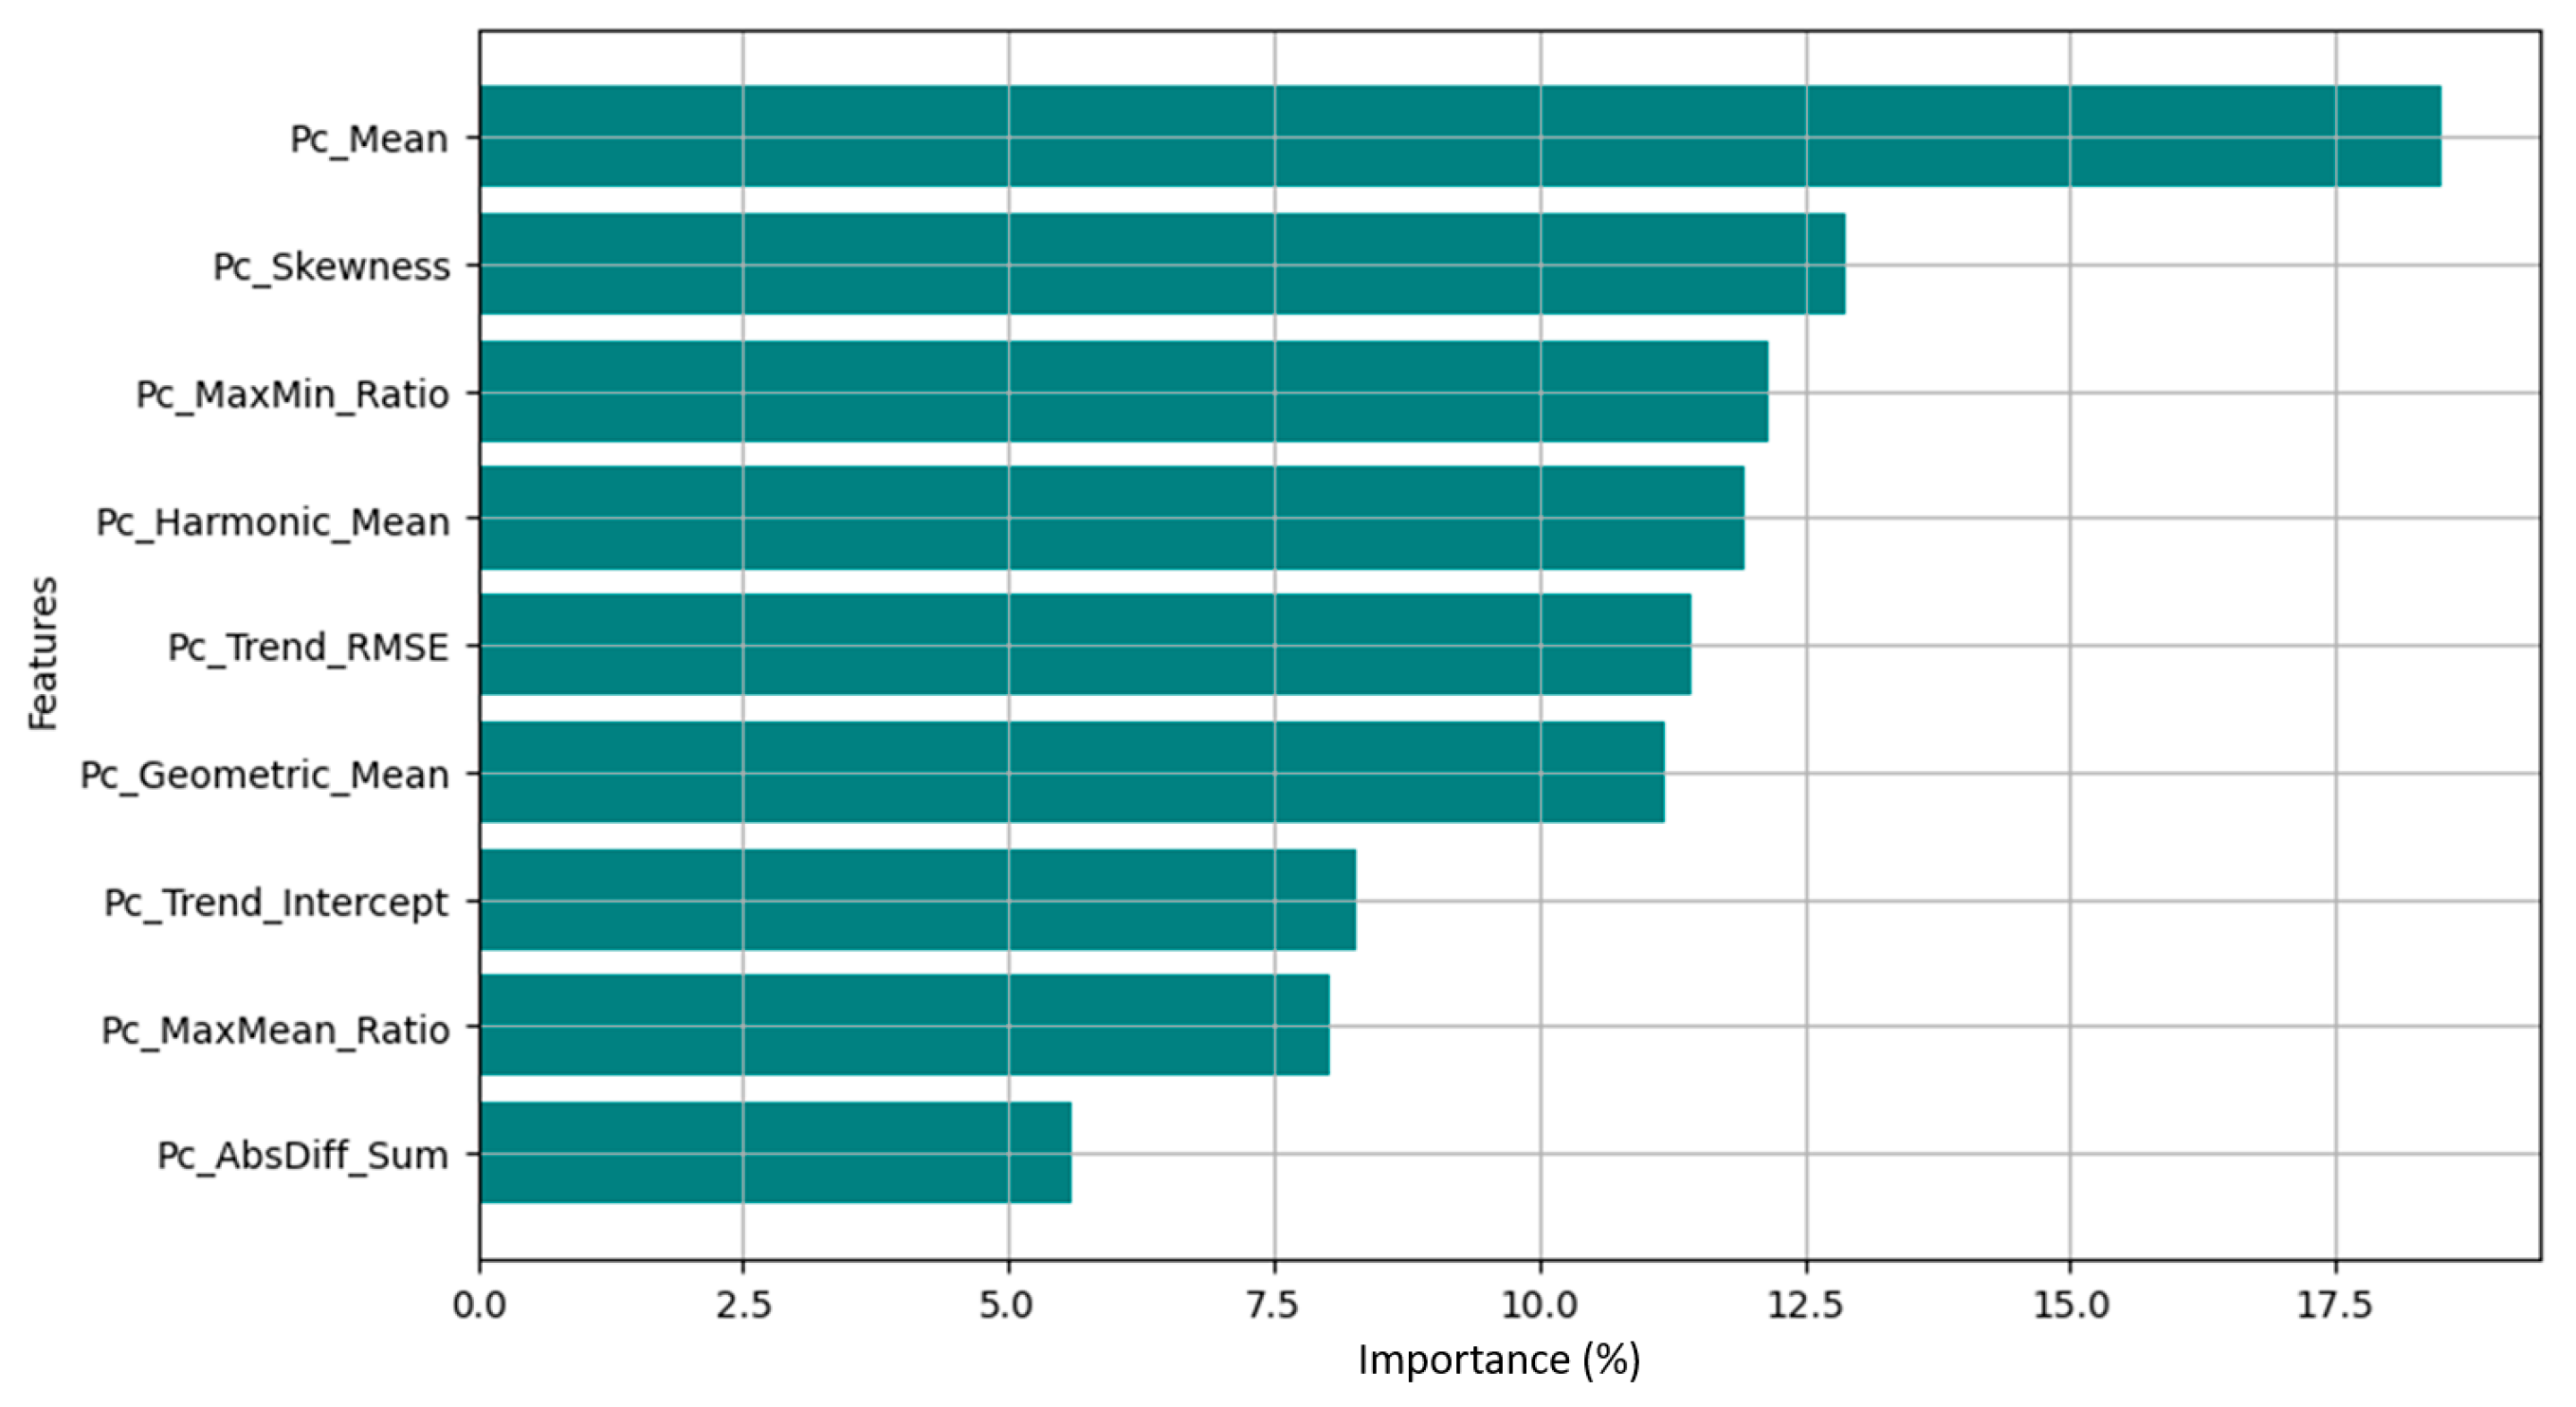
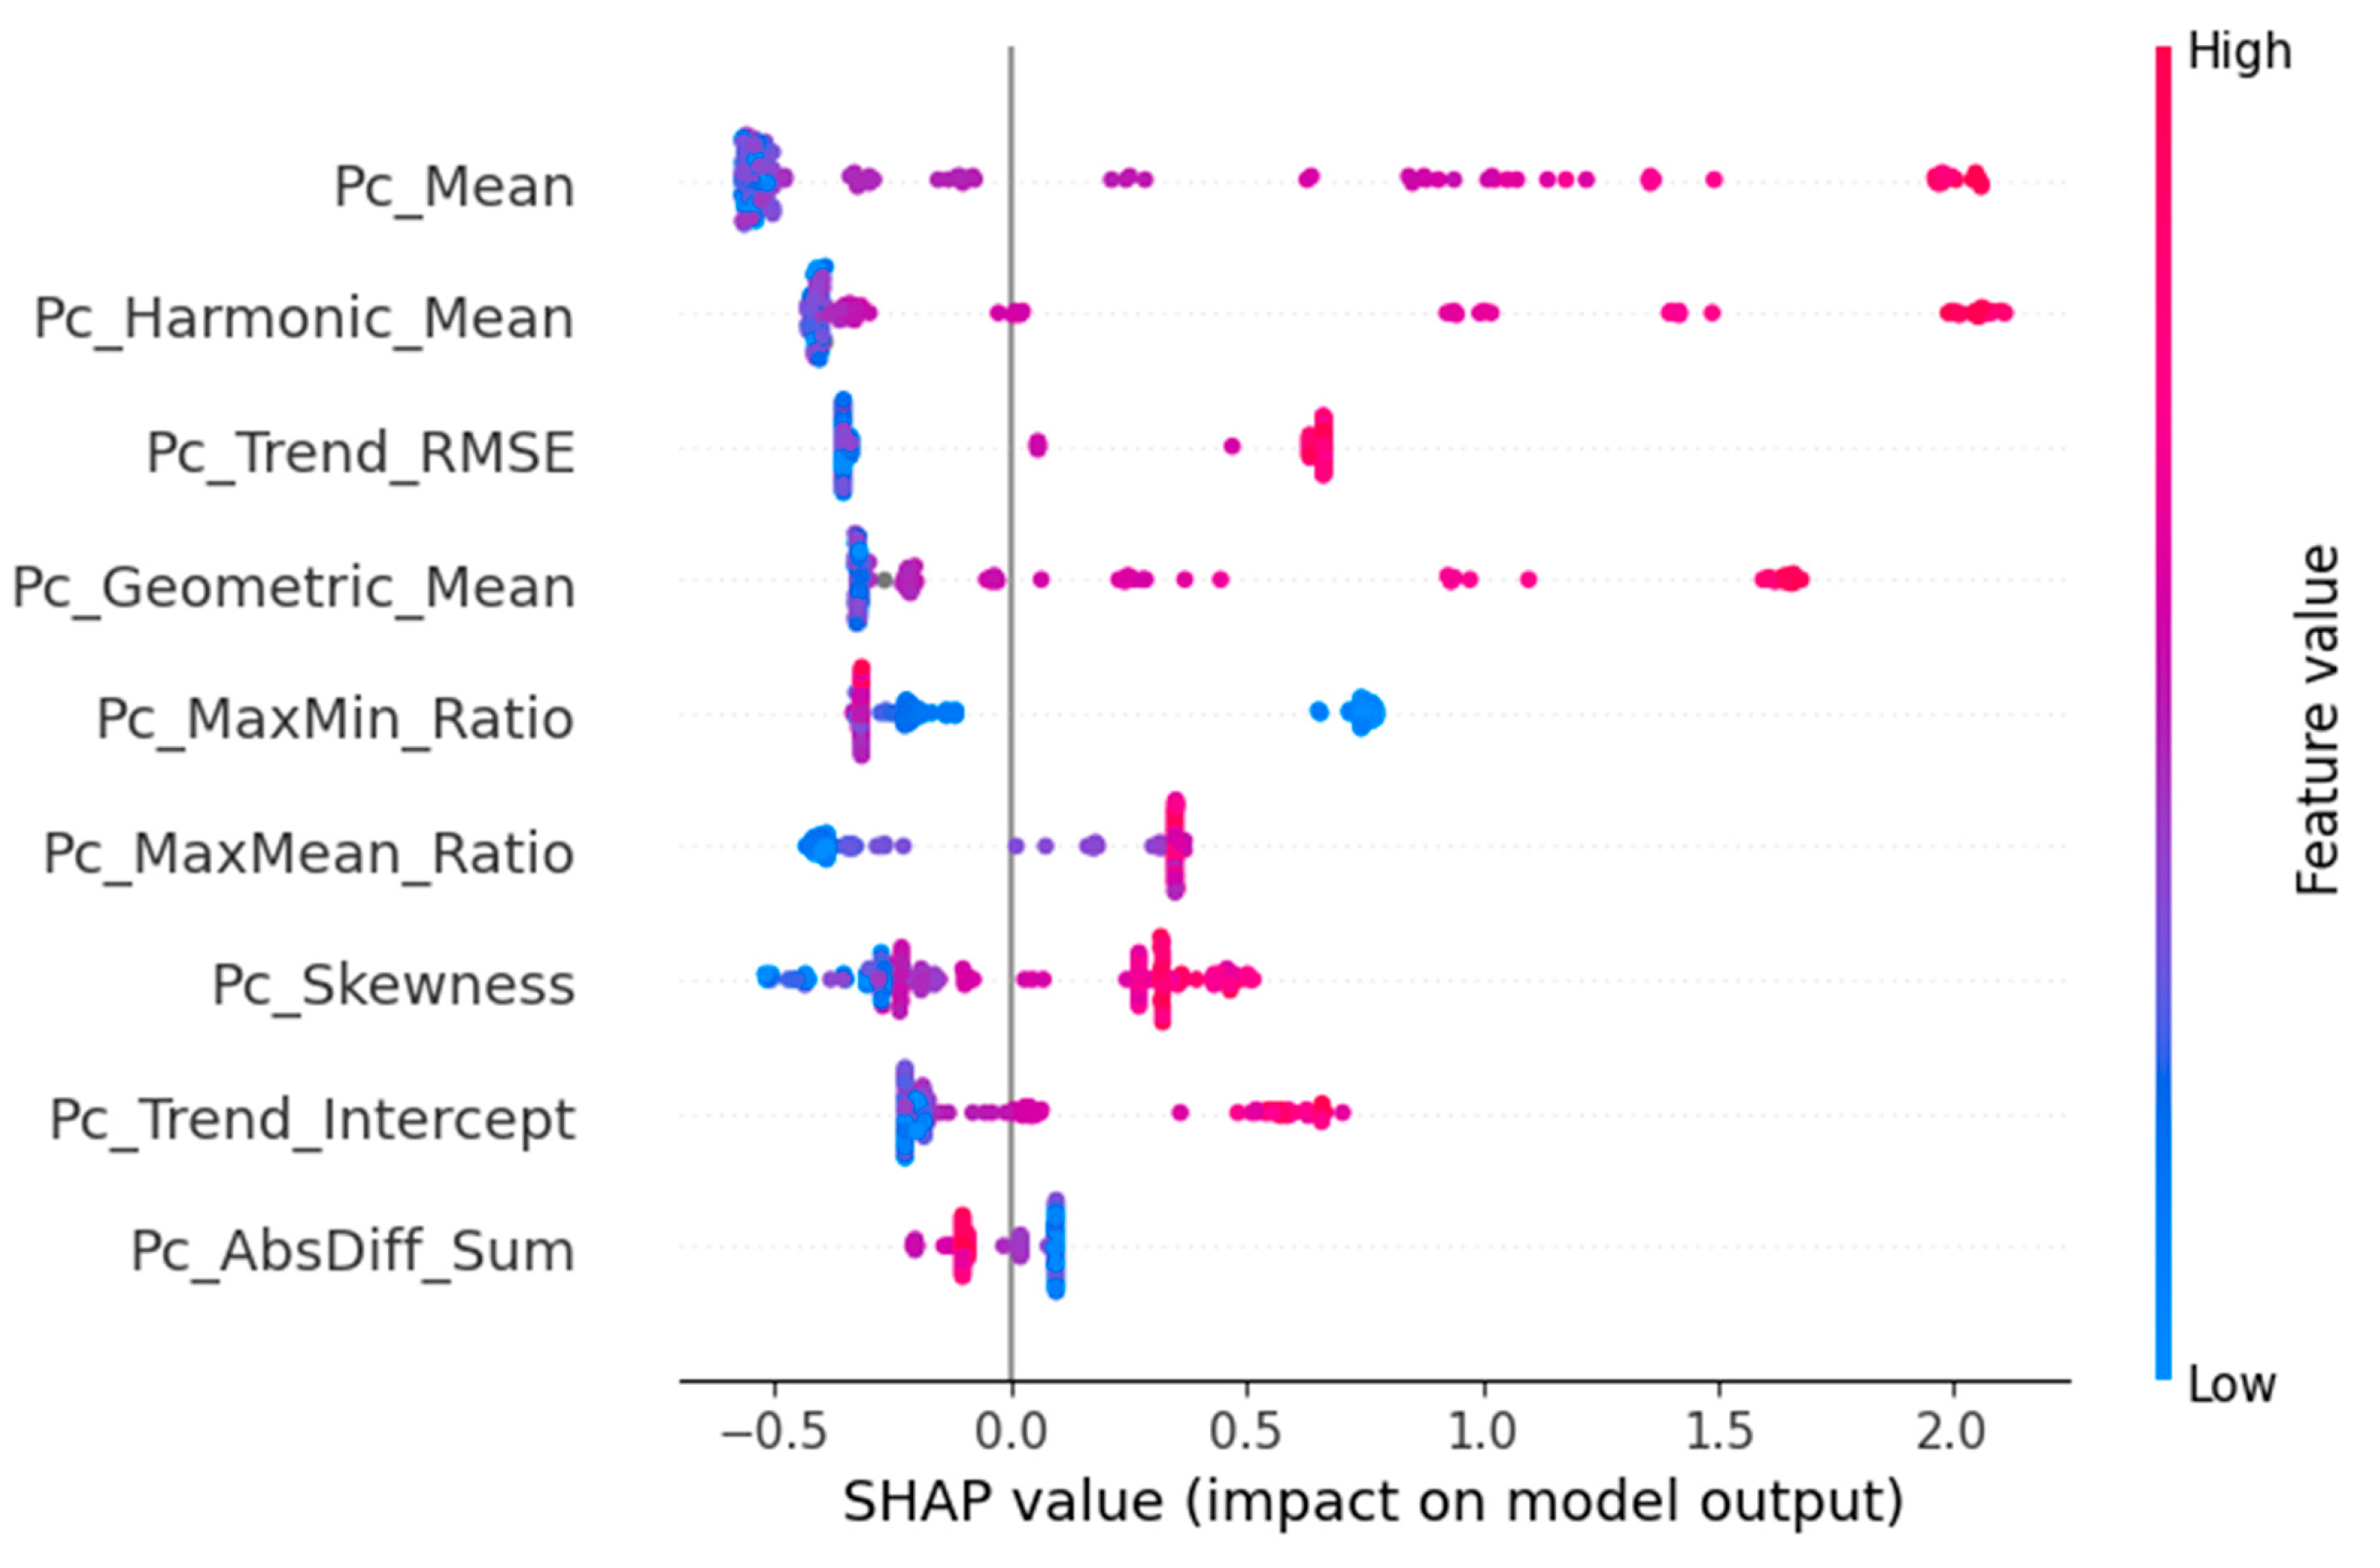
Figure 16 and Figure 17 present the global feature importance ranking and SHAP-based interpretability analysis, respectively. The average cutting power () emerged as the dominant predictor, reflecting the direct coupling between mechanical energy consumption and tool wear progression. As wear advances, the frictional contact area increases, the effective rake angle degrades, and ploughing contributions intensify, leading to a systematic rise in cutting power. This relationship has been consistently reported in power-based tool monitoring studies and is strongly correlated with flank wear and edge rounding dynamics [57,58].
Figure 16.
Important variables in the model.
Figure 17.
SHAP diagram of model variables.
Skewness () ranked among the most influential descriptors, indicating that asymmetry in the power distribution captures non-stationary behavior associated with intermittent adhesion, chip segmentation instability, and micro-chipping events. Higher-order statistical moments have been widely recognized as sensitive indicators of nonlinear dynamics and incipient instabilities in machining processes, including chatter onset and tool degradation [59,60].
Amplitude-related metrics such as the maximum-to-minimum ratio () and harmonic mean () exhibited significant relevance. These features quantify abrupt excursions and low-energy intermittency in the signal, which may arise from transient friction events, localized thermal fluctuations, or periodic chip adhesion-detachment cycles. Similar observations have been reported in studies correlating envelope statistics and peak ratios with tool damage progression and cutting instability [61,62].
Trend-based descriptors, including the root mean square error of the fitted trend (), capture the regularity of power evolution over time. Elevated values indicate nonlinear or unstable behavior, typically emerging during accelerated wear stages when diffusion, oxidation, and crater growth destabilize the tribological interface [5,32]. Lower-ranked features, such as trend intercept and cumulative absolute differences, appear to provide redundant information relative to more expressive global and distributional descriptors.
The convergence between XGBoost feature ranking and SHAP explanations enhances model transparency and supports physically interpretable decision-making. Explainable artificial intelligence (XAI) is increasingly regarded as a prerequisite for industrial certification, operator trust, and regulatory compliance in safety-critical manufacturing environments [21,22].
3.2.2. Generalization Across Cooling Strategies
A key contribution of this work is the intentional exclusion of the cooling strategy as an explicit model input. By training a single global classifier across dry, MQL, flood cooling, ICT, and ICT+MQL conditions, the model learned invariant energetic signatures associated with wear progression rather than condition-specific artifacts. This improves robustness and practical deployability, avoiding reliance on auxiliary metadata that may be unavailable, inconsistent, or difficult to integrate in real industrial environments.
Most existing studies validate predictive models under fixed lubrication regimes or narrowly controlled experimental setups [18,27,50]. Generalization across heterogeneous thermal management strategies remains limited in the literature, despite its importance for scalable industrial deployment. The present results demonstrate that cutting power alone retains sufficient information content to capture wear dynamics across diverse cooling environments, reinforcing the feasibility of simplified sensing architectures and unified monitoring pipelines [53,54].
3.2.3. Implications for Intelligent Machining and Sustainability
The combination of high predictive performance, strong interpretability, and minimal sensor dependency positions the proposed framework as a viable candidate for edge-level implementation in intelligent machining systems. Ensemble models such as XGBoost are computationally efficient, memory-light, and well-suited for embedded inference, enabling real-time monitoring without reliance on cloud infrastructure or high-bandwidth data transfer [19,20].
From a sustainability perspective, compatibility with advanced cooling strategies such as MQL and ICT supports the transition toward low-fluid and closed-loop thermal management without compromising monitoring reliability [48,49]. Reliable early detection of tool degradation enables optimized tool utilization, reduced scrap generation, lower rework rates, and improved energy efficiency, aligning with Industry 4.0 and sustainable manufacturing paradigms [53,54].
To evaluate the performance of the model, several metrics were used, including accuracy, precision, recall, F1 Score, AUC-ROC (Area under the Receiver Operator Characteristic curve) and KS (Kolmogorov–Smirnov). Table 7 shows the results found from the application of XGBoost followed by an RFECV.
| Accuracy | Precision | Recall | F1 | AUC-ROC | KS | |
| Training | 0.9647 | 0.92913 | 0.83098 | 0.8772 | 0.9877 | 0.8878 |
| Test | 0.95896 | 0.91667 | 0.804878 | 0.8571 | 0.9925 | 0.9403 |
| Validation | 0.93283 | 0.761905 | 0.80000 | 0.7804 | 0.9592 | 0.84738 |
Although accuracy is not the most appropriate metric in isolation to evaluate the performance of models in unbalanced problems, the results obtained were quite high in all the sets evaluated: 96.47% in training, 95.90% in the test and 93.28% in validation. These numbers indicate that the model was successful in correctly classifying most examples, even when exposed to data that was not used during training. The slight performance reduction in the test and validation sets is expected and shows that the model is not overly adjusted to the training set.
Precision, which measures the proportion of true positives among positive predictions, was 92.91 percent in training, 91.67 percent in the test, and 76.19 percent in validation. The steeper drop in validation may indicate that the model had greater difficulty maintaining the quality of positive predictions in completely new data, which may be a result of greater complexity or variability in these data.
Revocation, which represents the ability to identify all positive cases, remained more stable among the groups: 83.10% in training, 80.49% in the test and 80.00% in validation. These results suggest that the model maintains good sensitivity even outside the training set, managing to capture a consistent proportion of true positives.
The F1 score, a metric that represents the balance between accuracy and recall, was 87.73% in training, 85.71% in the test and 78.05% in validation. These values reflect solid performance in the training and test sets, with a more significant reduction in validation, consistent with the observed behavior in accuracy.
The AUC-ROC metric, which evaluates the model's ability to distinguish between positive and negative classes regardless of the decision threshold, showed high values: 98.78% in training, 99.26% in the test, and 95.92% in validation. Even with a slight drop in validation, the value remains above 95.0%, which demonstrates an excellent capacity for discrimination in all sets.
Finally, the KS (Kolmogorov–Smirnov), which measures the separation between the distributions of the positive and negative classes, also had significant performances: 0.8879 in training, 94.04% in the test and 84.74% in validation. This indicates that the model continues to be able to distinguish well between classes, even in more challenging validation environments.
The graph in Figure 16 shows the importance of the model variables in order of importance, and the graph in Figure 17 shows the Shapley Additive Explanations (SHAP) diagram of the variables.
The analysis of the graphs reveals that the Pc_Mean variable, i.e., the average of the values captured during the machining process, was consistently the most relevant variable both in terms of global importance (XGBoost) and individual impact (SHAP values). SHAP values are a tool based on game theory that allows you to interpret machine learning models by attributing to each variable a local contribution to the prediction. This approach shows not only how much each variable influences the model’s output (magnitude), but also in which direction it impacts the prediction. In the case analyzed, as an example, high values of Pc_Mean and Pc_Skewness (features importances of XGBoost) are associated with increases in prediction (represented in red in the SHAP graphs), while low values (in blue) tend to reduce it.
The graph in Figure 16 reveals that the Pc_Mean variable, i.e., the average of the values captured during the machining process, was consistently the most relevant variable both in terms of global importance (XGBoost) and individual impact (SHAP values).
Asymmetry (Pc_Skewness) also appears with high relevance. Asymmetry measures the symmetry of the distribution of time series values and is associated with anomalous vibration patterns or non-uniform variations in the shear load. High asymmetry values indicate distortions in process stability, which can be predictive of tool defects or degradation [59].
The variables Pc_MaxMin_Ratio and Pc_Harmonic_Mean appear with significant contributions. The first quantifies the relative amplitude of the signal, and the second smooths the impact of extreme values, favoring the stability of time series with less variability. These parameters indicate rapid or abrupt variations in the process, which can often be associated with sudden changes in the machining of the material or failures in coolant.
The Pc_Trend_RMSE metric, which evaluates the mean square error of the trend, represents the regularity of the evolution of the process over time. High values indicate unpredictable, nonlinear fluctuations. Variables such as Pc_Trend_Intercept and Pc_AbsDiff_Sum showed a lower relative contribution. The first represents the starting point of the linear trend of the process, and its low importance suggests that the initial value of the time series does not contribute so much to the prediction of failures or deviations in the process. The second reflects the sum of the absolute differences between the consecutive points and may indicate local variability, but apparently, even though this variable was important, this metric had less influence on the model, perhaps because it is redundant compared to other, more global metrics such as skewness and RMSE.
As a conclusion, it was observed that the model is very sensitive to cutting forces, and the increase in the average (Pc_Mean) is strongly associated with a possible end of tool life, which makes this variable a critical indicator for continuous monitoring of the process. In addition, characteristics such as asymmetry (Pc_Skewness) and the ratio between maxima and minima (Pc_MaxMin_Ratio) also demonstrate high relevance, indicating that distortions in the distribution of data and abrupt variations in signal amplitude are potential signs of wear or instability. Variables such as Pc_Trend_RMSE and Pc_Harmonic_Mean reinforce this interpretation by pointing out that unpredictable fluctuations and smoothed extreme oscillations are equally relevant to predict anomalies. On the other hand, metrics such as Pc_Trend_Intercept and Pc_AbsDiff_Sum had a slighter impact, suggesting that the initial value of the trend and the local variation between consecutive points are not determinants in isolation, and are probably covered by broader variables. Thus, the model indicates that the stability and strength of the force signal are the main parameters to accurately estimate the behavior of the tool over time.
3.2.4. Industrial Implementation Considerations
Cutting power is attractive for industrial tool-condition monitoring because it can often be obtained directly from machine-tool controllers as spindle power or drive current, eliminating the need for dynamometers or additional multi-sensor hardware. In a practical deployment, power is sampled continuously and processed using a sliding window (e.g., 1 s windows updated at a chosen step size), from which the same statistical and trend features used in this study are computed and passed to the trained classifier for real-time inference. Tool-change decisions can be based either on the predicted class label or on the predicted probability of the worn class, enabling conservative early-warning thresholds that reduce the risk of missed detections. The present model is formulated as a binary end-of-life classifier using the adopted wear criterion (VB ≥ 0.6 mm). Extension to intermediate thresholds (e.g., VB = 0.3 mm) can be achieved by relabeling the dataset into multiple wear bands or reformulating the model as a regression on VB, while retaining the same feature pipeline. Changes in cutting parameters (Vc, f, ap) are expected to shift absolute power levels; therefore, broader multi-parameter validation (e.g., DOE-based expansion) and/or normalization/adaptation strategies are identified as necessary steps for future industrial-scale generalization.
From an industrial implementation perspective, the reliance on cutting power eliminates the need for intrusive and costly sensors, such as piezoelectric dynamometers, which are often impractical for shop-floor production. The cutting power signal can be acquired directly via the machine tool’s PLC or non-invasive current sensors. This compatibility, combined with the low computational overhead of the XGBoost model, facilitates the deployment of ‘Edge AI’ solutions directly on the machine controller. Consequently, the system supports real-time monitoring, ensuring that tool condition is continuously assessed with minimal latency, allowing for immediate reaction to safeguard the workpiece and machine integrity.
4. Conclusions
This study evaluated high-speed turning of AISI 304 stainless steel under five lubrication and cooling strategies (dry, flood cooling, MQL, internally cooled tooling—ICT, and ICT+MQL), integrating experimental analysis with an interpretable machine learning framework for tool end-of-life prediction based exclusively on cutting power.
Lubricated and internally cooled strategies significantly delayed the transition to accelerated wear, confirming the role of friction mitigation and localized thermal control in suppressing adhesive and diffusion-driven degradation mechanisms.
Dry cutting produced significantly higher cutting forces than all lubricated or cooled conditions, confirming the critical role of friction mitigation and thermal management at elevated cutting speeds. In contrast, MQL, flood cooling, ICT, and ICT+MQL exhibited statistically similar force levels, demonstrating that low-fluid and closed-loop cooling strategies can achieve mechanical performance comparable to conventional flood cooling. Material hardness heterogeneity also influenced force demand, with harder peripheral regions generating higher loads.
Cutting force increased monotonically with tool wear, reflecting progressive edge degradation and enhanced ploughing effects, validating cutting power as a reliable proxy for indirect tool condition monitoring.
The XGBoost-based model achieved high discriminative performance across training, testing, and validation datasets, despite moderate class imbalance and the absence of a cooling condition as an input feature. This confirms that invariant energetic signatures of wear can be learned across heterogeneous cooling environments using a single-sensor architecture.
SHAP analysis identified average cutting power as the dominant predictor, complemented by distributional and trend-based descriptors associated with signal instability and nonlinear behavior, providing physically interpretable decision logic suitable for industrial deployment.
Overall, the proposed framework enables low-cost, scalable, and sustainable tool condition monitoring compatible with advanced cooling technologies, supporting real-time decision-making in intelligent machining systems. Future work will extend the present framework using DOE (e.g., factorial or response-surface designs) to evaluate robustness across wider combinations of cutting speed, feed, and depth of cut, and to quantify the limits of generalization of power-based end-of-life prediction under varying thermal loads.
Finally, considering that alterations in process parameters (such as feed rate and cutting speed) by operators significantly affect the cutting power magnitude, future iterations of this framework will focus on validating the model under broader operating conditions. This will involve incorporating cutting parameters as input features or employing transfer learning techniques to ensure robustness across variable industrial regimes.
Author Contributions
P.H.P.F.: Writing—Review and Editing, Formal Analysis, and Visualization. G.H.N.F.: Writing—Review and Editing, Formal Analysis, and Visualization. L.M.Q.B.: Writing—Review and Editing, Formal Analysis, and Visualization. M.B.d.S.: Writing—Review and Editing, Formal Analysis, Visualization, and Supervision. P.S.M.: Review and Editing, Formal Analysis, Visualization, and Supervision. Á.R.M.: Writing—Review and Editing, Formal Analysis, and Visualization. A.H.: Review and Editing, Formal Analysis, and Visualization. All authors have read and agreed to the published version of the manuscript.
Funding
This study was funded by Tupy S.A. for providing the work material, Walter Tools for donating the tools, Nipo-Tec Ferramentas Industriais for designing and machining the channels of the ICTs inserts by REDM, and Brazilian research agencies CNPq, FAPEMIG and Coordenação de Aperfeiçoamento de Pessoal de Nível Superior-Brasil (CAPES)-Finance Code 001 for the financial support.
Data Availability Statement
The datasets obtained during the current work are available from the corresponding author upon request.
Acknowledgments
This work was supported by the Brazilian research agencies: Coordenação de Aperfeiçoamento de Pessoal de Nível Superior-Brasil (CAPES) (grant number 001, 2019), Conselho Nacional de Desenvolvimento Científico e Tecnológico (CNPq) (grant number 001, 2019), and Fundação de Amparo à Pesquisa do Estado de Minas Gerais (FAPEMIG) (grant number 001, 2019).
Conflicts of Interest
The authors have no financial or proprietary interests in any material discussed in this article. The authors declare no conflict of interest.
References and Note
- Houssein, J.; Pierre, T.; Courtois, M.; Carin, M. Thermal Diffusivity of Solid and Liquid 304 Stainless Steel, Iron, and Zirconium. Int. J. Thermophys. 2024, 45, 127. [Google Scholar] [CrossRef] [Scilit]
- Kalhor, A.; Sohrabi, M.J.; Sadeghpour, S.; Mobasheri, M.; Mirzadeh, H.; Rodak, K.; Mahmudi, R. Evaluation of the Work-Hardening Behavior of AISI 304L and AISI 904L Austenitic Stainless Steels by Miniature Testing Techniques. J. Mater. Eng. Perform. 2025, 35, 5091–5099. [Google Scholar] [CrossRef] [Scilit]
- Seid Ahmed, Y.; Fox-Rabinovich, G.; Mario Paiva, J.; Wagg, T.; Clarence Veldhuis, S. Effect of Built-up Edge Formation during Stable State of Wear in AISI 304 Stainless Steel on Machining Performance and Surface Integrity of the Machined Part. Materials 2017, 10, 1230. [Google Scholar] [CrossRef] [Scilit]
- Polo, S.; Rubio, E.M.; Marín, M.M.; Sáenz de Pipaón, J.M. Evolution and Latest Trends in Cooling and Lubrication Techniques for Sustainable Machining: A Systematic Review. Processes 2025, 13, 422. [Google Scholar] [CrossRef] [Scilit]
- Chen, J.; Wang, Y.; Zhang, Y.; Yang, S.; Zhang, X. Investigation on Tool Wear Mechanism during Dry Cutting 304 Stainless Steel. Manuf. Technol. 2020, 20, 36–44. [Google Scholar] [CrossRef] [Scilit]
- Elmunafi, M.H.S.; Mohd Yusof, N.; Kurniawan, D. Effect of Cutting Speed and Feed in Turning Hardened Stainless Steel Using Coated Carbide Cutting Tool under Minimum Quantity Lubrication Using Castor Oil. Adv. Mech. Eng. 2015, 7, 1687814015600666. [Google Scholar] [CrossRef] [Scilit]
- Haldar, B.; Joardar, H.; Louhichi, B.; Alsaleh, N.A.; Alfozan, A. A Comparative Machinability Study of SS 304 in Turning under Dry, New Micro-Jet, and Flood Cooling Lubrication Conditions. Lubricants 2022, 10, 359. [Google Scholar] [CrossRef] [Scilit]
- Barbosa, L.M.Q.; França, P.H.P.; Fernandes, G.H.N.; Baldin, V.; Martins, P.S.; Machado, Á.R. Using the Chip-Tool Thermocouple Method to Measure the Temperature in the Milling of Inconel 718 under Different Lubri-Cooling Strategies. Int. J. Adv. Manuf. Technol. 2025, 140, 5435–5447. [Google Scholar] [CrossRef] [Scilit]
- Radchenko, I.; Takahashi, W.; Takahashi, H.; Sasahara, H. Internal Coolant Circulation-Based Tool Design to Reduce the Temperature and Heat Spreading When Turning SUS304 Stainless Steel. J. Adv. Mech. Des. Syst. Manuf. 2024, 18, JAMDSM0035. [Google Scholar] [CrossRef] [Scilit]
- Schwarz, M.; Dado, M.; Hnilica, R.; Veverková, D. Environmental and Health Aspects of Metalworking Fluid Use. Pol. J. Environ. Stud. 2015, 24, 37–45. [Google Scholar]
- Boswell, B.; Islam, M.N.; Davies, I.J.; Ginting, Y.R.; Ong, A.K. A Review Identifying the Effectiveness of Minimum Quantity Lubrication (MQL) during Conventional Machining. Int. J. Adv. Manuf. Technol. 2017, 92, 321–340. [Google Scholar] [CrossRef] [Scilit]
- Lopes, J.C.; Talon, A.G.; Rodrigues, M.d.S.; Moretti, G.B.; Machado, F.d.C.; de Souza, G.G.; Ribeiro, F.S.F.; Sanchez, L.E.d.A.; Bianchi, E.C. An Experimental Evaluation between Pure and Diluted MQL versus Flood Lubri-Cooling Focused on Cost and Environmental Impact. Int. J. Adv. Manuf. Technol. 2023, 129, 2691–2705. [Google Scholar] [CrossRef] [Scilit]
- Das, A. Evolution of Minimum Quantity Lubrication (MQL) as an Environmental Alternative: A Review. J. Mech. Eng. Adv. 2024, 1, 30–37. [Google Scholar] [CrossRef] [Scilit]
- Sun, X.; Bateman, R.; Cheng, K.; Ghani, S.C. Design and Analysis of an Internally Cooled Smart Cutting Tool for Dry Cutting. Proc. Inst. Mech. Eng. Part B J. Eng. Manuf. 2012, 226, 585–591. [Google Scholar] [CrossRef] [Scilit]
- Li, T.; Wu, T.; Ding, X.; Chen, H.; Wang, L. Experimental Study on the Performance of an Internal Cooled Turning Tool with Topological Channel. Int. J. Adv. Manuf. Technol. 2018, 98, 479–485. [Google Scholar] [CrossRef] [Scilit]
- Qiang, B.; Shi, K.; Liu, N.; Zhao, P.; Ren, J. Application of Cutting Power Consumption in Tool Condition Monitoring and Wear Prediction Based on Gaussian Process Regression under Variable Cutting Parameters. Int. J. Adv. Manuf. Technol. 2023, 124, 37–50. [Google Scholar] [CrossRef] [Scilit]
- Chen, S.; Yin, Z.; Zheng, L.; Yuan, J. Study of an ISSA-XGBoost Model for Milling Tool Wear Prediction under Variable Working Conditions. Int. J. Adv. Manuf. Technol. 2024, 133, 2761–2774. [Google Scholar] [CrossRef] [Scilit]
- Ya, L.I.; Yixiang, H.; Lujie, Z.; Chengliang, L. Multi-Condition Wear Evaluation of Tool Based on T-SNE and XGBoost. J. Mech. Eng. 2020, 56, 132–140. [Google Scholar] [CrossRef] [Scilit]
- Bentéjac, C.; Csörgő, A.; Martínez-Muñoz, G. A Comparative Analysis of Gradient Boosting Algorithms. Artif. Intell. Rev. 2021, 54, 1937–1967. [Google Scholar] [CrossRef] [Scilit]
- Tang, L. Comparison the Performances for Distributed Machine Learning: Evidence from XGboost and DNN. Appl. Comput. Eng. 2024, 103, 209–215. [Google Scholar] [CrossRef] [Scilit]
- Peng, Y.; Kang, W.; Yu, F.; Ding, Z.; Zhou, W.; Fu, J.; Hu, S. Edge Device Deployment for Intelligent Machine Tools: A Lightweight and Interpretable Tool Wear Monitoring Method Considering Wear Behavior. Robot. Comput. Integr. Manuf. 2025, 95, 103033. [Google Scholar] [CrossRef] [Scilit]
- Hirsch, E.; Friedrich, C. Data-Driven Tool Wear Prediction in Milling, Based on a Process-Integrated Single-Sensor Approach. arXiv 2024, arXiv:2412.19950. [Google Scholar]
- França, P.H.P.; Barbosa, L.M.Q.; Fernandes, G.H.N.; da Silva, L.R.R.; Machado, Á.R.; Martins, P.S.; da Silva, M.B. Thermal Analysis of a Proposed Internally Cooled Machining Tool System. Int. J. Adv. Manuf. Technol. 2022, 124, 2807–2821. [Google Scholar] [CrossRef] [Scilit]
- Korenkovs, A.; Gerins, E.; Kromanis, A. The Design and Performance of Internally Cooled Cutting Tools for Turning: A Literature Review. Latv. J. Phys. Tech. Sci. 2023, 60, 73–94. [Google Scholar] [CrossRef] [Scilit]
- Kai, X.U.; Yun, Y.; Wei, F.; Min, W.A.N. Internal Cooling Techniques in Cutting Process: A Review. J. Adv. Manuf. Sci. Technol. 2024, 4, 2024013. [Google Scholar] [CrossRef] [Scilit]
- Kasiviswanathan, S.; Gnanasekaran, S.; Thangamuthu, M.; Rakkiyannan, J. Machine-Learning-and Internet-of-Things-Driven Techniques for Monitoring Tool Wear in Machining Process: A Comprehensive Review. J. Sens. Actuator Netw. 2024, 13, 53. [Google Scholar] [CrossRef] [Scilit]
- Peng, Y.; Song, Q.; Wang, R.; Liu, Z.; Liu, Z. Intelligent Recognition of Tool Wear in Milling Based on a Single Sensor Signal. Int. J. Adv. Manuf. Technol. 2023, 124, 1077–1093. [Google Scholar] [CrossRef] [Scilit]
- Wang, Q.; Chen, X.; An, Q.; Chen, M.; Guo, H.; He, Y. A Tool Wear Prediction and Monitoring Method Based on Machining Power Signals. Int. J. Adv. Manuf. Technol. 2023, 129, 5387–5401. [Google Scholar] [CrossRef] [Scilit]
- Ceratizit CNMG.
- Kulkarni, A.P.; Joshi, G.G.; Sargade, V.G. Dry Turning of AISI 304 Austenitic Stainless Steel Using AlTiCrN Coated Insert Produced by HPPMS Technique. Procedia Eng. 2013, 64, 737–746. [Google Scholar] [CrossRef] [Scilit]
- Kulkarni, A.; Sargade, V.; More, C. Machinability Investigation of AISI 304 Austenitic Stainless Steels Using Multilayer AlTiN/TiAlN Coated Carbide Inserts. Procedia Manuf. 2018, 20, 548–553. [Google Scholar] [CrossRef] [Scilit]
- Patel, U.S.; Rawal, S.K.; Arif, A.F.M.; Veldhuis, S.C. Influence of Secondary Carbides on Microstructure, Wear Mechanism, and Tool Performance for Different Cermet Grades during High-Speed Dry Finish Turning of AISI 304 Stainless Steel. Wear 2020, 452, 203285. [Google Scholar] [CrossRef] [Scilit]
- Patel, U.; Rawal, S.; Bose, B.; Arif, A.F.M.; Veldhuis, S. Performance Evaluations of Ti-Based PVD Coatings Deposited on Cermet Tools for High-Speed Dry Finish Turning of AISI 304 Stainless Steel. Wear 2022, 492, 204214. [Google Scholar] [CrossRef] [Scilit]
- Grub, A.M. Avaliação Do Desempenho de Fluidos de Corte Contaminados No Processo de Torneamento Do Aço Inoxidável Austenítico V304UF. Masters’s Thesis, Universidade Federal de Uberlândia, Uberlândia, Brazil, 2013. [Google Scholar]
- França, P. Estudo Da Temperatura Em Ferramentas de Usinagem Com Canais de Refrigeração Internos No Torneamento Do Ferro Fundido Cinzento. Master’s Thesis, Universidade Federal de Uberlândia, Uberlândia, Brazil, 2021. [Google Scholar]
- Uysal, A.; Demiren, F.; Altan, E. Applying Minimum Quantity Lubrication (MQL) Method on Milling of Martensitic Stainless Steel by Using Nano MoS2 Reinforced Vegetable Cutting Fluid. Procedia-Social Behav. Sci. 2015, 195, 2742–2747. [Google Scholar] [CrossRef] [Scilit]
- Barbosa, L.M.Q.; França, P.H.P.; Fernandes, G.H.N.; da Silva, L.R.R.; Martins, P.S.; Machado, Á.R. Tool Life and Wear Mechanisms in the Milling of Inconel 718 under Different Cooling Strategies. Int. J. Adv. Manuf. Technol. 2025, 141, 2219–2233. [Google Scholar] [CrossRef] [Scilit]
- Wu, X.; Li, L.; He, N.; Hao, X.; Yao, C.; Zhong, L. Investigation on the Ploughing Force in Microcutting Considering the Cutting Edge Radius. Int. J. Adv. Manuf. Technol. 2016, 86, 2441–2447. [Google Scholar] [CrossRef] [Scilit]
- Bedi, S.S.; Behera, G.C.; Datta, S. Effects of Cutting Speed on MQL Machining Performance of AISI 304 Stainless Steel Using Uncoated Carbide Insert: Application Potential of Coconut Oil and Rice Bran Oil as Cutting Fluids. Arab. J. Sci. Eng. 2020, 45, 8877–8893. [Google Scholar] [CrossRef] [Scilit]
- Rosa, G.C.; Souza, A.J. Estudo Comparativo Das Ferramentas Alisadora e Convencional Através Das Forças e Rugosidades Resultantes Do Processo de Torneamento de Acabamento Do Aço Inoxidável AISI 420C. In Proceedings of the 8th Congresso Nacional de Engenharia Mecânica (CONEM 2014), Uberlândia, Brazil, 10–14 August 2014; pp. 10–15. [Google Scholar]
- Fernandes, G.H.N.; Ferreira, E.R.; França, P.H.P.; Barbosa, L.M.Q.; Filho, E.B.; Martins, P.S.; Machado, Á.R. Internally Cooled Tools as an Innovative Solution for Sustainable Machining: Temperature Investigation Using Inconel 718 Superalloy. CIRP J. Manuf. Sci. Technol. 2024, 50, 269–284. [Google Scholar] [CrossRef] [Scilit]
- Cicka, M.; Turisova, R.; Koca, F.; Pacaiova, H. Machining of Austenitic Stainless Steels—The Influence of Various Factors on the Machining Result. Acta Mech. Slovaca 2023, 27, 18–26. [Google Scholar] [CrossRef] [Scilit]
- Aşcıoğlu, M.; Boy, M. Machining Characteristics Investigations of Duplex Stainless Steel by Considering Dual Effect of Chip Breaker and Cooling Conditions. Proc. Inst. Mech. Eng. Part C J. Mech. Eng. Sci. 2022, 236, 7885–7898. [Google Scholar] [CrossRef] [Scilit]
- Fernandes, G.H.N.; Barbosa, L.M.Q. Machining Cooling Techniques: An Introduction, 1st ed.; Even3: Recife, Brazil, 2022; ISBN 978-65-5941-617-2. [Google Scholar]
- Balasuadhakar, A.; Kumaran, S.T.; Ahmed, F. A Review on the Role of Nanoparticles in MQL Machining. Mater. Today Proc. 2023, 72, 2828–2832. [Google Scholar] [CrossRef] [Scilit]
- de Carvalho, P.P.; Fernandes, G.H.N.; Barbosa, L.M.Q.; de Sousa, J.A.G.; Martins, P.S.; Ba, E.C.T.; Machado, Á.R. Different Cooling Strategies Applied during the Process of Aluminum Alloy Boring. Int. J. Adv. Manuf. Technol. 2023, 128, 563–579. [Google Scholar] [CrossRef] [Scilit]
- Fernandes, G.H.N.; Bazon, V.T.; Barbosa, L.M.Q.; França, P.H.P.; da Silva, M.B.; Uddin, M.; Martins, P.S.; Machado, Á.R. Performance Comparison between Internally Cooled Tools and Flood Cooling during Grey Cast Iron Turning. J. Manuf. Process. 2023, 85, 817–831. [Google Scholar] [CrossRef] [Scilit]
- Fernandes, G.H.N.; Barbosa, L.M.Q.; França, P.H.P.; Ferreira, E.R.; Martins, P.S.; Machado, Á.R. Enhancing Sustainability in Inconel 718 Machining: Temperature Control with Internally Cooled Tools. Int. J. Adv. Manuf. Technol. 2024, 131, 2771–2789. [Google Scholar] [CrossRef] [Scilit]
- Fernandes, G.H.N.; Barbosa, L.M.Q. Machining Cooling Techniques; Even3 Publicações: Recife, Brazil, 2022; ISBN 978-65-5941-617-2. [Google Scholar]
- Lu, X.-L.; Hsu, H.-J.; Chou, C.-W.; Kung, H.T.; Lee, C.-H.; Cheng, S.-M. DeepMachining: Online Prediction of Machining Errors of Lathe Machines. arXiv 2024, arXiv:2403.16451. [Google Scholar] [CrossRef] [Scilit]
- Zhu, D.; Feng, X.; Xu, X.; Yang, Z.; Li, W.; Yan, S.; Ding, H. Robotic Grinding of Complex Components: A Step towards Efficient and Intelligent Machining–Challenges, Solutions, and Applications. Robot. Comput. Integr. Manuf. 2020, 65, 101908. [Google Scholar] [CrossRef] [Scilit]
- Teti, R.; Jemielniak, K.; O’Donnell, G.; Dornfeld, D. Advanced Monitoring of Machining Operations. CIRP Ann. 2010, 59, 717–739. [Google Scholar] [CrossRef] [Scilit]
- Lee, J.; Bagheri, B.; Kao, H.-A. A Cyber-Physical Systems Architecture for Industry 4.0-Based Manufacturing Systems. Manuf. Lett. 2015, 3, 18–23. [Google Scholar] [CrossRef] [Scilit]
- Tao, F.; Qi, Q.; Wang, L.; Nee, A.Y.C. Digital Twins and Cyber–Physical Systems toward Smart Manufacturing and Industry 4.0: Correlation and Comparison. Engineering 2019, 5, 653–661. [Google Scholar] [CrossRef] [Scilit]
- Jemielniak, K.; Arrazola, P.J. Application of AE and Cutting Force Signals in Tool Condition Monitoring in Micro-Milling. CIRP J. Manuf. Sci. Technol. 2008, 1, 97–102. [Google Scholar] [CrossRef] [Scilit]
- Maia, L.H.; Abrão, A.M.; Vasconcelos, W.L.; Júnior, J.L.; Fernandes, G.H.; Machado, Á.R. Enhancing Machining Efficiency: Real-Time Monitoring of Tool Wear with Acoustic Emission and STFT Techniques. Lubricants 2024, 12, 380. [Google Scholar] [CrossRef] [Scilit]
- Li, M.; Burzo, M. Tool Wear Monitoring Using Machine Learning. In Proceedings of the 2021 IEEE Canadian Conference on Electrical and Computer Engineering (CCECE), Virtual, 12–17 September 2021. [Google Scholar]
- Machado, Á.R.; Diniz, A.E. Tool Wear Analysis in the Machining of Hardened Steels. Int. J. Adv. Manuf. Technol. 2017, 92, 4095–4109. [Google Scholar] [CrossRef] [Scilit]
- Kounta, C.A.K.A.; Arnaud, L.; Kamsu-Foguem, B.; Tangara, F. Review of AI-Based Methods for Chatter Detection in Machining Based on Bibliometric Analysis. Int. J. Adv. Manuf. Technol. 2022, 122, 2161–2186. [Google Scholar] [CrossRef] [Scilit]
- Antoni, J. The Spectral Kurtosis: A Useful Tool for Characterising Non-Stationary Signals. Mech. Syst. Signal Process. 2006, 20, 282–307. [Google Scholar] [CrossRef] [Scilit]
- Pham, T.S.; Nguyen, D.H.; Phan, N.D.M. Acoustic Signal Based Tool Wear Monitoring Using a Computationally Efficient FFT-CNN-BiLSTM Architecture. Eng. Res. Express 2025, 7, 25562. [Google Scholar] [CrossRef] [Scilit]
- Dai, X.; Gao, Z. From Model, Signal to Knowledge: A Data-Driven Perspective of Fault Detection and Diagnosis. IEEE Trans. Ind. Inform. 2013, 9, 2226–2238. [Google Scholar] [CrossRef] [Scilit]



Disclaimer/Publisher’s Note: The statements, opinions and data contained in all publications are solely those of the individual author(s) and contributor(s) and not of MDPI and/or the editor(s). MDPI and/or the editor(s) disclaim responsibility for any injury to people or property resulting from any ideas, methods, instructions or products referred to in the content. |
© 2026 by the authors. Licensee MDPI, Basel, Switzerland. This article is an open access article distributed under the terms and conditions of the Creative Commons Attribution (CC BY) license.