Abstract
This study presents an experimental investigation of acoustic emission (AE) generated during gear tooth contact under various operating conditions. A specialized test rig was developed to measure the AE signals originating from the interaction between two large-scale involute gear teeth. The dimensions of these teeth facilitate a detailed examination of the AE waveform characteristics produced by the sliding–rolling motion inherent to this geometry. Experiments were conducted under three distinct conditions: defect-free teeth without lubrication, defect-free teeth with lubrication, and teeth with localized surface defect. Results indicate that defect-free gears exhibit stable and repeatable waveform behavior that correlates with the sliding speed between meshing teeth. Conversely, worn gear teeth produced significant changes in the AE response, characterized by increased localized amplitudes. Furthermore, the introduction of lubrication significantly altered the waveform patterns, obscuring the clear identification of the sliding–rolling motion. This research contributes to a deeper understanding of AE generation in gear transmissions through the high-resolution analysis of their characteristic waveforms.
1. Introduction
Acoustic Emission (AE) has proven to be a valuable tool for detecting faults in rotating machinery and various mechanical components. AE is based on the acquisition of acoustic waves emitted by a material or process in response to stimuli such as load application or crack propagation [1]. Because AE is highly sensitive to the internal energy changes within a system, it allows for the early detection of progressive fault modes such as bearing pitting, excessive friction, and gear tooth faults, among others. For instance, this technique has been successfully employed to identify pitting in individual bearing balls even at low rotational speeds [2,3]. In the case of gear transmissions, several authors have highlighted the potential of the AE technique for early fault detection, even when compared with traditional vibration analysis [4,5].
Numerous researchers have applied AE analysis to fault detection across diverse mechanical systems. Nirwan et al. [6] monitored the progression of defects in the outer race of cylindrical roller bearings, experimentally correlating signal amplitude with fault development. Similarly, Hou et al. [2] developed a theoretical model to predict defects in tapered roller bearings, achieving RMS values that closely aligned with experimental data. Beyond rotating machinery, Yu and Li [7] utilized AE to detect visually imperceptible gas leaks in pipelines. AlShorman et al. [8] reviewed the applicability of AE technique for fault detection in induction motors. As illustrated by these cases, AE emerges as a robust diagnostic alternative under varying speed and load conditions, particularly for faults that develop progressively. This is especially critical for industrial equipment requiring continuous operation, where failure progression is directly linked to remaining useful life.
A particularly critical application is gear fault detection, given the prevalence of gear systems in wind turbines, mining trucks, and heavy machinery. These systems are prone to mechanisms such as wear, pitting, surface fatigue, and fracture [9], all of which evolve progressively and are detectable through AE analysis. AE signals in these applications are generally classified into three types: burst-type (transient) signals, associated with crack initiation or propagation; continuous signals, related to phenomena such as friction generated by surface contact; and mixed signals [10].
Several studies have investigated AE sources and its characteristics within gear transmissions. Tan and Mba [11,12] conducted experimental tests using a lubricated gearbox, concluding that the primary AE source arises from asperity contact during the sliding and rolling of gear teeth. They proposed that while sliding generates continuous AE signals, pure rolling produces short-duration, high-amplitude bursts. This hypothesis suggests that bursts occur specifically at the pitch point, where contact transitions from mixed sliding–rolling to pure rolling and the friction force reverses direction. However, the rapid nature of meshing in standard gearboxes prevented a detailed validation of this hypothesis.
Subsequent research has explored the influence of operating conditions and defects on these signals. Toutountzakis et al. [13] demonstrated the effectiveness of AE for detecting the onset of pitting in spur gears but noted that lubricant temperature significantly influences the results. Eftekharnejad and Mba [14] measured AE in a gearbox to detect a defective tooth. The defect consisted of a substantial material removal. Their time-domain analysis showed that the AE signal amplitude increased markedly when the damaged tooth engaged in meshing. Loutas et al. [15] utilized time and frequency domain features to monitor crack propagation, also highlighting the impact of lubrication. Furthermore, Novoa and Vicuña [16] explored AE sources in planetary gearboxes, suggesting that asperity contact produces pressure disturbances in the lubricant film, leading to AE bursts. They confirmed that while both load and speed influence AE, load remains the dominant factor at low speeds. More recently, Caso et al. [17] monitored wear behavior in planetary gears, noting that while wave amplitude correlates with damage progression, sensor placement is a critical factor for data quality. Hamel et al. [18] employed AE to monitor lubricant film regimes in gear transmissions, demonstrating a clear relationship between the AE RMS value and the specific film thickness.
Despite these advancements, AE-based condition monitoring still faces significant challenges due to the complexity of AE sources and the high sensitivity of signals to machine-specific behavior. Specifically, the presence of burst-type signals even under healthy conditions—a phenomenon highlighted by Zhang et al. [19]—complicates the distinction between normal operation and fault-induced signals. Although many studies support the sliding–rolling hypothesis proposed by Tan and Mba as shown in [20], the evolution of the AE waveform along the complete contact path of a gear tooth pair remains insufficiently explored. The small scale of standard teeth and the high velocity of contact make it difficult to conclusively correlate the sliding–rolling transition with specific waveform characteristics.
In light of these limitations, the present work utilizes a specialized test rig designed to replicate the rolling–sliding conditions of gear tooth contact at a scale that allows for detailed waveform analysis. The design aims to amplify the contact behavior to distinguish between sliding, the transition to pure rolling, and the return to sliding. Although several studies on AE analysis in gear transmissions have been conducted, the main research gap addressed in this work is the detailed observation of AE waveforms during the sliding-to-rolling transition in the contact between involute gear teeth.
By using gear teeth with a sufficiently large involute profile, the study enables detailed signal segmentation according to the contact condition and shaft rotation angle. This experimental setup allows for visual analysis of the AE waveforms generated under several conditions, including healthy gears, lubricated gears and surface defect. While tribological characteristics such as lubricant film thickness and viscosity are known to influence gear contact dynamics, the primary objective of this experimental study is to establish a foundational understanding of macroscopic AE waveform behavior. To achieve this, the present work isolates the absolute presence or absence of those conditions.
2. Experimental Procedure
2.1. Geometry and Kinematics of Involute Gear Profiles
The involute of a circle is defined as the locus of points traced by the extremity of a taut string as it is unwound from a cylinder, known as the base circle. For a base circle with radius [m], the position of any point on the involute curve is expressed as a function of the roll angle [rad] (the unwinding angle in radians) as follows:
The distance r [m] from the center of the gear to a given point on the involute profile is a function of the roll angle . Applying the Pythagorean theorem to the parametric equations yields:
where x and y are the coordinates from the involute curve, both expressed in [m]. Alternatively, the radius may be expressed in terms of the local pressure angle [rad], which is defined as the angle between the line of action and the tangent to the circle at the point of contact:
For a meshing gear pair (designated 1 and 2) with centers and , contact is constrained to the line of action, which is defined by the common tangent to both base circles. A simplified schema of this geometry is illustrated in Figure 1. The radial distance from the center to the instantaneous contact point K is denoted as [m]. Defining g [m] as the coordinate along the line of action measured from the pitch point P, the relationship is expressed as follows:
where [m] represents the pitch radius of Gear 1, [rad] denotes the operating pressure angle at the pitch point, and g is the coordinate along the line of action measured from the pitch point to the point of contact, with positive values indicating the recess phase and negative values indicating the approach phase.
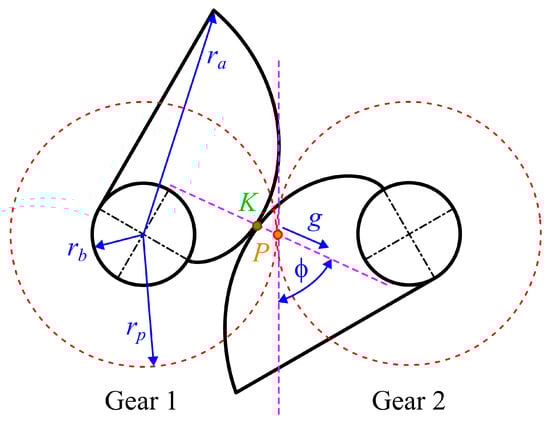
Figure 1.
Schema of involute gear profile meshing.
Contact is initiated at the intersection of the driven gear addendum circle with the line of action and terminates at the point where the driving gear addendum circle intersects the same line. The total length of the contact path along the line of action, Z [m], is defined by the sum of the approach path () and the recess path ():
By utilizing the geometric relationships between the addendum radius (), base radius (), and pitch radius (), the total length of the contact path along the line of action is expressed as follows:
The sliding velocity [m]/s results from the disparity between the tangential velocities of the two tooth profiles at the point of contact, except at the pitch point where they are equal, as illustrated in Figure 2. This is produced by the variable radius from the center of each gear to the point of contact.
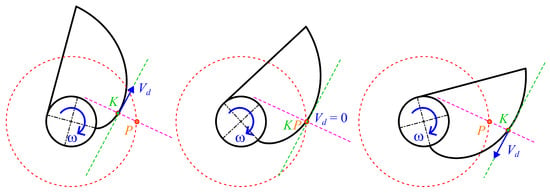
Figure 2.
Sliding speed during contact between involute gear profiles. Red: pitch circle; purple: line of action; green: normal to the line of action.
Given the angular velocity [rad/s] of driving Gear 1, the angular velocity [rad/s] for driven Gear 2 can be calculated as follows in the case of external gears:
The sign convention adopted defines a positive angular speed for the driving gear and a negative angular speed for the driven gear.
The sliding speed is defined as the absolute difference between their respective tangential components:
The sliding velocity can be expressed in terms of the instantaneous pressure angle of Gear 1 using:
Substituting Equation (10) into Equation (9), the sliding speed is expressed as a function of the profile angle is:
At the pitch point (), the sliding velocity vanishes (), indicating a condition of pure rolling contact. Conversely, the maximum sliding velocity occurs at the tip of the gear tooth, where reaches its maximum value.
The derivation of this general sliding speed equation relies strictly on the assumptions of rigid-body motion and single-tooth contact. Provided the instantaneous kinematic variables are known, this generalized model remains valid across any angular speed regime. The sign of the sliding speed is negative during approach phase since and positive during recess phase .
2.2. Design and Fabrication of Test Bench
The test rig was developed to amplify the contact behavior between two large-scale involute gear teeth, facilitating a high-resolution analysis of AE waveforms during sliding and rolling contact. Consequently, the following three criteria were adopted for the design process:
- A total contact path length of at least 100 mm along the line of action to allow for a detailed visual examination of the generated AE waveforms.
- The use of two identical gear teeth to simplify the manufacturing and assembly processes.
- The exclusion of electrical drives or motors to prevent electromagnetic interference or mechanical noise from contaminating the AE signals.
Following iterative design stages, the geometric parameters summarized in Table 1 were established for the experimental setup. In this table, the pitch point position is referenced to the rotational phase angle during the gear cycle.

Table 1.
Summary of geometric parameters for involute gear teeth.
This unconventional 65° pressure angle was deliberately chosen to enforce a strictly single-tooth engagement phase with large-scale teeth. Consequently, this specific configuration enables the high-resolution observation and accurate isolation of the fundamental AE waveforms generated by friction and localized defects along a single, continuous contact interface.
Figure 3 shows the technical drawing of the designed test rig. Its main components are two involute gear teeth (1) mounted on vertical shafts (2). A support structure (9) incorporating bearings (4) holds the assembly together. Pulleys (3) are mounted at the lower end of each shaft.
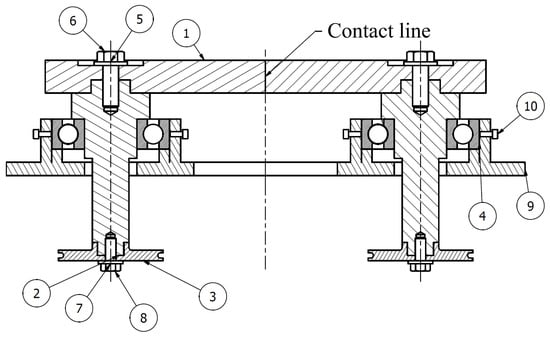
Figure 3.
Technical drawing from the designed test rig with its components: (1) gear tooth, (2) shaft, (3) pulley, (4) bearing, (5, 7) washers, (6, 8, 10) bolts, (9) support structure.
The constructed test rig is shown in Figure 4. The gear teeth were machined from AISI 1020 steel using a computer numerical control (CNC) process and were mounted onto a polyethylene support platform via conical bearings and custom-engineered shafts. To generate the driving torque without electrical interference, the setup incorporates a pulley system based on the Atwood machine principle. A torque imbalance is achieved by applying hanging weights to produce forces through . Both pulleys used in this mechanism have a diameter of 250 mm.
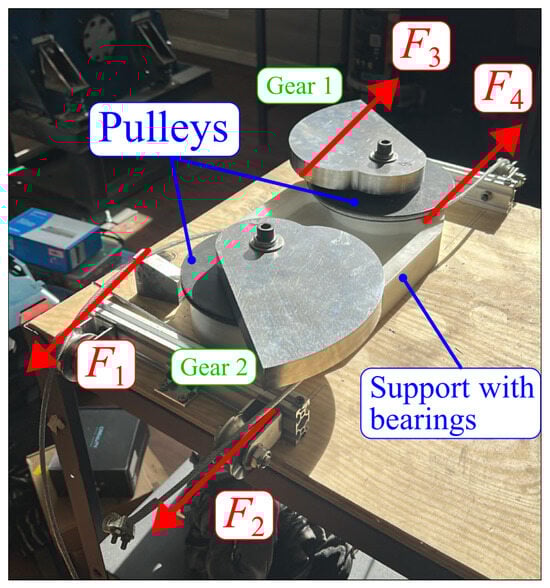
Figure 4.
Constructed test bench for involute gear profiles teeth meshing.
2.3. Instrumentation and Data Processing
Piezoelectric AE sensors (Vallen, model VS-375M (Wolfratshausen, Germany)) were mounted on each gear using magnetic holders. These are passive piezoelectric AE sensor that works in the mid-high frequency range with a resonant frequency at 375 kHz. The AE signals were amplified with a gain of 37 dB and digitized using an NI-9223 (NI, Austin, TX, USA) analog-to-digital (A/D) module at a sampling rate of 1 MHz. The digital signals were subsequently processed with a third-order high-pass filter with a cutoff frequency of 95 kHz. This filtering stage eliminates low-frequency noise from extraneous sources and ensures the analysis is focused on the optimal operating frequency range of the preamplifiers.
A specially designed rotary encoder was installed on the driven shaft to synchronize the AE measurements with the contact kinematics. The encoder was utilized to identify critical transition points during gear engagement: the initiation of contact, the pitch point, and the termination of contact. The corresponding angular positions of these points were marked with slots in a disc attached to the shaft. An optical sensor provided a boolean signal to identify the time at which these points entered the meshing. Furthermore, for experiments involving surface defects, an additional slot was introduced in the disc to mark the corresponding angular position of the fault, providing the temporal position at which the fault entered the meshing.
A schema of the measurement system is shown in Figure 5, while the physical arrangement of the AE sensors on the gears and the rotary encoder on the lower shaft is illustrated in Figure 6.
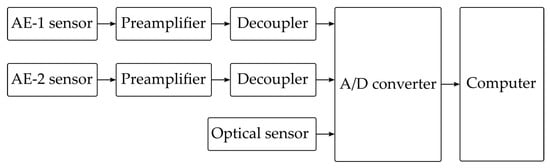
Figure 5.
Schema of the measurement system.
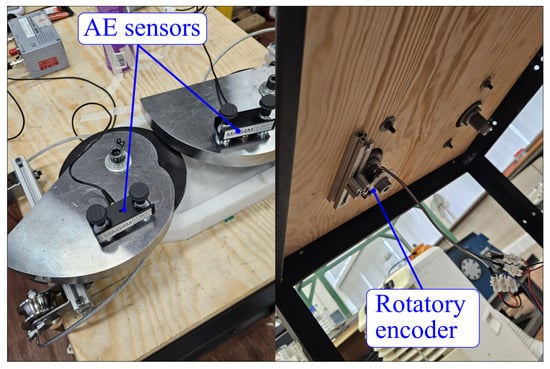
Figure 6.
Instrumented test bench with AE sensors and rotatory encoder. Top view on the right and bottom view on the left.
2.4. Conducted Experiments
Several gear tooth engagements were performed by applying the weight distribution specified in Table 2. Given the pulley diameters, these weights generated a total driving torque T of 3.1 Nm. Neglecting dynamic effects and changes in stiffness during contact, the tangential force and normal force were estimated using Equations (12) and (13):
Table 2.
Weight imbalance for producing rotation.
The resulting values were N and N.
Due to the resulting net torque, the system underwent constant angular acceleration during the measurements, causing the angular velocity to increase progressively throughout the tooth engagement period.
The AE signals generated by the gear tooth interaction were measured under four distinct experimental conditions:
- No gear contact (signal baseline).
- Dry contact without defects.
- Dry contact with a localized surface defect.
- Lubricated contact using multipurpose grease (EP 2).
The visual representation of each condition is provided in Figure 7. The surface defect was artificially introduced using a precision grinding tool to simulate localized wear. The defect was seeded on Gear 1 corresponding to the driving gear and sensor channel AE-1. The defect had a width of approximately 3 mm, a depth of approximately 1 mm and an irregular rectangular shape. For the lubricated case, a standard EP 2 multipurpose grease was applied to the contact surfaces to evaluate the influence of the lubricant film on the resulting AE waveforms.
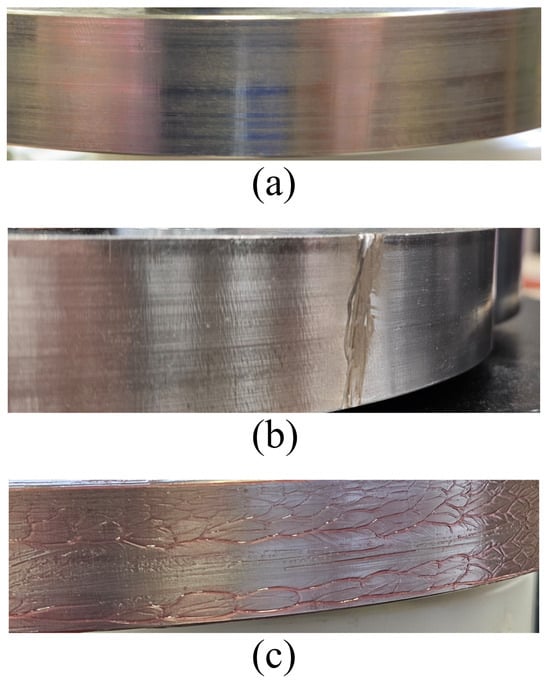
Figure 7.
Case studies: (a) Dry friction without defects. (b) Dry friction with a surface defect. (c) Lubricated friction with grease.
It should be noted that specific tribological characteristics, including lubricant film thickness, viscosity, and the precise lubrication regime were not directly measured or analyzed. Instead, the present work is intentionally limited to a macroscopic comparison between strictly dry and greased contact conditions in order to isolate their fundamental AE signatures. Detailed quantification and characterization of specific lubrication regimes fall outside the current experimental scope and are reserved for future studies.
For each experimental condition, five AE signal acquisitions were recorded per sensor to ensure statistical consistency. Although the weight configuration used to induce movement remained constant across repetitions, minor variations in the instantaneous rotational speed were expected between repetitions due to inherent system dynamics.
Because each experimental repetition lasted for less than two seconds and was followed by several minutes of preparation time for the next repetition, significant thermal buildup at the contact interface was prevented.
Prior to the measurements, the surface roughness was measured on both the healthy gear surfaces and directly over the surface defect. These measurements were conducted using a TIME 3221 roughness tester (Beijing Time Vision AI Instrument Ltd., Beijing, China), taking a total of 10 repetitions. Specifications of this instrument are found in [21]. The results indicated an average of 3.2 μm for the healthy surface and 51.1 μm for the surface defect. It is worth noting that the roughness measurements over the defect varied significantly depending on the orientation of the stylus. However, rather than obtaining a precise estimation of the defect’s roughness, the primary goal was to verify that the local roughness at the defect location was substantially higher than that of the surrounding intact surface.
2.5. Experimental Estimation of Sliding Speed
While the preceding theoretical model provides a general kinematic framework, the operational sliding speed during the experiments was derived directly from the rotary encoder measurements.
Based on the experimental configuration using hanging weights, the system is subjected to a constant net torque, resulting in a constant angular acceleration . The rotary encoder data provides total engagement time during experiments. Since the gear mesh starts from rest, the angular acceleration is derived from standard rotational kinematics:
Then, the instantaneous angular velocity at any given time t during the engagement cycle is calculated as:
For a gear pair operating under these single-tooth engagement conditions, the sliding speed at the contact interface is proportional to the rotational speed and the difference in the instantaneous radii of curvature of the contacting involute profiles. Let and represent the instantaneous radii for the driving and driven gears at the contact point, respectively. The sliding speed is formulated as:
This derivation allows for a dynamic, time-resolved estimation of the sliding speed directly from the macroscopic kinematic boundaries recorded by the rotary encoder.
3. Analysis of Results
3.1. Waveform Analysis
The results present the measured AE waveforms for each experimental case. Furthermore, the sliding velocity was determined using Equation (11), incorporating the instantaneous angular speeds derived from the rotary encoder data. The following figures illustrate five characteristic waveforms acquired simultaneously by both AE sensors for each condition.
Prior to the gear tooth engagement trials, baseline AE measurements were recorded to characterize the background noise. These baseline signals were acquired with the sensors installed on the gears in a non-contact state, with the entire measurement chain fully operational. The resulting baseline waveforms are presented in Figure 8.
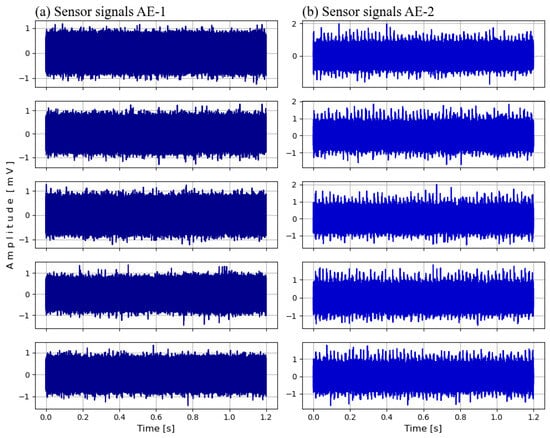
Figure 8.
Baseline AE waveforms measured without contact between gear teeth.
The results for the dry contact condition without defects are presented in Figure 9. The AE waveforms exhibit a characteristic hourglass-shaped envelope, which correlates closely with the magnitude of instantaneous sliding velocity between the involute profiles. In all instances, the signal energy reaches its minimum at the pitch point (indicated by the green shaded area), coinciding with the point of zero sliding velocity. No significant AE bursts were detected during these measurements; instead, the AE response is characterized primarily by continuous emission with distinct amplitude modulation.
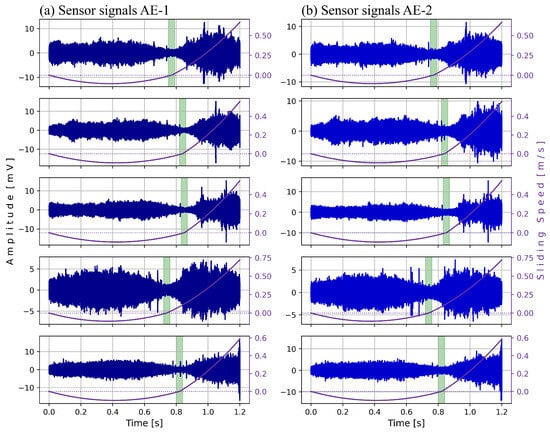
Figure 9.
AE waveforms for the case of dry friction without defects. The instant at which the contact reaches the pitch point is highlighted in green.
A comparison of the waveforms acquired by both sensors reveals high signal symmetry, with no significant discrepancies observed between the two measurement channels.
It was observed that the amplitudes of the AE waveforms were higher during the second half of the tooth engagement rather than the first. This is due to the constant angular acceleration experienced by the system, which produces a rapid increase in sliding speed after the pitch point.
The results for the dry contact condition with a localized surface defect are presented in Figure 10. In general terms, the characteristic hourglass-shaped envelope remains discernible; however, several discrete AE bursts were observed during the gear tooth interaction. These bursts do not exhibit a periodic pattern: while some align with the spatial position of the surface defect (red shaded area) or the pitch point (green shaded area), others appear stochastically across the contact path.
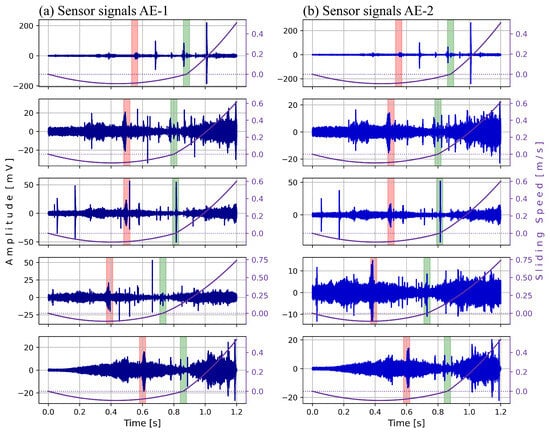
Figure 10.
AE waveforms for the case of dry friction with surface defect. The instant at which the contact reaches the pitch point is highlighted in green and the instant at which the contact reaches the defect position is highlighted in red.
At the specific instant the contact point traverses the defect, a broad AE burst—manifesting as a consistent increase in local amplitude—is observed across all recorded waveforms. This phenomenon is attributed to the localized increase in surface roughness at the site of the artificial defect. Conversely, the presence of other random AE bursts is likely caused by wear debris, originated from the fault site, entering the contact zone during engagement.
Although the surface defect was induced specifically on the driven gear (Gear 1), the resulting localized amplitude increase—manifesting as a broad AE burst—appears in the waveforms of both sensors with comparable magnitudes.
The results for the lubricated contact condition (without surface defects) are presented in Figure 11. In contrast to the dry friction cases, the hourglass-shaped envelope is almost entirely suppressed, with the AE response consisting primarily of discrete bursts superimposed on a low-amplitude continuous signal. These bursts occur at stochastic intervals and exhibit varying amplitudes. Furthermore, the overall signal amplitude levels are significantly lower than those recorded in the two previous experimental conditions.
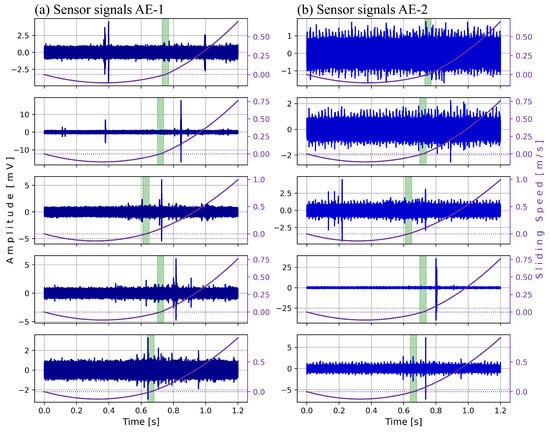
Figure 11.
AE waveforms for the case of lubricated friction. The instant at which the contact reaches the pitch point is highlighted in green.
Notably, the continuous component of the AE waveform in the lubricated case is nearly identical to the baseline AE signals shown in Figure 8, exhibiting similar amplitude levels. This suggests that the presence of the lubricant film effectively mitigates the continuous emission associated with asperity sliding.
3.2. Statistical Analysis
Sample statistical features were calculated for each AE signal acquired during the experiments, including the maximum amplitude, Root Mean Square (RMS) value, crest factor, and kurtosis. The RMS value serves as an indicator of the signal’s energy level, primarily associated with continuous AE. Conversely, the crest factor and kurtosis are used as indicators of the signal’s impulsiveness or peakedness, which is fundamentally related to the presence of AE bursts. Table 3 and Table 4 present the average values obtained for sensors AE-1 and AE-2, respectively; detailed values for each individual trial are provided in Appendix A.
Table 3.
Average sample statistic features for sensor AE-1.
Table 4.
Average sample statistic features for sensor AE-2.
The analysis of the results in Table 3 and Table 4 reveals several key trends. The RMS value is minimal for the baseline noise and shows only a marginal increase for the lubricated case. However, the RMS energy increases significantly for the dry contact condition and reaches its maximum in the case of the surface defect. Regarding the impulsiveness indicators, the crest factor and kurtosis are minimal for the baseline and exhibit a moderate increase for the healthy dry friction case. Notably, these values increase for the lubricated case—due to the emergence of discrete bursts—and reach their peak in the faulty dry friction case. These statistical trends are consistent across the signals recorded by both AE sensors.
Table 5 and Table 6 present the p-values derived from a significance analysis of the RMS values and crest factors, respectively. The analysis of crest factor was preferred over kurtosis due to its stability. The analysis was conducted by comparing pairs of experimental conditions using a one-tailed t-test for two samples assuming unequal variances, normal distributions, with a significance level () of 0.05.
Table 5.
p values of a one-tail t-test significance analysis of the RMS values.
Table 6.
p values of a one-tail t-test significance analysis of the crest factors.
Relative to the baseline, the increase in RMS energy is statistically significant for both the healthy and faulty dry friction cases. In contrast, the marginal increase in RMS for the lubricated case is significant only for sensor AE-1, failing to reach significance for AE-2. When compared to the healthy dry friction condition, the RMS increase for the faulty case is significant, while the reduction in RMS energy for the lubricated case is highly significant.
Regarding the signal impulsiveness, the increase in crest factors relative to the baseline for the healthy, faulty, and lubricated cases is significant only for sensor AE-1; for sensor AE-2, only the healthy dry friction case shows a significant increase. Furthermore, when compared directly to the healthy dry friction case, neither the faulty case nor the lubricated case shows a statistically significant increase in crest factor for either sensor.
4. Discussion
Experimental results under dry contact conditions confirm that AE waveforms generated during involute gear tooth interaction exhibit an hourglass-shaped envelope. This envelope correlates positively with the magnitude of the sliding velocity at the contact point; the variation in sliding speed dictates the rate of asperity contacts, thereby modulating the continuous AE signal. However, this characteristic morphology is fundamentally altered under lubricated conditions. The formation of a lubricant film prevents the majority of asperity contacts, effectively suppressing the AE energy levels and resulting in a near-flat continuous waveform. In this state, the AE response is limited to stochastic bursts that occur when the lubricant film thickness is insufficient to prevent localized asperity contact. Differences in the AE response between both sensors (see Figure 11) with respect to these stochastic bursts might be result of uneven lubrication condition between both gears. However, this must be studied in future research.
When measuring AE in complete gear transmissions, the hourglass-shaped envelope generated by individual tooth interactions should theoretically manifest as frequency components at the gear mesh frequency in the envelope spectrum. However, in practical applications involving standard-sized gears, this phenomenon may be less predominant due to the presence of lubrication, the overlapping signals from multiple teeth in contact, and the relatively short duration of the engagement cycle.
No significant signals or discrete AE bursts were consistently observed at the pitch point, where the contact condition is one of pure rolling. This observation challenges the established understanding of the origin of AE bursts in gear transmissions, as prior research has attributed their manifestation specifically to the rolling phase of the contact cycle [22]. These results suggest that the origin of such bursts may not be inherently linked to the transition in sliding–rolling friction at the pitch point, but rather to other dynamic phenomena occurring in full-scale gear transmissions. Nevertheless, this hypothesis should not be prematurely dismissed, and further experimental investigation is required to definitively assess its validity. Additional hypothesis to investigate in future work include: break of the lubricant film and the pitch point and impacts produced at gear tooth tip at the beginning of the meshing cycle.
As observed in the AE waveforms, the marked temporal positions corresponding to the pitch point exhibit slight deviations across different experimental repetitions. These minor discrepancies are attributed to two primary factors. First, small dynamic variations inevitably occur during the physical execution of each repetition. Second, the specially designed optical encoder possesses an inherent measurement uncertainty. These variations are within expected experimental margins of error and do not compromise the overall reliability of the conclusions.
The presence of a surface defect significantly alters the AE waveforms and the continuous emission levels, as primarily reflected by the RMS values. When the contact point traverses the fault, a broad AE burst—manifesting as a localized increase in amplitude—occurs consistently. This effect is a direct consequence of the heightened rate of asperity contacts at the position of the defect. This observation agrees with observations from other investigations conducted in regular gear transmissions with several teeth [14]. Furthermore, it is noteworthy that several discrete AE bursts were observed outside the specific interval of fault contact. These out-of-place bursts were observed to decrease in frequency across successive experimental repetitions. As hypothesis, we attributed this behavior to the initial release of wear debris from the artificial fault, which is most prevalent during the early stages of engagement and subsequently diminishes. However, this observation must be validated with further research.
While the specific gear geometry utilized in this study provides high-resolution AE waveforms by isolating the contact to a single pair of involute teeth, it is important to acknowledge differences between this experimental setup and actual engineering applications. In standard industrial spur gears the load alternates continuously between single-tooth and double-tooth meshing zones. This cyclic dynamic loading, combined with the impact shocks generated as successive teeth enter and exit the mesh, introduces complex, overlapping signals that heavily mask the fundamental friction-induced AE signals. Furthermore, in transmissions utilizing helical gears, the contact lines traverse diagonally across the tooth flank, and multiple teeth share the transmitted load simultaneously and gradually. This overlapping contact geometry generates a much more continuous and heavily compounded AE signature.
The application of the AE technique for condition monitoring and fault diagnosis in gear transmissions remains a promising development in predictive maintenance. However, its effective implementation necessitates a more profound understanding of the complex tribological interactions between meshing involute gear teeth, including the influence of lubrication regimes and specific fault morphologies. The individual contribution of each of these factors to the composite AE signal must be further isolated and quantified through continued systematic study.
Regarding fault detection from an engineering point of view, experimental results from this study and existing literature confirm that gear surface defects increase local asperity contact, resulting in a local amplitude increase in the AE signals. Even though this phenomenon would increase overall signal levels, such as the RMS value, many other factors also alter overall signal levels, such as changes in lubrication conditions, operating speeds, and loads. Because of this, local amplitude increases should be detected with signal processing tools such as envelope spectrum analysis to identify the amplitude modulations produced by the fault.
5. Conclusions
This study presented a high-resolution experimental analysis of AE waveforms generated during the meshing of large-scale involute gear teeth. By utilizing a specialized test rig that isolated the contact kinematics, we were able to correlate the AE waveforms directly with the sliding velocity and surface conditions. The following conclusions are drawn from this work:
- Strictly for dry contact, the AE waveform envelope exhibits a distinct hourglass shape that correlates positively with the magnitude of the instantaneous sliding velocity. The signal energy reaches its minimum at the pitch point, where pure rolling occurs, and increases toward the tooth tip and root where sliding is maximal. This provides experimental evidence that continuous AE in dry gears is primarily driven by asperity friction proportional to the sliding speed.
- The application of a lubricant film fundamentally alters the signal morphology, resulting in a flat, low-amplitude waveform comparable to the baseline noise. In this regime, our experimental results suggest that AE generation is governed by stochastic asperity contacts that breach the lubricant film rather than by the global sliding kinematics.
- A localized surface defect produces a consistent, broad AE burst when the contact point traverses the fault. This burst is attributed to the localized increase in surface roughness. Furthermore, the presence of stochastic, out-of-place bursts suggest that loose wear debris contributes to the transient AE signature in faulty gears. However, this observation must be confirmed with further research.
- Contrary to some established literature, no significant AE bursts were consistently observed in our experiments at the pitch point in healthy gears. This suggests that these bursts may originate from dynamic impacts or other system-level phenomena rather than the rolling contact mechanics itself.
It should be noted that waveform characteristics observed for defect-free gears are specific to the experimental dry contact conditions of this study. Future investigations exploring different gear geometries and diverse operating conditions are required to fully validate these findings.
Additionally, future work will focus on quantifying the relationship between the lubricant film thickness and the surface roughness of the gear teeth, including the effects of surface defects of different sizes.
Author Contributions
Conceptualization, F.L. and F.S.; methodology, F.L. and F.S.; software, F.L.; validation, F.L., F.S. and V.G.; formal analysis, F.L. and V.G.; investigation, F.L., F.S. and V.G.; resources, F.L.; data curation, F.L., F.S. and V.G.; writing—original draft preparation, F.L.; writing—review and editing, F.L.; visualization, F.L.; supervision, F.L.; project administration, F.L.; funding acquisition, F.L. All authors have read and agreed to the published version of the manuscript.
Funding
This research was funded by Chilean Agency of Research and Development (ANID) grant number FONDECYT Iniciación 11230222.
Data Availability Statement
The raw data supporting the conclusions of this article will be made available by the authors on request.
Conflicts of Interest
The authors declare no conflicts of interest.
Abbreviations
The following abbreviations are used in this manuscript:
| AE | Acoustic Emission |
| A/D | Analog to Digital |
| CNC | Computer Numeric Control |
| RMS | Root Mean Square |
Appendix A
Table A1.
Sample statistics for sensor AE-1 (detailed data).
Table A1.
Sample statistics for sensor AE-1 (detailed data).
| Case | Maximum | RMS Value | Crest Factor | Kurtosis |
|---|---|---|---|---|
| Baseline | 1.25 | 0.24 | 5.14 | 3.02 |
| Baseline | 1.31 | 0.24 | 5.40 | 3.02 |
| Baseline | 1.27 | 0.24 | 5.27 | 3.02 |
| Baseline | 1.48 | 0.25 | 5.99 | 3.04 |
| Baseline | 1.41 | 0.24 | 5.85 | 3.02 |
| Dry healthy | 12.60 | 1.30 | 9.68 | 5.59 |
| Dry healthy | 17.17 | 1.32 | 13.03 | 5.58 |
| Dry healthy | 16.85 | 1.20 | 14.08 | 6.40 |
| Dry healthy | 7.38 | 1.09 | 6.80 | 4.04 |
| Dry healthy | 17.12 | 1.26 | 13.57 | 5.97 |
| Dry faulty | 219.17 | 2.80 | 78.34 | 401.00 |
| Dry faulty | 33.79 | 2.02 | 16.74 | 9.85 |
| Dry faulty | 56.33 | 1.82 | 30.93 | 21.78 |
| Dry faulty | 53.10 | 1.54 | 34.51 | 7.55 |
| Dry faulty | 26.86 | 1.78 | 15.11 | 10.32 |
| Lubricated | 4.55 | 0.26 | 17.32 | 6.29 |
| Lubricated | 17.81 | 0.33 | 54.42 | 155.73 |
| Lubricated | 6.06 | 0.27 | 22.80 | 6.06 |
| Lubricated | 6.07 | 0.27 | 22.51 | 7.98 |
| Lubricated | 3.27 | 0.26 | 12.48 | 3.46 |
Table A2.
Sample statistics for sensor AE-2 (detailed data).
Table A2.
Sample statistics for sensor AE-2 (detailed data).
| Case | Maximum | RMS Value | Crest Factor | Kurtosis |
|---|---|---|---|---|
| Baseline | 1.98 | 0.26 | 7.74 | 3.20 |
| Baseline | 1.84 | 0.26 | 7.02 | 3.26 |
| Baseline | 2.01 | 0.25 | 8.00 | 3.18 |
| Baseline | 1.82 | 0.25 | 7.23 | 3.20 |
| Baseline | 1.80 | 0.25 | 7.13 | 3.20 |
| Dry healthy | 11.51 | 1.09 | 10.55 | 5.47 |
| Dry healthy | 10.53 | 1.11 | 9.53 | 5.47 |
| Dry healthy | 15.31 | 1.00 | 15.27 | 6.44 |
| Dry healthy | 7.28 | 0.91 | 7.99 | 4.02 |
| Dry healthy | 14.55 | 1.08 | 13.53 | 6.92 |
| Dry faulty | 265.12 | 2.35 | 113.00 | 1044.83 |
| Dry faulty | 22.79 | 1.66 | 13.73 | 8.25 |
| Dry faulty | 51.87 | 1.50 | 34.69 | 22.32 |
| Dry faulty | 14.83 | 1.28 | 11.59 | 6.01 |
| Dry faulty | 22.13 | 1.46 | 15.14 | 9.54 |
| Lubricated | 1.82 | 0.26 | 7.11 | 3.29 |
| Lubricated | 2.52 | 0.26 | 9.71 | 3.38 |
| Lubricated | 4.47 | 0.27 | 16.71 | 4.89 |
| Lubricated | 39.57 | 0.59 | 66.96 | 440.73 |
| Lubricated | 7.24 | 0.27 | 26.86 | 8.33 |
References
- de la Selle, T.; Réthoré, J.; Weiss, J.; Lachambre, J.; Deschanel, S. Signatures of fatigue crack growth from acoustic emission repeaters. Eng. Fract. Mech. 2024, 309, 110388. [Google Scholar] [CrossRef]
- Hou, D.; Qi, H.; Li, D.; Wang, C.; Han, D.; Luo, H.; Peng, C. High-speed train wheel set bearing fault diagnosis and prognostics: Research on acoustic emission detection mechanism. Mech. Syst. Signal Process. 2022, 179, 109325. [Google Scholar] [CrossRef]
- Liu, Z.; Wang, X.; Zhang, L. Fault Diagnosis of Industrial Wind Turbine Blade Bearing Using Acoustic Emission Analysis. IEEE Trans. Instrum. Meas. 2020, 69, 6630–6639. [Google Scholar] [CrossRef]
- Elasha, F.; Greaves, M.; Mba, D.; Fang, D. A comparative study of the effectiveness of vibration and acoustic emission in diagnosing a defective bearing in a planetry gearbox. Appl. Acoust. 2017, 115, 181–195. [Google Scholar] [CrossRef]
- Leaman, F.; Baltes, R.; Clausen, E. Comparative case studies on ring gear fault diagnosis of planetary gearboxes using vibrations and acoustic emissions. Forsch. Ingenieurwesen 2021, 85, 619–628. [Google Scholar] [CrossRef]
- Nirwan, N.; Ramani, H. Condition monitoring and fault detection in roller bearing used in rolling mill by acoustic emission and vibration analysis. Mater. Today Proc. 2021, 51, 344–354. [Google Scholar] [CrossRef]
- Yu, L.; Li, S. Acoustic emission (AE) based small leak detection of galvanized steel pipe due to loosening of screw thread connection. Appl. Acoust. 2017, 120, 85–89. [Google Scholar] [CrossRef]
- AlShorman, O.; Alkahatni, F.; Masadeh, M.; Irfan, M.; Glowacz, A.; Althobiani, F.; Kozik, J.; Glowacz, W. Sounds and acoustic emission-based early fault diagnosis of induction motor: A review study. Adv. Mech. Eng. 2021, 13, 1–19. [Google Scholar] [CrossRef]
- Mohammed, O.D.; Rantatalo, M. Gear fault models and dynamics-based modelling for gear fault detection—A review. Eng. Fail. Anal. 2020, 117, 104798. [Google Scholar] [CrossRef]
- Leaman, F.; Vicuña, C.M.; Baltes, R.; Clausen, E. Pattern recognition approach for acoustic emission burst detection in a gearbox under different operating conditions. J. Vib. Control 2019, 25, 2295–2304. [Google Scholar] [CrossRef]
- Keong, C.; Mba, D. Identification of the acoustic emission source during a comparative study on diagnosis of a spur gearbox. Tribol. Int. 2005, 38, 469–480. [Google Scholar] [CrossRef]
- Tan, C.; Mba, D. Correlation between acoustic emission activity and asperity contact during meshing of spur gears under partial elastohydrodynamic lubrication. Tribol. Lett. 2005, 20, 63–67. [Google Scholar] [CrossRef]
- Toutountzakis, T.; Tan, C.K.; Mba, D. Application of acoustic emission to seeded gear fault detection. NDT E Int. 2005, 38, 27–36. [Google Scholar] [CrossRef]
- Eftekharnejad, B.; Mba, D. Seeded fault detection on helical gears with acoustic emission. Appl. Acoust. 2009, 70, 547–555. [Google Scholar] [CrossRef]
- Loutas, T.; Sotiriades, G.; Kalaitzoglou, I.; Kostopoulos, V. Condition monitoring of a single-stage gearbox with artificially induced gear cracks utilizing on-line vibration and acoustic emission measurements. Appl. Acoust. 2009, 70, 1148–1159. [Google Scholar] [CrossRef]
- Novoa, A.; Vicuña, C. New aspects concerning the generation of acoustic emissions in spur gears, the influence of operating conditions and gear defects in planetary gearboxes. Insight Non Destr. Test. Cond. Monit. 2016, 58, 18–27. [Google Scholar] [CrossRef]
- Caso, E.; del Rincon, A.F.; Garcia, P.; Diez-Ibarbia, A.; Sanchez-Espiga, J. An experimental study of acoustic emissions from active surface degradation in planetary gears. Mech. Syst. Signal Process. 2023, 189, 110090. [Google Scholar] [CrossRef]
- Hamel, M.; Addali, A.; Mba, D. Employing Acoustic Emission for Monitoring Oil Film Regimes. Lubricants 2013, 1, 61–74. [Google Scholar] [CrossRef]
- Zhang, L.; Ozevin, D.; Hardman, W.; Timmons, A. Acoustic Emission Signatures of Fatigue Damage in Idealized Bevel Gear Spline for Localized Sensing. Metals 2017, 7, 242. [Google Scholar] [CrossRef]
- Leaman, F.; Vicuña, C.M.; Clausen, E. A Review of Gear Fault Diagnosis of Planetary Gearboxes Using Acoustic Emissions. Acoust. Aust. 2021, 49, 265–272. [Google Scholar] [CrossRef]
- Surface Roughness Tester TIME®3221. 2026. Available online: https://www.tgindt.com/product/Surface-Roughness-Tester-TIME%C2%AE3221-5.html (accessed on 26 February 2026).
- Tan, C.; Mba, D. Experimentally established correlation between acoustic emission activity, load, speed, and asperity contact of spur gears under partial elastohydrodynamic lubrication. Proc. Inst. Mech. Eng. Part J Eng. Tribol. 2005, 219, 401–409. [Google Scholar] [CrossRef]


Disclaimer/Publisher’s Note: The statements, opinions and data contained in all publications are solely those of the individual author(s) and contributor(s) and not of MDPI and/or the editor(s). MDPI and/or the editor(s) disclaim responsibility for any injury to people or property resulting from any ideas, methods, instructions or products referred to in the content. |
© 2026 by the authors. Licensee MDPI, Basel, Switzerland. This article is an open access article distributed under the terms and conditions of the Creative Commons Attribution (CC BY) license.