


Abstract
Background/Objectives: Altered lumbar sagittal alignment is associated with degenerative and mechanical musculoskeletal disorders. However, conventional angle-based measurements, such as the Cobb angle, may not fully reflect the overall curvature pattern of the lumbar spine. This pilot study investigated whether curvature distribution profiling on sagittal lumbar radiographs is associated with clinically confirmed lumbar musculoskeletal disorders. Methods: This retrospective pilot study included 50 adults who underwent standing sagittal lumbar radiography. Patients were classified as disease-positive or disease-negative according to radiographic findings, short-term clinical follow-up, and chart review. Vertebral body centroids from T12 to S1 were manually identified to construct continuous lumbar curvature profiles. Curvature height was normalized to a standardized baseline for cross-case comparison. Distribution patterns of curvature deviation were analyzed between groups. Total curvature was also calculated as a quantitative descriptor of overall lumbar bending, and group-wise comparisons were performed using the Kruskal–Wallis test. Results: The disease-negative group showed a predominantly unimodal and symmetric curvature distribution, whereas the disease-positive group showed greater dispersion at both hypo-lordotic and hyper-lordotic extremes. The hypo-lordosis subgroup demonstrated a more consistent deviation pattern, whereas the hyper-lordosis subgroup partially overlapped with the disease-negative distribution. These pattern-based findings suggest that deviation from a central curvature profile, rather than lordosis magnitude alone, may be associated with lumbar musculoskeletal disorders. In exploratory quantitative analysis, total curvature showed a distributional shift in the disease-positive group, although the overall between-group difference did not reach statistical significance (p = 0.096). Conclusions: Curvature distribution profiling may provide complementary morphological information in conjunction with conventional angle-based assessment. Both reduced and exaggerated lumbar curvature patterns were observed in association with lumbar musculoskeletal disorders. Larger studies are needed to validate these preliminary findings and to determine the clinical relevance of this approach.
1. Introduction
Low back pain is one of the most common complaints in clinical practice and affects individuals across a wide range of age groups, occupations, and activity levels [1,2,3,4]. Its multifactorial nature has highlighted the need for comprehensive assessment strategies that integrate structural evaluation with functional and interventional perspectives [5]. Globally, low back pain accounts for a substantial number of outpatient visits and contributes significantly to disability-adjusted life years (DALYs) [6,7,8,9], imposing a considerable burden on healthcare systems. Although its etiology is diverse, mechanical and degenerative disorders of the lumbar spine remain among the most common underlying causes [10,11,12]. In epidemiological terms, low back pain remains a major public health problem across regions. Globally, it was estimated to affect 619 million people in 2020, with projections rising to 843 million by 2050. In the United States, the prevalence of chronic low back pain increased from 3.9% in 1992 to 10.2% in 2006, whereas in Europe the 1-month prevalence has been reported to be 44.6%, ranging from 33.4% to 67.7% across countries. These data further support the view that low back pain is a heterogeneous condition and that its radiographic manifestations may extend beyond deformity-based or single-angle assessment alone [13,14,15]. These pathological processes may be reflected on radiographs through changes in alignment, segmental relationship, or overall sagittal morphology, even when they are not fully captured by a single angular parameter.
Plain radiographs remain a widely used first-line imaging tool for evaluating orthopedic conditions such as spondylosis, spondylolisthesis, and spinal deformity [16,17,18]. Although sagittal lumbar radiographs have limited ability to assess soft tissue abnormalities, including disc herniation, they continue to play an important role in evaluating spinal alignment and curvature, particularly in primary care and resource-limited settings [19,20,21,22].
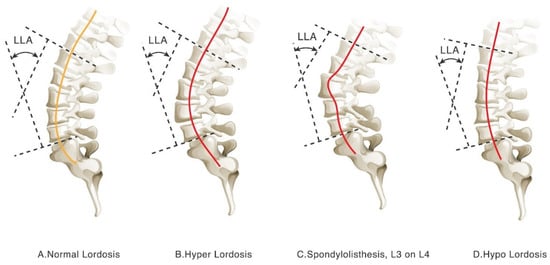
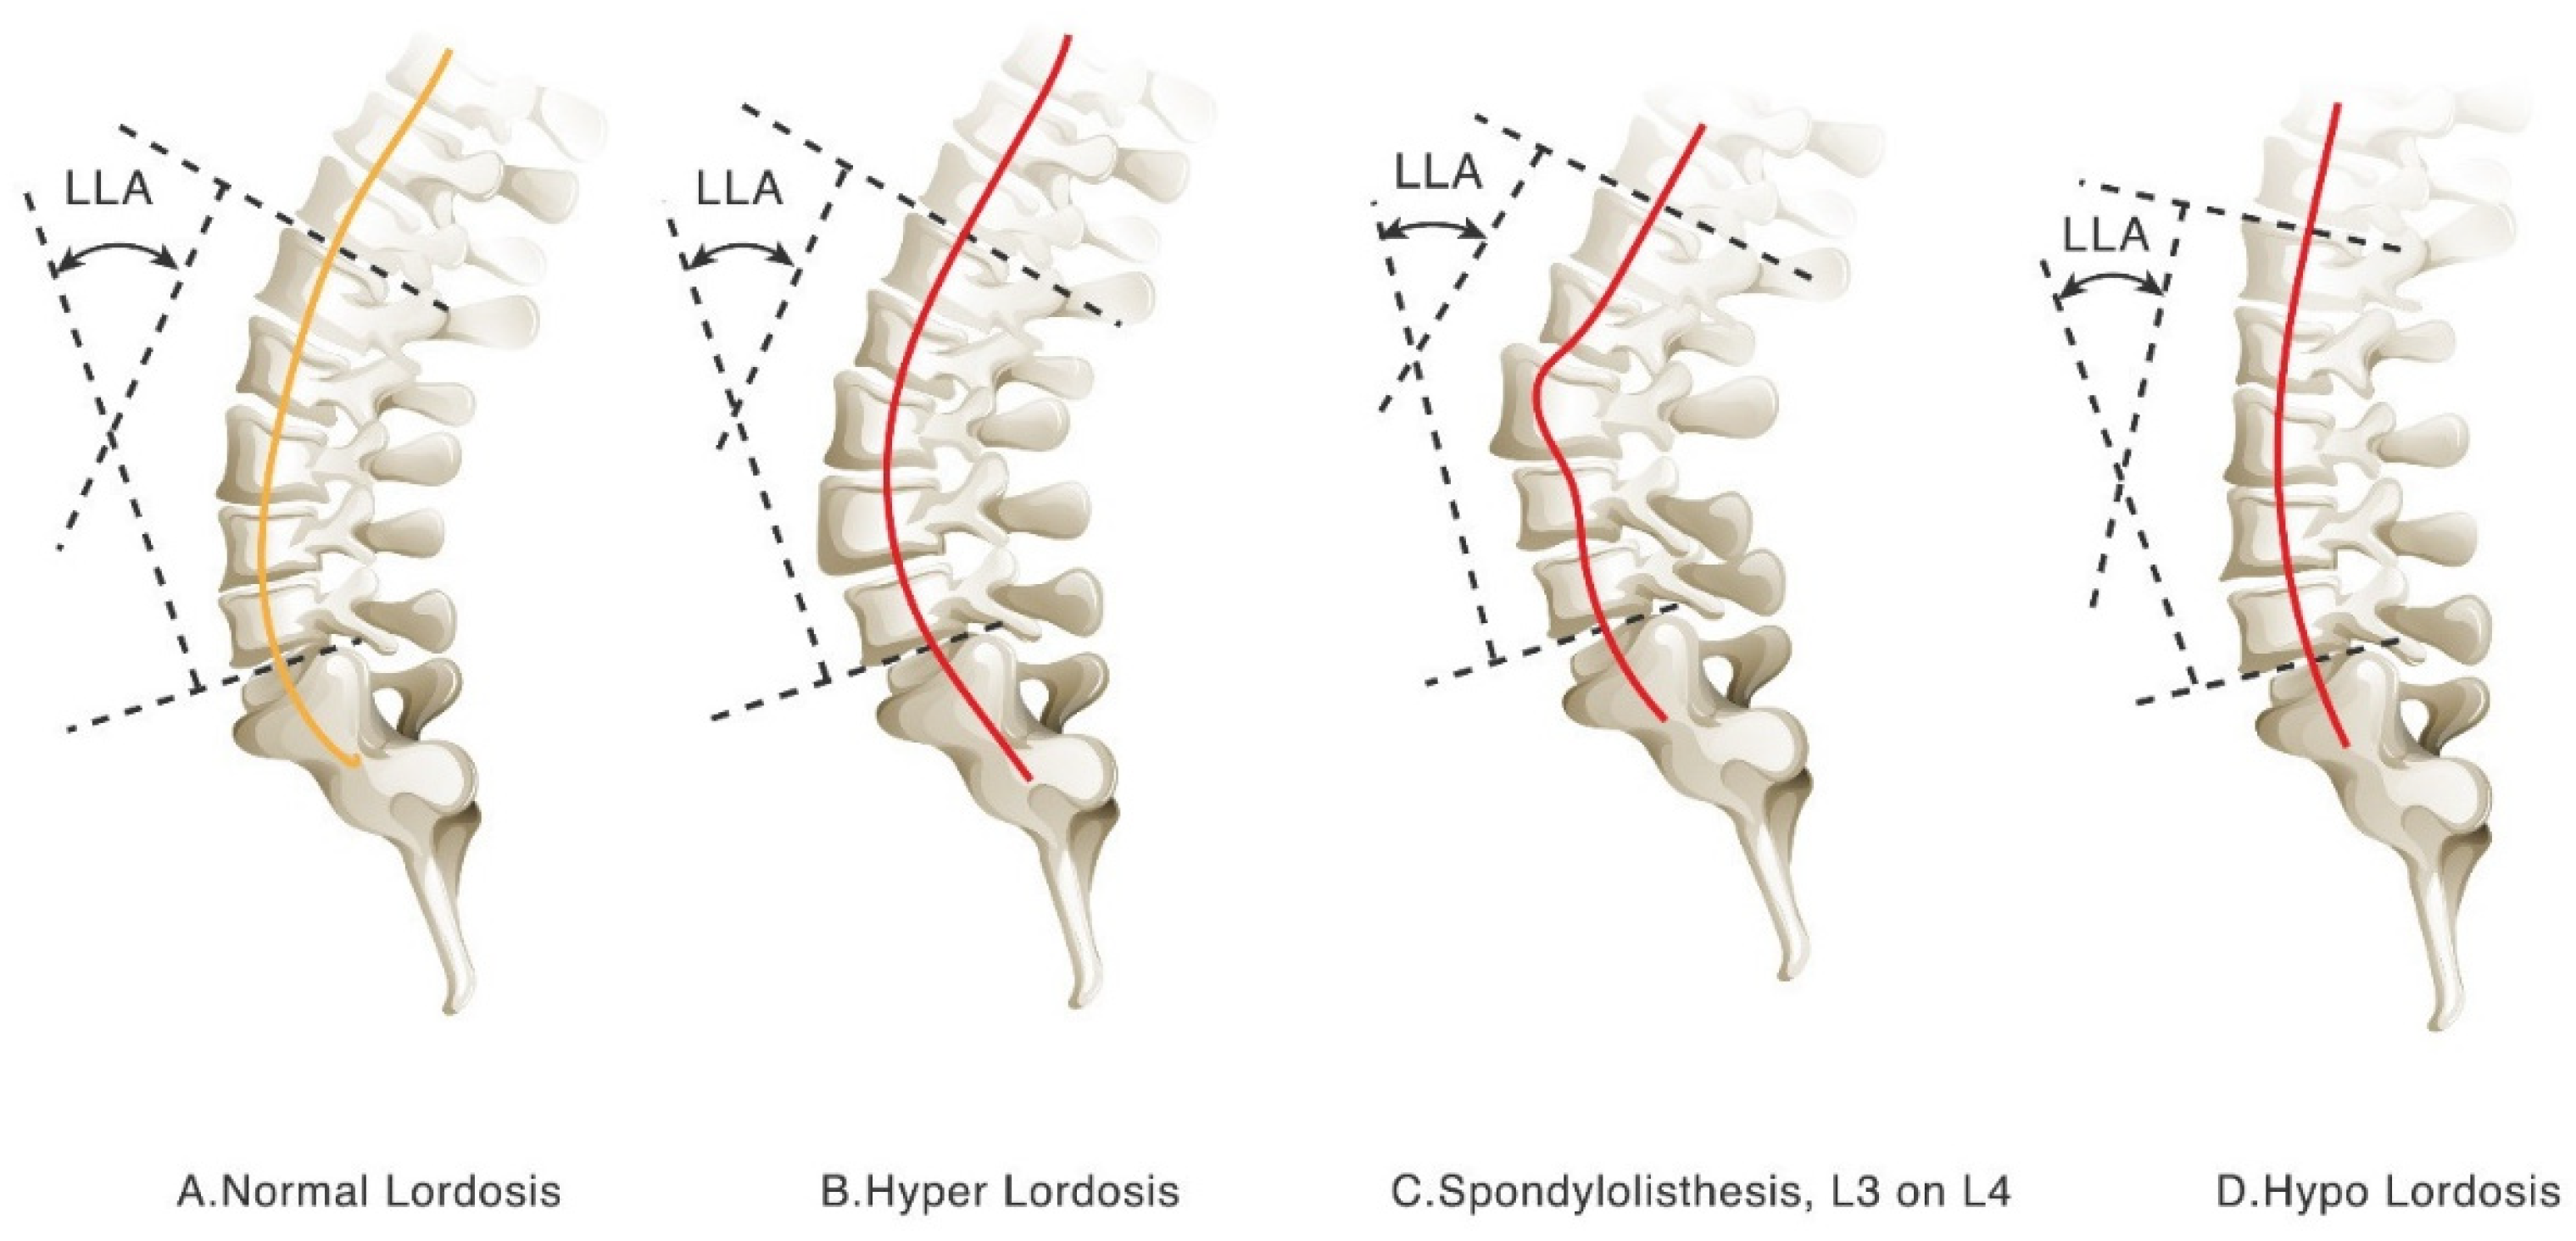
Among radiographic measurements, the Cobb angle has long been regarded as the standard method for quantifying spinal curvature. Originally developed for scoliosis assessment [23,24,25], it has also been widely applied to the evaluation of lumbar lordosis and sagittal curvature [26,27,28,29]. Many studies have used Cobb angle-based parameters, such as the lumbar lordosis angle (LLA), to investigate associations between sagittal profile and clinical symptoms [30,31,32]. However, this approach has recognized limitations, including reduced reproducibility, sensitivity to vertebral level selection, and limited ability to characterize the overall complexity of lumbar curvature. Recent studies have also questioned the adequacy of sagittal Cobb angle measurements for evaluating lumbar lordosis [33,34,35,36]. Because Cobb angle measurements are derived from only two selected vertebral landmarks, they may not fully represent the multi-segmental morphology of the lumbar lordotic curve [37,38,39,40]. Discrepancies between the LLA and the lumbar lordotic curve (LLC) further suggest that manual measurement and observer variation may influence interpretation (Figure 1).
Figure 1.
Limitations of Cobb-based lumbar lordosis assessment. Figure 1 illustrates four representative lumbar sagittal alignment patterns: (A) normal lordosis, (B) hyper-lordosis, (C) spondylolisthesis at L3–L4, and (D) hypo-lordosis. Cases with similar Cobb angles may still demonstrate substantially different overall curvature configurations. In particular, Cobb-based measurements may have limited ability to distinguish normal curvature from pathologic sagittal alignment or to adequately characterize relatively straight lumbar profiles. In contrast, curvature-based visualization provides a more intuitive representation of global lumbar alignment differences. The orange solid line represents the normal lumbar curvature pattern, whereas the red solid lines represent disease-associated lumbar curvature patterns, including hyper-lordosis, hypo-lordosis, or abnormal vertebral alignment due to spondylolisthesis.
To address these limitations, several alternative radiographic indices have been proposed, including pelvic incidence–lumbar lordosis mismatch (PI-LL), sagittal vertical axis (SVA), vertex level measurements, lumbosacral angle (LSA), lumbosacral joint angle (LSJA), and tangential radiologic assessment of the lumbar lordosis angle (TRALLA) [41,42,43,44]. However, many of these parameters still rely primarily on angular descriptions or require full-spine imaging and detailed anatomical reference points, which may limit their routine use in standard lumbar radiograph interpretation [45,46,47]. As interest in personalized spine assessment continues to grow, additional curvature-based approaches are needed to better capture morphological variation in sagittal lumbar alignment.
Recent advances in image processing and geometric analysis have created new opportunities for curvature quantification [48,49]. Rather than relying solely on endpoint-based angular measurements, these approaches aim to describe the overall morphology of the lumbar spine and may provide more refined information for characterizing sagittal imbalance or degenerative change.
In this pilot study, we applied a curvature distribution profiling method to sagittal lumbar radiographs to visualize lumbar curvature patterns and to examine their association with clinically confirmed lumbar musculoskeletal disorders. By focusing on overall curvature morphology, this study aimed to determine whether curvature-based profiling could provide complementary radiographic information alongside conventional angle-based measures such as the Cobb angle [50]. We hypothesized that patients with clinically confirmed lumbar musculoskeletal disorders would show greater deviation from a central lumbar curvature profile than disease-negative individuals on standing sagittal lumbar radiographs. The originality of the present study lies not in curvature mathematics itself, but in the use of normalized cross-case curve-distribution profiling to evaluate deviation patterns on routine sagittal lumbar radiographs. This study is important because it explores whether routine sagittal lumbar radiographs can provide an additional pattern-based descriptor of lumbar disease in conjunction with conventional angle-based assessment. Rather than replacing advanced imaging, the present approach was intended to examine whether conventional radiography can be used more effectively as an early structural assessment tool.
Such an approach may be particularly useful in routine radiographic interpretation, where rapid visual assessment of overall curvature pattern may provide information not readily captured by discrete angular measurements. Unlike conventional lordosis indices that summarize alignment using selected angular relationships, the present method was designed to depict the overall curvature profile directly from vertebral alignment.
2. Materials and Methods
2.1. Patient Selection and Data Sources
This retrospective pilot study was conducted using standing sagittal lumbar radiographs obtained from the Department of Surgery, Armed Forces Hualien General Hospital, Taiwan. A total of 50 radiographs from outpatients who underwent lumbar spine examination between 1 December and 30 December 2023 were retrospectively collected. The study protocol was approved by the Institutional Review Board of Tri-Service General Hospital (IRB No. C202405032). Because only anonymized imaging data were used, the requirement for informed consent was waived.
2.2. Inclusion and Exclusion Criteria
The inclusion criteria were as follows:
- (1)
- Age ≥ 18 years;
- (2)
- Availability of a complete and clear standing sagittal lumbar radiograph including T12 to S1;
- (3)
- No lumbar radiographic examination within the preceding 6 months, in order to reduce potential confounding from recent interventions or acute spinal events.
The exclusion criteria were as follows:
- (1)
- History of spinal surgery;
- (2)
- Presence of congenital spinal anomalies (e.g., hemivertebra or spina bifida);
- (3)
- History of spinal trauma with fracture;
- (4)
- Incomplete imaging data or poor image quality.
2.3. Group Classification
All cases were independently reviewed by an orthopedic surgeon and a radiologist. Group classification was based on the combination of initial radiographic findings, clinical records, and imaging or clinical follow-up within 3 months after the index examination.
2.3.1. Disease-Negative Group
Patients without radiographic evidence of lumbar degenerative pathology at the index examination who showed no new lumbar symptoms during follow-up and required no additional spine-related imaging or intervention within 3 months.
2.3.2. Disease-Positive Group
Patients with clinically confirmed degenerative lumbar disorders, such as disc herniation, spondylolisthesis, or facet joint degeneration, based on radiographic findings, chart review, and subsequent imaging evaluation (MRI or CT) or clinical intervention within 3 months [51,52,53].
This classification was not based solely on whether additional imaging was performed, but on the combination of radiographic findings, short-term clinical follow-up, and chart-confirmed clinical diagnosis, in order to reduce potential misclassification bias. The disease-positive group intentionally included clinically heterogeneous lumbar disorders because the aim of this pilot study was not to isolate disease-specific biomechanical mechanisms, but to examine whether different lumbar pathologies might share detectable deviation patterns in overall sagittal curvature. Given that lumbar disorders often arise from multiple interacting structural and soft-tissue factors, the present exploratory grouping was intended to capture the resultant geometric alteration rather than the isolated effect of a single disease entity. Disagreements between the two readers were resolved by consensus discussion. However, formal inter-observer agreement statistics were not calculated, and the consistency of manual landmark selection was therefore not quantified in this pilot study.
2.4. Image Processing and Curve Construction
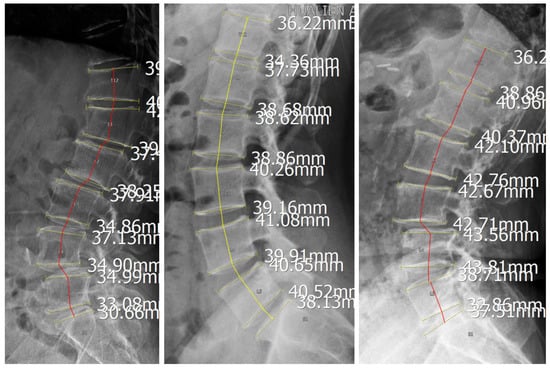
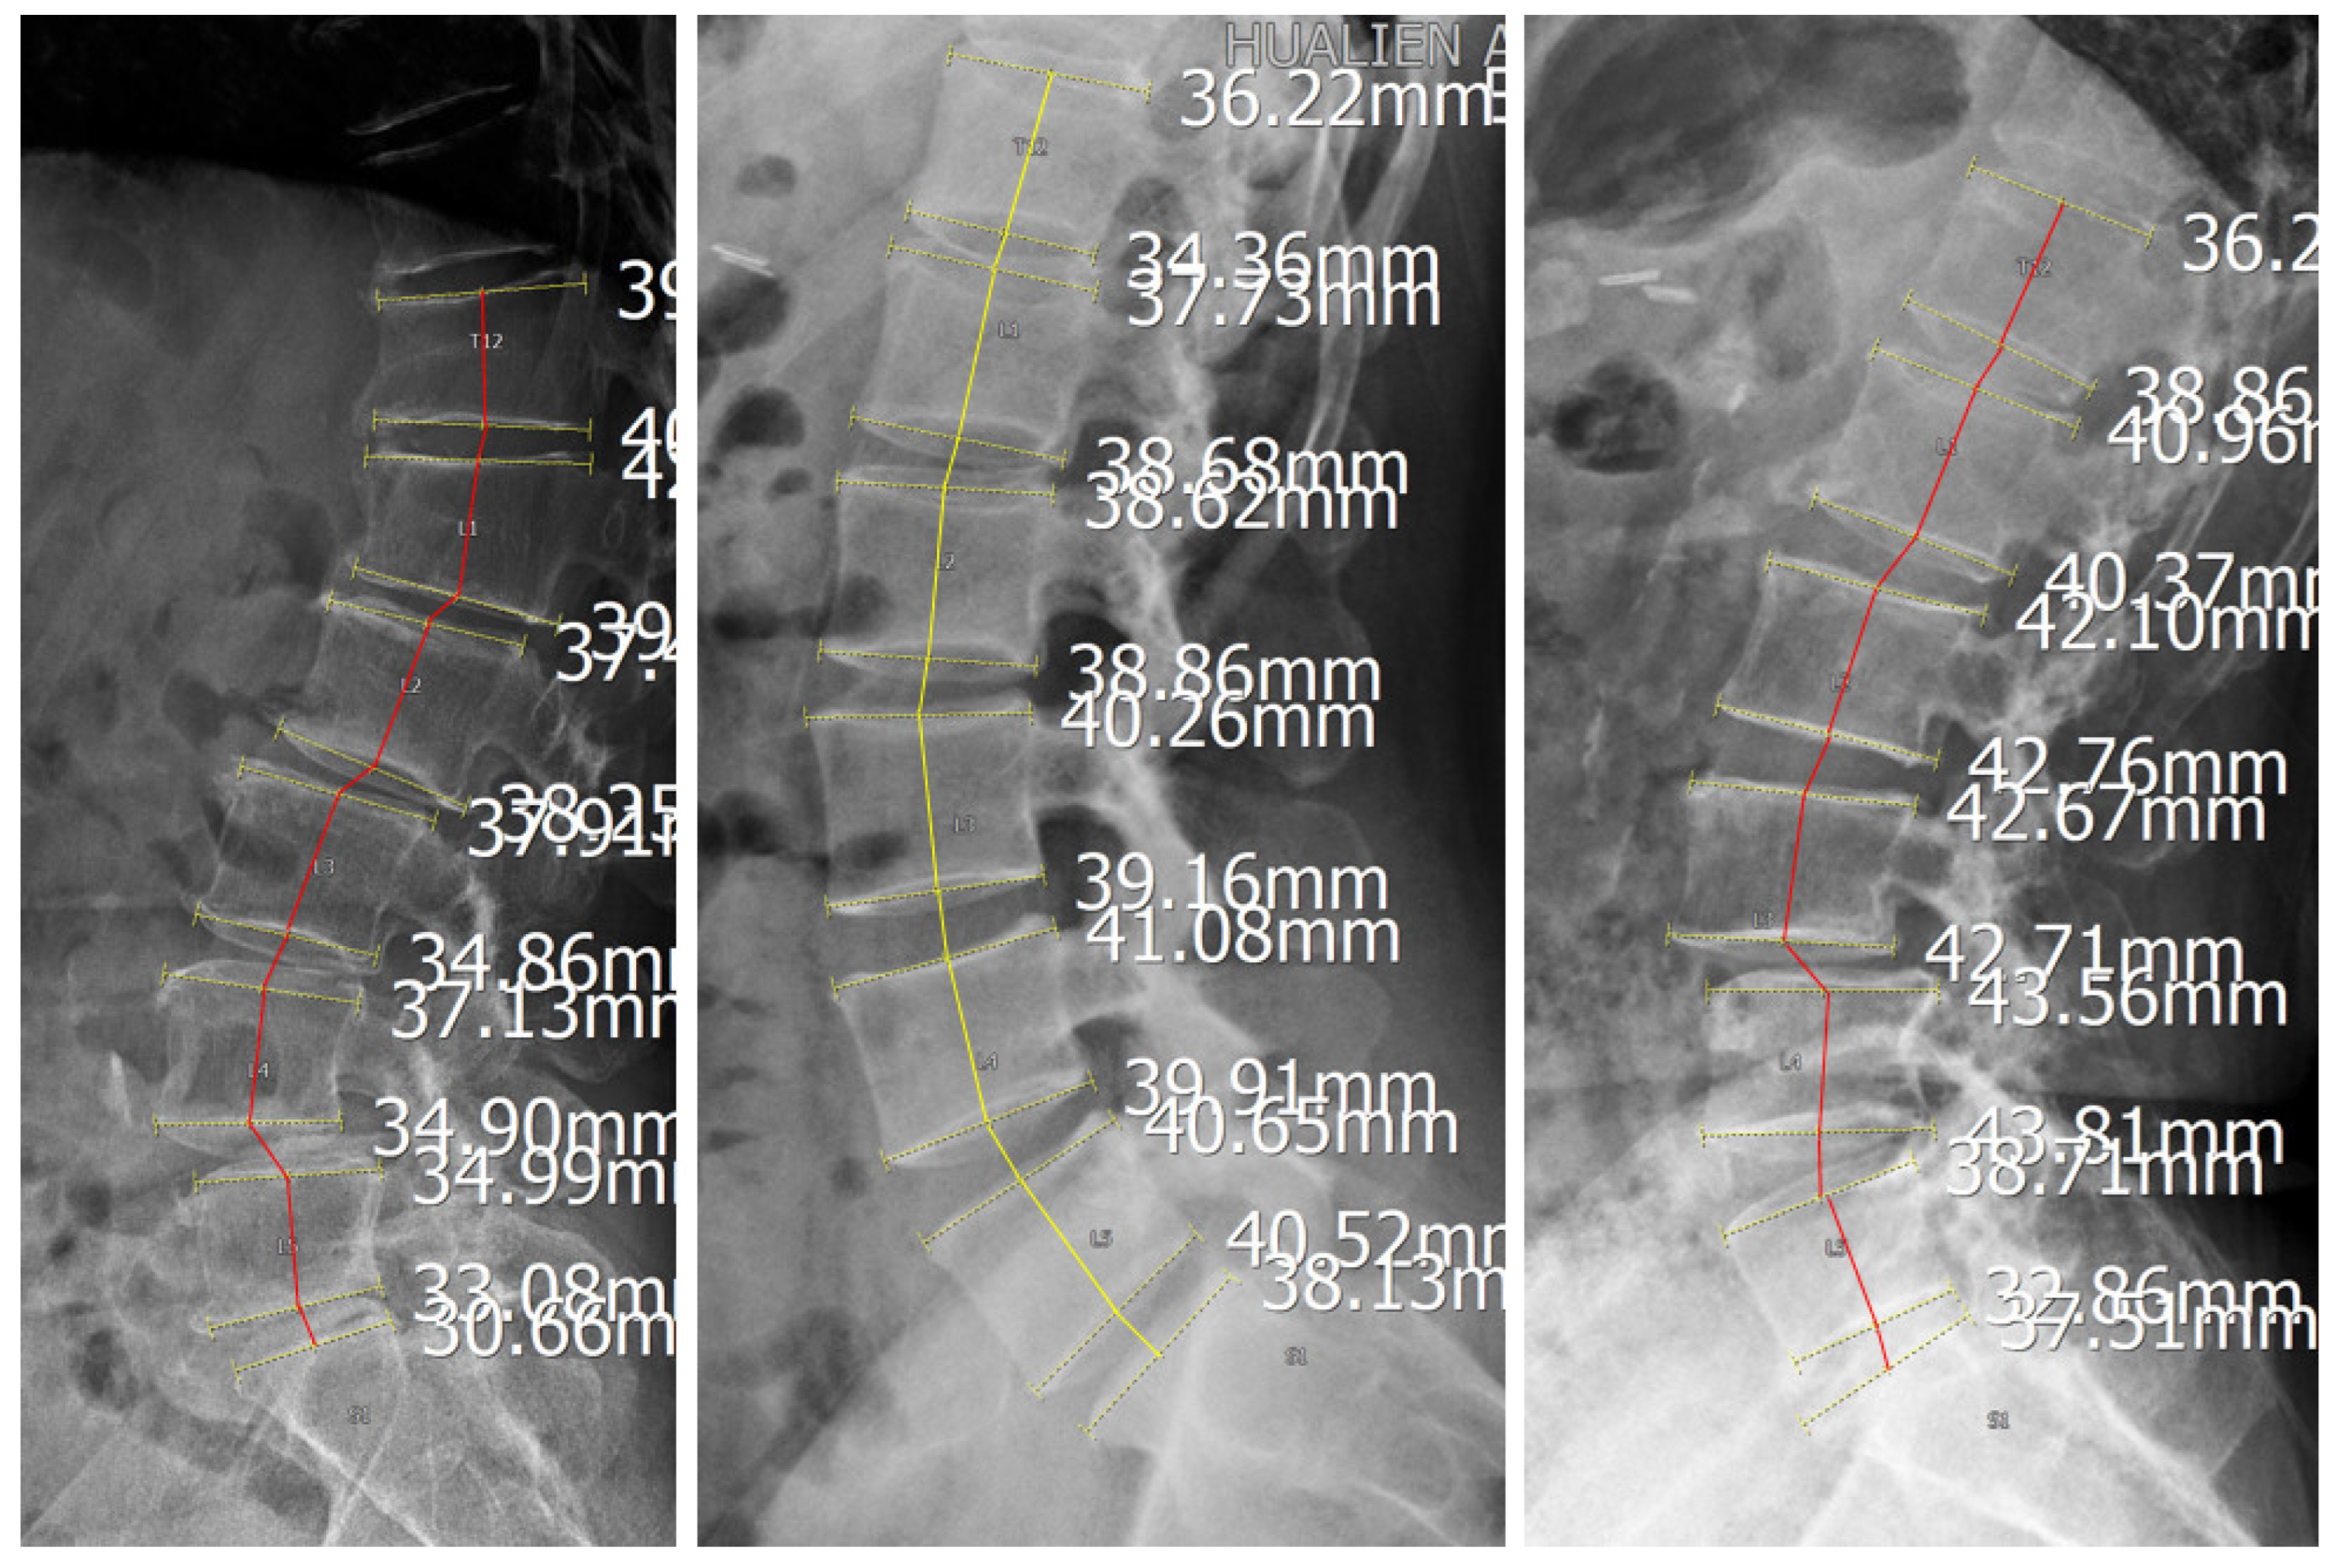
For each case, the centroid of each vertebral body from T12 to S1 was manually identified, and these points were sequentially connected to construct the lumbar lordotic curve (LLC). A straight baseline was defined by connecting the centroids of T12 and S1, and its horizontal length was normalized to a scale of 0 to 100. The vertical distance from each vertebral centroid to this baseline was then measured to characterize the curvature profile. This normalization procedure was used to reduce the influence of individual differences in spinal size and curve length and to allow standardized comparison across cases.
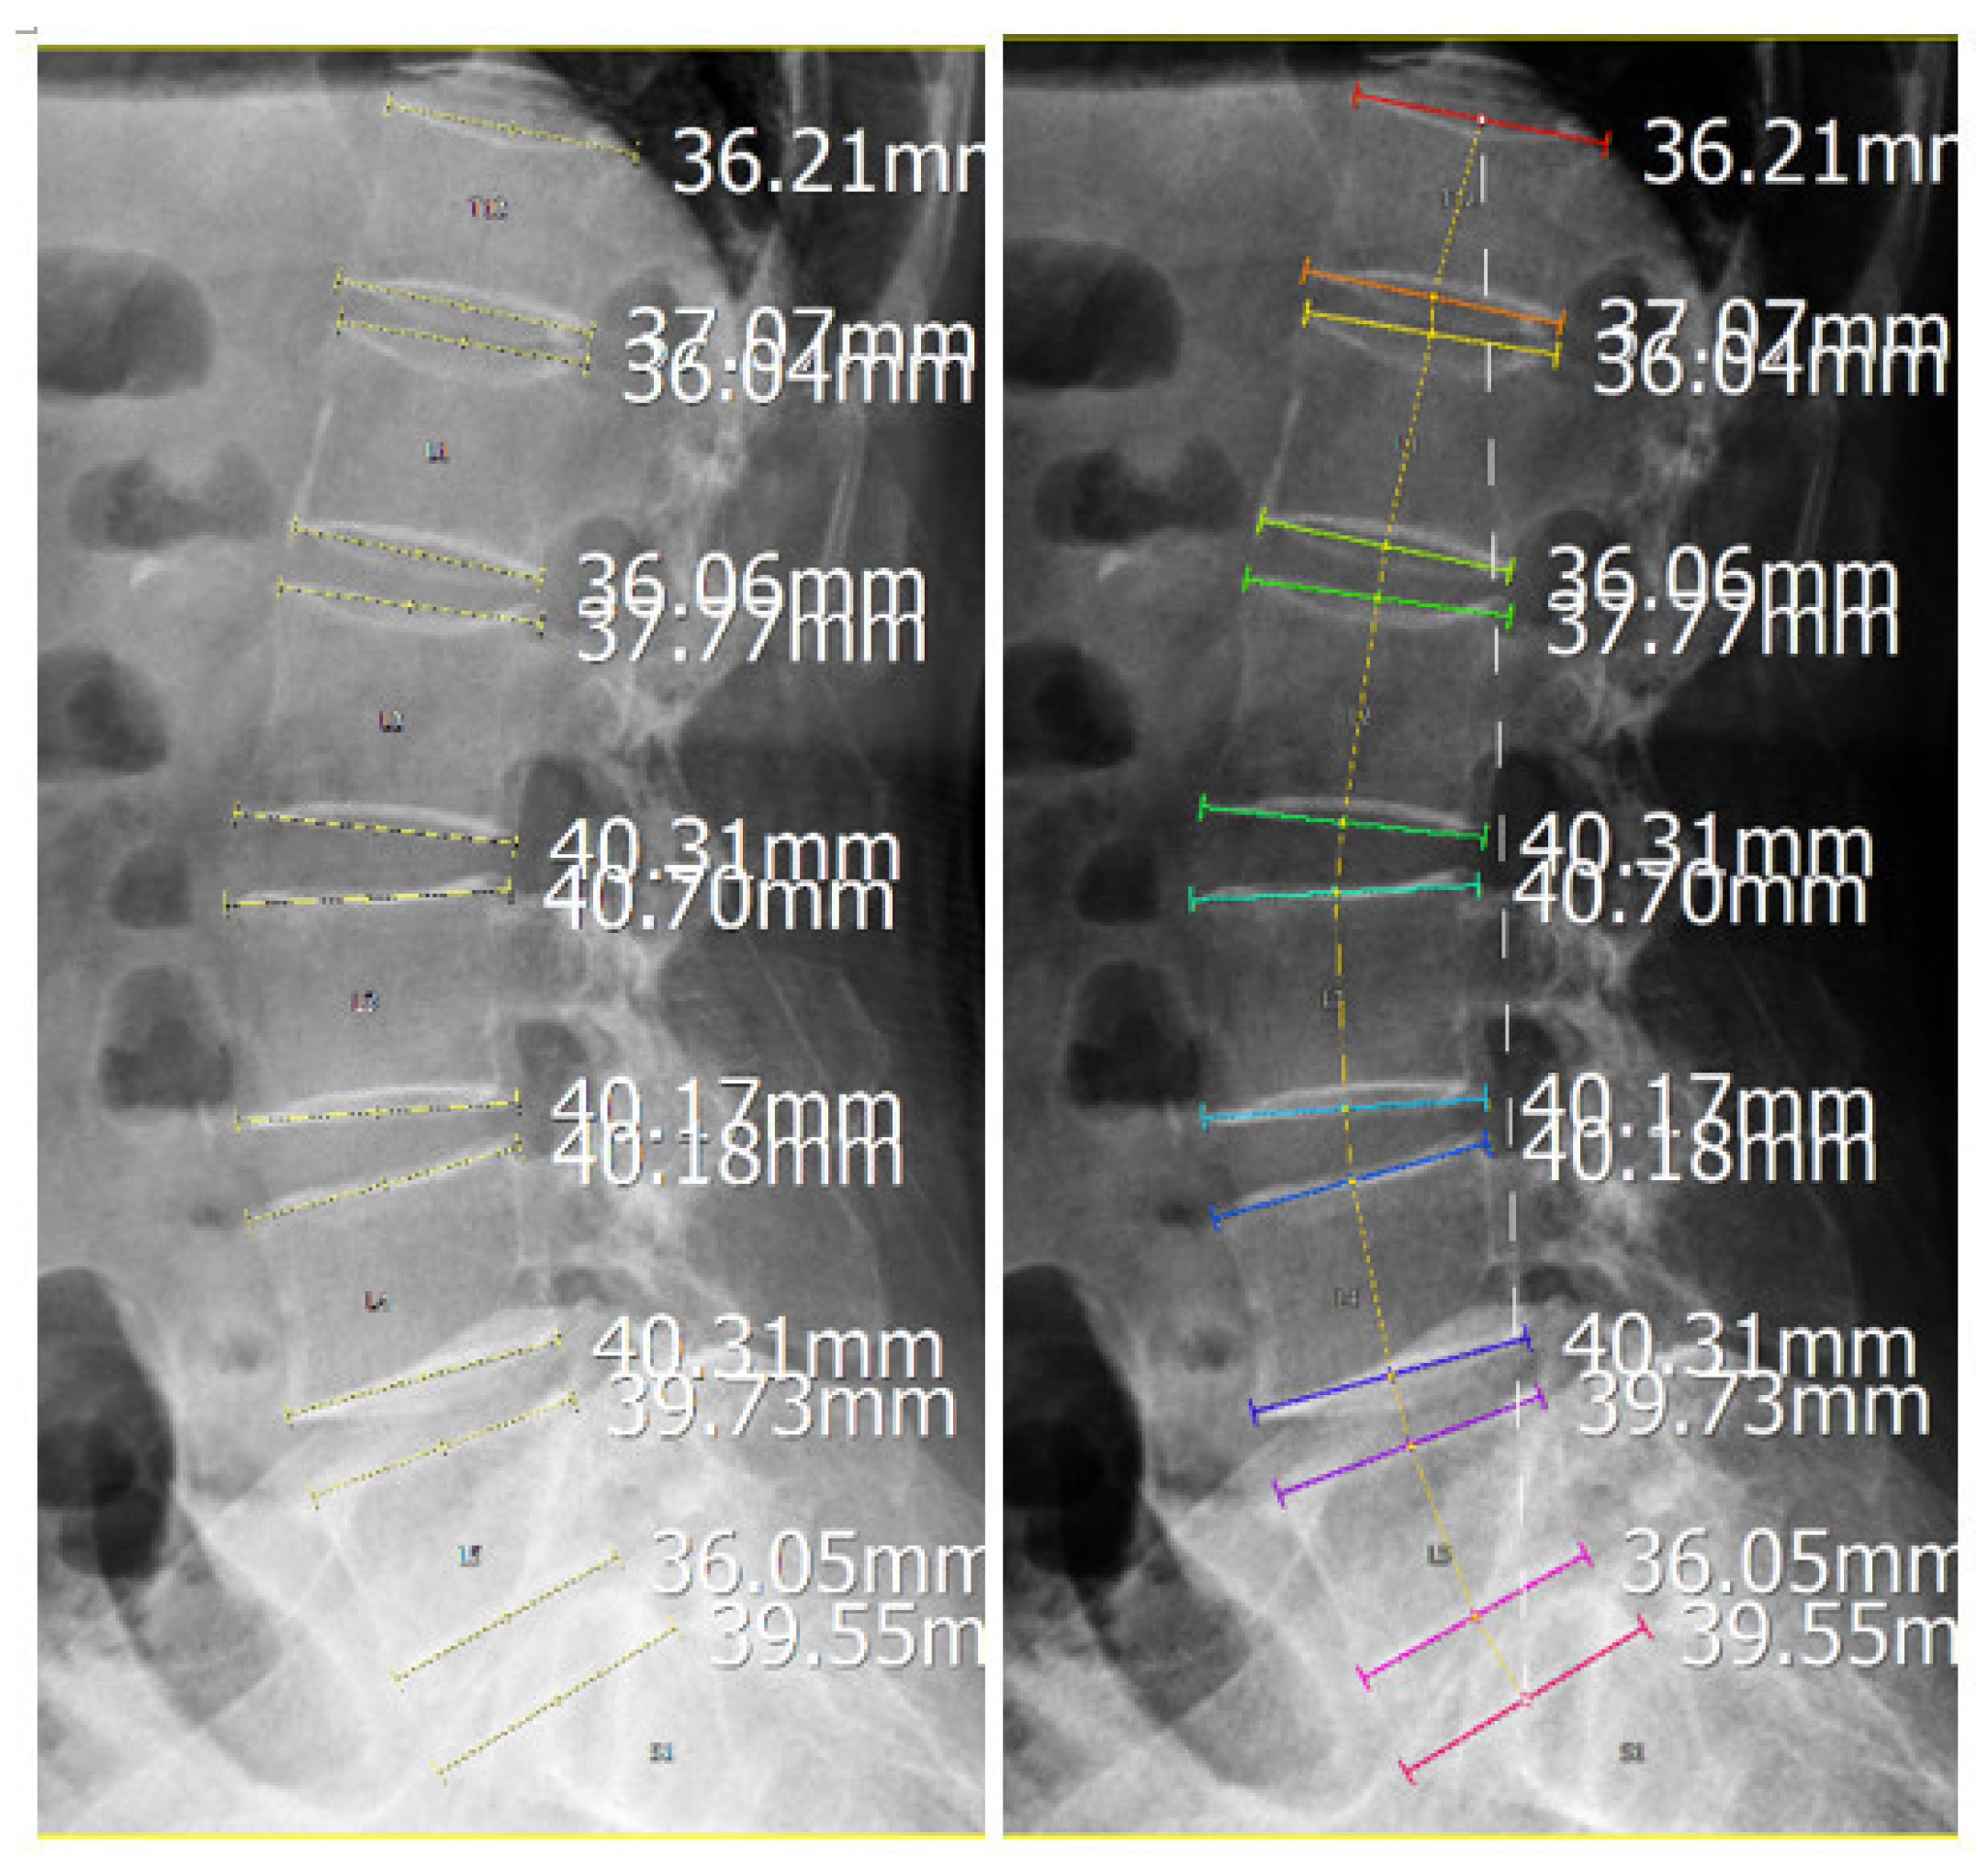
For group-based visual assessment, each curve was colour-coded according to disease status, with yellow lines representing disease-negative cases and red lines representing disease-positive cases (Figure 2). A median curvature line was calculated for each group to represent its characteristic sagittal profile (Figure 3). Group comparisons focused on qualitative differences in curvature distribution and deviation from the central profile.
Figure 2.
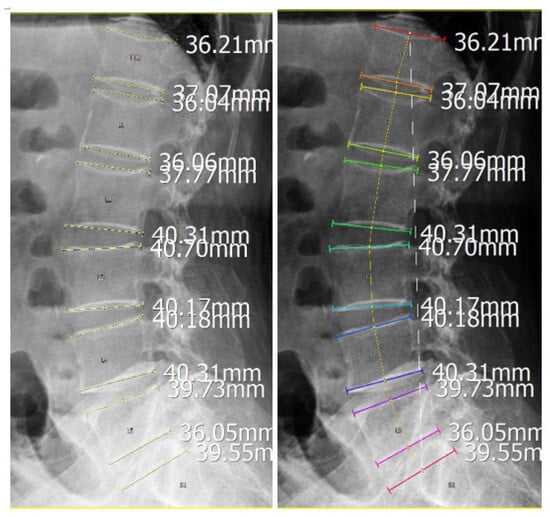
Construction of the lumbar lordotic curve on sagittal radiographs. Figure 2 shows the construction of the lumbar lordotic curve on a sagittal lumbar radiograph by sequentially connecting the centroids of the vertebral bodies from T12 to S1.
Figure 3.
Normalization and alignment of lumbar curvature profiles. Colored solid lines indicate vertebral endplates identified by the imaging system, whereas the colored dashed line represents the curve connecting vertebral midpoints used to depict lumbar alignment. The white dashed line indicates the baseline connecting the inferior endplate of T12 and superior endplate of S1 used for normalization. Labels L1–L5 and S1 are vertebral identifiers generated by the imaging system.
All image processing and plotting were performed using custom in-house tools. Landmark identification, curve construction, and profile visualization were conducted manually without automated segmentation or AI-assisted analysis.
2.5. Curvature Quantification and Statistical Analysis
In addition to visual curve profiling, curvature-based quantification was performed to further characterize the geometric properties of the lumbar lordotic curve. Curvature (κ) was defined using the parametric form of the curve, as follows:
Here, x and y represent the coordinates of the fitted lumbar curve, and primes denote the first- and second-order derivatives with respect to the curve parameter. Total curvature was then calculated as the integral of curvature along the arc length of the curve:
This parameter was used as a quantitative summary of overall lumbar geometric bending. Group-wise comparisons of total curvature among the three curvature pattern groups were performed using the Kruskal–Wallis test. Because this was a pilot study with a limited sample size, the statistical analysis was considered exploratory and was used to support, rather than define, the observed imaging patterns. Accordingly, subgroup findings were interpreted descriptively and were not intended to support definitive inferential conclusions.
3. Results
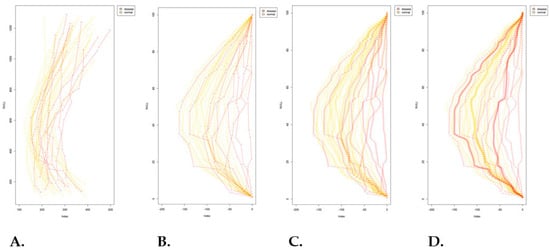
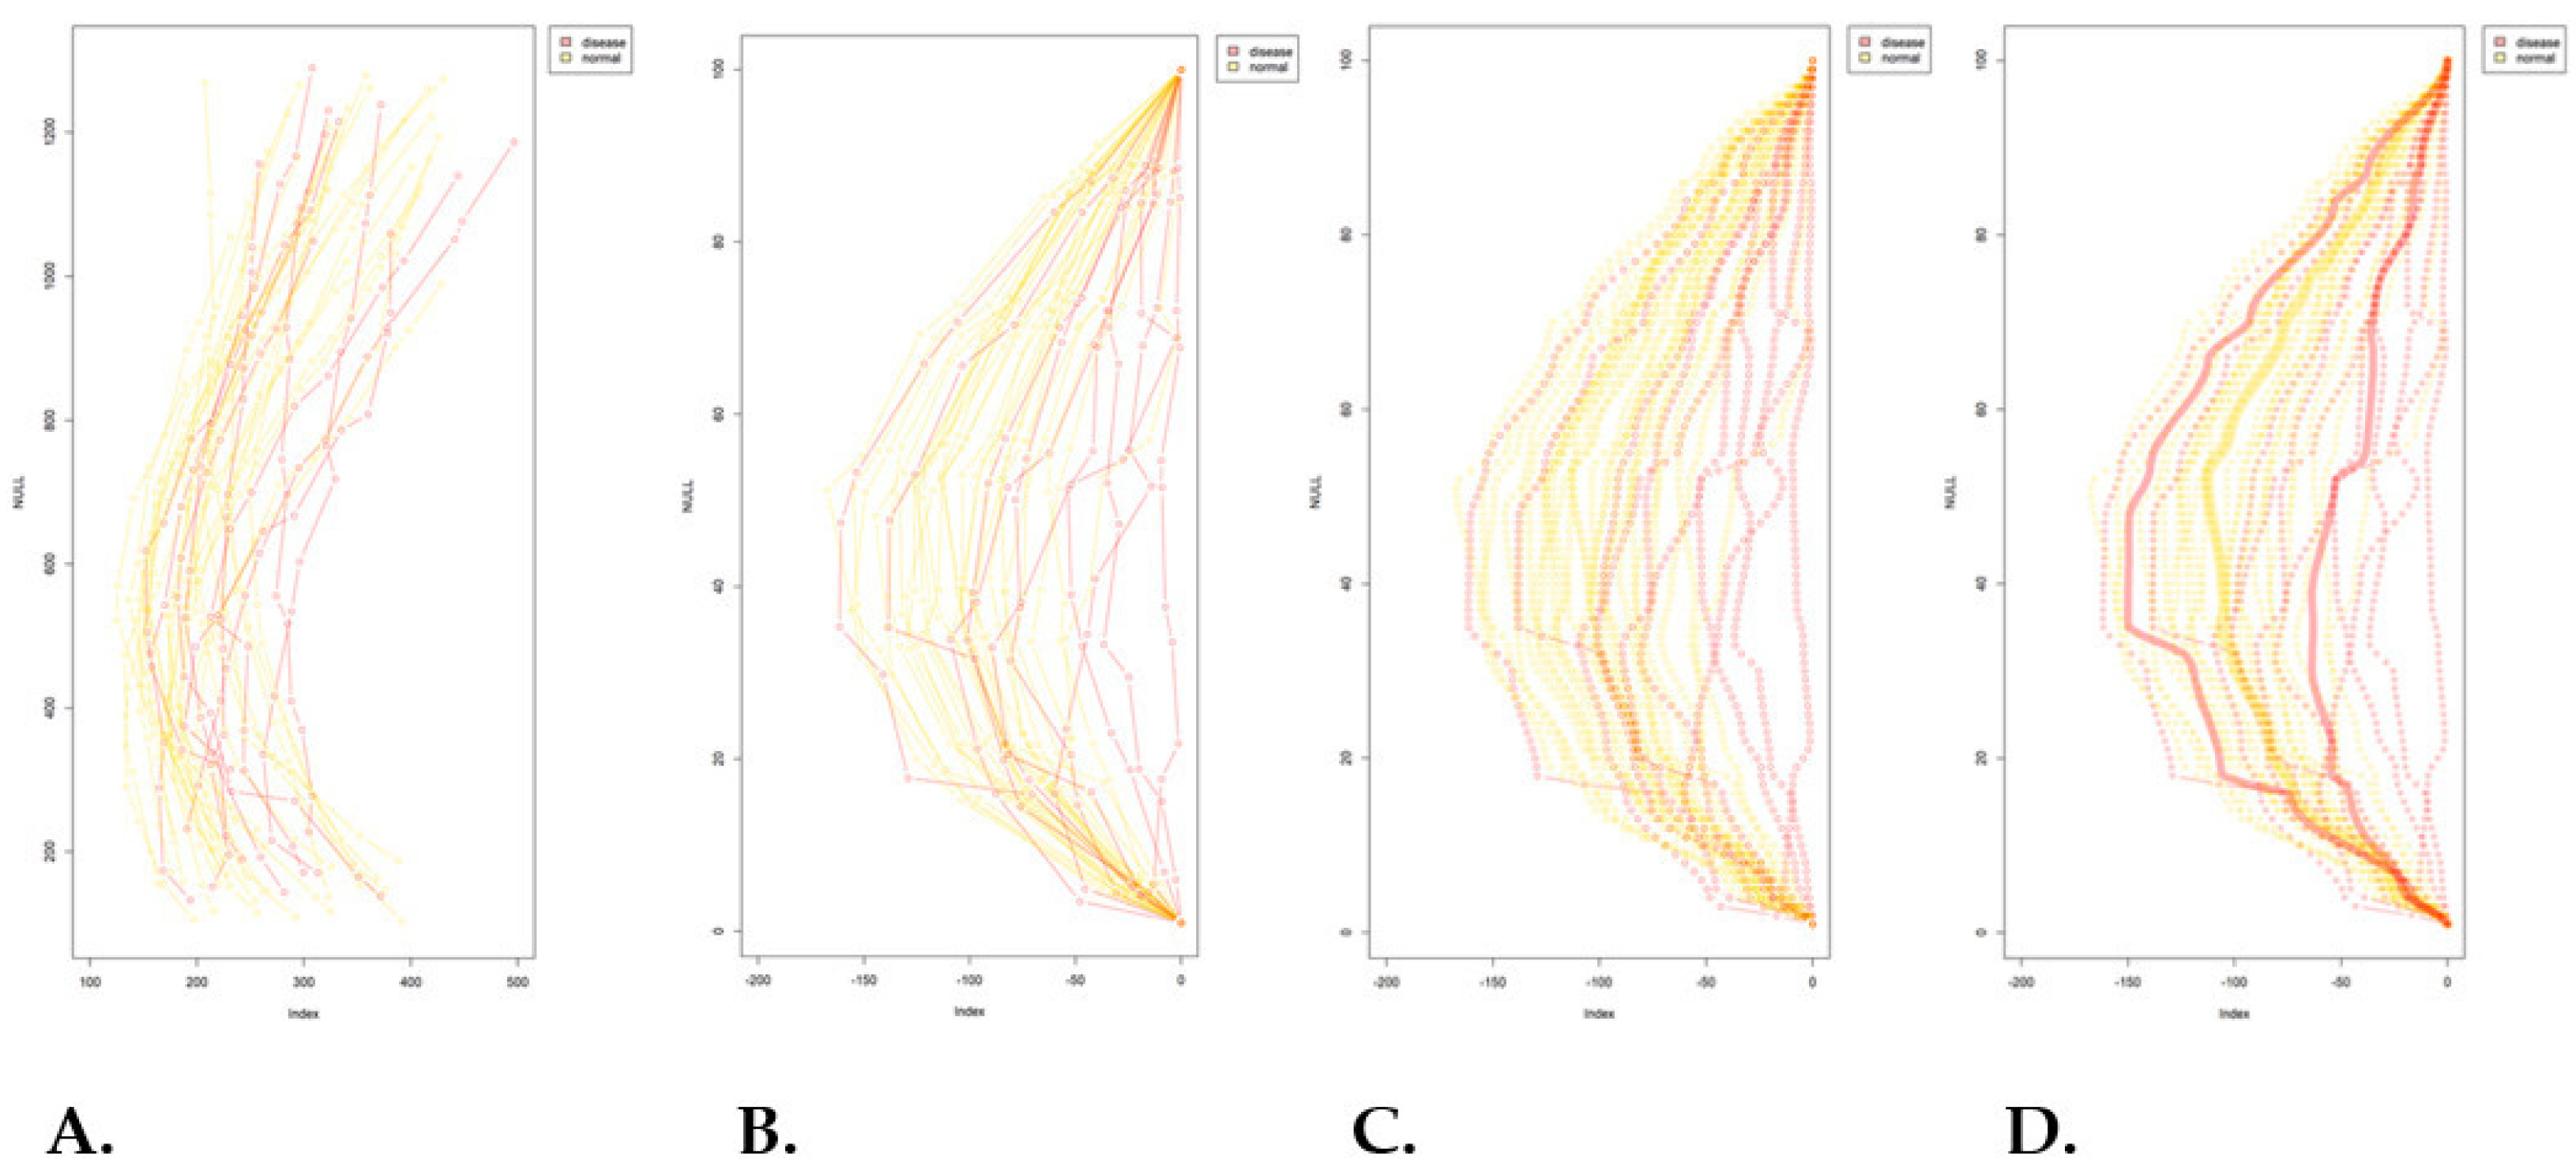
The distribution of the study cohort by group, sex, and age is summarized in Table 1. The final dataset included 50 cases, comprising 32 disease-negative and 18 disease-positive cases. Within the disease-positive group, 11 cases were categorized as hyper-lordosis and 7 as hypo-lordosis. Fifty lumbar sagittal curvature patterns were analyzed (Figure 4A). After normalization, superimposed curves formed a central reference profile (Figure 4B). The disease-negative group (yellow curves) showed a predominantly unimodal and symmetric distribution, consistent with a typical lumbar curvature pattern. In contrast, the disease-positive group deviated from the reference profile and extended toward both extremes of the distribution, suggesting a bimodal tendency (Figure 4C,D).
Table 1.
Distribution of the study cohort and lumbar curvature subgroups.
Figure 4.
Distribution patterns of normalized lumbar curvature profiles. (A) Lumbar curvature profiles from all included cases were collected for analysis. (B) After normalization of curve size and alignment of the starting position, a central reference curvature profile was obtained. (C) The disease-negative group (yellow curves) showed a predominantly unimodal and symmetric distribution, whereas the disease-positive group (red curves) demonstrated broader dispersion toward both extremes of the distribution. (D) Subgroup analysis of the disease-positive cases showed two distinct patterns: a hyper-lordosis subgroup with partial overlap with the disease-negative distribution, and a hypo-lordosis subgroup with a shifted and comparatively narrower distribution.
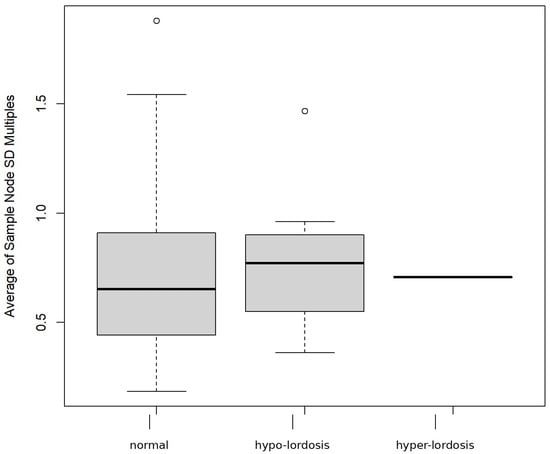
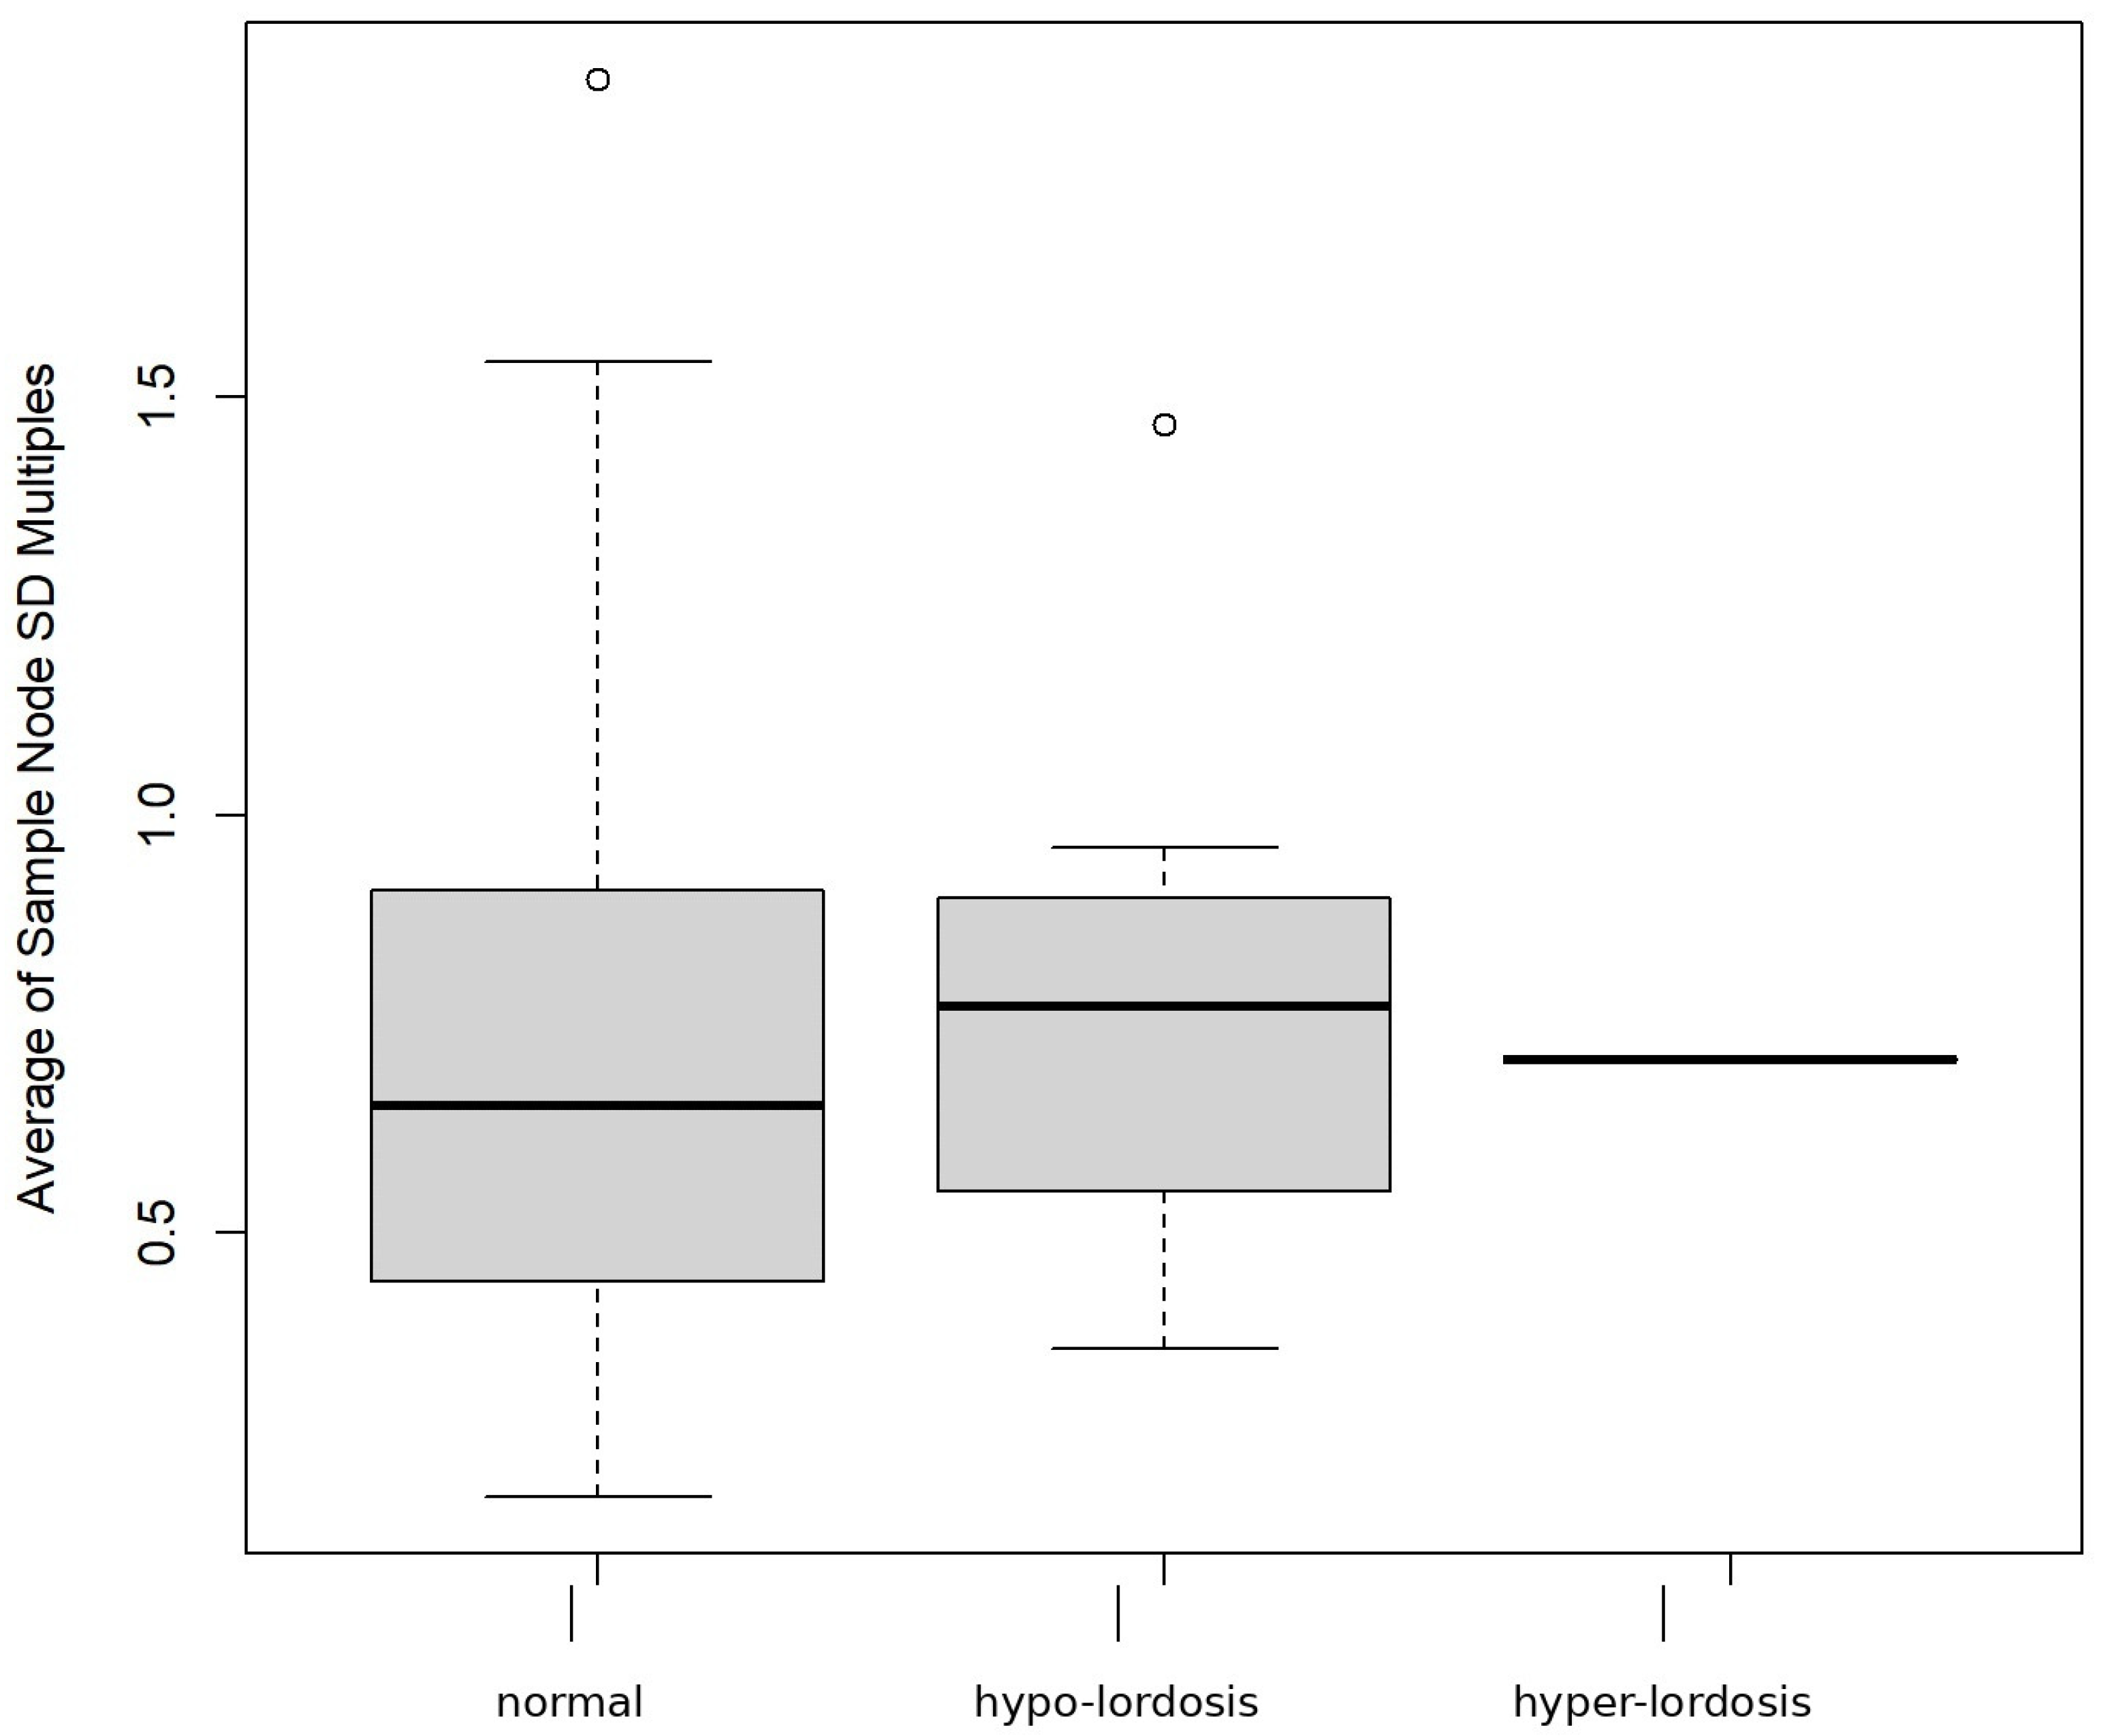
Further stratification of the disease-positive group revealed two distinct sub-patterns: one characterized by reduced lumbar lordosis (hypo-lordosis subgroup in Figure 5) and the other by exaggerated lumbar curvature (hyper-lordosis subgroup in Figure 5). The hyper-lordosis subgroup overlapped considerably with the disease-negative group, indicating that increased curvature alone did not clearly distinguish disease status in this cohort. By contrast, the hypo-lordosis subgroup showed a narrower distribution and a lower median profile, indicating a more uniform geometric pattern among affected cases (Figure 4 and Figure 5).
Figure 5.
Variability of lumbar curvature profiles across study groups. Figure 5 illustrates the distribution of lumbar curvature profiles across the study groups, including the normal group and the two disease-associated subgroups, namely hypo-lordosis and hyper-lordosis. In the boxplot, the central line represents the median, the box represents the interquartile range, the whiskers indicate the data range, and circles indicate outlying observations. Boxplot analysis revealed a broader distribution in the normal group, whereas both disease-associated subgroups showed relatively reduced variability. The hyper-lordosis subgroup partially overlapped with the normal group, while the hypo-lordosis subgroup demonstrated a more distinct displacement in curvature.
The disease-negative group displayed a broader curvature range, with a wider interquartile span and a relatively higher median profile. By comparison, the hyper-lordosis subgroup showed minimal interquartile variation and a concentrated median profile, which may reflect either limited case numbers or relative structural homogeneity within this subgroup (Figure 5).
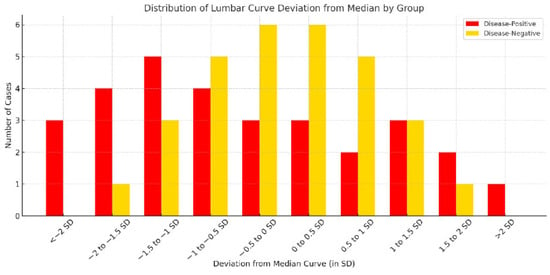
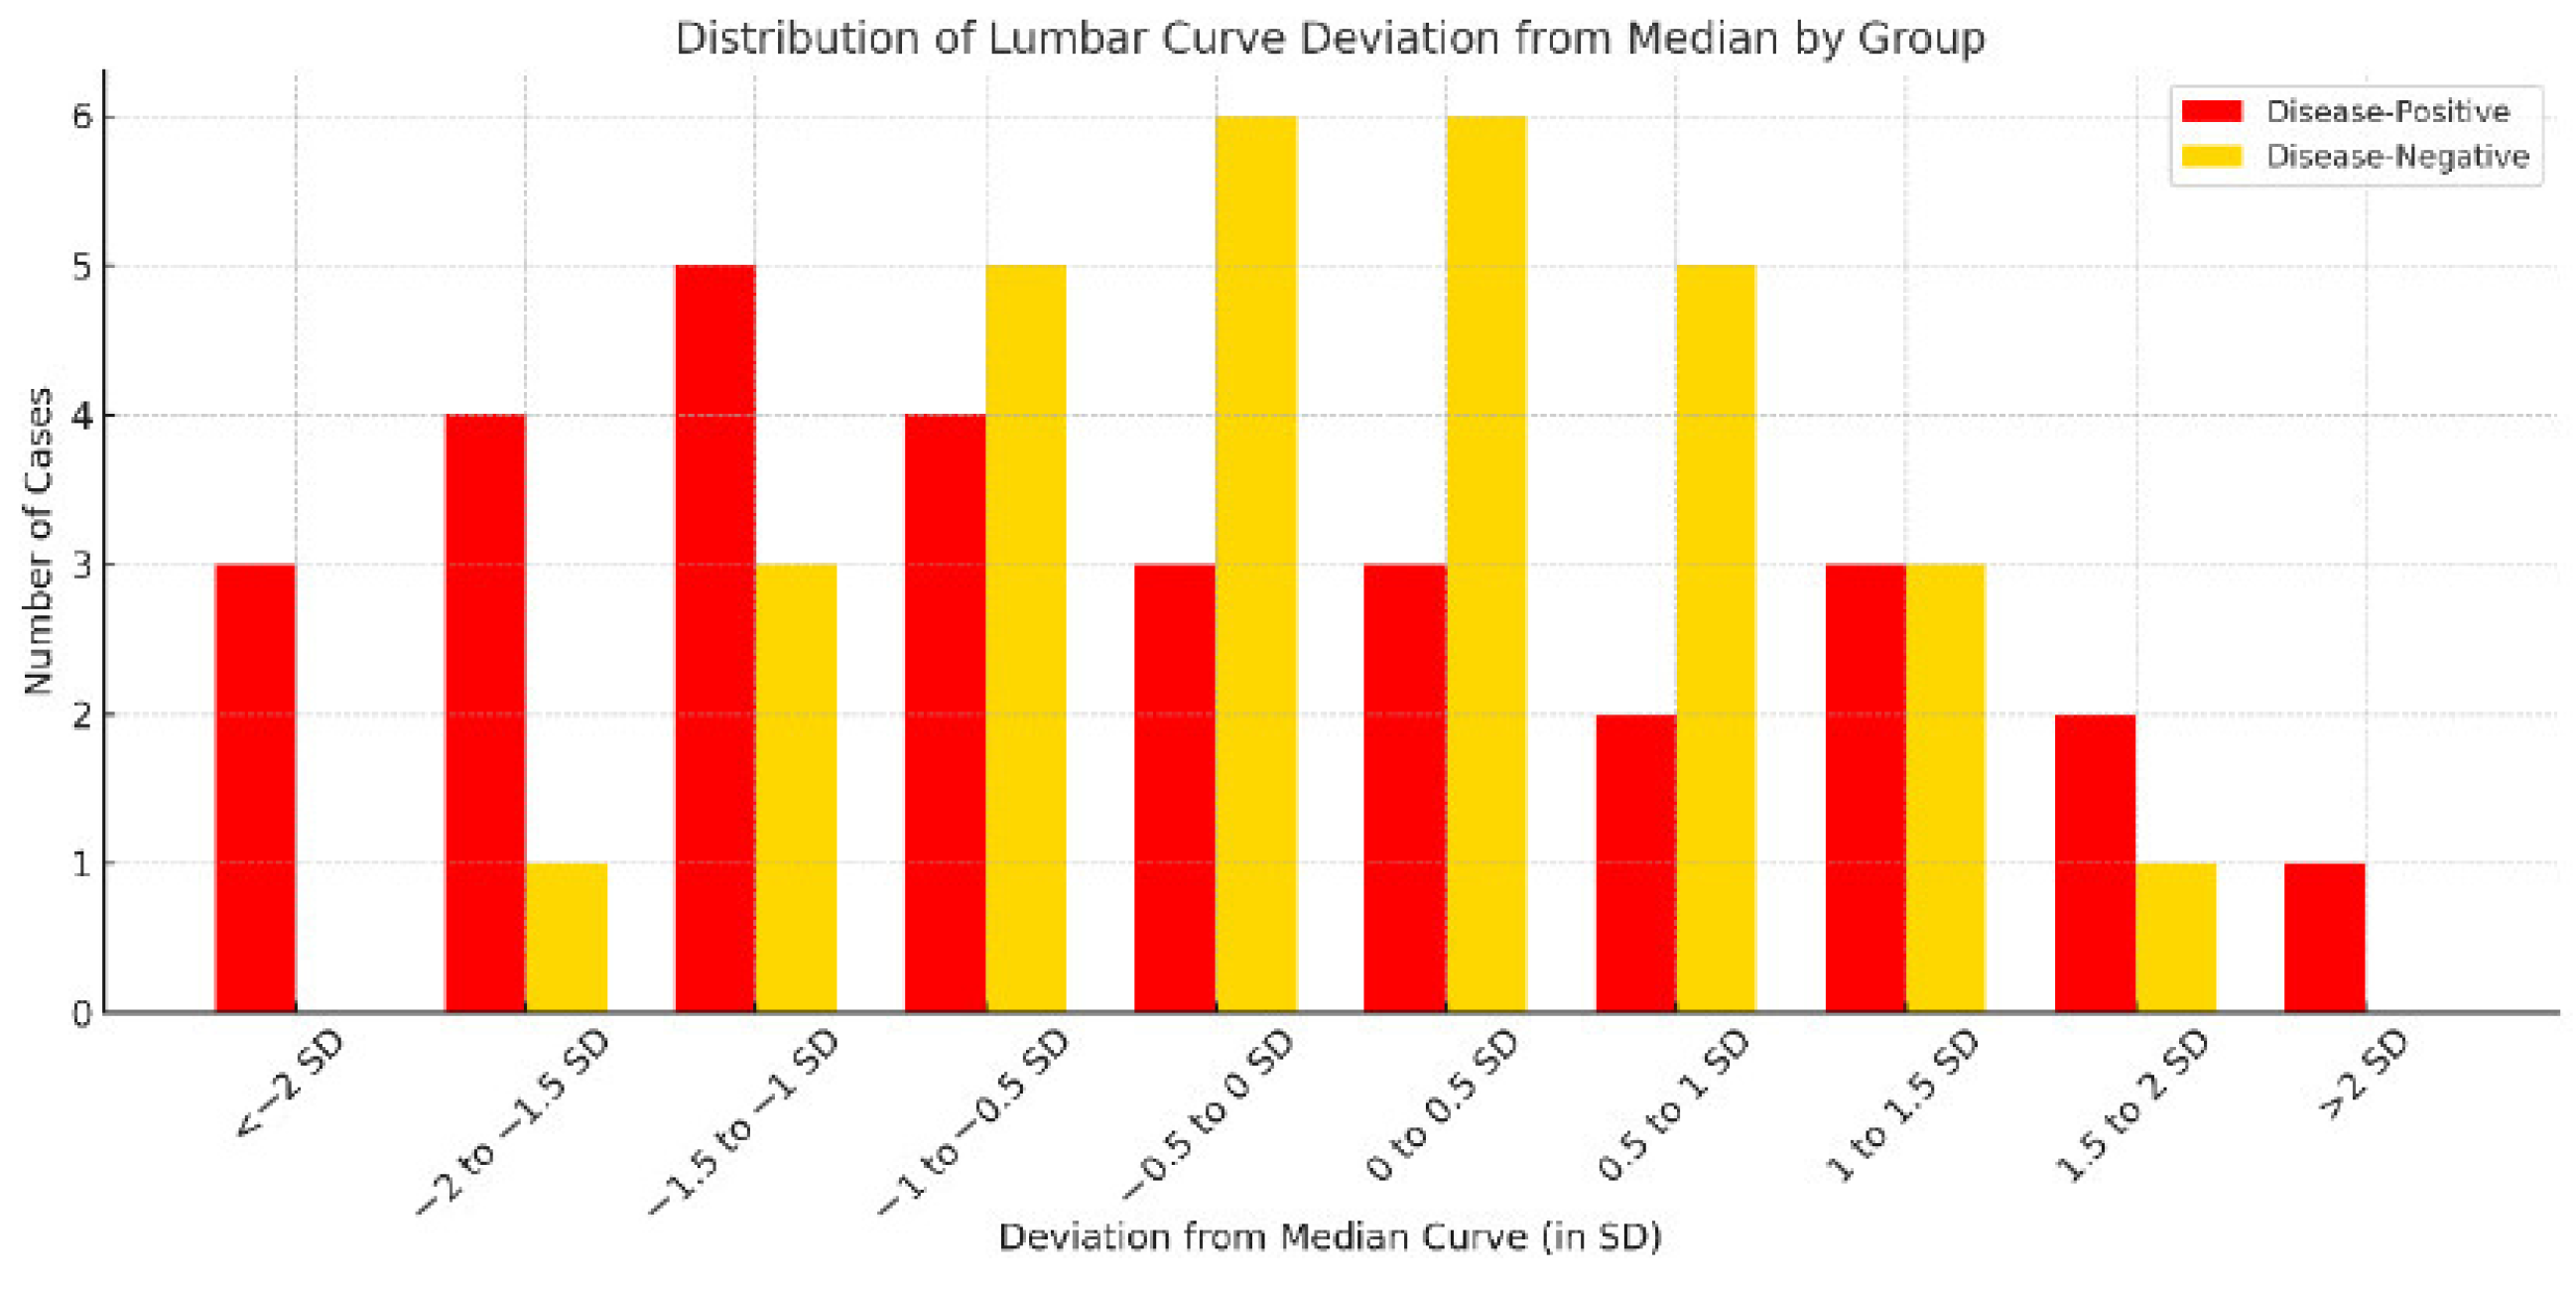
To further illustrate curvature deviation across groups, Figure 6 presents a histogram of lumbar curvature distribution according to distance from the group median (±1 SD, ±1.5 SD, and ±2 SD). The disease-negative group was primarily concentrated within ±1 SD of the median, consistent with a relatively stable central curvature pattern. In contrast, the disease-positive group showed a wider distribution, with more cases located beyond ±1.5 SD in both directions. This finding indicates that disease-positive cases tended to cluster at the extremes of curvature deviation.
Figure 6.
Histogram of lumbar curvature deviation by disease status. Figure 6 presents a histogram of lumbar curvature deviation using standard-deviation-based intervals. Compared with the disease-negative group, the disease-positive group showed a broader distribution across more extreme deviation categories, particularly beyond ±1.5 SD, indicating greater dispersion of curvature patterns in affected cases.
To further quantify these geometric differences, total curvature was calculated from the continuous lumbar curve model for each subject. Kruskal–Wallis testing showed that the overall difference among the three groups did not reach statistical significance (p = 0.096). However, density distribution analysis demonstrated a visible shift in the disease-positive group relative to the disease-negative group. These results suggest that total curvature may provide a preliminary quantitative descriptor of geometric variation, but they do not establish statistically significant group separation in the present pilot cohort.
4. Discussion
To our knowledge, this pilot study is among the first to apply curvature distribution profiling to characterize lumbar disorders based on sagittal radiographic deviation patterns. The disease-negative group showed a relatively centralized and symmetric curvature profile, whereas the disease-positive group demonstrated broader deviation toward both extremes of lumbar curvature. These findings are consistent with previous reports suggesting that abnormal lumbar lordosis patterns, whether reduced or exaggerated, may be associated with lumbar disorders [33,48,49]. Our results therefore suggest that chronic lumbar disease may involve deviation in lumbar curvature in either direction rather than a simple increase or decrease in a single angular parameter. The disease-positive group was intentionally defined as a clinically heterogeneous category to examine whether different lumbar disorders might share a common tendency toward deviation from the central curvature profile. Accordingly, the findings should be interpreted as exploratory pattern-based observations rather than disease-specific biomechanical conclusions, particularly given the limited subgroup sizes in this pilot cohort.
The present findings are also in line with previous studies indicating that curvature deviation may be more informative than lordosis magnitude alone when evaluating lumbar disease [28,29,30,31,32,33,48,49,50]. In the present study, the distribution of larger lumbar curvature values in the disease-positive group partially overlapped with that of the disease-negative group, suggesting that exaggerated lordosis alone may not sufficiently distinguish diseased from non-diseased cases. In contrast, reduced lumbar curvature was more concentrated in the disease-positive group, supporting the potential relevance of hypo-lordotic morphology in chronic low back pain. This pattern may be associated with a straighter lumbar alignment and possible compensatory thoracolumbar adaptation; however, the underlying mechanism and any relationship to functional instability could not be determined in the present study. Recent studies have also reported altered postural control and reduced muscular endurance in patients with lumbar spondylosis, supporting the concept that morphological deviation may reflect underlying functional imbalance [54]. Conventional measures such as the Cobb angle may not fully capture these geometric complexities [28,29,33,39,49]. Although direct numerical comparison with established radiographic parameters such as the Cobb angle, PI-LL, and SVA was not performed in the present study, future work should evaluate the diagnostic value and additional contribution of curvature profiling in conjunction with these standard indices.
Low back pain remains a clinically important condition, and improving the radiographic assessment of lumbar disorders remains relevant to routine practice [55]. Conventional angle-based methods have been widely applied to the evaluation of lumbar lordosis and spondylolisthesis, but they may provide only limited representation of global lumbar morphology and can be influenced by manual measurement variability. Although several alternative radiographic approaches have been proposed [36,37,39,40,41,42], evidence remains limited regarding the relationship between overall sagittal curvature patterns and low back pain beyond segment-based angular comparisons [23,49,56,57].
Unlike prior approaches that primarily focused on individual curvature measurement or alternative geometric fitting, the present framework emphasizes normalized cross-case profile comparison and deviation-pattern interpretation. Whereas conventional indices such as the Cobb angle and related lordosis measures provide discrete angular estimates based on selected landmarks, curvature profiling was designed to describe the overall geometric configuration of the lumbar spine more directly. In practice, this visual profiling framework may offer a straightforward way to recognize atypical curvature patterns on standard lumbar radiographs before more advanced imaging or quantitative assessment is considered. In this context, sagittal curvature modeling may assist routine radiographic interpretation by providing a whole-curve view of lumbar morphology, particularly when conventional angle-based measures appear inconclusive or do not fully reflect the overall sagittal configuration. Clinically, this may serve as a practical adjunct to standard radiographic assessment rather than a replacement for existing measurements. Previous studies have examined LLA as a potential predictive tool for low back pain [1,44,45,46,58], but lumbar instability, which is considered an important contributor to chronic low back pain, has not been fully explained by angle-based parameters alone [19,25,54,59,60]. Abnormal lumbar curvature has been recognized as a potential risk factor [61,62,63,64], and in older adults, chronic low back pain is often associated with reduced lumbar lordosis [31,65,66]. Although thoracolumbar compensation and ligamentous or degenerative changes have been proposed as possible explanations [65,67,68], sufficiently integrated methods for assessing overall lumbar curvature remain limited. Larger studies are needed to validate these observations and to determine whether curvature-based profiling has practical value in radiographic assessment. The present approach is intended as a descriptive adjunct to conventional radiographic assessment and should not be interpreted as demonstrating superiority over established radiographic measurements.
5. Limitations
This study has several limitations related to its pilot design and methodological framework. First, the analysis was based exclusively on static sagittal lumbar radiographs and therefore did not directly assess dynamic spinal instability. Although this study was motivated by the broader clinical need to identify early biomechanical changes associated with lumbar disorders, the proposed curve-profiling approach was intended to characterize static sagittal lumbar morphology. The observed distribution patterns should therefore be interpreted as preliminary morphological indicators rather than direct evidence of dynamic dysfunction. Further validation using motion-based imaging modalities such as flexion–extension radiographs or dynamic MRI is warranted.
Second, inter-observer agreement was not quantified using formal reliability metrics such as Cohen’s kappa or the intraclass correlation coefficient (ICC). Although all image interpretations were independently performed by a board-certified radiologist and an orthopedic specialist, and discrepancies were resolved by consensus, the absence of quantified reliability measures remains a methodological limitation. Because this was an exploratory pilot study primarily intended to assess the feasibility of curvature distribution analysis, formal inter-rater testing was not performed. Future studies should incorporate inter-rater reliability analysis to improve reproducibility. Because the vertebral centroids were manually identified, the lack of formal intra-observer and inter-observer repeatability data remains an important methodological limitation, and formal reproducibility testing will be essential in future validation studies. In this pilot study, manual centroid selection was used to establish the feasibility of the curve-profiling framework under controlled visual assessment and to ensure anatomically consistent landmark placement across cases. Future studies may incorporate automated or AI-assisted vertebral landmark detection to improve efficiency, standardization, and reproducibility, particularly in larger datasets and routine clinical workflows.
Third, the sample size was limited to 50 cases, which restricted statistical power and generalizability. In particular, the overlap observed between disease-positive and disease-negative cases in the hyper-lordosis subgroup could not be fully interpreted because of the limited number of subjects. In addition, although a preliminary curvature-derived quantitative analysis was performed, the study remained underpowered for definitive inference. These issues should be addressed in future studies with larger cohorts. In addition, because the disease-positive group included heterogeneous lumbar disorders with potentially different biomechanical relationships to sagittal curvature, the present grouping also limited disease-specific interpretation of the observed curvature patterns. Moreover, demographic characteristics, detailed pathology categories, and non-radiographic comorbidities were not systematically collected in the original study design. Therefore, the present study could not evaluate the potential influence of these factors on pain presentation or curvature patterns. Accordingly, subgroup analyses based on age, sex, BMI, pathology type, or comorbidity status were not feasible in the present study.
Finally, no direct numerical comparison was performed between the proposed method and established radiographic parameters such as the Cobb angle, PI-LL, or SVA. Therefore, the additional contribution of curvature distribution profiling relative to standard measurements could not be determined in the present study. Although the present approach offers an alternative way to describe sagittal alignment, its diagnostic performance, including sensitivity, specificity, and predictive value, remains to be established. Future studies should include direct comparative analyses with established radiographic parameters to clarify the additional value of curvature distribution profiling in clinical practice.
6. Conclusions
This pilot study showed that lumbar curvature distribution profiling can depict sagittal morphological variation associated with lumbar musculoskeletal disorders on standing radiographs. Both reduced and exaggerated lumbar curvature patterns were observed in disease-positive cases, suggesting that deviation from a central curvature profile may provide complementary morphological information alongside conventional angle-based assessment. Although the present findings remain preliminary, curvature profiling may offer a complementary radiographic approach for describing sagittal lumbar morphology. Larger studies are needed to determine whether the observed visual and quantitative patterns remain reproducible in broader cohorts.
Author Contributions
Y.-L.W. and K.-C.L. conceptualized the study. Y.-L.W., S.-W.H., H.-Y.C. and K.-C.L. curated the data. Y.-L.W., S.-W.H. and C.-M.C. performed the formal analysis. Y.-L.W., K.-C.L. and C.-M.C. acquired funding. Y.-L.W., K.-C.L. and C.-M.C. developed the methodology. S.-W.H., K.-C.L. and C.-M.C. supervised the study. S.-W.H., H.-Y.C., K.-C.L. and C.-M.C. validated the findings. Y.-L.W. and S.-W.H. wrote the original draft. S.-W.H., K.-C.L. and C.-M.C. reviewed and edited the manuscript. All authors have read and agreed to the published version of the manuscript.
Funding
This research was funded by Taiwan’s National Tsing Hua University (113QF013E1, 114Q2301E1), Hualien Armed Forces General Hospital (HAFGH_D 114012) and Tri-Service General Hospital (TSGH-D-114129, NSTC 113-2635-B-016-002).
Institutional Review Board Statement
This study was conducted in accordance with the Declaration of Helsinki and approved by the Institutional Review Board of Tri-Service General Hospital (IRB No. C202405032) on 13 March 2024.
Informed Consent Statement
Because this was a retrospective study using de-identified imaging and clinical data, the requirement for informed consent to participate was waived by the Institutional Review Board. This manuscript does not contain any individual person’s identifiable data, images, or personal information requiring consent for publication.
Data Availability Statement
The datasets used and/or analyzed during the current study are available from the corresponding author on reasonable request, subject to institutional and ethical regulations regarding de-identified clinical imaging data.
Acknowledgments
The authors thank the staff of the Department of Surgery, Hualien Armed Forces General Hospital, for assistance with radiographic data collection and administrative support. The authors gratefully acknowledge financial support from the National Science and Technology Council, Taiwan (Grant No. NSTC 113-2635-B-016-002). During the preparation of this manuscript, the authors used ChatGPT (OpenAI, GPT-5.4) for the purposes of revising grammar and polishing sentences. The authors have reviewed and edited the output and take full responsibility for the content of this publication.
Conflicts of Interest
The authors declare that the research was conducted in the absence of any commercial or financial relationships that could be construed as potential conflicts of interest.
References
- Fedorchuk, C.A.; Fedorchuk, C.G.; Lightstone, D.F. Improvement in Pain, Quality of Life, and Urinary Dysfunction following Correction of Lumbar Lordosis and Reduction in Lumbar Spondylolistheses Using Chiropractic BioPhysics® Structural Spinal Rehabilitation: A Case Series with >1-Year Long-Term Follow-Up Exams. J. Clin. Med. 2024, 13, 2024. [Google Scholar] [CrossRef] [Scilit]
- Husky, M.M.; Ferdous Farin, F.; Compagnone, P.; Fermanian, C.; Kovess-Masfety, V. Chronic back pain and its association with quality of life in a large French population survey. Health Qual. Life Outcomes 2018, 16, 195. [Google Scholar] [CrossRef] [Scilit]
- Agnus Tom, A.; Rajkumar, E.; John, R.; Joshua George, A. Determinants of quality of life in individuals with chronic low back pain: A systematic review. Health Psychol. Behav. Med. 2022, 10, 124–144. [Google Scholar] [CrossRef] [Scilit] [PubMed]
- Simonet, E.; Winteler, B.; Frangi, J.; Suter, M.; Meier, M.L.; Eichelberger, P.; Baur, H.; Schmid, S. Walking and running with non-specific chronic low back pain: What about the lumbar lordosis angle? J. Biomech. 2020, 108, 109883. [Google Scholar] [CrossRef] [Scilit]
- Wu, W.-T.; Chang, K.-V.; Mezian, K.; Ricci, V.; Özçakar, L. Integrating Ultrasound-Guided Injections and Peripheral Magnetic Stimulation in Chronic Myofascial/Lumbar Pain. Life 2025, 15, 563. [Google Scholar] [CrossRef] [Scilit]
- Kao, Y.-C.; Chen, J.-Y.; Chen, H.-H.; Liao, K.-W.; Huang, S.-S. The association between depression and chronic lower back pain from disc degeneration and herniation of the lumbar spine. Int. J. Psychiatry Med. 2022, 57, 165–177. [Google Scholar] [CrossRef] [Scilit]
- Huang, Y.-C.; Chang, C.-H.; Lin, C.-L.; Wang, L.-J.; Hsu, C.-W.; Su, Y.-F.; Lo, Y.-C.; Hung, C.-F.; Hsieh, Y.-Y.; Chen, C.-S. Prevalence and outcomes of major psychiatric disorders preceding index surgery for degenerative thoracic/lumbar spine disease. Int. J. Environ. Res. Public Health 2021, 18, 5391. [Google Scholar] [CrossRef] [Scilit]
- Saraste, H. Long-term clinical and radiological follow-up of spondylolysis and spondylolisthesis. J. Pediatr. Orthop. 1987, 7, 631–638. [Google Scholar] [CrossRef] [Scilit] [PubMed]
- Ward, C.V.; Latimer, B.; Alander, D.H.; Parker, J.; Ronan, J.A.; Holden, A.D.; Sanders, C. Radiographic assessment of lumbar facet distance spacing and spondylolysis. Spine 2007, 32, E85–E88. [Google Scholar] [CrossRef] [Scilit]
- Amato, M.; Totty, W.; Gilula, L. Spondylolysis of the lumbar spine: Demonstration of defects and laminal fragmentation. Radiology 1984, 153, 627–629. [Google Scholar] [CrossRef] [Scilit] [PubMed]
- McGill, S.M.; Grenier, S.; Kavcic, N.; Cholewicki, J. Coordination of muscle activity to assure stability of the lumbar spine. J. Electromyogr. Kinesiol. 2003, 13, 353–359. [Google Scholar] [CrossRef] [Scilit]
- Cholewicki, J.; Simons, A.P.; Radebold, A. Effects of external trunk loads on lumbar spine stability. J. Biomech. 2000, 33, 1377–1385. [Google Scholar] [CrossRef] [Scilit]
- Ferreira, M.L.; de Luca, K.; Haile, L.M.; Steinmetz, J.D.; Culbreth, G.T.; Cross, M.; Kopec, J.A.; Ferreira, P.H.; Blyth, F.M.; Buchbinder, R.; et al. Global, regional, and national burden of low back pain, 1990–2020, its attributable risk factors, and projections to 2050: A systematic analysis of the Global Burden of Disease Study 2021. Lancet Rheumatol. 2023, 5, e316–e329. [Google Scholar] [CrossRef] [Scilit]
- Freburger, J.K.; Holmes, G.M.; Agans, R.P.; Jackman, A.M.; Darter, J.D.; Wallace, A.S.; Castel, L.D.; Kalsbeek, W.D.; Carey, T.S. The rising prevalence of chronic low back pain. Arch. Intern. Med. 2009, 169, 251–258. [Google Scholar] [CrossRef] [Scilit]
- Ugwu, C.I.; Pope, D. Quantifying the association between psychological distress and low back pain in urban Europe: A secondary analysis of a large cross-sectional study. BMJ Open 2023, 13, e047103. [Google Scholar] [CrossRef] [Scilit] [PubMed]
- Bergmark, A. Stability of the lumbar spine: A study in mechanical engineering. Acta Orthop. Scand. 1989, 60, 1–54. [Google Scholar] [CrossRef] [Scilit] [PubMed]
- Wagner, H.; Anders, C.; Puta, C.; Petrovitch, A.; Mörl, F.; Schilling, N.; Witte, H.; Blickhan, R. Musculoskeletal support of lumbar spine stability. Pathophysiology 2005, 12, 257–265. [Google Scholar] [CrossRef] [Scilit]
- Haher, T.R.; O’Brien, M.; Dryer, J.W.; Nucci, R.; Zipnick, R.; Leone, D.J. The role of the lumbar facet joints in spinal stability: Identification of alternative paths of loading. Spine 1994, 19, 2667–2670. [Google Scholar] [CrossRef] [Scilit]
- Kim, H.-J.; Chung, S.; Kim, S.; Shin, H.; Lee, J.; Kim, S.; Song, M.Y. Influences of trunk muscles on lumbar lordosis and sacral angle. Eur. Spine J. 2006, 15, 409–414. [Google Scholar] [CrossRef] [Scilit]
- McGregor, A.; Hukins, D. Lower limb involvement in spinal function and low back pain. J. Back Musculoskelet. Rehabil. 2009, 22, 219–222. [Google Scholar] [CrossRef] [Scilit] [PubMed]
- Reddy, R.S.; Alahmari, K.A.; Samuel, P.S.; Tedla, J.S.; Kakaraparthi, V.N.; Rengaramanujam, K. Intra-rater and inter-rater reliability of neutral and target lumbar positioning tests in subjects with and without non-specific lower back pain. J. Back Musculoskelet. Rehabil. 2021, 34, 289–299. [Google Scholar] [CrossRef] [Scilit]
- Eskandari, A.H.; Ghezelbash, F.; Shirazi-Adl, A.; Larivière, C. Comparative evaluation of different spinal stability metrics. J. Biomech. 2024, 162, 111901. [Google Scholar] [CrossRef] [Scilit]
- Du, S.-H.; Zhang, Y.-H.; Yang, Q.-H.; Wang, Y.-C.; Fang, Y.; Wang, X.-Q. Spinal posture assessment and low back pain. EFORT Open Rev. 2023, 8, 708–718. [Google Scholar] [CrossRef] [Scilit] [PubMed]
- Pourahmadi, M.; Takamjani, I.E.; Sarrafzadeh, J.; Mohsenifar, H.; Fazeli, S.H.; Bagheri, R.; Taghipour, M. Effect of chronic low back pain on lumbar spine lordosis during sit-to-stand and stand-to-sit. J. Manip. Physiol. Ther. 2020, 43, 79–92. [Google Scholar] [CrossRef] [Scilit] [PubMed]
- Izzo, R.; Guarnieri, G.; Guglielmi, G.; Muto, M. Biomechanics of the spine. Part I: Spinal stability. Eur. J. Radiol. 2013, 82, 118–126. [Google Scholar] [CrossRef] [Scilit]
- Been, E.; Kalichman, L. Lumbar lordosis. Spine J. 2014, 14, 87–97. [Google Scholar] [CrossRef] [Scilit]
- Associations between degenerative lumbar scoliosis structures and pain distribution in adults with chronic low back pain. Healthcare 2023, 11, 2357.
- Wang, X.-D.; Ma, L.; Wang, D.-H.; Yan, J.-T. Relationships among the lumbar lordosis index, sacral horizontal angle, and chronic low back pain in the elderly aged 60–69 years: A cross-sectional study. J. Back Musculoskelet. Rehabil. 2020, 33, 29–33. [Google Scholar] [CrossRef] [Scilit] [PubMed]
- Tamartash, H.; Bahrpeyma, F. Evaluation of lumbar myofascial release effects on lumbar flexion angle and pelvic inclination angle in patients with non-specific low back pain. Int. J. Ther. Massage Bodyw. 2022, 15, 15. [Google Scholar] [CrossRef] [Scilit]
- Bozorgmehr, A.; Takamjani, I.E.; Akbari, M.; Salehi, R.; Mohsenifar, H.; Rasouli, O. Effect of posterior pelvic tilt taping on abdominal muscle thickness and lumbar lordosis in individuals with chronic low back pain and hyperlordosis: A single-group, repeated-measures trial. J. Chiropr. Med. 2020, 19, 213–221. [Google Scholar] [CrossRef] [Scilit] [PubMed]
- Park, M.W.; Park, S.J.; Chung, S.G. Relationships between skeletal muscle mass, lumbar lordosis, and chronic low back pain in the elderly. Neurospine 2023, 20, 959. [Google Scholar] [CrossRef] [Scilit]
- In, T.-S.; Jung, J.-H.; Jung, K.-S.; Cho, H.-Y. Effects of the multidimensional treatment on pain, disability, and sitting posture in patients with low back pain: A randomized controlled trial. Pain Res. Manag. 2021, 2021, 5581491. [Google Scholar] [CrossRef] [Scilit]
- Kim, W.-M.; Seo, Y.-G.; Park, Y.-J.; Cho, H.-S.; Lee, C.-H. Effect of different exercise types on the cross-sectional area and lumbar lordosis angle in patients with flat back syndrome. Int. J. Environ. Res. Public Health 2021, 18, 10923. [Google Scholar] [CrossRef] [Scilit]
- Polly, D.W., Jr.; Kilkelly, F.X.; McHale, K.A.; Asplund, L.M.; Mulligan, M.; Chang, A.S. Measurement of lumbar lordosis: Evaluation of intraobserver, interobserver, and technique variability. Spine 1996, 21, 1530–1535. [Google Scholar] [CrossRef] [Scilit]
- Lin, R.; Jou, I.-M.; Yu, C.-Y. Lumbar lordosis: Normal adults. J. Formos. Med. Assoc. Taiwan yi zhi 1992, 91, 329–333. [Google Scholar] [PubMed]
- Eddine, H.K.; Saleh, S.; Hajjar, J.; Harati, H.; Nasser, Z.; Desoutter, A.; Al Ahmar, E.; Estephan, E. Evaluation of the accuracy of new modalities in the assessment and classification of lumbar lordosis: A comparison to Cobb’s angle measurement. Heliyon 2023, 9, e18952. [Google Scholar] [CrossRef] [Scilit] [PubMed]
- Chernukha, K.V.; Daffner, R.H.; Reigel, D.H. Lumbar lordosis measurement: A new method: Versus: Cobb technique. Spine 1998, 23, 74–79. [Google Scholar] [CrossRef] [Scilit]
- Whittle, M.W.; Levine, D. Measurement of lumbar lordosis as a component of clinical gait analysis. Gait Posture 1997, 5, 101–107. [Google Scholar] [CrossRef] [Scilit]
- Russell, B.S.; Muhlenkamp-Wermert, K.A.; Hoiriis, K.T. Measurement of lumbar Lordosis: A comparison of 2 alternatives to the cobb angle. J. Manip. Physiol. Ther. 2020, 43, 760–767. [Google Scholar] [CrossRef] [Scilit]
- Okpala, F. Comparison of four radiographic angular measures of lumbar lordosis. J. Neurosci. Rural. Pract. 2018, 9, 298. [Google Scholar] [CrossRef] [Scilit]
- Seidi, F.; Rajabi, R.; Ebrahimi, T.; Tavanai, A.; Moussavi, S. The Iranian flexible ruler reliability and validity in lumbar lordosis measurements. World J. Sport Sci. 2009, 2, 95–99. [Google Scholar]
- Mehta, K. Normative values of lumbar lordosis index assessed by using flexible ruler and its correlation with confounding factors. Indian J. Nat. Sci. 2023, 14, 55778–55782. [Google Scholar]
- Cho, B.H.; Kaji, D.; Cheung, Z.B.; Ye, I.B.; Tang, R.; Ahn, A.; Carrillo, O.; Schwartz, J.T.; Valliani, A.A.; Oermann, E.K.; et al. Automated measurement of lumbar lordosis on radiographs using machine learning and computer vision. Glob. Spine J. 2020, 10, 611–618. [Google Scholar] [CrossRef] [Scilit]
- Pan, C.; Wang, G.; Sun, J. Correlation between the apex of lumbar lordosis and pelvic incidence in asymptomatic adult. Eur. Spine J. 2020, 29, 420–427. [Google Scholar] [CrossRef] [Scilit]
- Kang, D.-H.; Lee, J.H.; Chang, B.-S.; Chang, S.Y.; Kim, D.; Park, S.; Kim, H. Predicting adequate segmental lordosis correction in lumbar spinal stenosis patients undergoing oblique lumbar interbody fusion: A focus on the discontinuous segment. Eur. Spine J. 2024, 33, 1957–1966. [Google Scholar] [CrossRef] [Scilit] [PubMed]
- Song, K.; Chi, P.; Yang, Q.; Yang, C.; Wang, B.; Li, F.; Zhu, Z.; Li, W.; Zhang, J.; Wang, Z. Sagittal balance of the spine-lumbar lordosis or lumbosacral lordosis? medRxiv 2024. [Google Scholar] [CrossRef] [Scilit]
- Harrison, D.E.; Haas, J.W.; Moustafa, I.M.; Betz, J.W.; Oakley, P.A. Can the Mismatch of Measured Pelvic Morphology vs. Lumbar Lordosis Predict Chronic Low Back Pain Patients? J. Clin. Med. 2024, 13, 2178. [Google Scholar] [CrossRef] [Scilit]
- Oakley, P.A.; Ehsani, N.N.; Moustafa, I.M.; Harrison, D.E. Restoring lumbar lordosis: A systematic review of controlled trials utilizing Chiropractic Bio Physics®(CBP®) non-surgical approach to increasing lumbar lordosis in the treatment of low back disorders. J. Phys. Ther. Sci. 2020, 32, 601–610. [Google Scholar] [CrossRef] [Scilit]
- Tekeli, M.; Erdem, H.; Kilic, N.; Boyan, N.; Oguz, O.; Soames, R.W. Evaluation of lumbar lordosis in symptomatic individuals and comparative analysis of six different techniques: A retrospective radiologic study. Eur. Spine J. 2023, 32, 4118–4127. [Google Scholar] [CrossRef] [Scilit]
- Elabd, A.M.; Elabd, O.M. Relationships between forward head posture and lumbopelvic sagittal alignment in older adults with chronic low back pain. J. Bodyw. Mov. Ther. 2021, 28, 150–156. [Google Scholar] [CrossRef] [Scilit]
- Weiner, S.S.; Nordin, M. Prevention and management of chronic back pain. Best Pract. Res. Clin. Rheumatol. 2010, 24, 267–279. [Google Scholar] [CrossRef] [Scilit]
- Smeets, R.J.; Vlaeyen, J.W.; Kester, A.D.; Knottnerus, J.A. Reduction of pain catastrophizing mediates the outcome of both physical and cognitive-behavioral treatment in chronic low back pain. J. Pain 2006, 7, 261–271. [Google Scholar] [CrossRef] [Scilit]
- Hall, A.M.; Maher, C.G.; Latimer, J.; Ferreira, M.L.; Lam, P. A randomized controlled trial of tai chi for long-term low back pain (TAI CHI): Study rationale, design, and methods. BMC Musculoskelet. Disord. 2009, 10, 55. [Google Scholar] [CrossRef] [Scilit]
- Alfaya, F.F.; Reddy, R.S.; Alshahrani, M.S.; Gautam, A.P.; Mukherjee, D.; Al Salim, Z.A.; Alqhtani, R.S.; Ghulam, H.S.H.; Alyami, A.M.; Al Adal, S.; et al. Exploring the interplay of muscular endurance, functional balance, and limits of stability: A comparative study in individuals with lumbar spondylosis using a computerized Stabilometric force platform. Life 2023, 13, 2104. [Google Scholar] [CrossRef] [Scilit] [PubMed]
- Badhiwala, J.H.; Ahuja, C.S.; Akbar, M.A.; Witiw, C.D.; Nassiri, F.; Furlan, J.C.; Curt, A.; Wilson, J.R. Degenerative cervical myelopathy—Update and future directions. Nat. Rev. Neurol. 2020, 16, 108–124. [Google Scholar] [CrossRef] [Scilit]
- Zanguie, H.; Yousefi, M.; Ilbiegi, S.; Pezeshk, A.F. Validity and Reliability of Non-Invasive Methods for Evaluating Kyphosis and Lordosis Curvatures: A Literature Review. J. Mod. Rehabil. 2023, 17, 251–262. [Google Scholar] [CrossRef] [Scilit]
- Pesenti, S.; Prost, S.; Solla, F.; Ilharreborde, B.; Ferrero, E.; Obeid, I.; Riouallon, G.; Laouissat, F.; Charles, Y.P.; Blondel, B.; et al. Modern concepts in sagittal curve measurement: Comparison of spline-based and fixed landmark measurements in a cohort of 1520 healthy subjects. Spine 2024, 49, 1012–1020. [Google Scholar] [CrossRef] [Scilit]
- Evcik, D.; Yücel, A. Lumbar lordosis in acute and chronic low back pain patients. Rheumatol. Int. 2003, 23, 163–165. [Google Scholar] [CrossRef] [Scilit]
- White, A.A.I.; Med Johnson, R.M.; Panjabi, M.M.; Tech Southwick, W.O. Biomechanical Analysis of Clinical Stability in the Cervical Spine. Clin. Orthop. Relat. Res. 1975, 109, 85–96. [Google Scholar] [CrossRef] [Scilit]
- Saludes, R.; Acevedo, P.; García, I.Z.; Gómez Carrión, Á.; Martínez Sebastián, C.; Núñez Fernández, A.; Seco-Armell, I.; Sánchez-Gómez, R. Abdominal adiposity increases lordosis and doubles the risk of low back pain. Appl. Sci. 2022, 12, 7616. [Google Scholar] [CrossRef] [Scilit]
- Widmer, J.; Cornaz, F.; Scheibler, G.; Spirig, J.M.; Snedeker, J.G.; Farshad, M. Biomechanical contribution of spinal structures to stability of the lumbar spine—Novel biomechanical insights. Spine J. 2020, 20, 1705–1716. [Google Scholar] [CrossRef] [Scilit] [PubMed]
- Louis, R. Spinal stability as defined by the three-column spine concept. Anat. Clin. 1985, 7, 33–42. [Google Scholar] [CrossRef] [Scilit]
- Su, Q.; Li, C.; Li, Y.; Zhou, Z.; Zhang, S.; Guo, S.; Feng, X.; Yan, M.; Zhang, Y.; Zhang, J.; et al. Analysis and improvement of the three-column spinal theory. BMC Musculoskelet. Disord. 2020, 21, 537. [Google Scholar] [CrossRef] [Scilit] [PubMed]
- Inoue, N.; Orías, A.A.E.; Segami, K. Biomechanics of the lumbar facet joint. Spine Surg. Relat. Res. 2020, 4, 1–7. [Google Scholar] [CrossRef] [Scilit] [PubMed]
- Skundric, G.; Vukicevic, V.; Lukic, N. Effects of core stability exercises, lumbar lordosis and low-back pain: A systematic review. J. Anthropol. Sport Phys. Educ. 2021, 5, 17–23. [Google Scholar] [CrossRef] [Scilit]
- Chun, S.-W.; Lim, C.-Y.; Kim, K.; Hwang, J.; Chung, S.G. The relationships between low back pain and lumbar lordosis: A systematic review and meta-analysis. Spine J. 2017, 17, 1180–1191. [Google Scholar] [CrossRef] [Scilit]
- Hodges, P.W.; Richardson, C.A. Delayed postural contraction of transversus abdominis in low back pain associated with movement of the lower limb. Clin. Spine Surg. 1998, 11, 46–56. [Google Scholar] [CrossRef] [Scilit]
- Kim, J.C.; Kim, J.-G.; Kim, B.S.; Kim, C.K.; Choi, M.; Lee, J.; Chung, S.G. Assessing the Preservation of Lumbar Lordotic Curvature in Everyday Sitting Conditions Assessed with an Inertial Measurement System. J. Clin. Med. 2024, 13, 2728. [Google Scholar] [CrossRef] [Scilit]

Disclaimer/Publisher’s Note: The statements, opinions and data contained in all publications are solely those of the individual author(s) and contributor(s) and not of MDPI and/or the editor(s). MDPI and/or the editor(s) disclaim responsibility for any injury to people or property resulting from any ideas, methods, instructions or products referred to in the content. |
© 2026 by the authors. Licensee MDPI, Basel, Switzerland. This article is an open access article distributed under the terms and conditions of the Creative Commons Attribution (CC BY) license.