Abstract
Wire electrical discharge machining (WEDM) has been, for many years, a precise and efficient non-conventional manufacturing solution in various industrial applications, mostly involving the use of hard-to-machine materials like, among others, the Inconel super alloys. The focus of the present study is on exploring the effect of selected control parameters, including pulse duration, pulse-off time and the dielectric flow pressure on the WEDM process performance characteristics of Inconel 617 material, such as: volumetric material removal rate (MRR), the dimensional accuracy of cutting (reflected by the kerf width) and surface roughness (SR). The research experiment has been designed and carried out using the response surface methodology (RSM) accordingly with the Box–Behnken design scheme. The results of experiments derived in the form of a fitted regression model have been subjected to the analysis of variance (ANOVA) tests. Thus, the variable process parameters and the relevant interactions between them, characterized by a significant influence on the values of the derived output responses, could be explicitly determined.
1. Introduction
Rapid technological development has recently created a demand for new materials that would have properties enabling their use under harsh operating conditions, including the high temperature, aggressive chemical environment, at variable loads and others. Conditions of such a nature occur, inter alia, in gas turbines, nuclear reactors, power generators equipment or chemical industry installations [1]. One such material is an alloy based on nickel and chromium, which also contains other elements such as: niobium, iron, aluminum [2], commercially termed as “Inconel”. These materials are characterized by temperature strength, low thermal diffusivity, high hardness and others, to be classified as super alloys [1,2]. These properties cause that this material is used among others in gas turbine disks or responsible aircraft components. The Inconel super alloys belong to the group of hard-to-machine materials, which is considered as one of their major drawbacks. This is due to high content of abrasive particles in this alloy, its low thermal and electrical conductivity, high tendency to welding to the tool, and forming built-up edges, etc. [1,2].
Electrical discharge machining (EDM), and its variety implemented using a wire, and referred to as wire electrical discharge machining (WEDM), are among those types of technologies where the above-mentioned characteristics of machined material have no major impact on the final machining result. This type of non-conventional processing has been known since the 1940s, and for many decades applied in modern industry as CNC controlled precision machining, including non-standard applications, as in e.g., [3], despite the substantial disadvantage of the technology concerning high energy consumption and its quite low efficiency.
There are relatively few reports in the literature on modelling or investigating the efficiency and effectiveness of machining Inconel alloys with EDM methods. One is the work of Hevidy et al. [1], which highlights the development of mathematical models for correlating the relationships of various process parameters in wire EDM machining of Inconel 601 on the characteristics of performance, based on the response surface methodology approach (RSM), approach to the design of experiment (DoE), and its analysis. It studies the influence of four process factors on the volumetric material removal rate (MRR), wear ratio (work-related volumetric MRR as a percentage of wire MRR) and surface roughness (SR). The presented results show the variability of the volumetric MRR parameter in the range of 4-8 mm3/min and the Ra parameter within 0.25–7.5 µm. The authors conclude that the Ra parameter drops down with the increase in wire tension, that would, however, require consideration of whether the value of waviness filtered out the roughness parameter value of Ra. The experimental results in [4] revealed that pulse-on time, pulse-off time and servo voltage greatly affect the MRR and SR characteristics. In the research paper [5] in particular, a successful attempt was made to optimise the above-mentioned process parameters for increased MRR and SR in wire EDM of Inconel 625 alloy, using Taguchi methodical scheme and ANOVA.
The paper [6] reports on the influence of the newly type of copper-based SiC electrode, developed, among others, for wire-cut EDM applications, on material removal efficiency and on surface finish in main and trim cuts. As a result, they obtained an increase in cutting efficiency by an average of 16%, and the Ra parameter value decreased by about 17% on average. In the research paper [7], an impact of chief process parameters of WEDM of Inconel 617 on the micro-hardness of machined surfaces and the density of created surface cracks was investigated. In the conclusion, it is stated that the value of micro-hardness and number of micro-cracks increase with the value of pulse current and pulse duration. The study of Li et al. [2] presents the characteristics of surface integrity versus discharge energy. In this work, surface roughness is shown to be equivalent for parallel and perpendicular wire directions, and its mean value can be significantly reduced through lowering the discharge energy. They compared the surface structure in the main and the trim cuts and reported on observed thick white layers, predominantly discontinuous and non-uniform with confined micro voids, at the increased energy of discharge. An adequate review of the state-of-art research on surface integrity issues considering also WEDM processes of nickel-based super alloys can be found in [8]. In [9], the authors report in turn on performed experimental investigation with the aim to determine the main WEDM parameters, which contribute to recast layer formation (between 5 and 9 µm in average thickness) in Inconel alloy material. It was found that average recast layer thickness increased primarily with energy per spark, peak discharge current, and pulse duration. Selected results concerning the influence of processing conditions on stereometric surface parameters and the morphology of the surface layer in WEDM of hard machinable materials, including in part to Inconel alloys, are provided in [10].
At the same time, numerous reports can be found in the literature which tackle the issues related to machining other type alloys with EDM. Mostafafor and Vahedi [11] in particular presents results of tests on the magnesium alloy in the view of its effective machining. Various aspects of the accuracy and efficiency of the WEDM process of magnesium alloys are addressed in [12]. Likewise, a paper of Markopoulos et al. [13,14] discusses the results of experimental study on selecting process conditions that determine the quality of WEDM of an aluminum alloy. Discussion of issues of choosing the right conditions for WEDM of titanium alloys can be found in [15]. In the paper of Rao and Krishna [16] the optimization capabilities of some performance characteristics in WEDM machining of reinforced ZC63 alloy metal matrix composite (MMC).
The analyzed literature reports do not present a complete description of the machining process characteristics of Inconel alloys, and results are focused on selected input parameters, tested in relatively limited ranges, which is the missing element, particularly within the current knowledge on machining Inconel alloys by wire-EDM. The purpose of this research is to determine the process efficiency, its accuracy and the workpiece surface integrity in relation to three process parameters, i.e., pulse-on time (T-on), pulse off time (T-off) and the dielectric flow pressure (DFP). Those parameters were chosen because, besides the voltage, they are the basic machining parameters having the influence on the machining efficiency. The flushing pressure, in turn, effects the intensity of the removal of WEDM process debris from the machining zone, which inhibits the processing intensity.
2. Materials and Methods
The electrical discharge manufacturing process uses electrical discharges between the workpiece and the working electrode to the removal of material form processed part component. The energy of a single discharge causes a local melting of the material, which then is removed by the flowing dielectric. Such a material removal phenomenon means that processing materials must possess a conductivity higher than 10−2 S/cm. In the WEDM method, the electrode is usually made of a brass or the other alloy, and it is moved by the machine heads, which are steered by the CNC controller.
The schematic diagram of the device is shown in Figure 1a. The wire moving in the material cuts the kerf larger than the its diameter; the scheme of this process is shown in Figure 1b. The difference between of the kerf width and the wire diameter is called spark gap, and it depends on the process parameters. Sparkling is caused by the generator, which creates electrical impulses that is shown schematically in Figure 1c. The effectiveness of a single discharge can be determined by an empirical equation [17,18].
where: Qi—volume of removed material [mm3], Ei—single discharge energy, k—proportionality factor of the cathode and the anode.
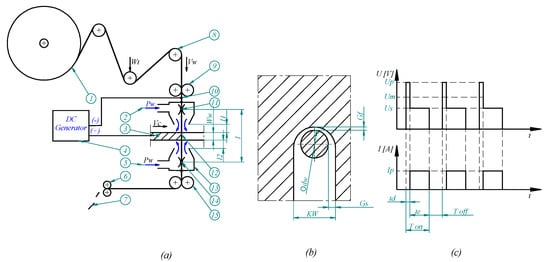
Figure 1.
Wire electrical discharge machining components: (a) scheme of the process, (b) view of the wire in the kerf, (c) graph of current impulse run, 1—wire reel, 2—upper inlet of flushing liquid (dielectric), work piece, 4—supply unit, 5—lower inlet of flushing dielectric, 6—wire chopper, 7—cut wire scrap, 8—rolls of wire tensioning unit, 9—upper wire drive, 10—current pick up, 11—upper wire guide 12—wire, 13—the nozzle of lower flushing, 14—lower wire guide, 15—bottom wire drive, Vw—wire feeding, Wt—wire tension, Vc—workpiece feed, Pw—flushing water pressure, Ww—workpiece width, l—distance before guides, l1—upper flushing die gap, l2—lower flushing die gap, dw—wire diameter, Gf—front spark gap, Gs—lateral spark gap, KW—cutting kerf, Up—pulse peak voltage, Um—average working voltage, Us—discharge voltage, Ip—pulse peak current, td—ignition delay time, te—pulse discharge time, T-on—pulse on time, T-off—pulse off time.
Energy of a single discharge can be calculated by the formula:
where: Ei—single discharge energy, t—discharge time, U(t)—voltage, I(t)—current intensity.
As voltage and current are varied with time, they could be replaced with effective values, defined as below:
where: t—impulse time, Ueff—effective voltage Ieff—effective current, U(t)—voltage, I(t)—current intensity.
Single impulse energy is by:
where: Eefi—energy of single impulse, Ton—impulse time, Ueff—effective voltage, Ieff—effective current.
Power generated during machining in the working zone, that enables the removal of all material content, can be found by the following equation:
where: Peff—power of discharges [W], Eefi—energy of single impulse [J], Ton—impulse time [µs], f—frequency [s−1], Toff—break between pulses [µs], Ueff—effective voltage [V] Ieff—effective current [A]. Total amount removing material can be, in turn, expressed as:
where: QT—total amount removing material [mm3/s], k—factor of proportionality cathode and anode, r—the coefficient of efficiency of electrical discharge.
Demand for power may be determined, using:
where: PT—demand for power, Peff—power of discharges, µ—the discharge generator efficiency.
In this research, the empirical equation has been utilized to determine the MRR levels (see Section 3.1), since the values for the related factors presented in the above given formulas are difficult to be determined [19].
Based on the Equations (6) and (7), the parameters T-on and T-off were, as seen further, selected for the tests, as they have direct impact on the machining performance. The WEDM process tests were performed on an AccuteX AU-300iA (Taichung, Taiwan) machine, and the process parameters were set in accordance with the designed experiment, and described further on.
After starting, the value of the linear feed it was gradually increased until the value at which the process was no longer stable. The maximum linear cutting feed value gained at which the EDM process maintained its stability was recorded, with several repetitions to confirm this required state.
In this experimental study three controllable parameters of the WEDM process, viz., pulse-on time (T-on), pulse-off time (T-off) and dielectric flow pressure (DFP) were considered as input variable parameters (independent variables). The encoding levels and actual values of those process parameters are listed in Table 1.

Table 1.
Variable machining parameters and their levels for the wire electrical discharge machining (WEDM) research of Inconel 617.
Other process factors that might affect the performance measures are summarized in Table 2. Consistently, they were held constant throughout the experiments as far as practicable.
Table 2.
Constant machining conditions in this research study.
The variations ranges of input parameters were established on the basis of experience and some exploratory tests, considering the capacity of the applied WEDM machine and successful cutting with the avoidance of wire tear and interruption of the process.
An 8 mm thick rolled plate made from Inconel 617 (material certified by BIBUS Metals AG, Switzerland) was used in the tests. Chemical composition and mechanical properties of this material are presented in Table 3.
Table 3.
Chemical composition of Inconel 617 alloy and its mechanical properties.
WEDM tests were made as the cuts in the plate, 15 mm long. A metallographic microscope type OLYMPUS BX51 with software OLYMPUS Stream Motion was applied to measuring the width of the kerf on the plate. The obtained results were averaged based on 6 measurements, and are presented in Table 4.
Table 4.
The matrix of experimentation based on the Box–Behnken design, with the settings of the input parameters and determined values of process performance measures.
After the samples were cut off, roughness measurements were made using the Hommel Tester T100 device. Measurements were taken along and across the cutting direction. Roughness measurements were made under the following conditions: Filter ISO11562 (M1), Pick-up TKU300, Lc (cut-off) = 0.8 mm, Lt = 4 mm, Vt = 0.5mm/s, Lc/Ls = 100. Several parameters were measured, while Table 4 contains the obtained Ra parameter values.
The present investigation focused on studying the effects of the selected variable machining parameters on the three performance measures (responses) of the WEDM process of Inconel 617 material, such as: volumetric material removal rate (MRR), dimensional accuracy (reflected by the kerf width—KW) and surface roughness (Ra).
The response surface methodology (RSM) was employed in the designing of this research experiment (DoE), for the purpose of establishing the relationship between various input process parameters and exploring the effect of these process parameters on selected output responses [1,14]. As boundaries for the experimental work were determined in-prior in the frame of a preliminary tests, the RSM method was applied in here, along with the Box–Behnken design. At the same time, the design scheme is still considered to be more proficient and most powerful than other designs, such as: the three-level full factorial design or central composite design (CCD) [20]. This concerns, in particular, the possibility for the avoidance of combined factors extremes that might deteriorate the quality of data derived from a specific experiment [14,21]. Moreover, the principal advantage of this scheme applied to the specific research case was a significant reduction in the size of experimentation (the reduced number of required process runs) to successfully examine the effect of determined input variables upon the assumed performance responses, and validate the experimental results without loss of accuracy [11,14,21].
Consequently, the DoE matrix, based on the selected design scheme, with the run order of experiments (performed on a random basis) and corresponding results of three response variables, including MRR, KW and SR (by Ra), is shown in Table 4. As it can be noted, the entire experimentation (research task) involved totally 15 runs (trials), considering three various input factors defined at three levels, instead of 33 = 27 trials (in each cycle of a multiple test), as required when choosing the design of a full-scale experiment.
3. Results and Discussion
Statistical and mathematical techniques available under the RSM approach have been used to determine the correlations between the measured output responses and accepted independent process parameters. Furthermore, the ANOVA tests were performed in order to evaluate the adequacy and the significance of the developed regression model, as well as the significance of individual model coefficients (selected process parameters). Full quadratic model formulations were each time selected for fitting the models generated for the individual responses in terms of the 3 independent process parameters, given in their coded form. All those design and analysis activities were performed in the environment of Minitab statistical software package at the 95% confidence level [5,14]. The quality of fitting the obtained models to the measured values of the respective responses was described by determination coefficient of R-Squared and the standard deviation of the residual component—S [22].
3.1. Evaluation of Material Removal Rate
In the first instance, the experimental results for MRR were analyzed which in EDM expresses the productivity of realized machining process. Volumetric MRR was calculated by an Equation (9) as the product of achieved linear cutting rate in (mm/min) (obtained in the experiment for determined machine settings), the actual width of the kerf KW formed in the process in (mm), and the work piece thickness Ww (mm).
The adequately calculated values of MRR are presented in Table 4.
Regression coefficients of the developed quadratic response surface model for MRR are in particular presented in Table 5, together with corresponding model summary statistics derived from ANOVA test. The coefficient of determination is relatively high and close to 100%, namely R-squared equals to 97.61%, that is desirable. The standard deviation of the residual component S is of small value, and amounts to 1.35023. According to data presented in the table, the effect of process parameters T-on, DFP, T-on × T-off, T-on × DFP, and T-on2 on MRR is significant, since in all cases, the p-value is less than 0.05, and therein, the pulse-on time seems to have the greatest effect on the measured response.
Table 5.
Estimated regression coefficients and summary statistics of adopted response surface full quadratic model for MRR.
The results of ANOVA for the derived model with a breakdown into the individual terms, viz., linear, quadratic and the interaction are further presented in Table 6. It can be seen from the Table that the regression model for MRR proved to be significant at 95% confidence level, as it has a p-value of 0.001. It should also be noted in the same table that calculated value of the ratio of F = 24.85 is much more than its tabulated value F(0.05;9;14) = 2.65. This implies the adequacy of the MRR related model at the assumed level of confidence. The calculated F-value for “Lack of Fit” of 4,21 implies that it is insignificant relative to the pure error (p-value = 0.198, so there is only 19.8% chance that a “Lack of Fit” F-value this large could occur due to noise during the WEDM process under study.
Table 6.
ANOVA test results of the developed response surface model for MRR.
Moreover, the residuals were examined using the normal probability diagnostic plot of residuals. As seen in the adequate plot in Figure 2, the residuals follow a straight line and it follows a normal distribution. This, in turn, implies that the assumptions for ANOVA are met and the regression analysis performed is valid.
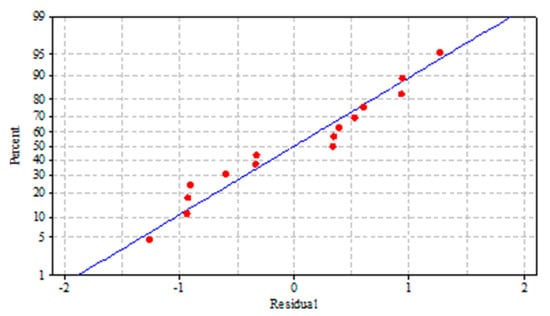
Figure 2.
Normal probability plot of the residuals for MRR.
Moreover, the residuals were examined using a normal probability diagnostic plot of residuals. As seen in the adequate plot in Figure 2, the residuals follow a straight line and it follows a normal distribution. This in turn implies that the assumption for ANOVA are met and the regression analysis performed is valid.
Figure 3 shows the response surface plots related to MRR. Figure 3a, in particular, depicts the variation of MRR with pulse-on time and pulse-off time. It is seen from the graph that the productivity of the EDM process considerably increases with a combination of higher values of both input parameters. It does not apply to lower settings for T-on values, however, when increasing, T-off presents an adverse effect on MRR. Similarly, the increase in the MRR can be observed with a combination of higher T-on and higher flushing pressure DFP, as shown in Figure 3b. Figure 3c shows, in turn, that generally higher MRR can be obtained for a combination of higher DFP settings and lower T-off settings. As it can be also noted, increasing the value of T-off in process settings generally leads to a decrease in the productivity of the WEDM process of the Inconel 617 alloy.
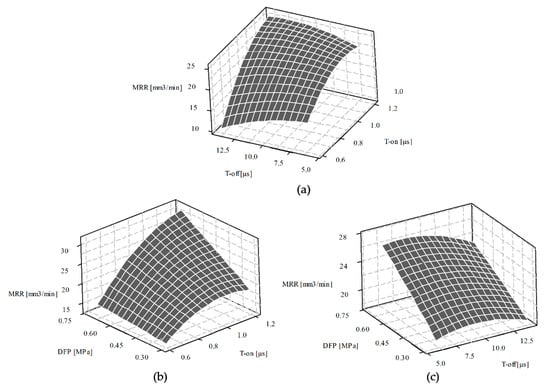
Figure 3.
Response surface 3D plots representing the MRR dependence on: (a) T-on and T-off, for DFP = 0.5 MPa; (b) T-on and DFP, for T-off = 10 µs; (c) T-off and DFP, for T-on = 0.9 µs.
3.2. Evaluation of the Dimensional Accuracy of the Machining Process
The width of the kerf KW formed in the EDM-machined work material by a passing wire can be a measure of the dimensional accuracy of the process [11,23]. Figure 4 shows exemplary samples of kerfs made in Inconel 617 material. The averaged values of measurements for kerfs obtained in different machining conditions (correspondingly to individual runs of the experiment) are included in the matrix of Table 4.
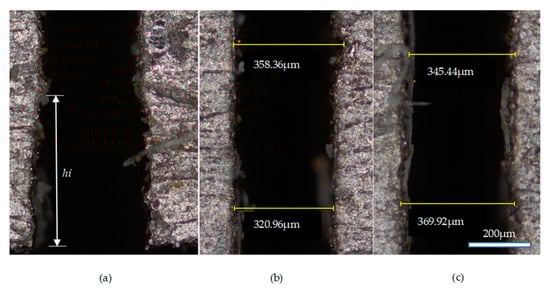
Figure 4.
The photographs used in the measurements of kerf width KW: (a)—kerf with initial zone, (b)—kerf for run 1, (c)—kerf for run 5, hi—depth of initial zone.
The width of the kerf can be defined by the equation:
where: KW—kerf width (mm), dw—diameter of wire (mm), Gs—lateral spark gap (mm).
As the value of wire diameter (dw) is constant, the change of the kerf width (KW) results in changes of width lateral spark gaps (Gs). The distance of lateral sparks gap is dependent on the energy of the discharges and affects the process accuracy. Figure 4 shows the photos of the kerfs made during the tests. It can be seen that the edges of the kerfs are fuzzed and measurement of the kerf width might be inaccurate. In the initial section of kerfs (Figure 4a), the machining process is rather unstable. Thus, the section was excluded from the measurements. Figure 4b shows the kerf of the run 1 with measurement lines, while Figure 4c shows the kerf for the run 5, which corresponds to the process conditions of the highest efficiency.
The adequate regression model was determined to quantify the effect of selected input parameters on this measured response of the WEDM process studied. Calculated values of regression coefficients for the individual terms of the determined response surface model for KW are listed in Table 7. According to the data contained in this Table (see the respective p-values), in addition to the parameter T-on of the linear terms, only the T-off 2 of the quadratic terms and T-on∗T-off of the interaction terms have a significant effect on KW. As also seen in the table, the values of the coefficient R-squared and the standard deviation of the residual component—S, obtained in respective ANOVA test, are at the proper level.
Table 7.
Estimated coefficients of the regression model and summary statistics of adopted response surface full quadratic model for KW.
The results of respective ANOVA test presented in Table 8 show the significance of the regression model for KW (obtained p-value < 0.05), as well as its adequacy, since the respective requirement of the F-test is met (calculated F-ratio equal to 24.85, significantly exceeds its tabulated value), all at 95% confidence level. It is also to be noted that p-value for “Lack of Fit” of 0.615 implies the non-significance of the source element, as desirable. Normal probability plot of the residuals for the KW process response is presented in Figure 5. The regularities in distribution of the residuals observed in the graph confirm that the performed analysis could be validated.
Table 8.
ANOVA test results of response surface model for KW.
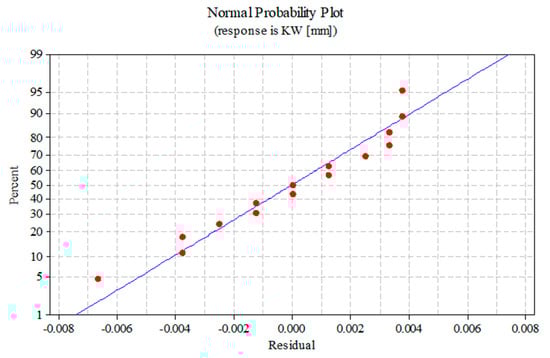
Figure 5.
Normal probability plot of the residuals for KW.
Figure 6 shows the response surface 3D plots representing the KW dependence on the interacting input parameters. As generally seen, the interactions between the particular machining parameter are far more complicated than a simple rule of thumb, and their combined effect on the process response is ambiguous to much extent. Figure 6a, in particular, depicts the variation of KW with pulse-on time and pulse-off time. As can be seen in the figure, higher accuracy (i.e., smaller KW values) can basically be obtained for the combination of lower values of T-on and T-off, conversely to their effect on process productivity (the MRR response), discussed in the previous section. Figure 6b shows that the process accuracy will be higher (i.e., smaller value of KW) with a combination of smaller T-on and DFP, while a small share of the DFP parameter in the increase in the value of the measured response (KW) can be observed. The graph in Figure 6c in turn reveals that the machining accuracy increases (lower KW) for the extreme settings of the value of the T-off parameter (the lowest or the highest), as compared with its mid-settings, however, the range of observed changes in the value of this parameter is quite narrow. At the same time, a limited influence of the DFP parameter on values of the measured response can be noted.
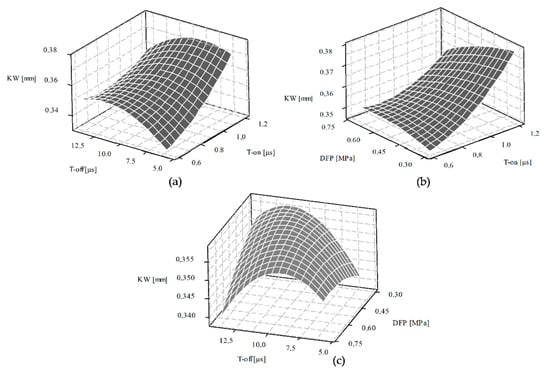
Figure 6.
Response surface 3D plots representing the KW dependence on: (a) T-on and T-off, for DFP = 0.5 MPa; (b) T-on and DFP, for T-off = 10 µs; (c) T-off and DFP, for T-on = 0.9 µs.
3.3. Evaluation of Surface Roughness
Many of the mechanical and physical properties of mechanical parts, such as corrosion resistance, friction, fatigue strength and loading capacity, depend on the roughness of the machined surfaces [11]. Thus, the surface roughness (SR) obtained in the WEDM process, and expressed by the average roughness height (Ra) parameter, was another machining response characteristic for which a regression model was determined. The respective values of coefficients (R-squared and S) for the developed full quadratic model, that determine the quality of its fitting, are included in Table 9, along with the appropriate coefficients related to the individual model terms. As can be concluded based on the results included in this table, solely the linear parameter of T-on is significant in controlling SR (Ra). The obtained results of ANOVA test for the probability aspect P and those related to the F-test (see Table 10) indicate the significance and the adequacy of the derived response surface model for Ra, at the 95% confidence level. In addition, a relevant normal probability plot of the residuals for this output characteristic (Figure 7) has been provided that validates this part of performed analysis.
Table 9.
Estimated regression coefficients and summary statistics of adopted response surface full quadratic model for Ra.
Table 10.
ANOVA test results of response surface model for Ra.
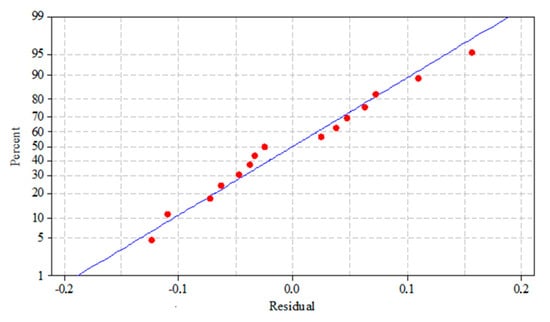
Figure 7.
Normal probability plot of the residuals for surface roughness parameter of Ra.
Figure 8 contains the response surface 3D plots representing the SR dependence on the interacting input parameters. Thus, Figure 8a shows the variation of Ra parameter with the change of T-on and T-off. As seen from the graph, SR considerably decreases with the decrease in pulse duration (T-on), and in fact, regardless of changes in the T-off setting. A similar effect could be observed while analyzing the variability of the Ra with the change of T-on and DFP parameters (Figure 8b). A similar effect could be observed while analyzing the variability of SR with the change of T-on and DFP parameters (Figure 8b).
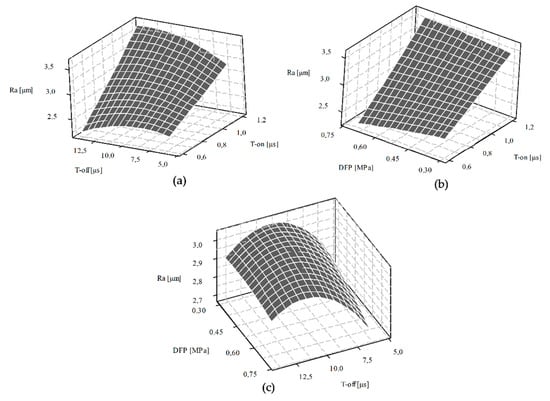
Figure 8.
Response surface plots of Ra versus: (a) T-on and T-off, for DFP = 0.5 MPa; (b) T-on and DFP, for T-off = 10 µs; (c) T-off and DFP, for T-on = 0.9 µs.
In this instance, Ra also drops down significantly with the decrease in T-on, whereas the influence of the latter parameter is irrelevant. As can be observed in turn in Figure 8c, the dependence of the output parameter Ra on T-off and DFP is vaguer. However, for that pair of interacting parameters, the lowest values of Ra will be obtained at the lowest possible settings of the values for T-off.
The Ra parameter is an average value, and it is not sufficient to characterize the geometrical properties of the surface therefore the paper is supplemented by selected surface profilograms, material ratio curves and probability density functions, in order to show the operating features of obtained surfaces.
Figure 9 presents a profilogram of the surface after processing, in terms of the roughness and waviness. This presented structure applies to run 8 according to the Table 4. The roughness was filtered from the primary profile using a 0.8 mm cut off filter. Comparing the profiles shown at (a) and (b) in Figure 9, it can be seen that the roughness is the dominant element of the obtained surface structure, and from a practical point of view, the waviness in this structure is insignificant. Figure 10 shows the material ratio curves and the frequency density curve for the profiles presented in this Figure. Based on the above given curves, it can be concluded that the roughness profile unevenness structure is approximately symmetrical, i.e., the range of the peaks and valleys is comparable. The shape of material ratio curve indicates that the main cause of roughness is the EDM machining process is the characteristic of discharges. During the measurements, it was observed that the structure of unevenness slightly changes with the change of the process parameters, i.e., with certain process parameters peaks begin to dominate in the structure, and for other parameters, valley is the dominant element in the surface structure. Due to the fact that the observed changes are of very little importance for the rough machining cuts realized in this research, they have not been included.
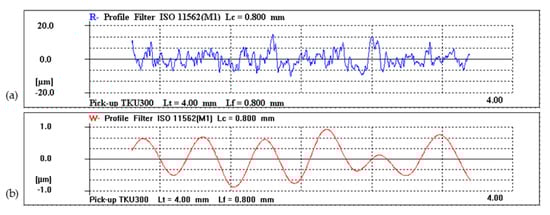
Figure 9.
The surface roughness profile (a) and the surface waviness profile (b), as measured in parallel direction to the wire feed.
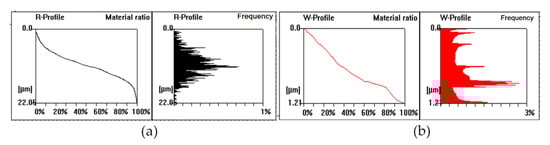
Figure 10.
The material ratio curves and frequency density curves for the profiles measured in parallel direction to the wire feed: (a)—for the roughness, (b)—for the waviness.
On the other hand, by observing the waviness, and in particular, the material fraction curve and the amplitude density curve, it can be seen that the resulting waviness is influenced by several factors. These can be related to the process and the machine design features. As waviness is not the dominant factor in the surface structure, it can be neglected in the roughing cut process.
Figure 11 and Figure 12 show the surface structure in the direction perpendicular to the wire feed direction. Comparing these graphs with those in Figure 9 and Figure 10, it can be seen that there are no significant differences in the roughness structure, while there are some differences in the waviness. They may result from wire vibrations during machining, whereas their influence on the surface structure effects is insignificant for rough machining.
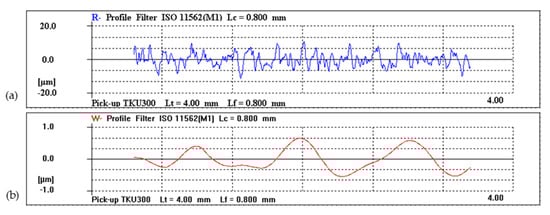
Figure 11.
The surface roughness profile (a) and the surface waviness profile (b), as measured in perpendicular direction to the wire feed.
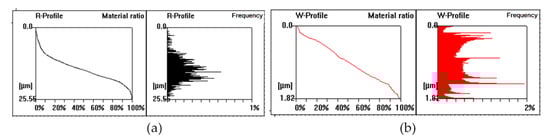
Figure 12.
The material ratio curves and frequency density curves for the profiles measured in parallel direction to the wire feed: (a)—for the roughness, (b)—for the waviness.
4. Conclusions
The effect of various control parameters such as pulse-on, pulse off time, and the dielectric flow pressure on WEDM performance measures, i.e., MRR, the cutting accuracy and SR of the Inconel 617 alloy material have been experimentally investigated. The response surface modelling scheme based on the RSM approach has shown its advantages in explaining the impact of each working parameter on the values of the resultant response characteristics.
The most important results of the experimental work can be summarized as follows:
- WEDM process has generally proved its adequacy to machine Inconel 617 components in view of: the MRR values obtained in the range of 10.61–30.34 mm3/min (65% variation in relation to the registered maximum value of MRR), the KW values—reflecting the dimensional cutting accuracy, and amounted between 0.33 and 0.38 mm (13% variation in relation to the respective maximum value) and the SR values (Ra) attained within the range of 2.22–3.58µm (38% of the recorded maximum);
- the maximum value of the MRR parameter was obtained for the following settings of the input parameters: T-on = 1.2 µs, T-off = 10 µs and DFP 0.7 MPa, maximum accuracy (KW = 0.33 mm) for T-on = 0.6 µs, T-off = 6 µs and DFP 0.5 MPa, and the smoothest surface (Ra = 2.22 µm) at T-on = 0.6 µs, T-off = 10 µs and DFP 0.7 MPa;
- T-on was found to have the greatest influence on MRR; hence, for the most efficient machining, it is necessary to ensure that the debris are removed by using effectively flushing them out (among others by increasing properly the level of DFP);
- the surface roughness structure obtained in the EDM process does not show any significant changes in the arrangement of peaks and valleys in relation to the possible settings in the variable process parameters; at the same time, a significant change concerning the waviness structure could be observed, especially for its comparisons in the longitudinal and transverse directions to the cutting direction; in the surface structure obtained in the experiment, however, waviness is not a dominant parameter and has no significant impact on its operational features.
Further research work will be focused on the investigation into the surface layer characteristics being constituted in wire EDM processes, realized under differentiated machining conditions.
Author Contributions
Conceptualization, S.D. and M.S.S.; methodology, S.D. and M.S.S.; software, S.D. and M.S.S.; validation, S.D. and M.S.S.; formal analysis, S.D. and M.S.S.; investigation, S.D. and M.S.S.; resources, S.D. and M.S.S.; data curation, S.D. and M.S.S.; writing—original draft preparation, S.D. and M.S.S.; writing—review and editing, S.D. and M.S.S.; visualization, S.D. and M.S.S.; All authors have read and agreed to the published version of the manuscript.
Funding
This research received no external funding.
Conflicts of Interest
The authors declare no conflict of interest.
References
- Hewidy, M.; El-Taweel, T.A.; El-Safty, M. Modelling the machining parameters of wire electrical discharge machining of Inconel 601 using RSM. J. Mater. Process. Technol. 2005, 169, 328–336. [Google Scholar] [CrossRef]
- Li, L.; Guo, Y.; Wei, X.; Li, W. Surface Integrity Characteristics in Wire-EDM of Inconel 718 at Different Discharge Energy. Procedia CIRP 2013, 6, 220–225. [Google Scholar] [CrossRef]
- Deja, M.; Dobrzyński, M.; Flaszyński, P.; Haras, J.; Zielínski, D. Application of Rapid Prototyping Technology in the Manufacturing of Turbine Blade With Small Diameter Holes. Pol. Marit. Res. 2018, 25, 119–123. [Google Scholar] [CrossRef]
- Sharma, P.; Chakradhar, D.; Narendranath, S. Evaluation of WEDM performance characteristics of Inconel 706 for turbine disk application. Mater. Des. 2015, 88, 558–566. [Google Scholar] [CrossRef]
- Subrahmanyam, M.; Nancharaiah, T. Optimization of process parameters in wire-cut EDM of Inconel 625 using Taguchi’s approach. Mater. Today Proc. 2020, 23, 642–646. [Google Scholar] [CrossRef]
- Li, L.; Li, Z.Y.; Wei, X.T.; Cheng, X. Machining Characteristics of Inconel 718 by Sinking-EDM and Wire-EDM. Mater. Manuf. Process. 2014, 30, 968–973. [Google Scholar] [CrossRef]
- Shabgard, M.; Farzaneh, S.; Gholipoor, A. Investigation of the surface integrity characteristics in wire electrical discharge machining of Inconel 617. J. Braz. Soc. Mech. Sci. Eng. 2016, 39, 857–864. [Google Scholar] [CrossRef]
- Guo, Y.B.; Li, W.; Jawahir, I.S. Surface integrity characterization and prediction in machining of hardened and difficult-to-machine alloys: A state-of-art research review and analysis. Mach. Sci. Technol. 2009, 13, 437–470. [Google Scholar] [CrossRef]
- Newton, T.R.; Melkote, S.N.; Watkins, T.; Trejo, R.M.; Reister, L. Investigation of the effect of process parameters on the formation and characteristics of recast layer in wire-EDM of Inconel 718. Mater. Sci. Eng. A 2009, 513, 208–215. [Google Scholar] [CrossRef]
- Gołąbczak, M.; Maksim, P.; Jacquet, P.; Gołąbczak, A.; Woźniak, K.; Nouveau, C. Investigations of geometrical structure and morphology of samples made of hard machinable materials after wire electrical discharge machining and vibro-abrasive finishing. Mater. Werkst. 2019, 50, 611–615. [Google Scholar] [CrossRef]
- Mostafapour, A.; Vahedi, H. Wire electrical discharge machining of AZ91 magnesium alloy; investigation of effect of process input parameters on performance characteristics. Eng. Res. Express 2019, 1, 015005. [Google Scholar] [CrossRef]
- Klocke, F.; Schwade, M.; Klink, A.; Kopp, A. EDM Machining Capabilities of Magnesium (Mg) Alloy WE43 for Medical Applications. Procedia Eng. 2011, 19, 190–195. [Google Scholar] [CrossRef]
- Markopoulos, A.P.; Papazoglou, E.-L.; Karmiris-Obratański, P. Experimental Study on the Influence of Machining Conditions on the Quality of Electrical Discharge Machined Surfaces of aluminum alloy Al5052. Machines 2020, 8, 12. [Google Scholar] [CrossRef]
- Markopoulos, A.P.; Habrat, W.; Galanis, N.I.; Karkalos, N.E. Modelling and optimization of machining with the use of statistical methods and soft computing. In Design of Experiments in Production Engineering (Management and Industrial Engineering); Davim, J.P., Ed.; Springer Intl. Publishing AG: Cham, Switzerland, 2016; pp. 39–76. [Google Scholar] [CrossRef]
- Khan, A.R.; Rahman, M.; Kadirgama, K.; Maleque, M.A.; Ishak, M. Prediction of Surface Roughness of Ti-6Al-4V in Electrical Discharge Machining: A Regression Model. J. Mech. Eng. Sci. 2011, 1, 16–24. [Google Scholar] [CrossRef]
- Rao, T.B.; Krishna, A.G. Simultaneous optimization of multiple performance characteristics in WEDM for machining ZC63/SiCp MMC. Adv. Manuf. 2013, 1, 265–275. [Google Scholar] [CrossRef]
- Straka, L.; Dittrich, G. Intelligent Control System of Generated Electrical Pulses at Discharge Machining. In Emerging Trends in Mechatronics; Azizi, A., Ed.; IntechOpen: London, UK, 2020; pp. 1–26. [Google Scholar]
- Sharma, P.; Chakradhar, D.; Narendranath, S. Effect of Wire Material on Productivity and Surface Integrity of WEDM-Processed Inconel 706 for Aircraft Application. J. Mater. Eng. Perform. 2016, 25, 3672–3681. [Google Scholar] [CrossRef]
- Asgar, E.; Singholi, A.K.S. Parameter study and optimization of WEDM process: A Review. IOP Conf. Ser. Mater. Sci. Eng. 2018, 404, 012007. [Google Scholar] [CrossRef]
- NIST/SEMATECH E-Handbook of Statistical Methods. Available online: http://www.itl.nist.gov/div898/handbook/ (accessed on 1 September 2020). [CrossRef]
- Nguyen, T.-T.; Duong, Q.-D. Optimization of WEDM process of mould material using Kriging model to improve technological performances. Sadhana 2019, 44, 1–16. [Google Scholar] [CrossRef]
- Mouralova, K.; Benes, L.; Bednar, J.; Zahradnicek, R.; Prokes, T.; Fiala, Z.; Fries, J. Precision Machining of Nimonic C 263 Super AlloyUsing WEDM. Coatings 2020, 10, 590. [Google Scholar] [CrossRef]
- Saleh, M.; Anwar, S.; El-Tamimi, A.; Mohammed, M.K.; Ahmad, S. Milling Microchannels in Monel 400 Alloy by Wire EDM: An Experimental Analysis. Micromachines 2020, 11, 469. [Google Scholar] [CrossRef] [PubMed]
© 2020 by the authors. Licensee MDPI, Basel, Switzerland. This article is an open access article distributed under the terms and conditions of the Creative Commons Attribution (CC BY) license (http://creativecommons.org/licenses/by/4.0/).