Abstract
The ball-burnishing process is a particular finishing treatment that can improve selected properties of different materials. In the present study, the ball-burnishing technique was used to investigate the effect of input parameters of processes on selected surface layer features like surface roughness and residual stresses of the 42CrMo4 steel surfaces. The burnishing process was conducted on Haas CNC Vertical Mill Center VF-3 using a tool with tungsten carbide tip. A further objective of our research was to improve tribological properties of the aforementioned steel by the ball-burnishing process. The results of the investigations showed that it was possible to reduce the root mean square height of the surface Sq from 0.522 μm to 0.051 μm and to increase wear resistance compared to ground samples.
1. Introduction
At present, the manufacturing industry is focusing much attention on dimensional accuracy and surface finish. Surface quality depends largely on the applied finishing treatments, and on the values of input parameters used in them [1]. One of the major possible predictors of machining performance is through the deep analysis of surface textures [2]. There are many finishing treatments used in the mechanical industry, such as polishing, grinding, lapping, or honing. However, one of the most competent surface finishing processes is the burnishing process [3], which includes roller burnishing [4], ball burnishing [5] diamond burnishing, [6] and even similar techniques like pneumatic ball peening or shot peening [7]. The ball-burnishing process, as well as shot peening and laser-assisted burnishing technique [8], can be applied to materials of high hardness. The fundamental role of the ball-burnishing process is to create surface layers of high quality [9]. In this example, high quality is understood as being highlighted by the low values of amplitude parameters of surface topography.
It is possible to categorize burnishing mechanisms into three major groups [10]:
- Surface smoothing (geometrical) mechanism,
- Surface enhancement (mechanical) mechanism,
- The microstructural (metallurgical [11]) mechanism.
During the burnishing of a hard and smooth burnishing element, usually a spherical tip is pressed against the machined surface with the required force, thus causing a sliding friction in the burnishing zone. As a result of this process, surface smoothing occurs. Furthermore, this process improves several other mechanical properties [12]. The choice of a material for burnishing elements is a very important issue. Diamond can be such a material, but for economic and technical reasons, diamond tools are often replaced by ceramic tools. The burnishing process creates materials with better surface quality [13,14,15] and a higher value of surface hardness [16] and creates compressive residual stresses in a surface layer of elements [17]. After the burnishing process, one can also obtain a surface layer without abrasive contaminants. These features have a positive effect on a number of functional properties, including tribological wear, fatigue strength, and corrosion resistance. Moreover, it is possible to obtain most of the aforementioned improvements without special and sophisticated tools and in a relatively short time [18]. Analysis of the ball-burnishing process in terms of the surface roughness reduction has been conducted by, among others, Shiou and Cheng [19]. They reported that after the burnishing process, the improvement of NAK 80 steel reached almost 90%. Furthermore, it was possible to obtain a value of the arithmetical mean height Ra parameter lower than 0.1 µm. Similar results were obtained by the authors of [20], taking into consideration materials like aluminum A92017 and steel G10380. The main purpose of the research by Tekkaya et al. [21] was the improvement of the friction behavior of thermally sprayed coatings. The possibility of such improvement was tested using ball-burnishing and grinding processes. It was found that by applying the ball-burnishing process, the friction coefficient was reduced significantly in comparison to only coated elements. Investigations of tribological properties of different materials using the ball-burnishing technique have been conducted in References [22,23,24]. El-Tayeb et al. [22] applied ball burnishing to the aluminum 6061 material. As a result of that process, the authors pointed out a significant reduction of the friction coefficient. The value of the friction coefficient was lower by up to 48% in comparison to non-burnished surfaces. Wear resistance of Rb40 steel was the subject of research carried out by the authors of [24]. They reported that the surface layers after the burnishing process were similar to ground surfaces, but they were characterized by high level of wear resistance. Revankar et al. [25] also indicated the positive effect of the ball-burnishing process on wear resistance of titanium alloys. Nevertheless, they pointed out to the importance of process parameter selection.
In this work, the effect of the ball-burnishing process on surface topography of the 42CrMo4 steel samples was investigated. Haas CNC Vertical Mill Center was used as a work stand. Usually, the pre-treatment of the ball-burnishing process is through turning or milling, but in this work, a grinding process was used. However, the grinding parameters were applied in such a way that the values of statistical surface topography parameters (like Sq or Sa) were similar to those found after the milling process. In addition, the investigation of the influence of surface topography after the burnishing process on tribological properties was also studied.
2. Materials and Methods
Ball-burnishing tests were conducted at room temperature using Haas CNC Vertical Mill Center VF-3 (Figure 1). The material used in this study was 42CrMo4 chromium–molybdenum alloy constructional steel of hardness 46 ± 2 HRC. The samples to be burnished had a diameter of 25.4 mm and a height of 8.9 mm so that they could be used for tribological tests. Before burnishing, samples were ground in order to obtain parameters as presented in Figure 2. The grinding process was performed using a flat-surface grinder FS 420 SD and the grinding parameters were as follows: Peripheral velocity of the wheel −40 m/s, table feed speed −0.25 m/s, stroke −4 mm, grinding depth −0.015 mm, grinding wheel dimensions −225 × 25 × 51 mm. The material of the ball (φ 6 mm) used in the burnishing process was tungsten carbide (WC), with a grit size of 2.5 µm. Measurement of surface topography parameters was conducted after ball-burnishing tests. For that purpose, an Altisurf 520 optical profilometer with a CL1 confocal probe was used. The measurement area was 4 × 4 mm2. Measured textures were only levelled without digital filtration. Then, surface topography parameters were calculated using the TalyMap software. Investigations were conducted based on Hartley’s static, determined plan. Such a plan can be built on a hypercube or hypersphere. In this work, a hypercube was used. In the case of a three-level plan, Hartley’s plan makes it possible to determine the regression function in the form of a polynomial of the second degree. Its general form is presented in Formula (1):
where: b—coefficients of regression equation; x—input parameters.
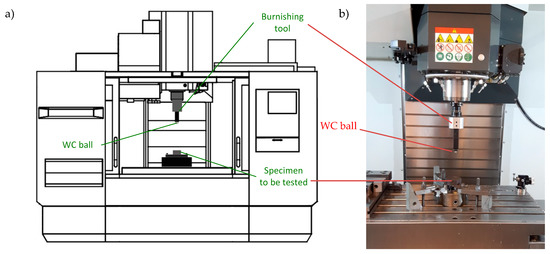
Figure 1.
Scheme of the Computer Numerical Control (CNC) test stand (a) and photo of working chamber (b).
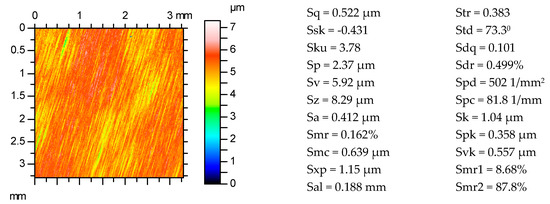
Figure 2.
Contour plot of ground surface and its surface topography parameters.
In the three-level plans, input factors assume values on three levels of variation. The “+” sign means the maximum value, the “−“ sign means the minimum value, and “0” the middle value. The central values of the three entry factors (burnishing pressure force, burnishing speed, stepover), the units of variation as well as encoded input factors are shown in Table 1. The following levels of entry factors were assumed (the number of tool passes was 1):

Table 1.
Central values, variation units, and coding entry factors for experiment.
- x1—burnishing pressure force: 10, 20, and 30 MPa,
- x2—burnishing speed: 400, 700, and 1000 mm/min,
- x3—stepover: 30, 50, and 70 µm:
Table 2 presents the matrix of the plan. The ball-burnishing process was conducted in random order according to the 11 machining variants presented in Table 2. The methodology of the research as well as the analysis were precisely described by the authors of [26,27]. The result parameters (mean value of the three measurements) were denoted by . The root mean square height of the surface Sq (), maximum height of the surface Sz (), as well as maximum value of stresses in the surface layer σmax () were taken as the result factors. Other surface topography parameters were also measured and compared to the values achieved after the grinding process (see Table 3).
Table 2.
Matrix of research plan.
Table 3.
Comparison of surface texture parameters of ground and ball-burnished surfaces.
Measurements of the residual stresses in surface layer of disc samples were carried out using a portable Xstress 3000 G3R X-ray diffractometer. The sin 2ψ method described in Reference [28] was used with an angle of incidence ψ ranging from −45° to +45° divided in 7 tilt positions. The X-ray penetration depth was set to 10 μm. The XTronic software was used to process the diffraction peaks and compute the residual stresses. The size of the collimator was 1.0 mm in diameter and exposure time was set to 40 s. For each disc surface, the residual stresses were determined in 2 points in orthogonal directions and the average value is presented in Table 2.
After the burnishing process, all samples were subjected to the wear tests. Wear tests were carried out using a pin/ball-on-disc tribological tester. In this study, ball-on-disc configuration was used. Ball-burnished steel discs were placed in contact with a WC ball of hardness about 70 HRC. The ball diameter used in tests was 6.35 mm. Dry sliding tests were carried out at room temperature (20–22 °C). Investigations were carried out at three different sliding speeds (0.16, 0.32, and 0.48 m/s). The sliding distance was 282.6 m (the time was set to 30 min) and the applied load was 9.81 N. The maximum Hertzian contact pressure was 1.78 GPa, and the diameter of the elastic contact equaled 0.103 mm. During the tribological research, the test chamber went through blow-by with compressed air to remove the wear products. All dry sliding tests were repeated at least 3 times. The friction force was measured continuously during the tribological tests. The wear of the disc samples was calculated after the dry sliding tests using a surface topography analysis. Worn surfaces were measured by means of white light interferometer Talysurf CCI Lite using objective 5×. The measuring area of 3.3 mm × 3.3 mm contained 1024 × 1024 points. After measurements, at least 7 profiles were taken in four positions (900 apart) perpendicular to the wear track in order to obtain the cross-sectional area of the wear tracks. Then, the values of the cross-sectional area of the wear track (in TalyMap software defined as the area of the hole) were averaged and the value of volumetric wear was calculated using Formula (2):
where:
VD = πdS,
- d—diameter of the wear track (in our tests d = 10 mm),
- S—area of the hole (the cross-sectional area of the wear track).
3. Results and Discussion
3.1. Effect of the Ball-Burnishing Parameters on the Surface Topography and Residual Stresses
The results of experiments for the parameters Sq, Sz, and σmax are presented in Table 2. Table 3 shows the ranges of all measured surface topography parameters obtained through the ball-burnishing process. A comparison to the parameters obtained after the grinding process was also presented in Table 3. Figure 3 presents isometric views of the selected samples after ball burnishing with the highest and the lowest value of the Sq parameter as well as the Abbott–Firestone curve and distribution of surface ordinates.
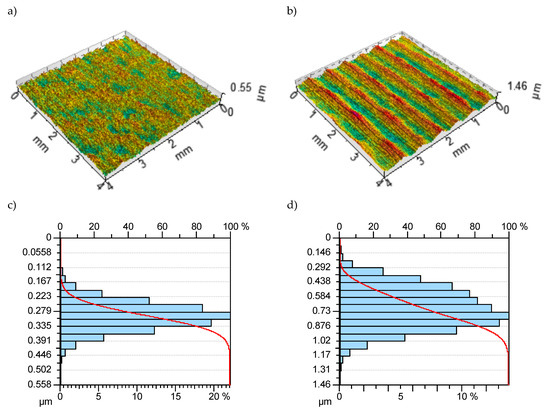
Figure 3.
Isometric views (a,b) and Abbott–Firestone curves with distribution of surface ordinates (c,d) for the samples with the lowest (a,c) and the highest (b,d) value of the Sq parameter.
As a result of the ball-burnishing process, the root mean square height of the surface Sq decreased in all variants. The values of the Sq parameter were between 0.051 µm (for P = 30 MPa, v = 700 mm/min, a = 50 µm) and 0.194 µm (for P = 20 MPa, v = 700 mm/min, a = 70 µm).
Other amplitude parameters like Sv, Sp, and Sz also clearly decreased in comparison to ground sample. For example, the reduction of maximum height Sz was from 8.29 µm after the grinding process to the values between 0.56 µm (variant 5) and 1.79 µm (variant 6). Skewness Ssk is the third and kurtosis Sku is the fourth moment of the height distribution histogram. The negative value of the Ssk parameter indicates the valley structures and a positive value of Ssk—the predominance of peaks. For a Gaussian surface of a symmetric shape, the skewness is zero. The Sku parameter is a measure of the peaks or sharpness of the surface height distribution [30]. When height distribution is normal, Sku equals 3. The ground surface was characterized by a more negative value of Ssk (−0.431) than all burnished samples (−0.345 ÷ 0.244). On the other hand, the value of the Sku parameter of the ground sample (3.78) was the largest compared to all burnished surfaces (1.99 ÷ 3.23).
The texture aspect ratio of ball-burnished disc samples Str was lower than 0.245. The Str parameter is a measure of surface texture and ranges between 0 and 1 (values close to 1 indicate a high level of isotropy). Values lower than 0.245 indicate the anisotropic character of the burnished surfaces. The value of the length of the fastest decay of the autocorrelation function in any direction Sal in most of all practical applications is set to 0.2. Large values of the Sal parameter denote surfaces dominated by low-frequency components, while small values of that parameter indicate the opposite. Most burnished samples were characterized by a lower value of Sal than ground surface and, thus, were dominated by higher-frequency components. The only exception was the sample in variant 1, where the Sal parameter reached the value of 0.217.
Both hybrid parameters (Sdq and Sdr) also decreased after the ball-burnishing process in all tested variants. The developed interfacial area ratio of the scale-limited surface Sdr represents the ratio of the increment of the interfacial area of the scale-limited surface over the flat sampling area. Values of the Sdr parameter lower than 1% are usually associated to superfinished surfaces. In all analyzed variants, that value was distinctly lower than 1% (between 0.00188% and 0.0273%). The Sdq parameter is defined as the root mean square of the surface slope within the sampling area. This parameter characterizes slopes on a surface and its higher values denote rougher surfaces. Values obtained after the ball-burnishing process were smaller than after grinding and, thus, indicate the smoothing nature of that treatment.
As a result of the ball-burnishing process, all functional (volume) parameters decreased in comparison to the ground surface. A similar tendency was observed in the case of the density of peaks Spd, arithmetic mean peak curvature Spc, ten point height S10z, as well as most parameters from the Sk family (such as Sk, Spk, and Svk).
The improvement of surface quality (mainly of amplitude parameters) can be explained in terms of the elimination of surface irregularities that occurred by the pressing of the ball, which slides on the flat surfaces with pressing burnishing force. Additionally, applying only one tool pass caused the ball to penetrate only a small distance into a work surface and, as a consequence, a limited deformation of asperities occurred. This resulted in smoothing the surface.
It was found that compressive stresses occurred in the surface layer of all the ball-burnished workpieces. The measured value of σmax for the ground surface was 96 MPa (tensile stress). After ball burnishing, σmax achieved values in the range of −283 ÷ −493 MPa (compressive stresses). The largest value of the compressive stresses was calculated for the sample from variant 2, where the burnishing pressure force equaled 30 MPa, the burnishing speed 400 mm/min, and stepover was set to 30 µm.
Three mathematical models to illustrate the effect of the starting parameters of the ball-burnishing process on the result parameters were achieved (Formulas (3)–(5)):
Mathematical models pointed out the existence of nonlinear relationships between ball burnishing and the resulting parameters. Analyzing the obtained mathematical models, one can see that surface topography parameters (Sq and Sz) depend on all entry parameters of ball burnishing, but in the case of the Sz parameter and mainly in the case of the Sq parameter, the influence of the burnishing pressure force was the largest.
The significant impact of the burnishing pressure force observed in mathematical models (Formulas (3) and (4)) was confirmed in the graphical analysis. Figure 4, Figure 5 and Figure 6 present the dependences between the ball-burnishing process parameters and surface topography parameters Sq and Sz. Fragments in green color represent areas with lower values of Sq and Sz. On the other hand, the red color indicates higher values of the mentioned parameters. One can see that the green areas are only visible in the case of the highest burnishing pressure force values. This is particularly evident in the case of the Sq parameter (Figure 4a and Figure 5a). A similar dependency does not occur if we take into account other input parameters of the ball-burnishing process. Figure 6 presents the influence of burnishing speed and stepover on the Sq and Sz parameters. One can see that it is difficult to find clear relationships between input (v, a) and result parameters (Sq, Sz).
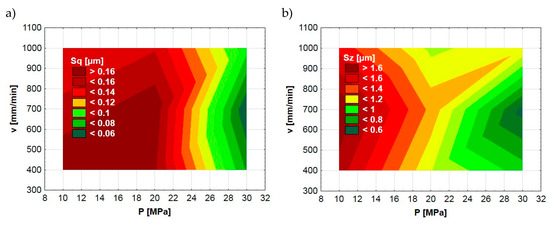
Figure 4.
Dependence between ball-burnishing parameters (P, v) and surface topography parameters Sq (a), Sz (b).
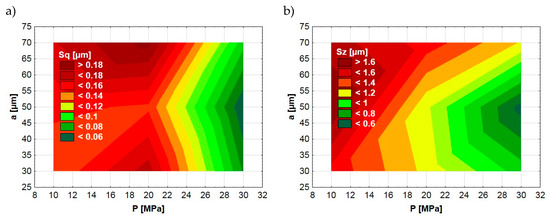
Figure 5.
Dependence between ball-burnishing parameters (P, a) and surface topography parameters Sq (a), Sz (b).
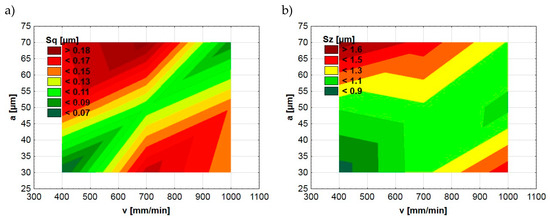
Figure 6.
Dependence between ball-burnishing parameters (v, a) and surface topography parameters Sq (a), Sz (b).
3.2. Effect of the Ball-Burnishing Parameters on the Tribological Properties
Table 4 presents the results of the tribological tests. For each disc sample, several indicators were calculated:
Table 4.
Results of the tribological tests. VD: Mean value of the volumetric wear of the disc samples. DSS: Sliding distance after which the friction force obtains steady-state conditions. Fav: Average value of the friction force after obtaining the steady-state condition.
- The mean value of the volumetric wear of the disc samples (VD),
- The sliding distance after which the friction force obtains steady-state conditions (DSS),
- The average value of the friction force after obtaining the steady-state condition (Fav).
Figure 7 presents the profiles of the wear tracks with the areas of hole marked in red on the selected disc surfaces (with the highest and the lowest value of VD parameter) at the smallest sliding speed vs = 0.16 m/s.
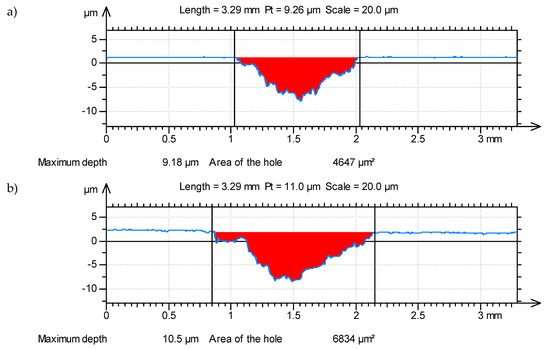
Figure 7.
Worn disc profiles (a) sample 2, (b) sample 3, obtained at vs = 0.16 m/s.
In the initial phases of the tribological tests, the friction force distinctly increased and reached a stable value, usually in the range of 4.5–5.5 N, independently of sliding speed. Differences between values of friction forces in the early phase of each test were smaller than 20%, but the distance to obtain steady-state conditions of the friction force DSS was different. At the sliding speed of 0.16 m/s, the value of DSS parameter was in the range 22–81 m. The highest value of DSS corresponded with the smallest value of wear volume (0.147 mm3). On the other hand, the largest wear volume (0.219 mm3) was observed when the DSS parameter was the smallest (22 m).
An increase of sliding speed caused a slight increase of volumetric wear and slight decrease of the distance to obtain steady-state conditions of the friction force DSS. A similar tendency was found at the highest sliding speed vs = 0.48 m/s. At the sliding speed of 0.32 m/s, the largest value of wear volume was calculated for sample 2 (0.162 mm3). For this sample, DSS parameter was the largest (70 m) and Fav was the smallest (4.78 N). The maximum wear volume was observed in the case of sample 3. The value of VD reached 0.231 mm3.
At the highest sliding speed vs =0.48 m/s, the smallest value of wear volume was also observed for sample 2. In this case, the value of the VD parameter reached 0.171 mm3 and, like at lower sliding speeds, corresponded to largest value of the DSS parameter (62 m). The average value of the friction force after obtaining the steady-state condition Fav was also the smallest but identical to the sample 11 (4.62 N). The highest value of wear volume was characterized by sample 3 and it was 0.245 mm3. In this case, the distance to obtain steady-state conditions of the friction force DSS reached the value of 19 m, but shorter distance was observed for sample 6 (15 m).
At a sliding speed of vs = 0.16 m/s, the average value of the coefficient of friction ranged between 0.478 (sample 2) and 0.565 (sample 3) during dry sliding tests; at vs = 0.32 m/s, it was between 0.478 (sample 2) and 0.546 (sample 3); and at a highest sliding speed, the value of the friction coefficient reached 0.501 (for sample 2) and 0.559 (for sample 6).
The improvement of wear resistance of ball-burnished surfaces in comparison to ground samples can be explained by the effect of plastic cold strain. This effect causes changes in the crystalline structure and has a vital influence on the properties of the machined materials.
In order to find potential relationships between surface topography parameters and tribological properties, the linear coefficient of correlation R was used. The estimated value is always in the range of −1 to 1. If the coefficient is zero (R = 0), there is no linear correlation between the two features. If the absolute value of a correlation coefficient becomes higher (close to 1), a stronger linear relationship between variables occurs. One can notice a strong linear correlation existence between volumetric wear VD and the skewness Ssk (Figure 8). In this case, the linear coefficient of correlation was in the range of −0.71 (at the sliding speed vs = 0.32 m/s) to −0.83 (vs = 0.48 m/s). Linear relationships were also observed in the case of wear volume and several surface topography parameters, like Sz, Sdq, Spc, Sk, and Svk. The correlation coefficient oscillated between 0.69 and 0.86.
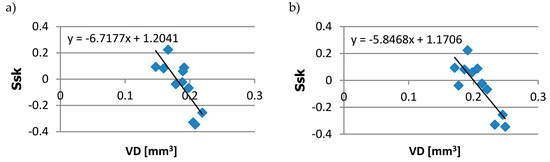
Figure 8.
Dependency between disc volumetric wear VD and skewness Ssk at the sliding speed of: (a) 0.16 m/s; (b) 0.48 m/s.
Strong linear correlations were also found between wear volume and maximum value of stresses in the surface layer σmax (Figure 9). It was an inversely proportional relationship and the correlation coefficient reached the values up to −0.9. A similar value was observed between wear volume and the sliding distance DSS.
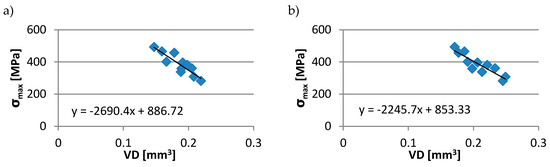
Figure 9.
Dependency between disc volumetric wear VD and maximum value of stresses in the surface layer σmax at the sliding speed of: (a) 0.16 m/s; (b) 0.48 m/s.
Analysis of the surface topography revealed the formation of anisotropic texture after tribological tests. The obtained values of the Str parameter were in the range of 7.23 to 12.86%. Such values are typical for anisotropic surfaces after abrasive wear. Microscopic observations also confirmed that the wear of the tested disc samples in dry sliding contact conditions was mainly dominated by plastic deformation and abrasive wear. In some cases, adhesive tracks were also visible on the disc surfaces.
4. Conclusions
The effect of the ball-burnishing process with various mechanical input parameters on surface topography and tribological properties of hardened steel was investigated. Based on the experimental results achieved, the following conclusions are derived:
It was found that the ball-burnishing process can be a very effective finishing treatment of the surface. Using this process, one can achieve a root mean square height Sq lower than 0.1 μm. In order to obtain such a value of Sq input parameter, like P = 30 MPa, v = 400 mm/min, a = 30 μm are recommended.
During the ball-burnishing process, the values of the height parameters (Sq, Sz, Sp, Sv) got reduced. A similar tendency was observed with hybrid, functional (volume), and most feature parameters. Other parameters, e.g., those important from a tribological point of view (Sk family), were also improved.
It was found that the burnishing pressure force was the most important input factor in the process. The smallest values of root mean square height Sq and maximum height Sz were achieved when the pressure force was the highest. The other input parameters had a minor impact.
The ball-burnishing process caused the presence of compressive stresses in the surface layer of the tested discs. The maximum value of residual stresses was observed when the burnishing pressure force achieved maximum value and other input parameters reached minimum. The maximum value of residual stresses σmax was correlated with wear volume.
Surface topography parameters like Sz, Sdq, Spc, and Sk can be used to predict the level of volumetric wear of burnished surfaces. This is also possible with the Ssk parameter, the increase of which, in most cases, resulted in reduced wear volume. However, skewness Ssk is a very sensitive surface parameter and in that case, it should be used with great care.
Author Contributions
Conceptualization: A.D and A.M.; methodology: A.D and A.M.; investigation: A.D.; writing—original draft preparation: A.D and A.M.; writing—review and editing: A.D and A.M.
Funding
This research received no external funding.
Conflicts of Interest
The authors declare no conflict of interest.
References
- John, M.R.S.; Wilson, A.W.; Bhardwaj, A.P.; Abraham, A.; Vinayagam, B.K. An investigation of ball burnishing process on CNC lathe using finite element analysis. Simul. Model. Pract. Theory 2016, 62, 88–101. [Google Scholar] [CrossRef]
- Sagbas, A. Analysis and optimization of surface roughness in the ball burnishing process using response surface methodology and desirabilty function. Adv. Eng. Softw. 2011, 42, 992–998. [Google Scholar] [CrossRef]
- Revankar, G.D.; Shetty, R.; Rao, S.S.; Gaitonde, V.N. Analysis of surface roughness and hardness in ball burnishing of titanium alloy. Measurement 2014, 58, 256–268. [Google Scholar] [CrossRef]
- Hassan, A.M. The effects of ball and roller burnishing on the surface roughness and hardness of some non-ferrous metals. J. Mater. Process Technol. 1997, 72, 385–391. [Google Scholar] [CrossRef]
- Kovács, Z.F.; Viharos, Z.J.; Kodácsy, J. Determination of the working gap and optimal machining parameters for magnetic assisted ball burnishing. Measurement 2018, 118, 172–180. [Google Scholar] [CrossRef]
- Okada, M.; Shinya, M.; Matsubara, H.; Kozuka, H.; Tachiya, H.; Asakawa, N.; Otsu, M. Development and characterization of diamond tip burnishing with a rotary tool. J. Mater. Process. Technol. 2017, 244, 106–115. [Google Scholar] [CrossRef]
- Korzynski, M.; Dzierwa, A.; Pacana, A.; Cwanek, J. Fatigue strength of chromium coated elements and possibility of its improvement with ball peening. Surf. Coat. Tech. 2009, 204, 615–620. [Google Scholar] [CrossRef]
- Tian, Y.; Shin, Y.C. Laser-assisted burnishing of metals. Int. J. Mach. Tools Manuf. 2007, 47, 14–22. [Google Scholar] [CrossRef]
- Loh, N.H.; Tam, S.C. Effects of ball burnishing parameters on surface finish—A literature survey and discussion. Prec. Eng. 1988, 10, 215–220. [Google Scholar] [CrossRef]
- Li, F.L.; Xia, W.; Zhou, Z.Y.; Zhao, J.; Tang, Z.Q. Analytical prediction and experimental verification of surface roughness during the burnishing process. Int. J. Mach. Tools Manuf. 2012, 62, 67–75. [Google Scholar] [CrossRef]
- Zaborski, A.; Tubielewicz, K.; Major, B. Contribution of burnishing to the microstructure and texture in surface layers of carbon steel. Arch. Metall. 2000, 45, 333–341. [Google Scholar]
- Konefal, K.; Korzynski, M.; Byczkowska, Z.; Korzynska, K. Improved corrosion resistance of stainless steel X6CrNiMoTi17-12-2 by slide diamond burnishing. J. Mater. Process. Technol. 2013, 213, 1997–2004. [Google Scholar] [CrossRef]
- Luca, L.; Neagu-Ventzel, S.; Marinescu, I. Effects of working parameters on surface finish in ball-burnishing of hardened steels. Precis. Eng. 2005, 29, 253–256. [Google Scholar] [CrossRef]
- Shiou, F.J.; Chen, C.H. Freeform surface finish of plastic injection mold by using ball-burnishing proces. J. Mater. Process. Technol. 2003, 140, 248–254. [Google Scholar] [CrossRef]
- El-Axir, M.H. An investigation into roller burnishing. Int. J. Mach. Tools Manuf. 2000, 40, 1603–1617. [Google Scholar] [CrossRef]
- Shiou, F.J.; Hsu, C.C. Surface finishing of hardened and tempered stainless tool steel using sequential ball grinding, ball burnishing and ball polishing processes on a machining centre. J. Mater. Process. Technol. 2008, 205, 249–258. [Google Scholar] [CrossRef]
- Teimouri, R.; Amini, S.; Bami, A.B. Evaluation of optimized surface properties and residual stress in ultrasonic assisted ball burnishing of AA6061-T6. Measurement 2018, 116, 129–139. [Google Scholar] [CrossRef]
- Rodríguez, A.; López de Lacalle, L.N.; Celaya, A.; Lamikiz, A.; Albizuri, J. Surface improvement of shafts by the deep ball-burnishing technique. Surf. Coat. Technol. 2012, 206, 2817–2824. [Google Scholar] [CrossRef]
- Shiou, F.J.; Cheng, C.H. Ultra-precision surface finish of NAK80 mould tool steel using sequential ball burnishing and ball polishing processes. J. Mater. Process. Technol. 2008, 201, 554–559. [Google Scholar] [CrossRef]
- Travieso-Rodríguez, J.A.; Dessein, G.; González-Rojas, H.A. Improving the surface finish of concave and convex surfaces using a ball burnishing process. Mater. Manuf. Process. 2011, 26, 1494–1502. [Google Scholar] [CrossRef]
- Tekkaya, A.E.; Kleiner, M.; Biermann, D.; Hiegemann, L.; Rausch, S.; Franzen, V.; Kwiatkowski, L.; Kersting, P. Friction analysis of thermally sprayed coatings finished by ball burnishing and grinding. Prod. Eng. 2013, 7, 601–610. [Google Scholar] [CrossRef]
- El-Tayeb, N.S.M.; Low, K.O.; Brevern, P.V. Enhancement of surface quality and tribological properties using ball burnishing process. Mach. Sci. Technol. 2008, 12, 234–248. [Google Scholar] [CrossRef]
- Hassan, A.M.; Al-Dhifi, S.Z.S. Improvement in the wear resistance of brass components by the ball burnishing process. J. Mater. Process. Technol. 1999, 96, 73–80. [Google Scholar] [CrossRef]
- Hamadache, H.; Laouar, L.; Zeghib, N.E.; Chaoui, K. Characteristics of Rb40 steel superficial layer under ball and roller burnishing. J. Mater. Process. Technol. 2006, 180, 130–136. [Google Scholar] [CrossRef]
- Revankar, G.D.; Shetty, R.; Rao, S.S.; Gaitonde, V.N. Wear resistance enhancement of titanium alloy (Ti–6Al–4V) by ball burnishing process. J. Mater. Res. Technol. 2017, 6, 13–32. [Google Scholar] [CrossRef]
- Montgomery, D.G. Design and Analysis of Experiments, 8th ed.; John Wiley & Sons: Hoboken, NJ, USA, 2005; ISBN 978-1-118-14692-7. [Google Scholar]
- Korzynski, M. Methodology of Experiment; Science Publishing Home: Warszawa, Poland, 2006; ISBN 83-204-3203-0. (In Polish) [Google Scholar]
- Fitzpatric, M.E.; Fry, A.T.; Holdway, P.; Kandil, F.A.; Shackleton, J.; Suominen, L.L. Determination of Residual Stresses by X-ray Diffraction—Issue 2. A National Measurement Good Practice Guide No. 52; National Physical Laboratory: Teddington, UK, 2005. [Google Scholar]
- ISO 25178-2:2012. Geometrical Product Specifications (GPS)—Surface Texture: Areal—Part 2: Terms, Definitions and Surface Texture Parameters; ISO: Geneva, Switzerland, 2012. [Google Scholar]
- Dzierwa, A. Influence of surface preparation on surface topography and tribological behaviours. Arch. Civ. Mech. Eng. 2017, 17, 502–510. [Google Scholar] [CrossRef]


© 2019 by the authors. Licensee MDPI, Basel, Switzerland. This article is an open access article distributed under the terms and conditions of the Creative Commons Attribution (CC BY) license (http://creativecommons.org/licenses/by/4.0/).