Article

Development of a Low-Cost Vibration Measurement System for Industrial Applications

Laboratory of Industrial Innovation Technology and Robotics, Universidad Privada Boliviana (UPB), Cap. Ustariz Avenue km 6.5, Casilla, Cochabamba 3967, Bolivia
*
Author to whom correspondence should be addressed.
Machines 2019, 7(1), 12; https://doi.org/10.3390/machines7010012
Submission received: 2 October 2018 / Revised: 2 January 2019 / Accepted: 8 January 2019 / Published: 1 February 2019

Abstract

:
Vibration-Based Condition Monitoring (VBCM) provides essential data to perform Condition-Based Maintenance for efficient, optimal, reliable, and safe industrial machinery operation. However, equipment required to perform VBCM is often relatively expensive. In this paper, a low-cost vibration measurement system based on a microcontroller platform is presented. The FRDM K64F development board was selected as the most suitable for fulfilling the system requirements. The industrial environment is highly contaminated by noise (electromagnetic, combustion, airborne, sound borne, and mechanical noise). Developing a proper antialiasing filter to reduce industrial noise is a real challenge. In order to validate the developed system, evaluations of frequency response and phase noise were carried out. Additionally, vibration measurements were recorded in the industry under different running conditions and machine configurations. Data were collected simultaneously using a standard reference system and the low-cost vibration measurement system. Results were processed using Fast Fourier Transform and Welch’s method. Finally, a low-cost vibration measurement system was successfully created. The validation process demonstrates the robustness, reliability, and accuracy of this research approach. Results confirm a correlation between signal frequency spectrum obtained using both measurement systems. We also introduce new guidelines for practical data storage, communications, and validation process for vibration measurements.

1. Introduction

Recent developments in mechanical equipment have enhanced the functionality of rotating machines. Nowadays, rotating machines are essential in modern industrial applications. Therefore, implementing a proper maintenance program is critical in industry applications.
Condition-based maintenance (CBM) is an efficient program because it attempts to avoid unnecessary tasks by taking actions only when there is evidence of unusual machine performance. According to the literature, proper machine maintenance can save 30% of the total maintenance costs. In CBM, decisions are based on data collected through condition monitoring [1,2,3,4,5]. One common type of condition monitoring is vibration-based condition monitoring (VBCM), whereby vibration data are collected. Unfortunately, the equipment needed to perform data collection can be expensive and unaffordable for small companies, especially in developing countries. Therefore, in this paper, a low-cost vibration measurement system based on a microcontroller development board is presented.
We reviewed recent research related to the development and design of data acquisition (DAQ) systems for vibration analysis. The literature review focused on Elsevier, Scopus, SpringerLink, and IEEE journals.
Bilski et al. [6] developed a low-cost real-time virtual spectrum analyzer. The main impact is the approach in creating low-cost equipment with the functionality of more complex devices. Swiszcz et al. [7] presented a DAQ platform for the condition monitoring of a wind turbine. The maximum sampling frequency used per channel was 20 KHz. The data are first stored in a MySQL database and then in an Ethernet-based hard drive. Zhang et al. [8] developed a low-cost microcontroller-based vibration DAQ system for tool condition monitoring. The sampling frequency used to perform their tests was 300 Hz. The frequency range could have limitations for machine diagnosis. The system employs a USB interface to communicate with a laptop. Katalin [9] described a microcontroller-based system for vibration analysis. The system employs an 8-bit microcontroller implementing serial communication. Florin et al. [10] presented a DAQ system that reaches 400 KSPS. This system uses an independent analog-digital converter (ADC) module and an independent 16 Mb non-volatile static random access memory (SRAM). The system communicates with a computer using RS232 and RS485. They also implement a MySQL database for data storage. Jamil et al. [11] proposed a vibration DAQ and visualization system using a microelectromechanical system (MEMS) accelerometer and a Peripheral Interface Controller (PIC) microcontroller (Microchip, Chandler, AZ, USA). The communication between microcontroller and laptop uses RS232. Experimental tests were performed on a simple plastic stand and an induction motor. The tests confirmed the stability and reliability of the system for a frequency range up to 5 kHz. Adeyeri et al. [12] presented their development of a system using vibration and temperature maintenance models integrating concepts for machine monitoring. Their system is based on an 8-bit microcontroller and records vibration and temperature measurements.
Regarding systems implemented with 32-bit microcontrollers, Luo et al. [13] proposed a real-time system for vibration measurements using a LPC2129 (NXP Semiconductor, Eindhoven, Netherlands) microcontroller based on a 32-bit ARM7TDMI-S CPU. The microcontroller communicates with a PC running RTLinux via a controller area network (CAN) bus. They perform a simple test on a moving car. Merendino et al. [14] discussed an embedded system that performs vibration analysis for machine diagnosis. A 32-bit reduced instruction set computer (RISC) ARM9 STR912F44W microcontroller (STMicroelectronics, Geneva, Switzerland) for DAQ and signal processing are used. Additionally, Discrete Wavelet Transform (DWT) was applied at different levels to vibration signals. The embedded system can be connected to a PC via RS232, CAN, or Ethernet. The system was validated on a mechanical test bench. Zhang et al. [15] introduced a DAQ system based on a 32-bit STM32F103VET6 microcontroller (STMicroelectronics) for rotating machinery monitoring. A three axis accelerometer to measure vibration signals is used. In addition, they performed simple tests at a sampling frequency of 5 kHz. Huang et al. [16] presented a vibration signal acquisition and analysis system. This system implements a STM32 microcontroller (STMicroelectronics), independent ADC, and Wi-Fi modules. The last module enables wireless communication with a laptop and fault diagnosis tests were performed. Lu et al. [17] described a wireless DAQ system to evaluate their method for motor bearing condition monitoring and fault diagnosis using under-sampled vibration signals. The system consists of a STM32F407 microcontroller (STMicroelectronics), a 16-bit ADC Max1300 (Maxim Integrated, San Jose, CA, USA), a CA-YD-1182 accelerometer (Global Sensor Technology, Wuhan, China), a programmable analog filter Max261 (Maxim Integrated), and a wireless module. The method was evaluated on a brushless direct current motor.
In the case of single-board computers running operating systems, Ambrož [18] and Guo et al. [19] presented DAQ systems for vibration using boards running Embedded Linux. One of the main advantages of these boards is that they integrate Secure Digital High Capacity (SDHC), Ethernet, and Wi-Fi interfaces. These interfaces allow massive storage (in the order of tens or hundreds of GB), and wired and wireless connectivity. Another main advantage of these boards is the implementation and how they facilitate the usage of a full TCP/IP stack to send data over the Internet. This opens the possibility of transforming the developed DAQ systems into Internet of Things (IoT) solutions. Notably, these boards have significant processing power. One drawback is that they do not implement an on-board ADC; therefore, additional modules are required to use these boards as part of the DAQ systems. Finally, both systems have limited memory for sample storage while the data acquisition loop is running. It is difficult to exploit the massive storage capabilities of a Secure Digital (SD) card due to the delays involved in the usage of a file system to read/write data.
About distributed DAQ systems, Nguyen et al. [20] proposed a cost-effective measurement data acquisition system for long-term structural health monitoring of buildings, using standard DAQ units and LabVIEW (National Instruments, Austin, TX, USA). The system shows how the Ethernet and TCP/IP capabilities of DAQ units are useful in a distributed setting. Hester et al. [21] presented a wireless sensor network to perform vibration-based structural health monitoring on historic monuments. They designed their own custom sensor board using Eagle (Autodesk, San Rafael, CA, USA). The sensor includes a low noise 1521L accelerometer (Silicon Designs, Kirkland, WA, USA), a programmable gain ADS1120 16-Bit ADC (Texas Instruments, Dallas, TX, USA), a solar panel for solar harvesting, a MSP430 launchpad (Texas Instruments) for processing, and a CC2500 2.4GHz radio transceiver (Texas Instruments) for wireless communication. Several sensors communicate with a base station built on a BeagleBone Black board (Texas Instruments). Their low-cost and low-power system was demonstrated to be robust and accurate. Heo et al. [22] proposed a unified wireless system to control the vibration of bridges. The system consists of four parts: the wireless measurement (WM) system, the wireless analog output (WAO) system, the main control (MC) system, and the wireless bidirectional communication system (WBC). The WM system employs a cRIO-9014, which is made by National Instruments for data logging applications. This device also allows the use of TCP/IP in the communications between the different parts of the system. Finally, they performed a vibration control experiment on a model bridge. Herrasti et al. [23] introduced an autonomous sensor node that measures acceleration, strain, and temperature. The node uses a three-layer printed circuit board (PCB) which is powered by a small Lithium Polymer (LiPo) battery. The signal conditioner module consists of an EFM32 low power microcontroller (Silicon Labs, Austin, TX, USA), a 16-bit ADC, and programmable gain amplifier and filter. The radio module allows a synchronized analog-digital conversion. The energy harvesting module collects solar and piezoelectric energy. Finally, they performed vibration tests on a laboratory wind turbine.
Regarding the usage of Field Programmable Gate Arrays (FPGAs), papers related to our research include Devi et al. [24] and Contreras et al. [25]. The first one presented a novel hardware architecture for the detection of functional deterioration in turbines. The system was revealed to be cost-effective and appropriate for steam turbine monitoring. The second one proposed a FPGA-based multi-channel vibration analyzer for industrial applications in induction motor failure detection. The main contribution of this second paper is the use of a FPGA for the development of a multichannel vibration analyzer with a data post processing stage. The authors also performed experiments on induction motors to detect failures. Bengherbia et al. [26] developed a vibration measurement system for detection and machine diagnosis using a FPGA implemented with wireless capabilities. They introduced a wireless sensor node based on an Artix-7 XC7A35T FPGA (Xilinx, San Jose, CA, USA) and a Radio Frequency (RF) transceiver nRF24L01 (Nordic Semiconductor, Trondheim, Norway). The system also implements an Advanced Encryption Standard (AES) block to provide secure data transmission. Finally, the authors validated the node on a rotating machine test bench with an unbalance fault.
The literature review reveals that most of the results were obtained in a laboratory environment and not in field tests. The validation approaches often involved the use of mechanical test rigs and induction motors. However, proper validation of the measurement systems is still required since good results in laboratory conditions do not guarantee good results in a real environment. A fast and easy method to validate a system in real environments involves comparing results with a standard measurement system. Moreover, specifications of the system and the standard system could be compared to gain a general idea of the performance. The literature review also showed that Ethernet and TCP/IP capabilities are very desirable.
Regarding other aspects, in many cases, the sampling frequencies are low due to the technical limitations of employed devices, limitations in data transmission rate, or delays in memory read/write operations. One clear example of this is described by Ambrož [18]. The issue is that the SD card read/write operations may block the execution of the data acquisition loop for an unacceptable amount of time.
Considering the above observations and the prior literature review, the contributions of our research work are: (1) extensive validation of the developed system by comparison against a standard unit, (2) an implementation of TCP/IP capabilities without an operating system by using light weight implementation of the TCP/IP stack (lwIP), and (3) a reduction in the time required for read/write operations on a microSD card avoiding the use of a file system, hence manipulating data as raw bytes.
The rest of this paper is structured as follows: Section 2 discusses system architecture and design. Section 3 describes measurement set-up and analysis procedure. Section 4 describes results, analysis, and comparison. Section 5 presents a discussion. Finally, the paper is concluded in Section 6.

2. System Architecture and Design

This section outlines the proposed system requirements, component list, selection procedure, and design description for most important parts of firmware and software development. The readers interested in this topic are encouraged to use these materials for further development of low-cost measurement systems.
There are four main proposed system requirements: (1) low-cost, (2) performance comparable to an industrial device, (3) data connectivity over a local area network (LAN) and Internet, and (4) high robustness and flexibility to add more features.
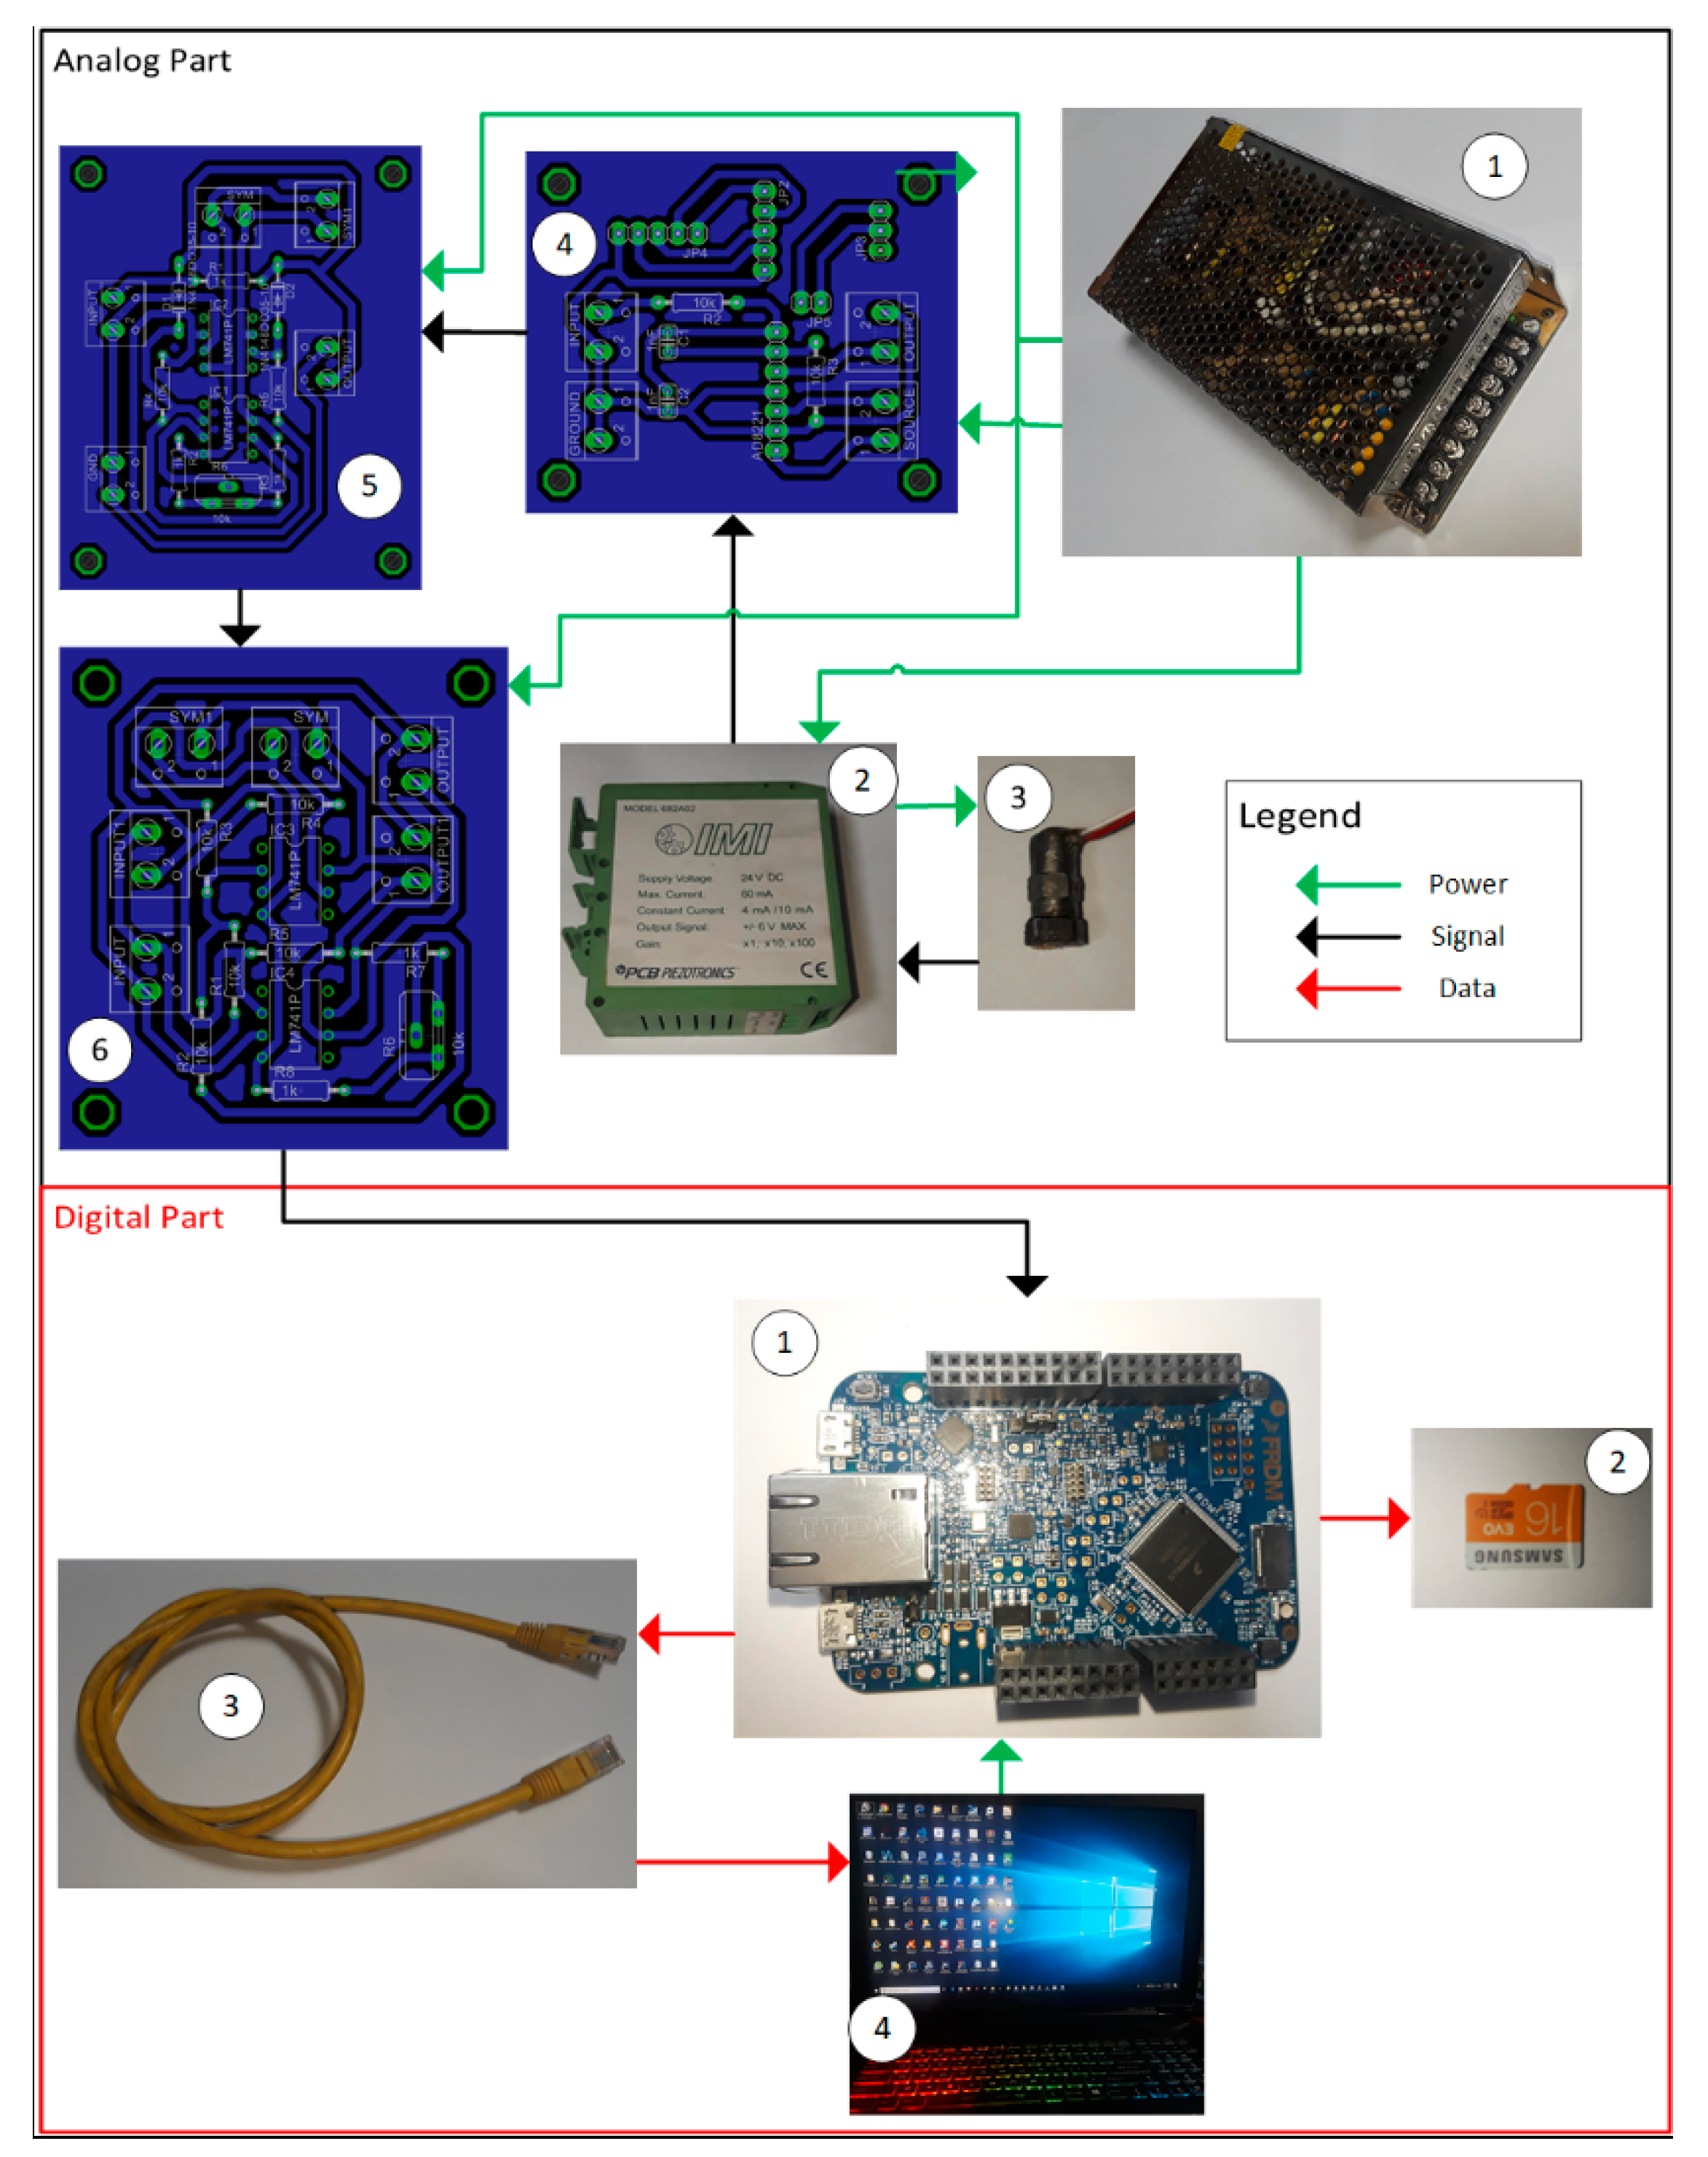
Figure 1 depicts the overall schematic diagram of the developed system, which can be divided into two main parts: the analog and digital part. The first one has three main purposes: transduce the vibration signal, perform signal conditioning, and minimize signal aliasing. The second part has four objectives: convert the analog signal to a digital one and encode it, encapsulate data in a TCP segment making it suitable for transmission over a network and Internet, process data, and display data. For clarification, TCP is a highly reliable host-to-host protocol in packet-switched computer networks [27], part of the Internet Protocol Suite also known as TCP/IP. A TCP segment is its protocol data unit (PDU).
The analog part contains the following components:
(1)
Power supply of 5 V/12 V/24 V/–12 V 120 W
(2)
Signal conditioner: PCB Piezotronics ICP sensor signal conditioner model 682A02 (PCB Piezotronics, Depew, NY, USA). It provides excitation voltage and current required by the accelerometer.
(3)
Accelerometer: A piezoelectric accelerometer was used because it offers high sensitivity, low cost, and small dimensions, making it appropriate for vibration monitoring [28,29]. The PCB Piezotronics ICP accelerometer model 353B17 (PCB Piezotronics, Depew, NY, USA) was selected. This accelerometer implements Integrated Circuit Piezoelectric (ICP) technology that includes built-in charge amplifiers [24]. It has a sensitivity of 10 mV/g (±10%), measurement range of ±500 g peak, and frequency range of 10 KHz with a relative error of ±5%.
(4)
Active antialiasing filter built on an instrumentation amplifier that offers a high common-mode rejection ratio (CMRR).
(5)
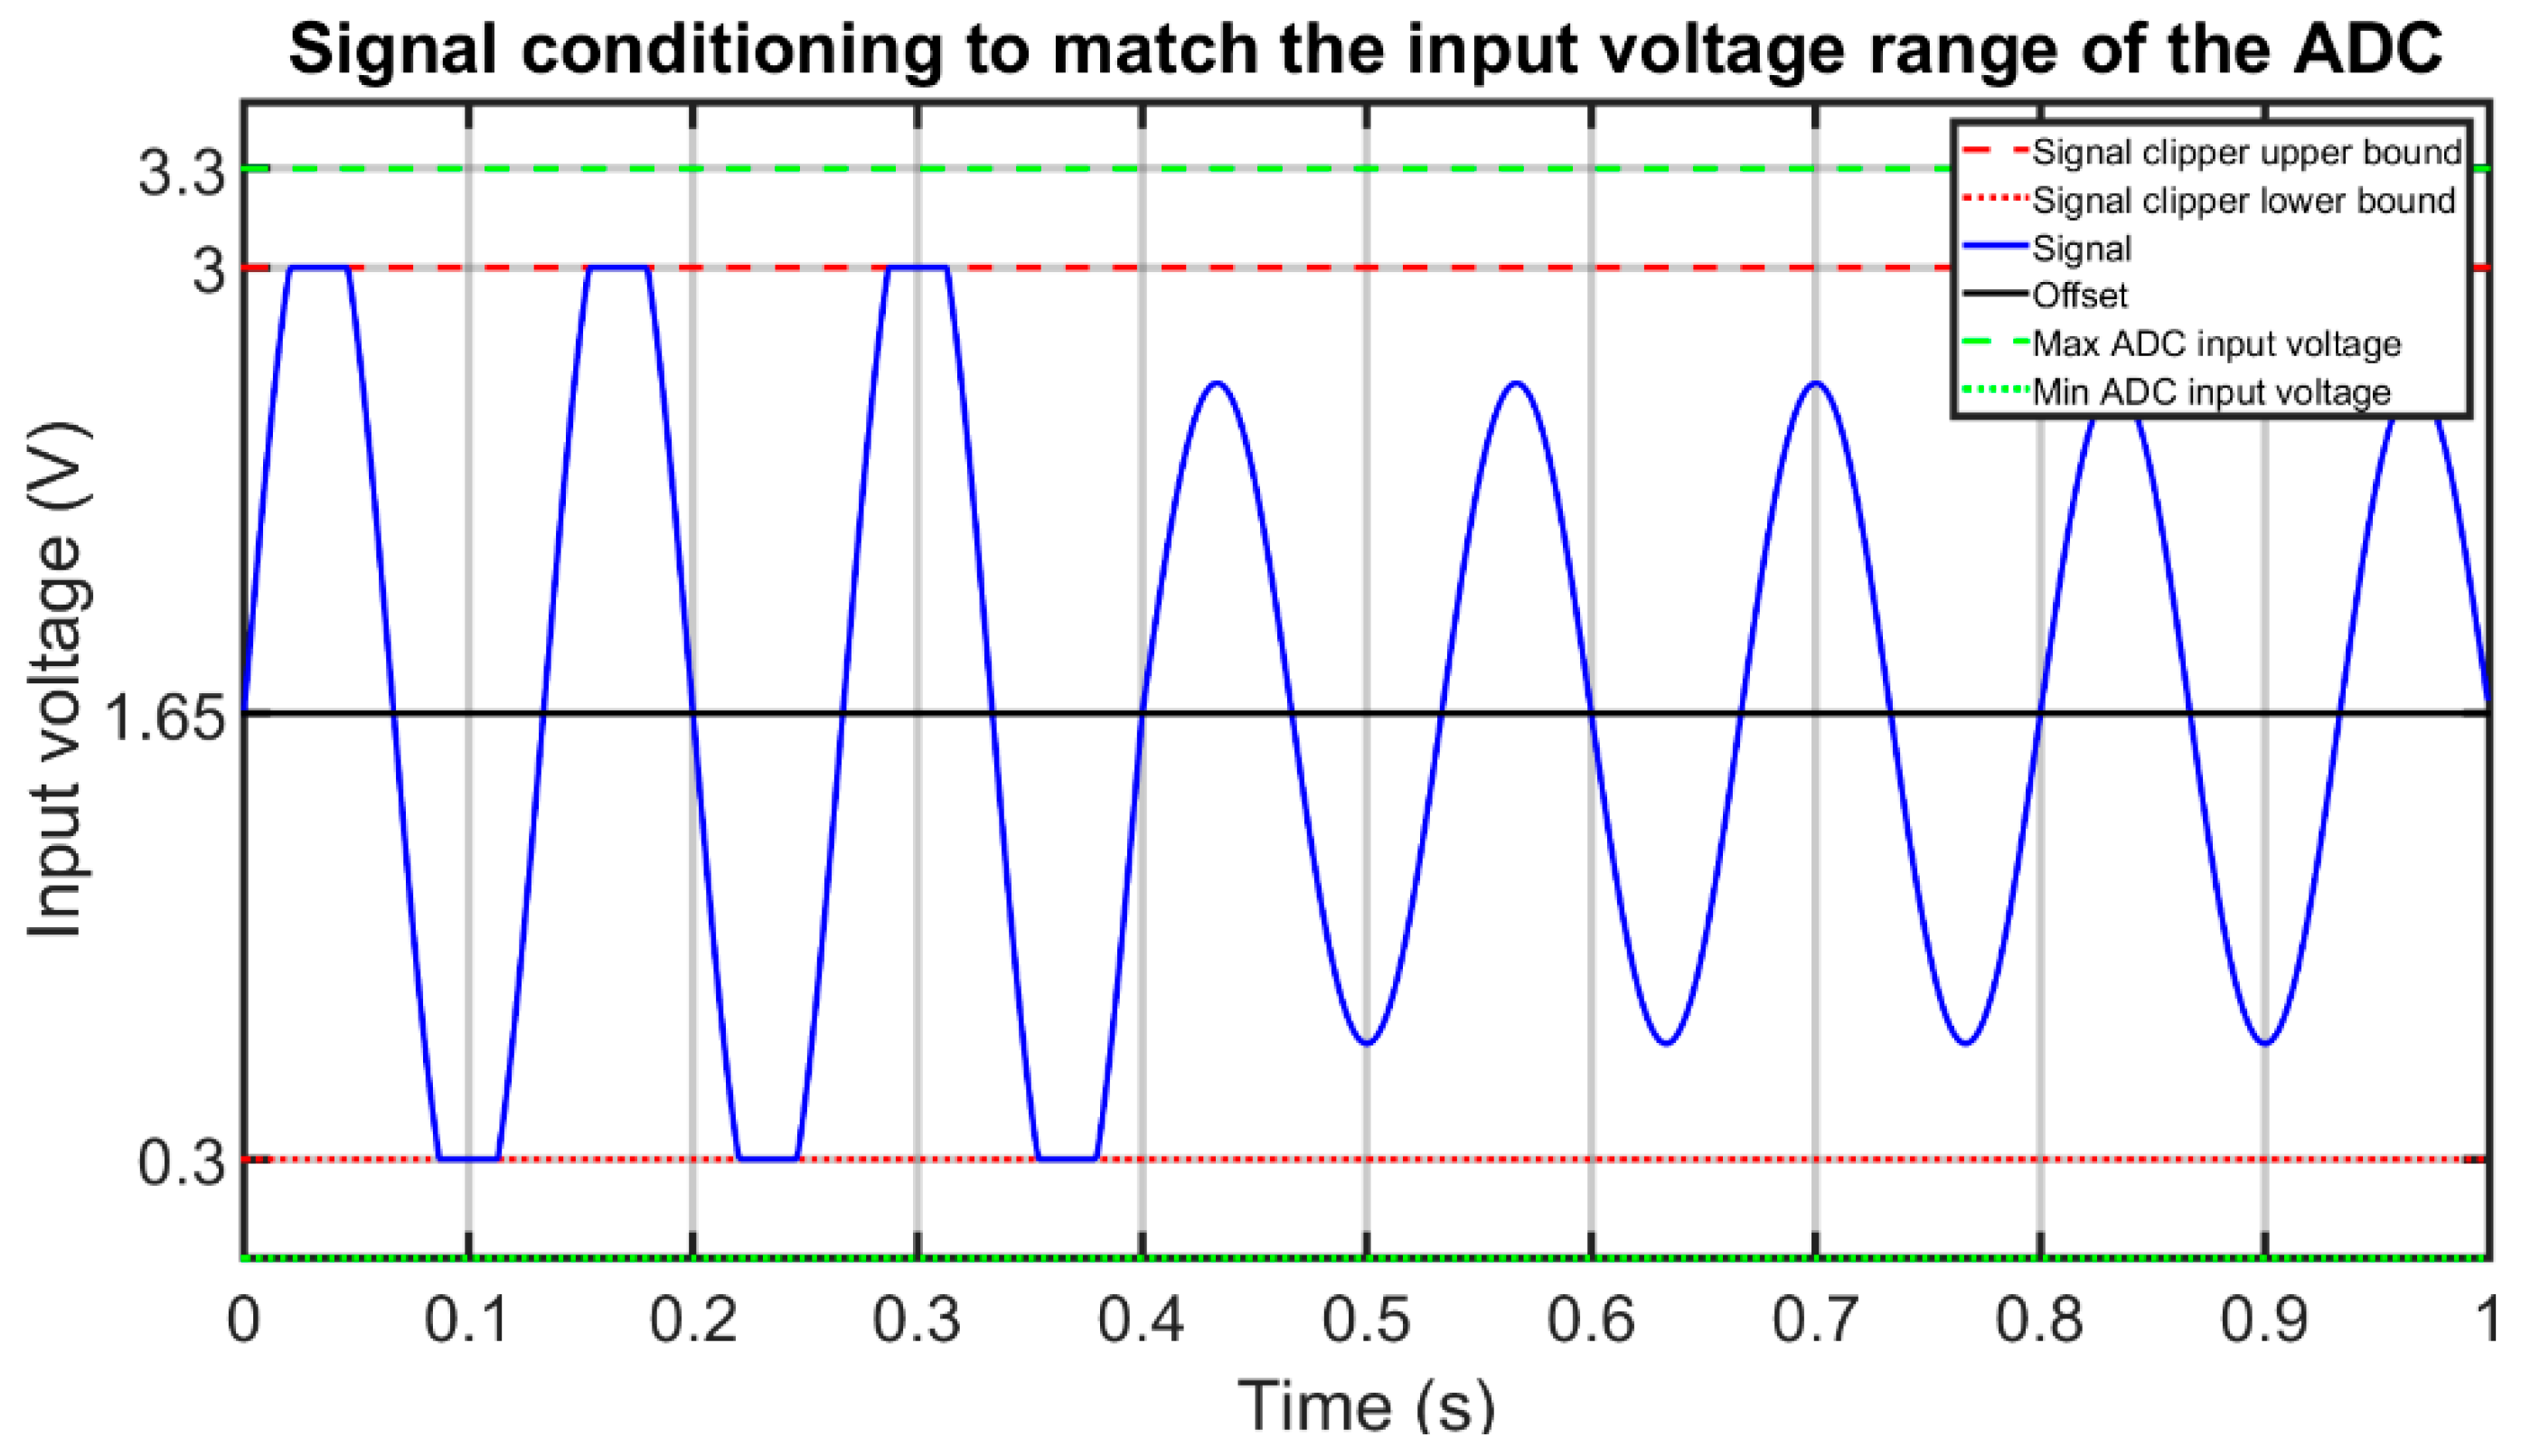
Diode clipper circuit limits the voltage range of the signal conditioner output to fit the input voltage range of the ADC (0 to 3.3 V) on the Microcontroller Unit (MCU).
(6)
Direct Current (DC) voltage bias circuit adds a DC voltage bias to the output of the signal conditioner to fit the input voltage range of the MCU integrated ADC. More details are provided in Figure 2.
The digital part contains the following components:
(1)
Development board: the core of the system because it runs the data acquisition and data transmission processes.
(2)
MicroSD card: provides a massive on-board data storage.
(3)
Ethernet cable: the physical medium that permits a wired communication between the development board and the laptop.
(4)
Laptop: runs an application to visualize and process data.

2.1. Development Board Selection

The development board is the core of the system, so selecting one that matches the requirements proposed was of critical importance. There are two main alternatives when selecting development boards: microcontroller- and FPGA-based.
Low-cost FPGA-based boards offer less features than microcontroller-based development boards of similar price. It can be mentioned that these boards do not have a microSD card, Ethernet or Wireless interfaces. A microSD card allows storing massive amounts of data in the development board. The microSD cards store data in the order of Gigabytes [30]. This provides a large buffer that is useful in both real-time and non-real-time applications. Based on the aforementioned, we chose a microcontroller-based board.
Among the microcontroller-based boards, the FRDM K64F development board (NXP) was selected as the most suitable for fulfilling our system requirements. It has an approximate cost of USD $37. It has an additional feature that supports lwIP for implementation of the TPC/IP protocol stack. It reduces memory usage and code size, making it suitable for embedded systems [31]. The characteristics of the on-board MCU are shown in Table 1.
This development board creates the possibility of two major further improvements to the system:
(1)
Implementing digital signal processing on the MCU using its Floating Point Unit (FPU) and leveraging processor high clock speeds.
(2)
Implement Bluetooth (Bluetooth Special Interest Group, Kirkland, WA, USA) and RF/Wi-Fi capabilities by adding modules to the specific interfaces on the board [33]. These features, in conjunction with the lwIP support, provide the possibility of developing a wireless IoT solution.

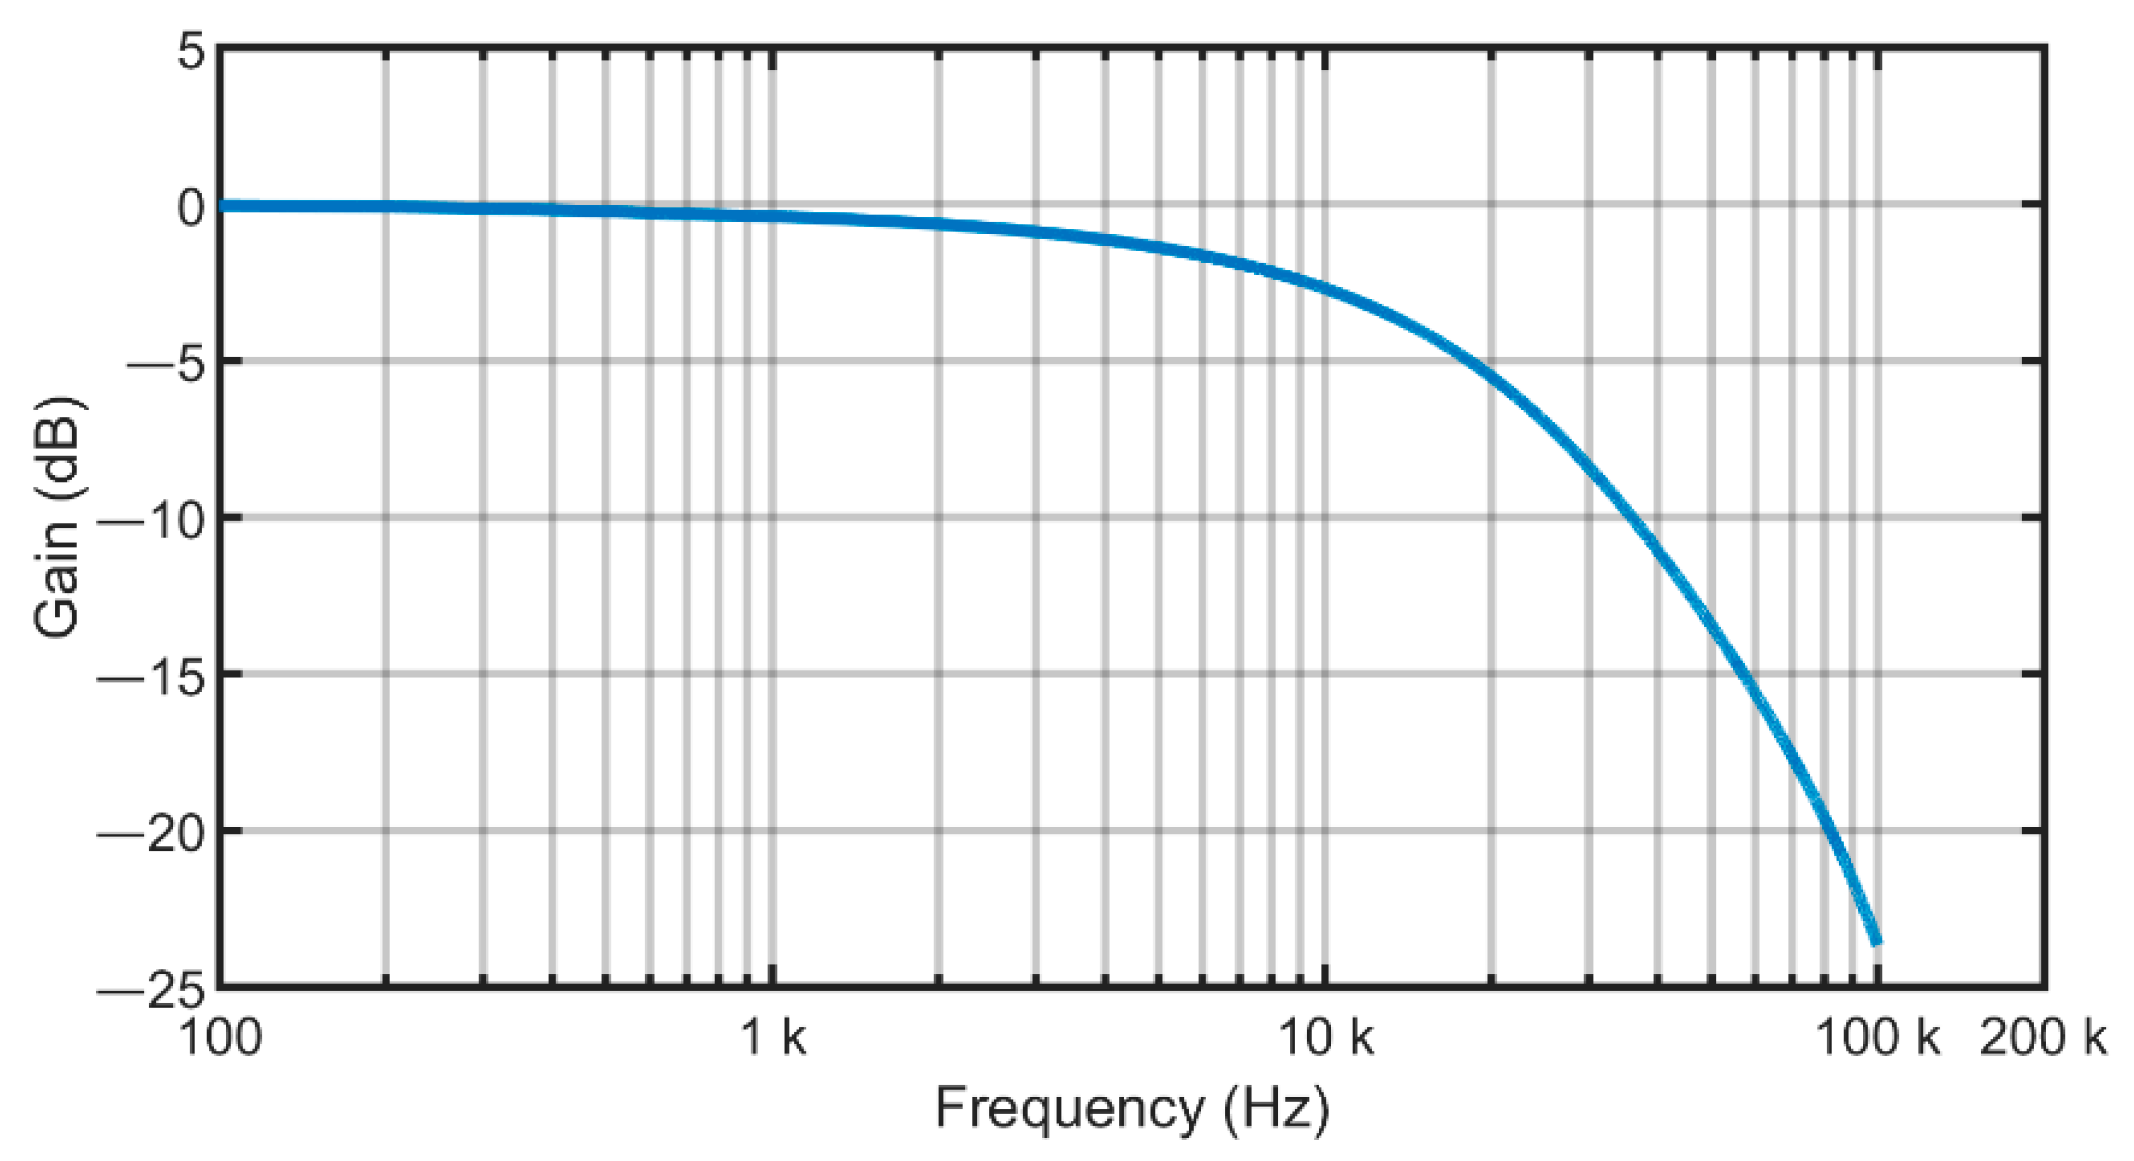
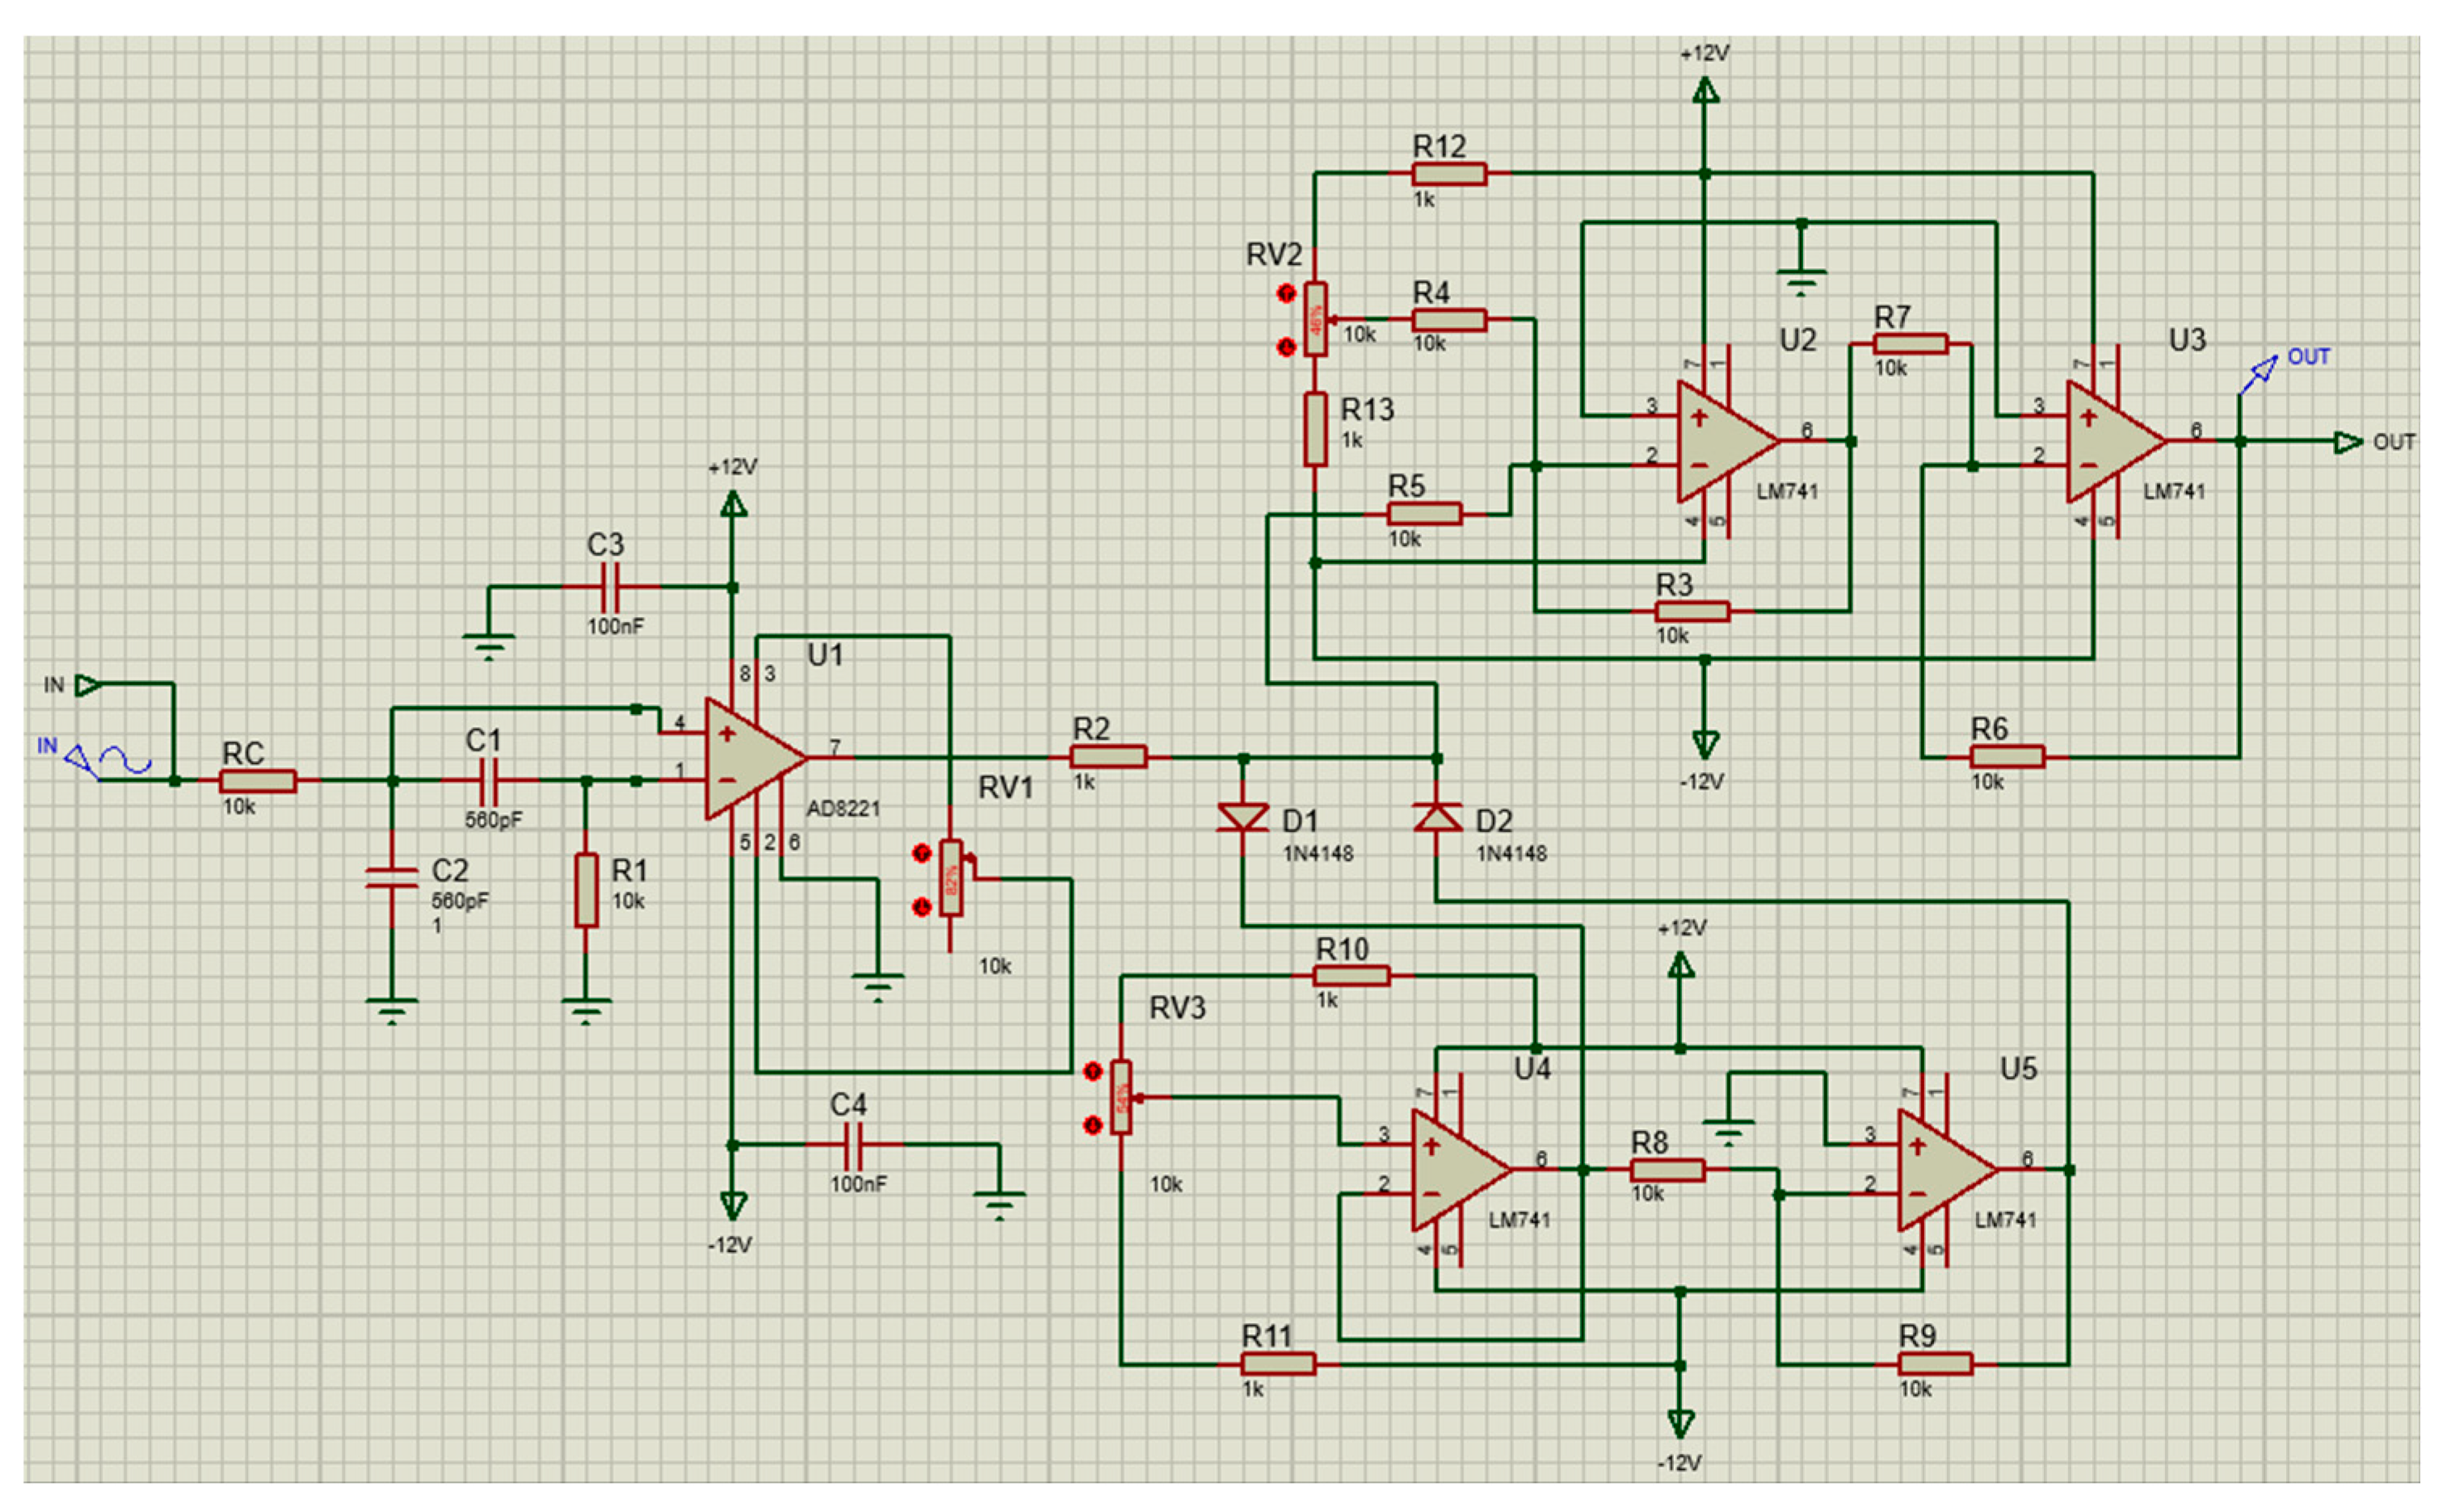
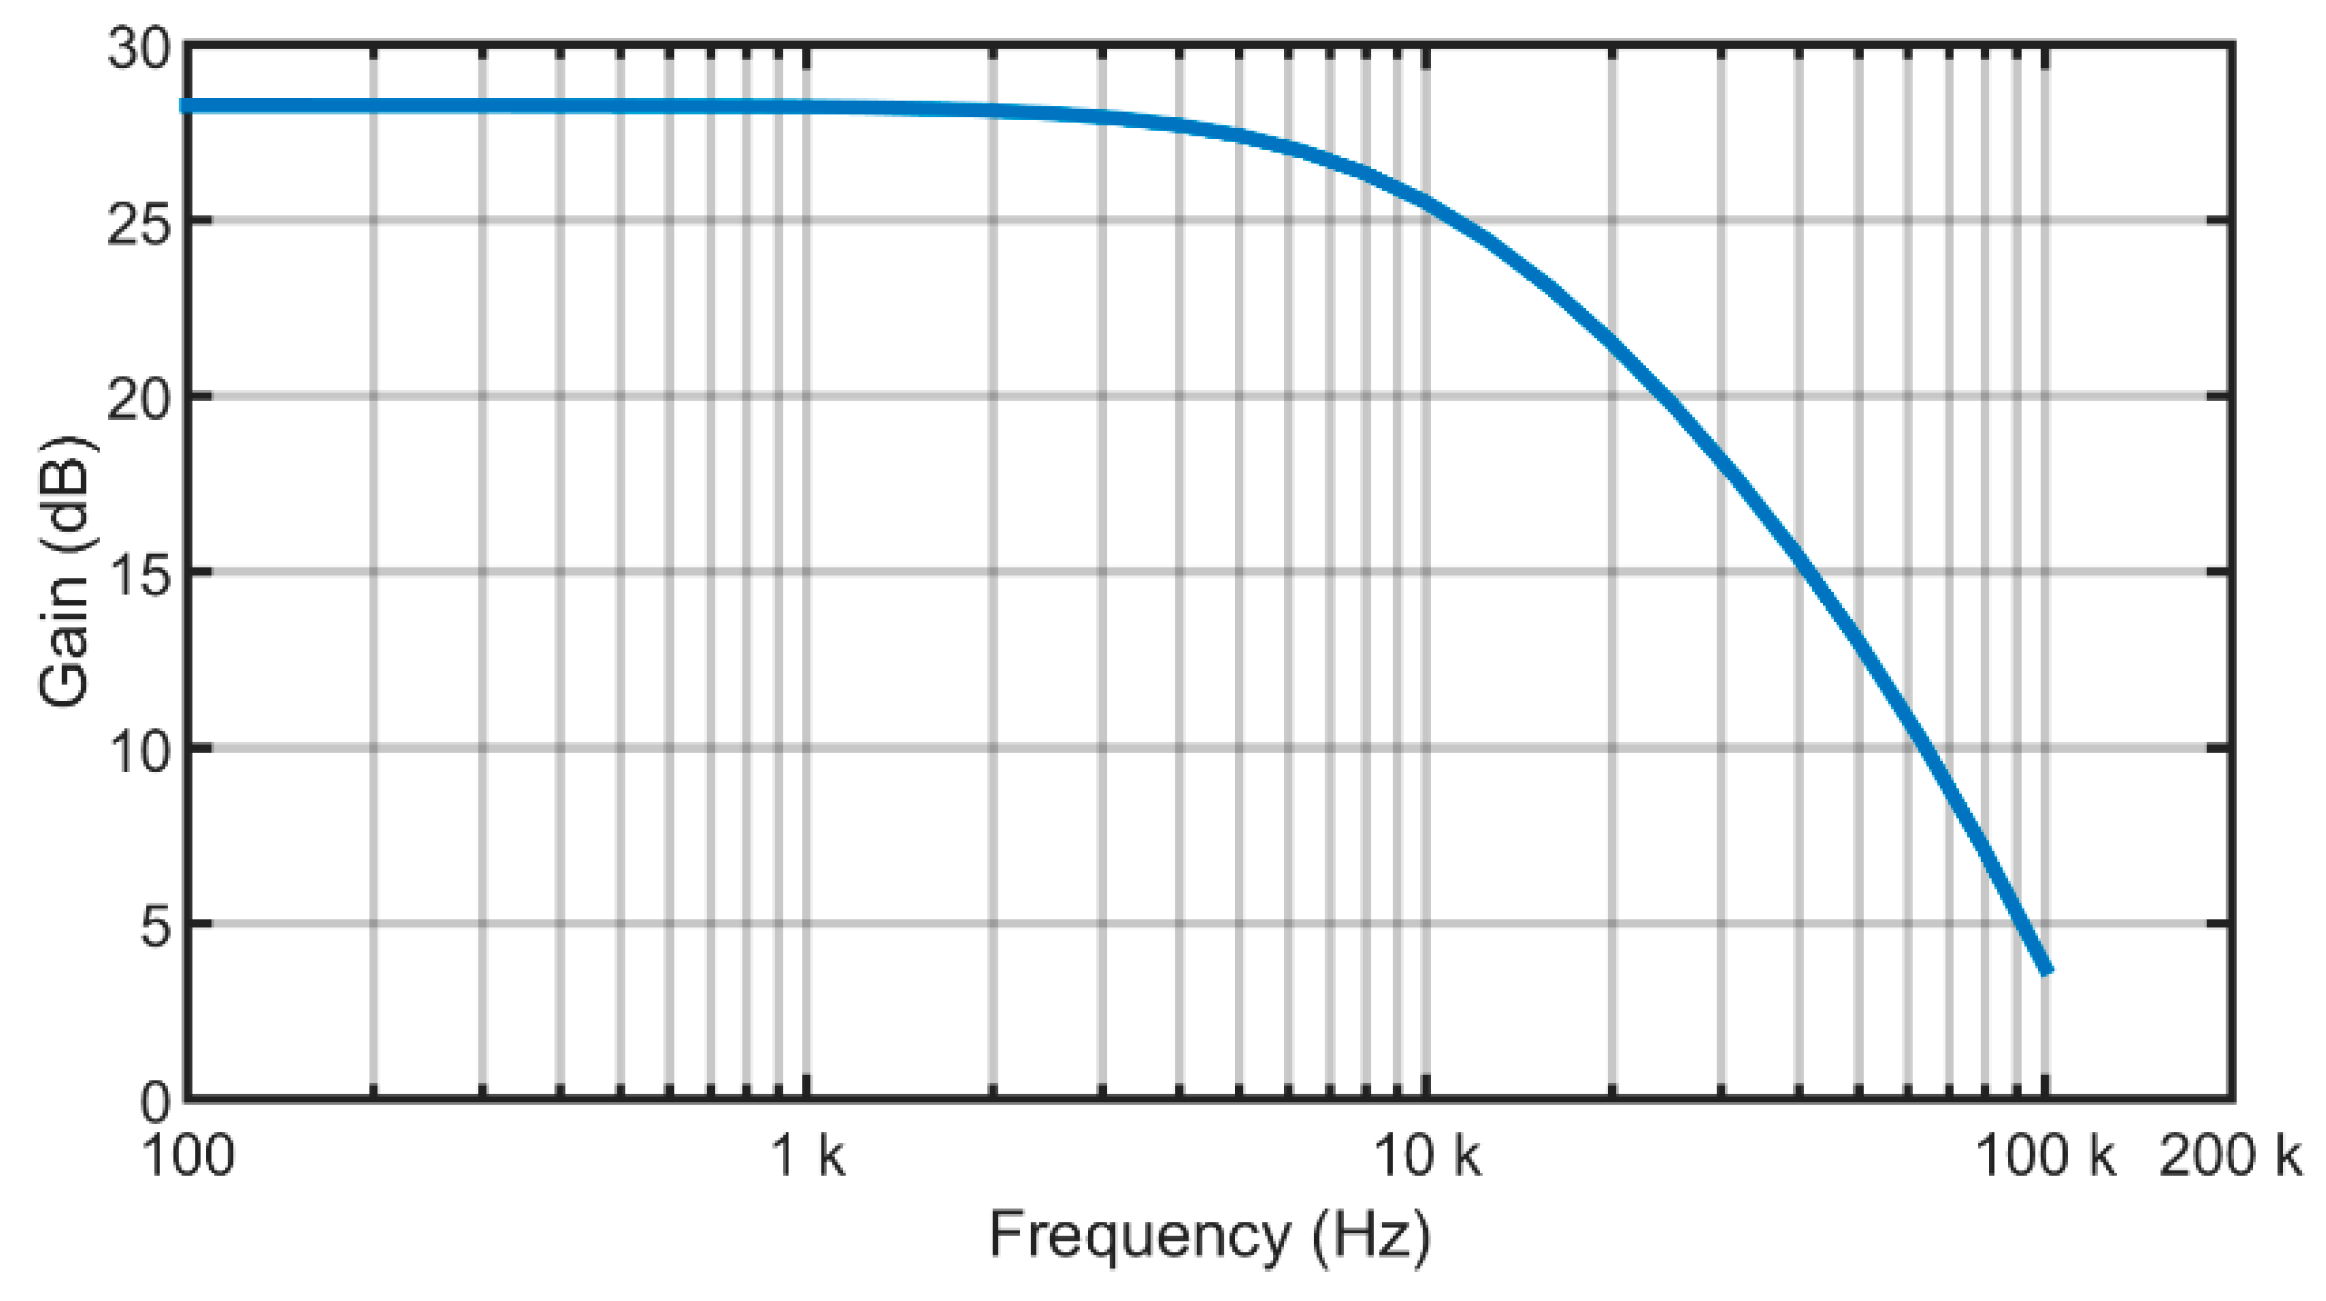
2.2. Active Antialiasing Filter Design

Relevant frequency spectral signal information, for this application, is contained up to 10 KHz [34]. Moreover, a low-pass filter with a 3-dB cut-off frequency of 10 KHz is proposed. A typical Sallen-Key second order low-pass filter was initially considered. However, considerable gain and CMRR are required. Therefore, an instrumentation amplifier approach, including second-order low-pass filtering was implemented based on the design of Blomqvist et al. [35]. In our case, Resistance = 10 KOhm and Capacitances = 560 pF were selected, which correspond to a cutoff frequency f c = 10610   H z . For the instrumentation amplifier, an AD8221 (Analog Devices, Norwood, MA, USA) satisfies the requirements due to its high CMRR (80 dB minimum up to 10 KHz) operated with a linear gain in the pass-band.

2.3. Firmware Development

Firmware development involved the selection of appropriate tools and writing code. Tools selection was straightforward as the development board manufacturer (NXP) provides a number of readily available modules. There are also useful Application Program Interfaces (APIs) that accelerate development.
Writing code also involves modules configuration and four modules required configuration: system clock, ADC, SHDC, and Ethernet.
System clock configuration is straightforward. It was set to its maximum value of 120 MHz. This selection is also compatible with the desired ADC sampling frequency, which was derived from the main clock [36].
To configure the ADC, a maximum frequency of 10 KHz was considered based on the analysis presented in Section 2.2. Then, by applying the Nyquist sampling theorem [37], a sampling frequency of 20 KHz was required. These parameters and their values are shown in Table 2. The selection was made to attempt to balance sampling speed and accuracy. Enabling high speed and continuous conversions increase the speed at the expense of reduced accuracy [36]. Conversely, setting a relatively large hardware averaging count reduces noise and setting long sample cycles increases accuracy, but both decrease conversion speed [36].
The SDHC module was configured to use Direct Memory Access (DMA). This configuration allows to transfer data from and to the RAM bypassing the processor [30], effectively reducing the computational load.
The Ethernet module was configured using its default values. This sets a throughput of 100 Mb/s.
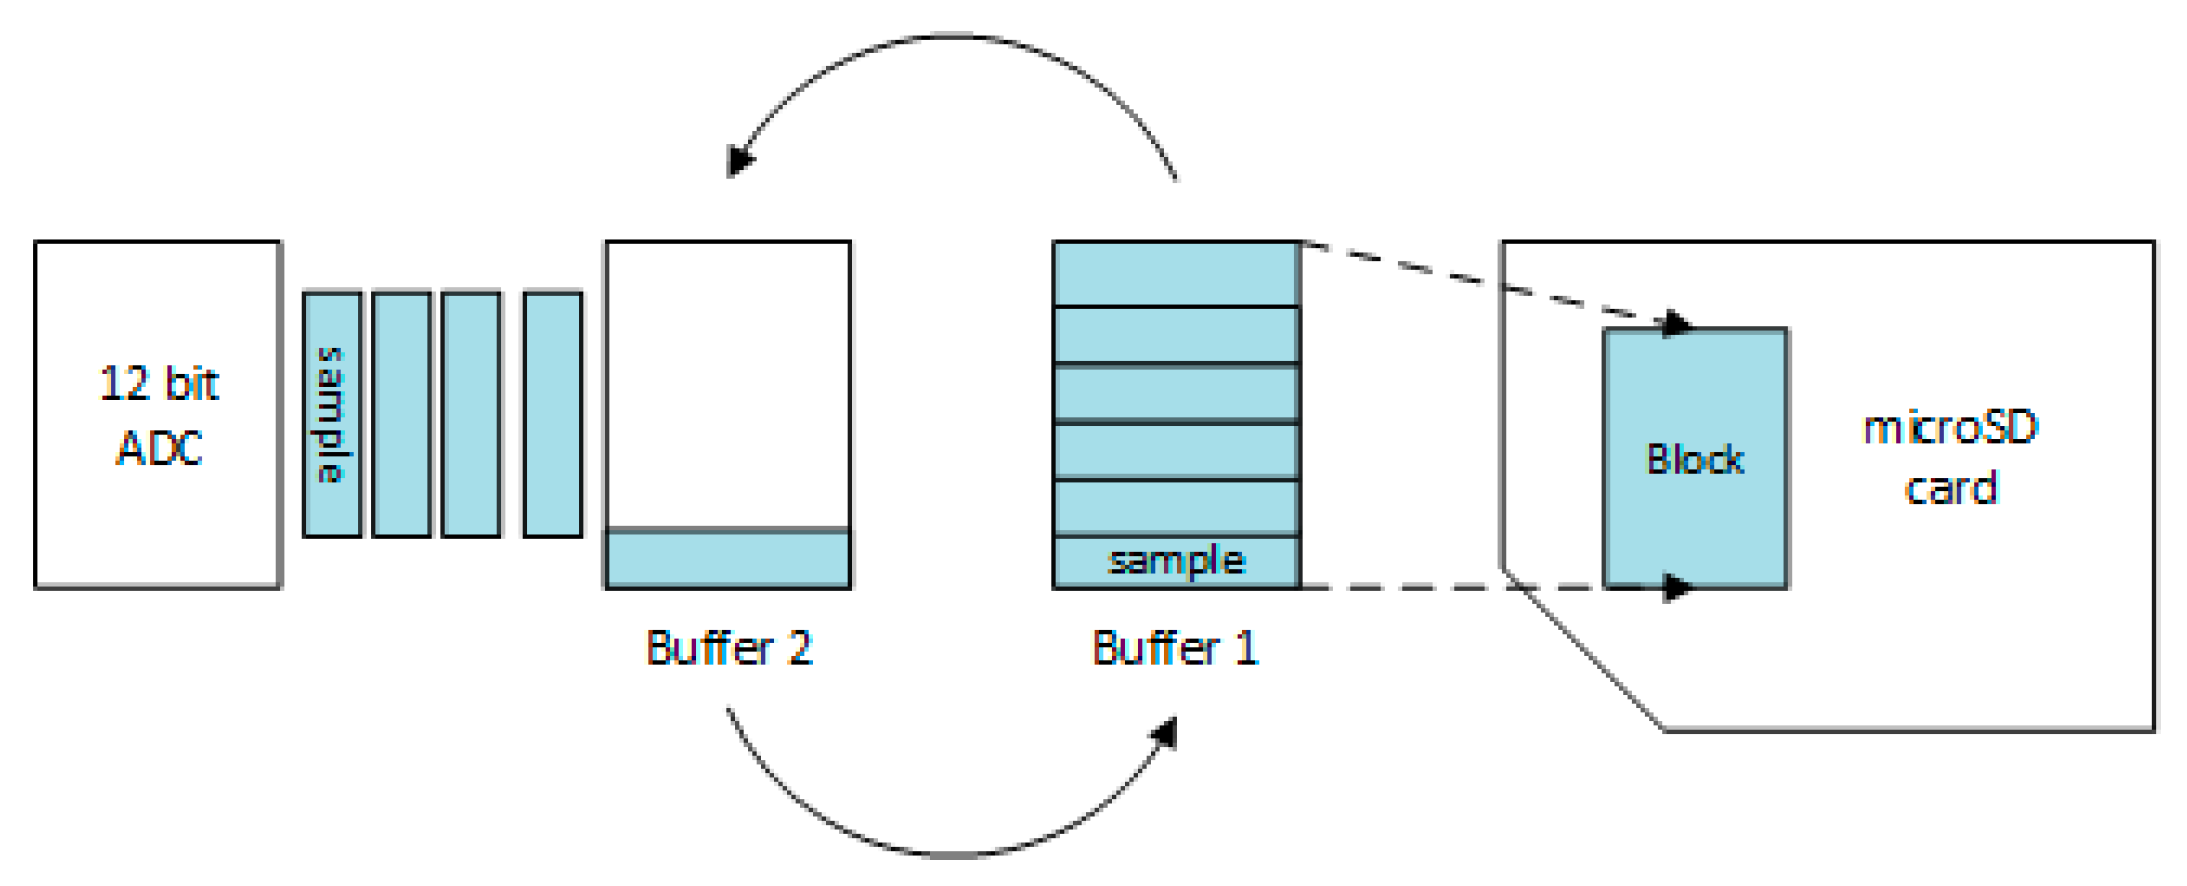
Once the modules were configured, the actual program was also implemented. Firmware operation is described by Algorithm 1. The operation has two critical stages: data acquisition and data transmission. In the data acquisition stage, the MCU reads samples from its ADC and writes them to the microSD card. In order to implement the latter operation, the file system module was used first. A file system module offers APIs to create, read, and write files independently of the storage device and the hardware architecture. However, similar to the problem described by Ambrož [18], we observed that delays in the write operation are unacceptable. They prevent achieving the required sampling frequency. Therefore, we decided to employ a low-level API that handles data as raw bytes. This effectively reduced the time of write operations on the microSD card since an entire abstraction layer (the file system) is omitted. In this way, the process overcomes the problem and it is one of our contributions. Additionally, a ping pong buffer was implemented to avoid losing samples. As Figure 3 depicts, there are two buffers. The first one stores samples every time the ADC generates an interrupt when a conversion is completed. The second buffer is emptied while its samples are written to the microSD card. Once the first buffer is full and the second one is empty, they exchange roles.
Algorithm 1. Algorithm describing firmware operation.
1initialize modules and variables
2do
3      detect microSD card
4while microSD card is not detected
5initialize the microSD card
6collect data
7initialize network configuration
8initialize Ethernet interface
9initialize lwIP functionality
10initialize TCP client
11connect to TCP server
12if connection was successful then
13      transmit data to TCP server
14else
15      if reset then
16            go to 2
17      else
18            end
19      end
20end
For the data transmission stage, TCP/IP capabilities were implemented enabling to send data over the Internet. We also considered using a real-time operating system (RTOS) first because it facilitates the development. However, the RTOS requires extra resources and some critical tasks, like high-speed data acquisition, which can be negatively affected. Therefore, lwIP was selected to implement a TCP client.
In the data transmission process, the TCP client running on the MCU tries to connect to a TCP server and initiate a three-way handshake. If the server replies, a connection is established. Then, for each acknowledgement (ACK) of the client, a block of the microSD card is read and sent as a load. This is another one of our contributions; implementing TCP/IP capabilities without using an RTOS. The idea was to use a low-level API (provided by lwIP) based on protocol control blocks.

2.4. Software Development

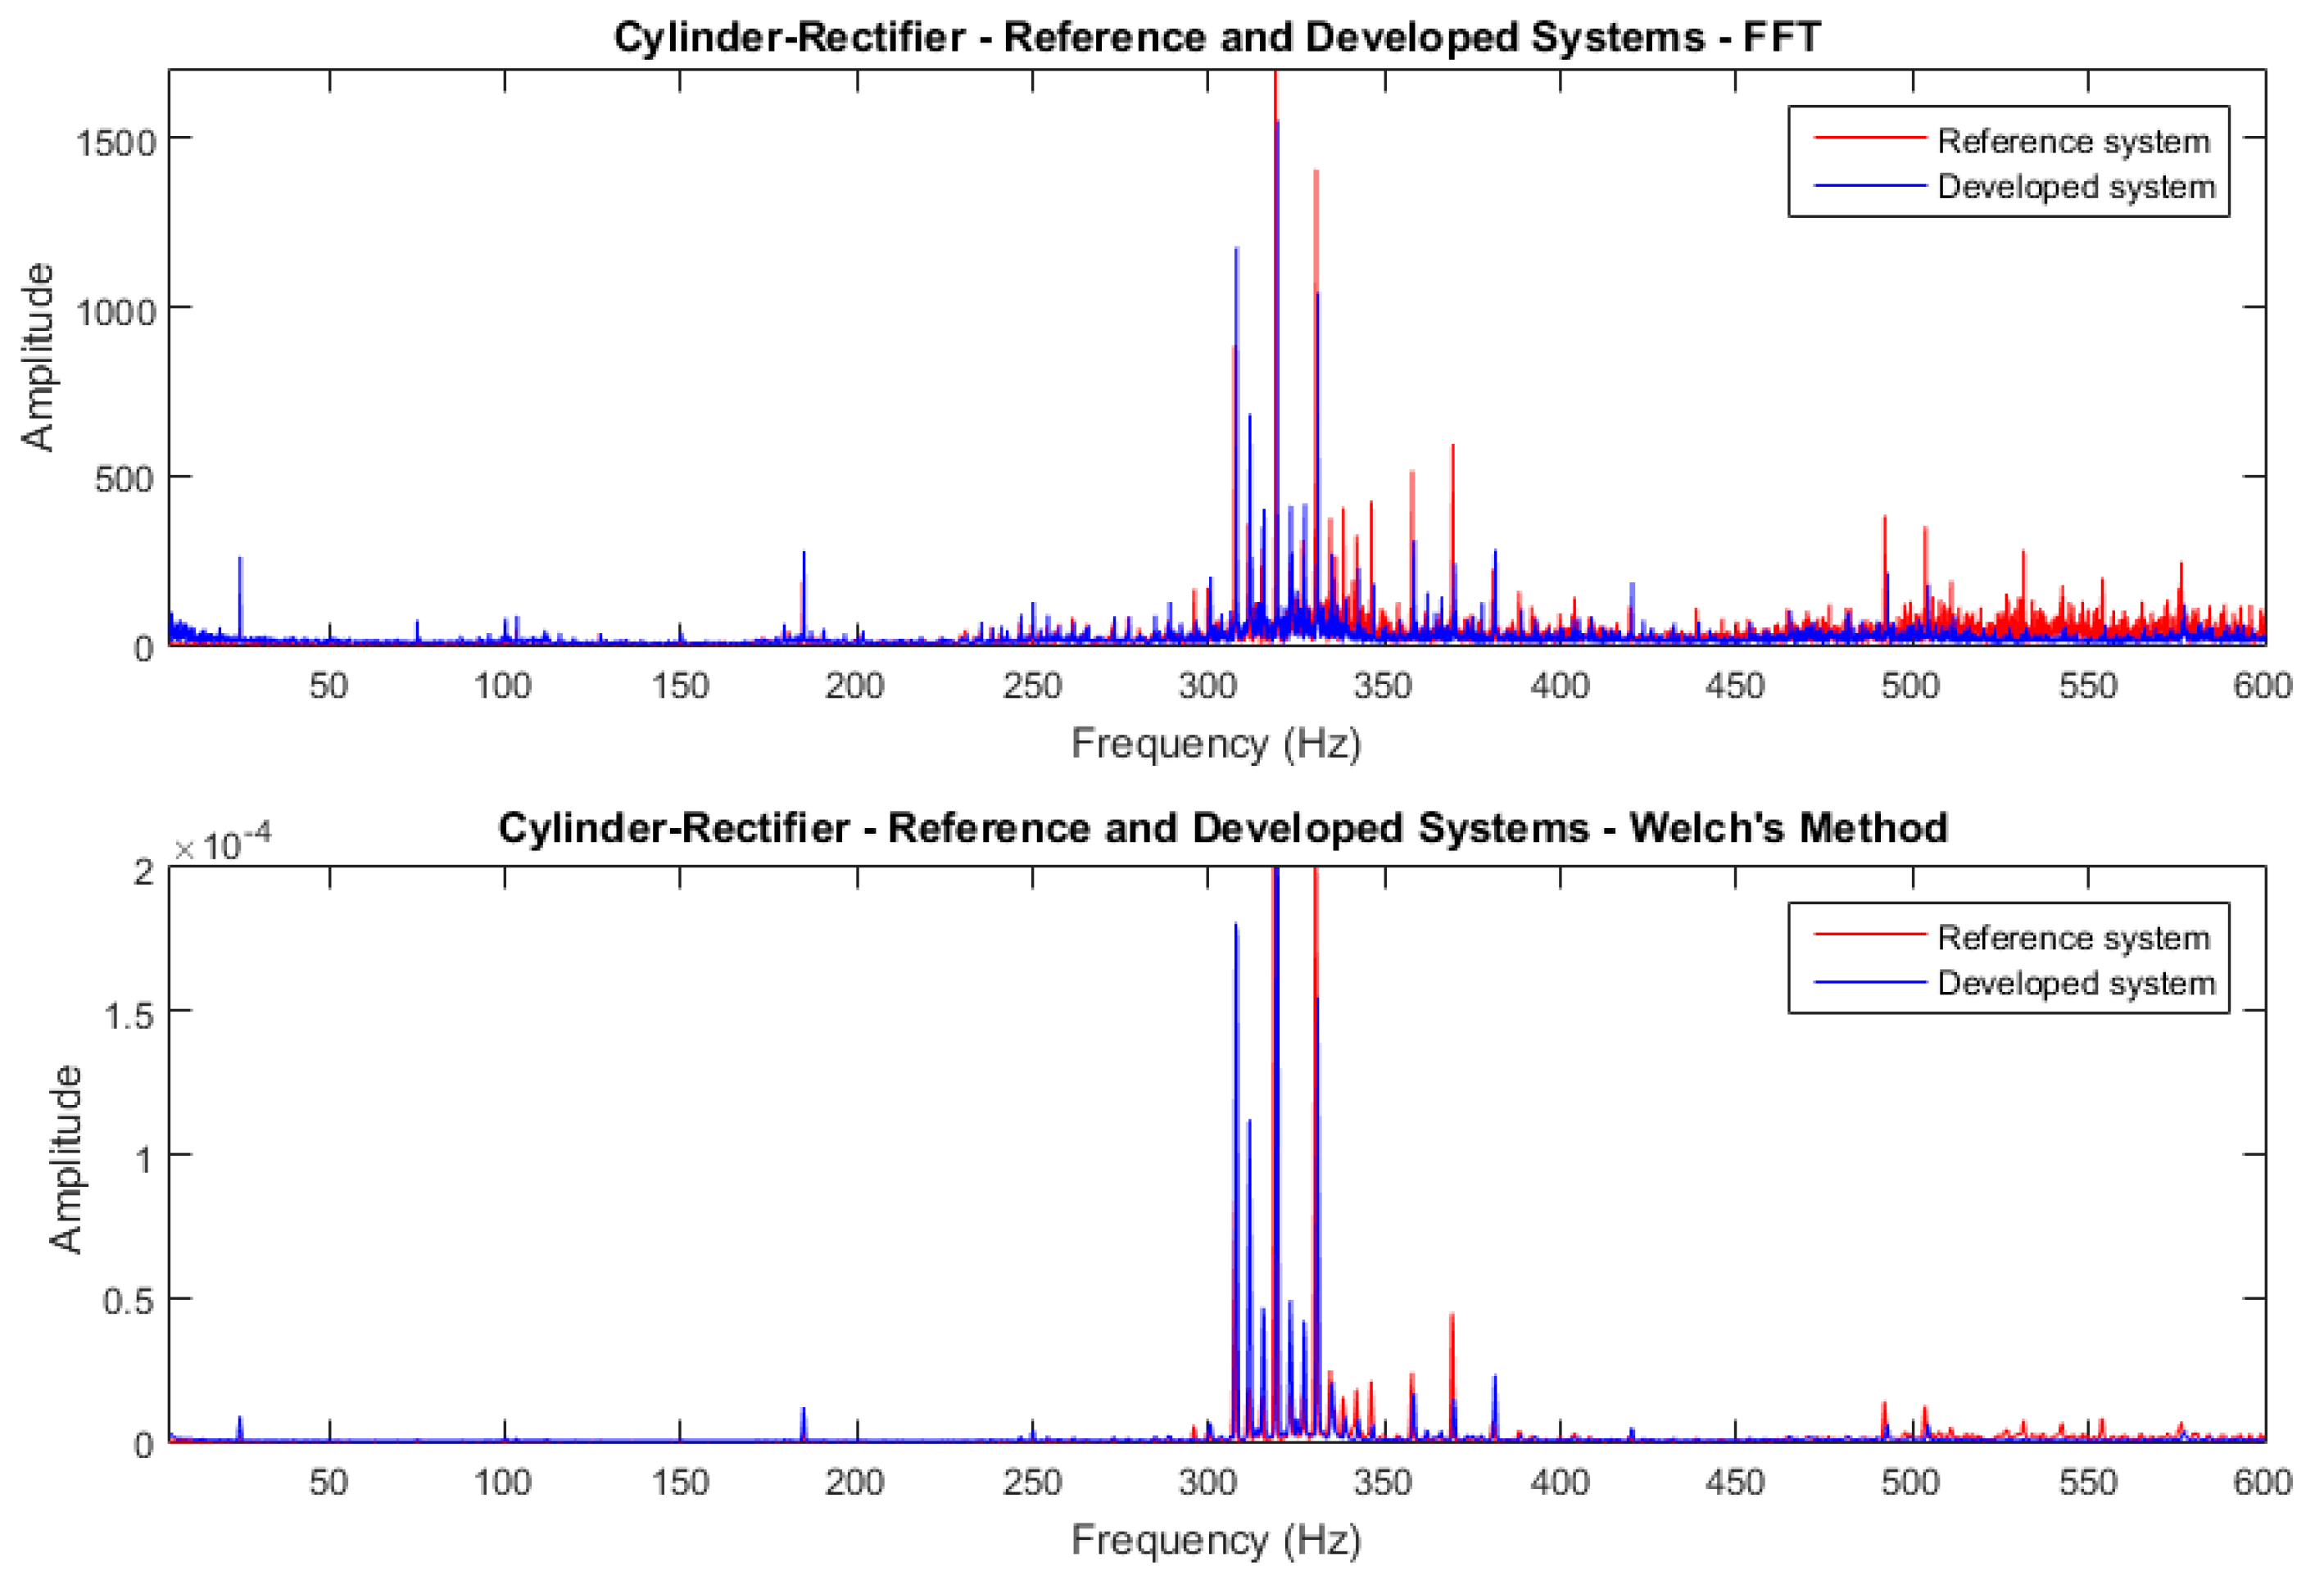
The visualization and processing software was implemented in Python (Python Software Foundation, Wilmington, DE, USA). Algorithm 2 describes the software operation with the vibration data analysis procedure in the time and frequency domains. The analysis started with the Graphical User Interface (GUI) being initialized prior to the TCP Server. When the “Capture data” button is pressed, the TCP Server starts listening for connections. Once the development board is connected, it starts sending data. When it finishes, the software creates a “.txt” file. If the button “Process” is pressed, the Fast Fourier Transform (FFT) values are calculated from time domain, written to another “.txt” file and plotted.
Algorithm 2. Algorithm describing the operation of the visualization and processing software.
1initialize the GUI
2initialize TCP server
3while “close button” is not pressed do
4      if “Clear” button for the time domain plot is pressed then
5            clear time domain plot
6      End
7      if “Clear” button for the frequency domain plot is pressed then
8            clear frequency domain plot
9      End
10      if “Select folder” button for time domain data is pressed then
11            Open dialog box to select folder
12            Set the folder for time domain data files
13      End
14      if “Select folder” button for frequency domain data is pressed then
15            Open dialog box to select folder
16            Set the folder for frequency domain data files
17      End
18      If “Capture data” button is pressed then
19            Do
20                  TCP server is listening
21            while TCP client is not connected
22            capture data
23            save time domain data file to folder
24            plot time domain data
25      End
26      if “Process” button is pressed then
27            process time domain data to get frequency domain data
28            save frequency domain data file to folder
29        plot frequency domain data
30      End
31End

3. Measurement Set-Up and Analysis Procedure

An overview of the experimental set-up, analysis procedure and component details are described in this section. Figure 4 shows the measurement set-up with the standard and the developed vibration measurement systems. The tests were conducted using two accelerometers that were mounted onto the industrial machines. All the vibration signals were simultaneously digitized using the NI-DAQ 9775 module and the FRDM K64F development board, respectively. The measurements were recorded at different speeds and the sampling frequency for all the experiments was 19,349 Hz. To reduce variabilities, each machine was measured five times per 10 s. Table 3 shows component details for the standard and developed measurement systems.
Figure 5 shows the industrial machines that were randomly selected for testing our developed measurement system: honing machine (Model: SP30, up to 5000 rpm), cylinder rectifier (Model: Cormag, range between 39 and 165 mm), surface rectifier (Model: KR14007, 5 HP for head rotation and 1 HP for downloading and uploading), and induction motor (Model: Weg, 2 HP, 1400 rpm).

4. Results and Analysis

This section contains results obtained from the standard and the developed measurement systems. A comparison analysis was performed based on frequency response and phase noise in both systems. Vibration measurements were also recorded in an industrial environment for relative vibration signature comparison.

4.1. Comparison of Specifications between the Developed and Standard System

Two main standard specifications were used to compare both systems: frequency response and phase noise measurements. Regarding the frequency response of the developed system, an estimation was obtained from the frequency response of its analog part by removing accelerometer and signal conditioner. First, a circuit simulation in Proteus software (Labcenter Electronics, Grassington, UK) is performed, as shown in Figure 6. The simulated frequency response can be seen in Figure 7.
To obtain an accurate and relevant frequency response of the real developed system, an oscilloscope and a signal generator were used. The signal generator was configured to generate a sweep signal from 10 Hz to 100 kHz. The obtained circuit frequency response is shown in Figure 8. The true maximum gain was 27.06 dB but it was normalized to 0 dB to perform comparisons with the standard device frequency response values, as shown in Table 4. The commercial device can handle frequencies well above 100 KHz. However, the system developed exhibited a nearly constant gain in frequency up to 10 KHz, which is the band of interest.
Regarding phase noise, a USB-based spectrum analyzer (Signal Hound, Battle Ground, WA, USA) was used to gather this information. This device was connected to the source clock of the ADC, which was the bus clock in our case. Phase noise plot for the developed system is shown in Figure 9 and the phase noise values of the standard system can be seen in Table 5, respectively. Phase noise in the commercial device is considerably lower.
The reasons for having a higher phase noise may be related to crystal quality and temperature. A low-cost development board is not expected to contain the highest quality oscillators. Moreover, oscillators are completely exposed to the environment and, as a consequence, to changes in temperature with an effect on phase noise. The undesired peak close to 10 KHz is most probably related to limited clock management techniques on the development board.

4.2. Vibration Measurements Performed in the Industry

In order to validate our measurement system, we compared the vibration signatures obtained from the measurements performed by our system and the reference system. Measurements were recorded simultaneously using both systems. The results are illustrated in Figure 10, Figure 11, Figure 12 and Figure 13. Figure 10 shows the vibration signatures of an induction motor. Close similarities can be observed; the vibration signature corresponding to the reference system (red) and that corresponding to our measurement system (blue) follow each other well at the fundamental rotation frequency 25 Hz, and harmonics around 50, 75, and 100 Hz.
Figure 11 corresponds to measurements performed on a honing-cylinder machine. Recorded data were analyzed using the fast Fourier transform (FFT) and Welch’s method. The figure shows all important peaks are similar, meaning that the developed vibration measurement system was working adequately. Welch’s method achieves random noise reduction, as evident in the lower part of Figure 11.
Figure 12 corresponds to measurements performed on a cylinder-rectifier machine. Vibration signatures have high similarities up to 500 Hz; thereafter, the peak frequencies are still at the same frequencies but with different amplitudes.
Figure 13 corresponds to measurements performed on a surface-rectifier machine. Vibration signatures have high similarities in the frequency band. Thereafter, the peaks frequencies are still the same but the amplitudes are different.
The results obtained show the potential of the low-cost vibration measurement system, demonstrating high reliability and accuracy for machine diagnosis.
Finally, the cost of the developed system is approximately 10% (including the development board, signal conditioning, and the power supply) of that used as reference (DAQ NI 9775).

5. Discussion

Vibration structures are an inevitable result of any rotating machine. Vibration measurements are a suitable tool for applying Condition-Based Maintenance (CBM) [1,4,5,39]. The main idea of CBM is to collect data continuously in order to use the data to determine when a certain type of maintenance is required. However, equipment to collect data is often expensive. Therefore, we developed a low-cost vibration measurement system for diagnosis purposes. The major challenge was to have a robust, reliable, and accurate measurement system for industrial applications.
Most of the previous studies reported results in laboratory conditions; however, the industrial environment is typically highly contaminated by noise (electromagnetic, sound-borne, and mechanical noise). Developing a proper antialiasing filter to reduce noise properly is challenging, as detailed in Section 2.3.
In future research, the objective will be to implement a real-time monitoring system for machine diagnosis with a compact measurement kit, whereby machine diagnosis can be handled by artificial intelligence (AI) techniques. AI has outperformed conventional approaches for fault detection and machine diagnosis [40,41,42].

6. Conclusions

The main purpose of this paper was accomplished: a low-cost vibration measurement system for industrial applications was developed and implemented. Additionally, we presented new effective guidance to employ SD cards for massive storage and implement TCP/IP capabilities.
Regarding the validation of the system, a comprehensive set of tests were performed using the standard (reference) system and our developed system. First, we compared the frequency response and the phase noise plots for both systems. Then, we compared the vibration signatures obtained from measurements performed by both systems, in different machines. Based on the obtained results, the developed vibration measurement system has shown robustness, reliability, and accuracy.

Author Contributions

conceptualization, A.V., G.Z.; methodology, G.Z.; software, A.V.; validation, A.V.; R.V.; formal analysis, A.V.; investigation, A.V.; G.Z.; resources, G.Z.; data curation, A.V.; writing—original draft preparation, G.Z.; writing—review and editing, A.V.; R.V.; visualization, A.V.; supervision, G.Z.; project administration, G.Z.; funding acquisition, G.Z.

Funding

The authors want to thank the financial support received from UPB for the execution of this research project.

Acknowledgments

We want also to express our gratitude to companies, including J. Antezana SRL, CMR SRL, Infocal, and Campero SRL, which opened their doors so that vibration measurements could be performed on their machines to validate our system.

Conflicts of Interest

The authors declare no conflict of interest.

References

  1. Jardine, A.K.S.; Lin, D.; Banjevic, D. A review on machinery diagnostics and prognostics implementing condition-based maintenance. Mech. Syst. Signal Process. 2006, 20, 1483–1510. [Google Scholar] [CrossRef]
  2. Cibulka, J.; Ebbesen, M.K.; Hovland, G.; Robbersmyr, K.G.; Hansen, M.R. A Review on Approaches for Condition Based Maintenance in Applications with Induction Machines located Offshore. Model. Identif. Control A Nor. Res. Bull. 2012, 33, 69–86. [Google Scholar] [CrossRef]
  3. Tirpude, V.D.; Modak, J.P.; Mehta, G.D. Vibration Based Condition Monitoring of Rolling Mill. Int. J. Sci. Eng. Res. 2011, 2, 10. [Google Scholar]
  4. Prajapati, A.; Bechtel, J.; Ganesan, S. Condition based maintenance: A survey. J. Qual. Maint. Eng. 2012, 18, 384–400. [Google Scholar] [CrossRef]
  5. Carden, E.P.; Fanning, P. Vibration Based Condition Monitoring: A Review. Struct. Health Monit. 2004, 3, 355–377. [Google Scholar] [CrossRef]
  6. Bilski, P.; Winiecki, W. A low-cost real-time virtual spectrum analyzer. IEEE Trans. Instrum. Meas. 2007, 56, 2169–2174. [Google Scholar] [CrossRef]
  7. Swiszcz, G.; Cruden, A.; Booth, C.; Leithead, W. A data acquisition platform for the development of a wind turbine condition monitoring system. In Proceedings of the 2008 International Conference on Condition Monitoring and Diagnosis, Beijing, China, 21–24 April 2007; pp. 1358–1361. [Google Scholar]
  8. Zhang, J.Z.; Chen, J.C. Tool condition monitoring in an end-milling operation based on the vibration signal collected through a microcontroller-based data acquisition system. Int. J. Adv. Manuf. Technol. 2008, 39, 118–128. [Google Scholar] [CrossRef]
  9. Katalin, A. Microcontroller based system for vibration analysis. In Proceedings of the 2008 IEEE International Conference on Automation, Quality and Testing, Robotics, Cluj-Napoca, Romania, 22–25 May 2008; pp. 171–174. [Google Scholar]
  10. Florin, G.; Luminita, P.; Constantin, C. Acquisition System for Monitoring Vibrations. In Novel Algorithms and Techniques In Telecommunications, Automation and Industrial Electronics; Springer: Dordrecht, The Netherlands, 2008; pp. 89–92. [Google Scholar]
  11. Jamil, I.A.; Abedin, M.I.; Sarker, D.K.; Islam, J. Vibration data acquisition and visualization system using MEMS accelerometer. In Proceedings of the 2014 International Conference on Electrical Engineering and Information & Communication Technology, Dhaka, Bangladesh, 10–12 April 2014; pp. 1–6. [Google Scholar]
  12. Adeyeri, M.K.; Mpofu, K.; Kareem, B. Development of hardware system using temperature and vibration maintenance models integration concepts for conventional machines monitoring: A case study. J. Ind. Eng. Int. 2016, 12, 93–109. [Google Scholar] [CrossRef]
  13. Luo, J.; Wu, Z.; Shen, C.; Shen, F. Development of real-time system for vibration detecting system. In Proceedings of the 2010 International Conference on Computer Application and System Modeling (ICCASM 2010), Taiyuan, China, 22–24 October 2010. [Google Scholar]
  14. Merendino, G.; Pieracci, A.; Lanzoni, M.; Ricco, B. An embedded system for real time vibration analysis. In Proceedings of the 2011 4th IEEE International Workshop on Advances in Sensors and Interfaces (IWASI), Savelletri di Fasano, Italy, 28–29 June 2011; pp. 6–11. [Google Scholar]
  15. Zhang, H.F.; Kang, W. Design of the data acquisition system based on STM32. Procedia Comput. Sci. 2013, 17, 222–228. [Google Scholar] [CrossRef]
  16. Huang, G.; Fan, Y. Design and realization of vibration signal acquisition & analysis system based on STM32. In Proceedings of the 2016 Chinese Control and Decision Conference (CCDC), Yinchuan, China, 28–30 May 2016; pp. 2924–2928. [Google Scholar]
  17. Lu, S.; Zhou, P.; Wang, X.; Liu, Y.; Liu, F. Condition monitoring and fault diagnosis of motor bearings using undersampled vibration signals from a wireless sensor network. J. Sound Vib. 2018, 414, 81–96. [Google Scholar] [CrossRef]
  18. Ambrož, M. Raspberry Pi as a low-cost data acquisition system for human powered vehicles. Measurement 2017, 100, 7–18. [Google Scholar] [CrossRef]
  19. Guo, H.; Yu, H.; Sun, C.; Zhang, Z.; Zheng, E. Continuous and real-time vibration data acquisition and analysis system based on S3C6410 and linux. In Proceedings of the 2013 Fifth International Conference on Measuring Technology and Mechatronics Automation, Hong Kong, China, 16–17 January 2013; pp. 389–392. [Google Scholar]
  20. Nguyen, T.; Chan, T.H.T.; Thambiratnam, D.P.; King, L. Development of a cost-effective and flexible vibration DAQ system for long-term continuous structural health monitoring. Mech. Syst. Signal Process. 2015, 64–65, 313–324. [Google Scholar] [CrossRef]
  21. Hester, J.; Prabhu, S.; Atamturktur, S.; Sorber, J. Remote and Wireless Long-term Vibration Monitoring of Historic Monuments. Procedia Eng. 2017, 199, 3302–3307. [Google Scholar] [CrossRef]
  22. Heo, G.; Kim, C. Designing a unified wireless system for vibration control. Soil Dyn. Earthq. Eng. 2012, 38, 72–80. [Google Scholar] [CrossRef]
  23. Herrasti, Z.; Gabilondo, I.; Berganzo, J.; Val, I.; Martínez, F. Wireless Sensor Nodes for acceleration, strain and temperature measurements. Procedia Eng. 2016, 168, 1659–1662. [Google Scholar] [CrossRef]
  24. Devi, S.; Saravanan, M. An innovative modular device and wireless control system enabling thermal and pressure sensors using FPGA on real-time fault diagnostics of steam turbine functional deterioration. Mech. Syst. Signal Process. 2018, 102, 312–328. [Google Scholar] [CrossRef]
  25. Contreras-Medina, L.M.; Romero-Troncoso, R.D.J.; Cabal-Yepez, E.; Rangel-Magdaleno, J.D.J.; Millan-Almaraz, J.R. FPGA-based multiple-channel vibration analyzer for industrial applications in induction motor failure detection. IEEE Trans. Instrum. Meas. 2010, 59, 63–72. [Google Scholar] [CrossRef]
  26. Bengherbia, B.; Zmirli, M.O.; Toubal, A.; Guessoum, A. FPGA-based wireless sensor nodes for vibration monitoring system and fault diagnosis. Measurement 2017, 101, 81–92. [Google Scholar] [CrossRef]
  27. Postel, J. Transmission Control Protocol. Available online: https://doi.org/10.17487/rfc0793 (accessed on 14 January 2019).
  28. Palla, R.; Webster, J.G. Sensors and Signal Conditioning, 2nd ed.; John Wiley & Sons, Inc.: New York, NY, USA, 2001. [Google Scholar]
  29. PCB Piezotronics. Industrial Vibration Sensor Selection Made Easy; PCB Piezotronics: Dipiyu, NY, USA, 2018. [Google Scholar]
  30. Jabłoński, A.; Żegleń, M.; Staszewski, W.; Czop, P.; Barszcz, T. How to Build a Vibration Monitoring System on Your Own? In Advances in Condition Monitoring of Machinery in Non-Stationary Operations; Timofiejczuk, A., Chaari, F., Zimroz, R., Bartelmus, W., Haddar, M., Eds.; Springer: Cham, Switzerland, 2018; Volume 9, pp. 111–121. [Google Scholar]
  31. Dunkels, A. Design and Implementation of the lwIP TCP/IP Stack. Swed. Inst. Comput. Sci. 2001, 2, 77. [Google Scholar]
  32. NXP Semiconductors. Kinetis K64F Sub-Family Data Sheet 120 MHz ARM® Cortex®-M4-Based Microcontroller with FPU; NXP Semiconductors: Eindhoven, The Netherlands, 2016. [Google Scholar]
  33. Freescale Semiconductor. FRDM-K64F Freedom Module User’ s Guide; NXP Semiconductors: Eindhoven, The Netherlands, 2014. [Google Scholar]
  34. Brüel & Kjaer. Measuring Vibration; Brüel & Kjær: Rudersdal, Denmark, 1982. [Google Scholar]
  35. Blomqvist, K.H.; Eskelinen, P.; Sepponen, R.E. Instrumentation amplifier implements second-order active low-pass filter with high gain factor. Meas. Sci. Technol. 2011, 22, 057002. [Google Scholar] [CrossRef]
  36. NXP Semiconductors. FRDM-K64F: Freedom Development Platform for Kinetis® K64, K63, and K24 MCUs. Available online: https://www.nxp.com/products/processors-and-microcontrollers/arm-based-processors-and-mcus/kinetis-cortex-m-mcus/k-seriesperformancem4/k2x-usb/freedom-development-platform-for-kinetis-k64-k63-and-k24-mcus:FRDM-K64F (accessed on 15 May 2018).
  37. Nyquist, H. Certain topics in telegraph transmission theory. Proceed. IEEE 2002, 90, 280–305. [Google Scholar] [CrossRef]
  38. National Instruments. NI 9775; National Instruments: Austin, TX, USA, 2017. [Google Scholar]
  39. Bond, R. Vibration-Based Condition Monitoring; Wiley: Hoboken, NJ, USA, 2011. [Google Scholar]
  40. Liu, R.; Yang, B.; Zio, E.; Chen, X. Artificial intelligence for fault diagnosis of rotating machinery: A review. Mech. Syst. Signal Process. 2018, 108, 33–47. [Google Scholar] [CrossRef]
  41. Widodo, A.; Yang, B.S. Support vector machine in machine condition monitoring and fault diagnosis. Mech. Syst. Signal Process. 2007, 21, 2560–2574. [Google Scholar] [CrossRef]
  42. Khan, S.; Yairi, T. A review on the application of deep learning in system health management. Mech. Syst. Signal Process. 2018, 107, 241–265. [Google Scholar] [CrossRef]
Figure 1. Overall schematic diagram of the developed vibration measurement system.
Machines 07 00012 g001
Figure 2. Effect of the diode clipper and the Direct Current (DC) voltage bias circuits.
Machines 07 00012 g002
Figure 3. Ping pong buffer.
Machines 07 00012 g003
Figure 4. Measurement set-up with the standard and the developed vibration measurement system.
Machines 07 00012 g004
Figure 5. Measurements performed on four types of machines: (a) honing machine, (b) cylinder rectifier, (c) surface rectifier, and (d) induction motor.
Machines 07 00012 g005
Figure 6. Simulation of the analog part (without the accelerometer and the signal conditioner) in Proteus.
Machines 07 00012 g006
Figure 7. Simulated circuit frequency response.
Machines 07 00012 g007
Figure 8. Frequency response of the developed measurement system.
Machines 07 00012 g008
Figure 9. Phase noise plot of the developed measurement system.
Machines 07 00012 g009
Figure 10. Comparison of vibration signatures obtained from the measurements performed on an induction motor at a rotation speed of 25 Hz.
Machines 07 00012 g010
Figure 11. Comparison of vibration signatures obtained from the measurements performed on a honing-cylinder machine. The top plot shows the results obtained by applying the FFT. The bottom plot shows the results obtained by applying Welch’s method.
Machines 07 00012 g011
Figure 12. Comparison of vibration signatures obtained from the measurements performed on a cylinder-rectifier machine. The top plot shows the results obtained by applying the FFT. The bottom plot shows the results obtained by applying Welch’s method.
Machines 07 00012 g012
Figure 13. Comparison of vibration signatures obtained from the measurements performed on a surface-rectifier machine. The top plot shows the results obtained by applying the FFT. The bottom plot shows the results obtained by applying Welch’s method.
Machines 07 00012 g013
Table 1. Characteristics of the microcontroller unit MK64FN1M0VLL12 [32,33].
NameDescription
Processor architectureARM Cortex-M4 (ARM Holdings, Cambridge, UK) with a floating point unit
Maximum clock frequency120 MHz
Operating voltage1.71 to 3.6 V
Analog-digital converter2 High speed 12-bits 1 Mega Samples Per Second modules
Ethernet10/100-Mbps Ethernet MAC. MAC-NET core implementing acceleration functions for TCP and other protocols
Secure Digital High CapacitySupports high capacity microSD cards
Table 2. Parameter configuration for the analog-digital converter (ADC).
ParameterValue
Source clockBus clock
Clock divider8
ADC resolution12 Bit
Long Sample Cycles6
High speed conversionYes
Enable continuous conversionYes
Hardware average count16
Table 3. Components for the standard and the developed measurement system.
Standard Measurement SystemDeveloped Measurement System
DAQ-systemNI-DAQ 9775MicroSD card
FRDM K64F development board
Power supply
Direct current voltage bias circuit
Diode clipper circuit
Antialiasing Filter
PCB 682A02 signal conditioner
AccelerometerPCB-252C04PCB-353B17
Table 4. Comparison of the Frequency Response values of the developed and the commercial device system NI DAQ 9775 [38].
Frequency (Hz)Developed System Gain (dB)Standard System Gain (dB)
100−0.0420
1k−0.3960
10k−2.7080
100k−23.670
Table 5. Comparison of the phase noise values of the development measurement system and the standard system NI DAQ 9775 [38].
Frequency (Hz)Developed System Phase Noise (dBc/Hz)Standard System Phase Noise (dBc/Hz)
100−78.55−109.00
1k−73.59−133.00
10k−54.56−152.00
100k−86.52−160.00
1M−108.50−162.00

