Abstract
Optimizing end mill geometry is critical for improving performance and reducing costs in the high-volume manufacturing of tools, dies and molds. This study demonstrates a successful optimization framework for solid end mills machining 1.2379 cold-work tool steel, integrating Finite Element Analysis (FEA), Artificial Neural Networks (ANN), and Genetic Algorithms (GA). The optimized tool geometry, derived from four key design parameters, delivered substantial performance gains over an industrial reference (parent) tool. Our ANN-GA model achieved a remarkable predictive accuracy (R = 0.75–0.98) over the RSM model (R = 0.17–0.63) and identified an optimal design that reduced the resultant cutting force by approximately 11% (to 142.8 N) and improved surface roughness by 21% (to 0.1637 µm) compared to experimental baselines. Crucially, the new geometry halved the tool breakage rate from 50% to ~25%. Parameter analysis revealed the width of the land as the most influential geometric factor. This work provides a validated, high-performance tool design and a powerful modeling framework for advancing machining efficiency in tool, mold and die manufacturing.
1. Introduction
Modern manufacturing conditions emphasize that global competitiveness depends on high efficiency, cost-effectiveness, and rapid production cycles [1]. Process specialization and improvement approaches are crucial for maintaining market presence by meticulously transforming raw materials into industrial products that meet international standards [2]. In this transformational process, machining is the backbone of the modern manufacturing environment. However, when machining is considered general and specific, the most common approach to creating three-dimensional components would be the milling operations [3]. Because internationally standardized products require precise tolerances and can also have complex features, this further emphasizes the importance of milling operations [4].
The strategic importance of milling extends beyond its technical capabilities, affecting the competitiveness of manufacturing ecosystems [5]. Thus, pressure points will arise where process improvements will spread throughout the base and improve downstream manufacturing processes [6]. Undoubtedly, the most important leverage point is the tool and die-making industry [7], which supports modern mass production and enables a wide range of products worldwide, from simple bottle caps to complex aerospace components. The quality, precision, and service life of tools, dies, and molds determine the economic viability and consistency of the millions of parts they will produce specifically for this industry [7]. Furthermore, any tool or die making inefficiency or defect has serious financial consequences and threatens production schedules [8]. This creates an industrial paradox where nearly perfect mold and die production becomes a significant challenge due to operational issues.
Tool, mold, and die applications require engineering materials designed to withstand harsh operational conditions [9]. Therefore, while milling operations face many operational challenges, material selection is essential and not one of them. In fact, it involves secondary operations such as heat treatment, which ensure both chemical and mechanical properties meet standards to ensure process durability and success, and impart functional properties such as high hardness and wear resistance [10]. This creates a conflict between the materials’ functional durability and machining resistance. Resistance to cutting causes high cutting forces, excessive tool-chip interface temperatures, rapid, often catastrophic tool wear, and deterioration of surface finish [11,12]. Machining engineering materials specifically designed for niche processes is not only a shaping process but also a complex optimization problem that must balance productivity, tool life, and part quality to avoid time and cost losses.
The tool and die industry utilizes 1.2379 (X153CrMoV12, SKD11, or AISI D2) cold-work tool steel, a classic example of such a difficult material. This high-carbon, high-chromium ledeburitic steel has excellent wear resistance and compressive strength, especially when heat-treated to over 60 HRC [13,14]. Thus, it is used to make shear dies, punching dies, drawing dies, forming dies, extrusion dies, plastic injection molds, forming and laminating rolls, complex punches, cutting blades, slitting cutters, bearing housings, rubber and scrap shredders, measuring instruments, machining centers, chucks, broaches, reamers, guides, and more [15]. The microstructure, which contains a high volume fraction of large, extremely hard chromium carbides embedded in a tough martensitic matrix, is the main cause of its poor machinability [13]. Abrasive carbide particles accelerate tool wear during machining, while the steel’s high strength generates extreme cutting forces, high temperatures, and difficult-to-manage segmented chips [16,17]. These factors establish 1.2379 cold-work tool steel as the standard for hard-to-machine alloys.
Tool and die applications require cutting tools to withstand severe mechanical and thermal loads, making configuration critical [18]. Tool configurations often balance roughing economy and finishing precision. Indexable and exchangeable-head cutters are cost-effective and fast for heavy material removal, but their lack of cutting interface rigidity reduces accuracy and fine detail [19,20]. In essence, solid end mills are essential for ensuring the value-added nature of tool, mold, and die manufacturing. However, solid end mills are the only way to guarantee quality, as they provide features such as machining complex contours, maintaining precise tolerances, and ensuring the perfect mold surface for the targeted mold surface [21,22].
A solid end mill’s capability and performance when machining difficult materials depend on a complex synergy between its substrate material, surface coating, and cutting geometry. Solid carbide tools, known for their high hot hardness and rigidity, are the industry standard for machining hardened tool steels like mold making, limiting substrate material choice [23,24]. Another crucial decision is choosing a surface coating. The single- or multilayer coating, necessary for wear resistance and friction reduction, must fit the workpiece, and thickness optimization is limited by cutting edge integrity [25,26,27]. This makes the tool’s geometry design a more fundamental and less constrained variable for performance breakthroughs.
The current academic literature should be examined in relation to the present work. Tool geometry research on end milling 1.2379 cold-work tool steel is limited. Most studies in this area have optimized cutting parameters (speed, feed, depth of cut) or evaluated tool coatings, leaving end mill geometric parameters understudied. While the field of machining optimization has increasingly adopted advanced, data-driven, simulation-based, and artificial intelligence-supported methodologies, research on the end milling of 1.2379 cold-work tool steel is still mostly limited to trial-and-error experiments or basic statistical analyses. Although many recent studies in machining have introduced advanced prediction, classification, and optimization approaches—such as the hybrid 2D FEM–deep neural network framework proposed by Peng et al. [28]; the ANN–MLR modeling combined with multi-objective genetic algorithm optimization by Kar et al. [29]; the hybrid DNN-based models (DNN-IGWO, DNN-GA, and DNN-EKF) integrated with MOGWO by Karmi et al. [30]; the single- and multi-response optimization using a Taguchi-based Entropy–CoCoSo decision-making framework presented by Basar et al. [31]; the forward and reverse ANN mapping approach by Malghan et al. [32]; the LSTM-, CNN-, and DNN-based neural models evaluated by Tsai et al. [33]; the ensemble learning methods (Random Forest, Gradient Boosting, AdaBoost, and Bagging) investigated by Mongan et al. [34]; and the knowledge-based RBF-enhanced neural network optimized via particle swarm optimization introduced by Wang et al. [35]—the present study deliberately employs the fundamental structures of RSM, ANN, and GA. This choice was made to first verify the compatibility, stability, and baseline performance of the current novel investigation against established modeling frameworks before extending future work to more complex hybrid or deep-learning-based methodologies.
Thus, this study investigates how key end mill geometric parameters affect the machinability of hardened 1.2379 cold-work tool to fill these gaps. For statistical analysis, the study uses response surface methodology (RSM), and for predictive modeling, it uses ANNs and GA. Each approach serves a distinct but complementary role within the methodology. RSM provides interpretability and significance analysis, ANN captures the nonlinear relationships that RSM cannot represent, and GA performs global optimization based on the ANN-predicted response surface. Although their mechanisms differ, all three methods ultimately support the same optimization objective by improving the understanding, prediction, and minimization of the machining responses. The study explores and evaluates the correlations between cutting tool geometry and process outputs like cutting forces, surface roughness, and tool wear to test modeling feasibility and prepare for more advanced predictive models.
2. Research Background: Industrial and Academic Perspective
2.1. Industrial Perspective
Manufacturing tools and dies, or cutting tools, require high accuracy, precision, repeatability, and reliability, making it a high-risk industry. However, the return on investment in this sector is high because the quality and performance of these tools determine the success of a high-budget mass-production line. All processes in the tool and die and cutting tool industries must be performed in strictly controlled R&D and manufacturing environments. Each stage of these processes affects the others, so they should not be analyzed separately. The tool and die and cutting tool industries face many engineering and non-engineering challenges, like with all engineering processes. In this complex environment, the first step is to recognize a problem, define it accurately, and then find a solution. Application of this problem-solving hierarchy and general approach to challenges shows significant differences between industry and academia. A thorough examination of both perspectives is needed to understand these differences.
Industrial product development, from bottle caps to high-end aerospace and medical equipment, still begins with trial-and-error. Many of today’s widely used techniques were only included in scientific literature after the underlying assumptions, derived from these trial-and-error processes and proven effective in practice, were scientifically validated and formulated. With improving technology and information access, this body of knowledge, traditionally passed down through master-apprentice relationships, was expected to be preserved and disseminated, but intense global competition has undermined this positive trend. Therefore, knowledge transfer stagnates as companies turn new findings into proprietary “know-how.” Information is either isolated and undeveloped within a company or transferred in a restricted manner only when professionals transfer firms. Consequently, the decline of unshared knowledge slows industrial growth, raises costs, limits scalability, and encourages conservative approaches. The discovery, development, and transfer of knowledge and techniques are primary challenges, but many problems arise from them. These issues are well-known and usually manageable, but their causes must be identified. The main causes are:
- Pragmatic and immediate problem-solving: A tendency to address issues by focusing on urgent production targets or customer demands, typically using reactive methods such as the one-factor-at-a-time (OFAT) approach and trial-and-error.
- R&D deviation: In-house R&D units are assigned to short-term production goals rather than fundamental research to optimize processes and techniques.
- Inadequate Systematic Data Collection: Insufficient data collection during R&D for process optimization and parameter analysis. Lacking a standard format, data often degrades into experiential knowledge that is easily lost or non-transferable.
- Operations without experimental design: Manufacturing by trial-and-error or experience without a formal design of experiments (DoE). This restricts the industry ANOVA and AI-based optimization methods like neural networks and genetic algorithms.
- Insufficient root cause analysis: Not performing a thorough, process-integrated analysis to identify the root causes that have the greatest impact on the system.
If the industry resists AI-driven innovations such as Industry 4.0 and Society 5.0, maintains process conservatism, and keeps information closed, it will continue to fall behind because it cannot address the root causes of its problems. Moreover, the sector also faces external challenges such as negative campaigns from competitors, institutional bias against potentially superior solutions, and end-user environments that fail to match product development conditions. Ultimately, the industry’s problem-solving approach is high-risk and context-dependent, prioritizing technical know-how over scientific frameworks. This reveals a lack of theoretical and practical knowledge in optimization and parameter analysis, highlighting the need for an academic perspective.
2.2. Academic Perspective
According to the industrial perspective, the industry’s problem-solving dynamics are unique. In contrast, academia, especially engineering, focuses on problem identification and resolution, however, using a different strategy, methodology, and resource allocation. Academics have more time and analytical tools to address and solve challenges. However, industrial solutions have always required the unique environment, capabilities, and needs of each industry. The main weaknesses are a lack of in-depth insight into specific industrial processes, professional experience, and access to industrial application sites. However, when informed and offered collaboration opportunities (e.g., consulting services or joint projects), academia can help identify root causes and identify solutions. Through this avenue, academia will utilize its capacity and resources to apply and analyze modern and advanced experimental designs, optimization methods, and more. The industry-academia divide and conflicts are the biggest obstacles to this collaboration. The main reasons for this mismatch and its potential impact are as follows:
- Abstaining from revealing proprietary “know-how” will hinder collaboration. While the reaction is understandable and natural, it has led to reluctance from industry partners even in a collaborative environment where no direct publication-based research is mentioned.
- Industry professionals may interpret academic approaches as time-consuming, costly, and counter-intuitive, in contrast to their own pragmatic approaches. This bias hinders a coherent and broader-perspective evaluation, thus perpetuating the industry problem.
- Industry-based employees such as engineers, specialists, and operators for operational activities are often far removed from developing AI-based approaches in academic fields. Furthermore, because academic qualifications and knowledge and skill levels vary depending on the employee, leveraging technological advancements will be difficult and create a competitive disadvantage.
- Contrary to interpretations that assume collaboration never occurs, the outcome of collaboration is not very encouraging. This is because the projects, activities, and other activities that academia will collaborate on with industry will be focused on a single process or a portion of a process. This will exclude the uncontrollable parts of closely interconnected processes from the work. As a result, the collaborative part may succeed, strengthening only one link in a chain. Failure, however, results in academia’s efforts being seen as completely unnecessary and its biases being proven correct, and industry shutting itself off from academia, never to return.
These gaps are typically addressed through limited, one-off academic interventions such as mentoring, consortium projects, or sharing digital process models, but such collaborations rarely extend beyond short-term partnerships. To support this point, it is necessary to examine domain-specific studies, their scope, and experimental conditions, and to compare them with existing literature while seeking expert validation to assess their reliability and generalizability. By identifying which findings align with or contradict established knowledge, the reasons for inconsistencies can be explored and, if valid, used to generate new insights. This study will begin with a comprehensive literature review, comparing existing works and discussing their differences, consistencies, reproducibility, and broader relevance. Ultimately, the goal is to highlight the current value of academia and reinforce its role as a dependable source for future research.
2.3. Literature Review
For this study, the literature review was filtered by two criteria: research on end milling 1.2379 cold work tool steel, and studies specifically using solid end mills, which were prioritized for parametric comparison. Other tool-based studies were used only to support or contrast findings. Table 1 lists all solid end milling references, and Table 2 summarizes the parameters kept constant or optimized. The review reveals limited and shallow research in this domain, with broad parameter ranges and inconsistent outputs that reduce generalizability and reliability. Recommended parameter sets vary widely between studies, reflecting a lack of consistency. Therefore, the existing literature cannot be considered representative, indicating a clear need for more rigorous, repeatable, and generalizable research.

Table 1.
Overview of studies on the machining of 1.2379 cold-work tool steel with solid end mills and associated cutting parameters.
Table 2.
Recommended parameter sets and optimization approaches reported in the literature for achieving the best machining performance.
Regarding the second of the study’s two main themes—the geometric parameters of end mills—extensive research has been conducted in the literature. These studies encompass nearly all an end mill’s geometric features, such as the number of flutes, tool diameter, helix angle, rake angle, clearance (relief) angle, and corner/nose radius. While some of these studies concentrate on designing tools for machining various materials, a significant portion has focused on the modeling and optimization of the end mill itself, rather than a specific material or operation. These investigations have explored the interrelationships between geometric parameters or the interaction of cutting mechanics with tool engagement through formulations, finite element analysis (FEA), and other computational methods [51,52,53,54,55,56,57,58,59,60,61,62,63,64,65,66,67,68,69,70,71]. However, only a very limited number of studies have specifically investigated the machining of 1.2379 cold-work tool steel, the focus of the present work [39,72,73,74,75,76,77,78], and the information pertaining to these studies is presented in Table 3.
Table 3.
Overview of studies focusing on the geometrical design parameters of solid end mills.
Given that each workpiece material requires a different geometry tailored to the specific operation, new research focusing on particular material-tool combinations continues to offer significant novelty. Accordingly, this study aims to develop the shallow scope of research on machining 1.2379 steel with end mills and to close this identified gap. To achieve this objective, a detailed and comprehensive study will be presented in which both cutting parameters and tool geometry are adapted to be suitable for the process.
3. Materials and Methods
3.1. Workpiece Material
The experiments were performed on a test billet made of 1.2379 cold-work tool steel supplied by Eskişehir-Turkey headquartered AS ÇELİK A.Ş. (also designated as X153CrMoV12, SKD11, or AISI D2), with dimensions of 250 mm × 250 mm × 40 mm. Prior to machining, the billet surface was milled to remove irregularities and ensure dimensional accuracy. Heat-treating by vacuum hardening produced 58–62 HRC. Following preheating and austenitizing at 816 and 1000 °C in a vacuum furnace, the steel is allowed to cool with nitrogen, hydrogen, argon, or oil under high pressure. Deep cooling and tempering remove austenite and reduce stress. Hardness, toughness, and wear resistance are improved by this martensitic microstructure with finely dispersed chromium and vanadium carbides. Table 4 shows the material’s chemical composition, based on manufacturer data and international standards, and Table 5 shows its mechanical properties.
Table 4.
Chemical composition of 1.2379 cold-work tool steel and its comparison with international standards [79].
Table 5.
Mechanical properties of 1.2379 cold work tool steel [36].
3.2. End Mill Tool
The parent end mill used for experimental machining tests of 1.2379 cold-work tool steel was selected from Karcan Cutting Tools Industry and Trade Inc.’s (Eskişehir, Turkey) advanced options. The chosen Ultra-Bite tool is the “114 Short Series Corner Radius Endmill”. End mill corner radii improve tool life and process stability. A square end mill’s sharp 90° corner concentrates stress, making it vulnerable to chipping, especially when machining hard materials. A corner radius eliminates the fragile sharp corner by distributing cutting forces over a larger contact area along the cutting edge. This modification greatly reduces chipping and improves durability and cutting performance. Sintersud MK12 (WC/Co) cemented carbide rods, ISO K10–K20, were used to make the tools.
The shank conforms to DIN 6536 Form HA (plain), and the cutting edges are coated with an AlCrN physical vapor deposition (PVD) layer with a thickness of 2.5 µm. Both the cutting tool grinding process and the coating application were carried out in-house by Karcan Cutting Tools Industry and Trade Inc. The technical drawing and parametric characteristics of the tool are presented comprehensively in Figure 1, while Figure 2 provides a detailed illustration of the geometrical features and terminology used in end mill design.
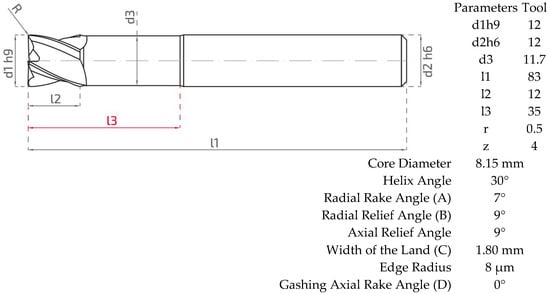
Figure 1.
Geometry and main design parameters of the parent end mill tool (per ISO 286-2) [80].
In this study, four critical geometric parameters of the solid end mill—radial rake angle, radial relief angle, width of the land, and gashing axial rake angle—were systematically varied to investigate their effects on the machining performance of 1.2379 cold-work tool steel during finish milling operations as shown in Table 6. Since the process involves pocket milling, where both the surface quality and dimensional accuracy are crucial, these parameters were selected for their strong influence on cutting mechanics, tool–workpiece interaction, and chip evacuation efficiency. These research parameters were determined through consultations with industry experts and academic colleagues, as the literature is limited. The focus was on parameters that would directly impact cutting performance for the designed operation and require optimization, while excluding those considered to have a negligible impact. These parameters, defined and their effects discussed below, aim to optimize the machining of 1.2379 cold work tool steel with end milling within controlled limits based on parent tool values, in terms of improved surface quality, reduced wear and improved cutting force.
| Radial Rake Angle: | It is defined as the angle formed by a radial line passing through the cutting edge and the rake surface (the chip flow surface). This is measured in a plane perpendicular to the cutter’s axis [81]. Its primary function is to manage the chip formation mechanics by determining the orientation of the cutting plane and to achieve a balance between cutting efficiency and edge strength by adjusting the sharpness of the cutting edge [82,83,84]. |
| Radial Relief Angle: | This clearance angle, also known as the clearance angle, is the side surface immediately behind the cutting edge and represents the angle between the newly machined surface and the workpiece. This angle provides clearance (space) to prevent the tool flank from rubbing against the workpiece as it advances [85]. |
| Width of the Land: | It can be defined as a narrow surface located immediately behind the cutting edge, which can be called a controlled blunting, to increase the toughness of the cutting edge. It is a fundamental element of edge preparation during tool manufacturing. It theoretically strengthens the cutting edge at the intersection of two planes, thus increasing the tool’s resistance to damage and achieving a perfect geometry [86]. |
| Gashing Axial Rake Angle: | The gashing axial rake angle is the specific axial rake angle measured on the gash face of the flute, not on the primary cutting edge (the “land”). It is a key parameter that governs how efficiently the chip is formed and directed axially out of the cut. Gashing rake (behind the land) surface continues the chip’s path. Its axial rake angle can be the same as the primary rake, or it can be different. Figure 3 illustrates an example of the geometry change corresponding to a variation in the parameter value. |
Table 6.
Experimental test values of the geometric parameters selected for optimization.
To isolate the effects of geometric parameters, the cutting parameters were first optimized through a two-stage preliminary testing phase using the parent tool. In the first stage, cutting conditions were selected based on literature data and tool manufacturer recommendations, with cutting speeds ranging from 60 to 120 m/min, feed per tooth between 0.09 and 0.15 mm/tooth, and axial and radial depths of cut between 0.2 and 0.6 mm. It can be said that the reason for testing these parameter values is to determine whether the positive results presented by testing the values in the literature are achieved, and while performing these, to improve production quality (reducing tool wear and improving surface roughness), efficiency and actually speed up production. These initial trials resulted in excessive thermal loading, tool failure, and high bending moments, indicating that such high-speed machining conditions were unsuitable for 1.2379 steel under the given process constraints. Consequently, a second testing phase was designed based on expert recommendations from the collaborating company and feedback from the initial experiments. This phase employed lower cutting speeds of 45–60 m/min, feed per tooth values of 0.05–0.10 mm/tooth, and reduced axial and radial depths of cut of 0.1–0.2 mm. Additionally, a tool with a 1 mm corner radius was adopted, which significantly decreased tool wear, improved surface quality, and reduced cutting forces. Based on these results, the final stable cutting parameters selected for the main experiments were cutting speed of 50 m/min, feed per tooth of 0.1 mm/tooth, axial depth of cut of 0.2 mm, and radial depth of cut of 0.1 mm.

Figure 2.
End mill terminology and geometrical design parameters according to ISO 13399 [87].
Figure 2.
End mill terminology and geometrical design parameters according to ISO 13399 [87].


Figure 3.
Illustration of geometric variations with different gashing axial rake angles (orange area).
Figure 3.
Illustration of geometric variations with different gashing axial rake angles (orange area).

3.3. Experimental Environment
All experiments and measurements in this study were carried out using advanced equipment and software resources available at the facilities of Karcan Cutting Tools Industry and Trade Inc. The experimental tests were precisely conducted on a Mikron VCP800 three-axis CNC (Computer Numerical Control) milling machine (Figure 4A). Cutting forces, torsional moments, and bending moments along the three axes were recorded using the Spike Mobile 1.2 wireless data acquisition sensor (Figure 4C). For tool holding, a BIG DAISHOWA HSK-A63-MEGA20N-105 mega new baby chuck and nut set was used in conjunction with the data acquisition system. The clamped state of the workpiece billet in the vise is shown in Figure 4D. Measurement of tool wear using an optical microscope and the evaluation of surface roughness using a Mahr MarSurf PS10 are illustrated in Figure 4F,G, respectively. A Zeiss Gemini 300 instrument, equipped with a Schottky Field Emission Gun (FEG) for Scanning Electron Microscopy (SEM) analysis was used for the detailed investigation of wear mechanisms on the cutting tools and the analysis of coating degradation and shown in Figure 4H. A Bruker XFlash 6|100 detector was employed for Energy-Dispersive X-ray Spectroscopy (EDS) analysis on the same instrument provided by Bursa-Turkey headquartered MERLAB (Bursa Technical University Central Research Laboratory). The experiments were performed under dry cutting conditions using the down milling technique, strictly following the relevant standards and guidelines specified for the tests. Among various end milling operations, pocket milling was selected for conform to actual industrial manufacturing conditions and environment (Figure 4E). Because pocket milling is certainly one of the most basic and frequently used milling operations in industrial tool and die&mold manufacturing. The pocket dimensions were defined as 50 mm (L) × 40 mm (W) × 0.40 mm (H). The average clamping length of the tool in the tool holder (total tool length: 83 mm) was 45.95 mm, measured just above the neck, with a tolerance of ±0.2882 mm. The neck length, measured from the cutting edge, was 45.8 mm. The average tool runout during testing was measured as 0.00975 mm, with a tolerance of ±0.003 mm (Figure 4B). Each test was conducted in two repetitions, with a maximum error margin of ±3.45%. The cutting parameters used in the tests were converted into experimental design using the response surface methodology (RSM), analysis of variance (ANOVA), artificial neural network (ANN) and genetic algorithm (GA) approaches, which also enabled a reduction in the total number of experiments. Further details regarding the cutting parameters and optimization methods are provided in the following sections.
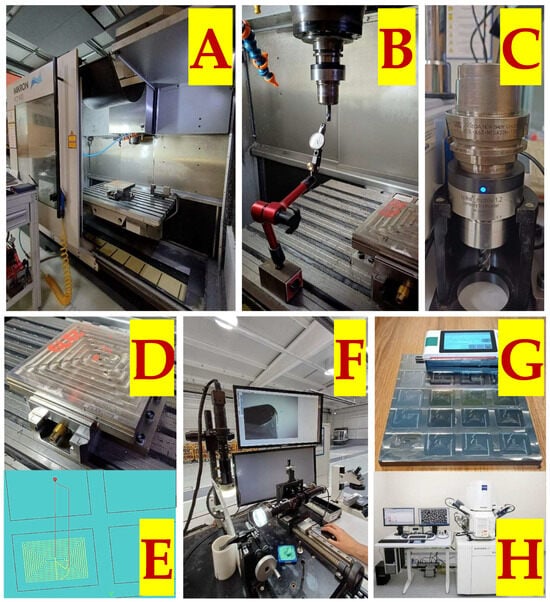
Figure 4.
Experimental environment and analysis equipment used in the tests; (A) Mikron VCP800 three-axis CNC (Computer Numerical Control) milling machine; (B) Tool runout measurement; (C) Spike Mobile 1.2 wireless data acquisition sensor; (D) Workpiece billet; (E) Programming the pocket milling operation; (F) Measurement of tool wear using an optical microscope; (G) Surface roughness measurement using a Mahr MarSurf PS10; and (H) Schottky Field Emission Gun (FEG) for Scanning Electron Microscopy (SEM) with a Bruker XFlash 6|100 detector for Energy-Dispersive X-ray Spectroscopy (EDS) analysis.
3.4. Design of Experiment: The Response Surface Methodology
RSM uses mathematical and statistical methods to model and analyze processes where multiple variables affect a response of interest [88]. George E. P. Box and K. B. Wilson introduced it in 1951 to use a series of designed experiments to find the best variable settings for the best response [89]. RSM helps understand the response shape across the experimental region, especially when the variable-response relationship is nonlinear. A Box–Behnken Design (BBD) is a specific type of experimental design used for response surface methodology [90]. Devised by George E. P. Box and Donald Behnken in 1960, it is created to efficiently fit a second-order (quadratic) model, which includes squared terms to account for curvature. Each factor is tested at three equally spaced levels, typically coded as −1 (low), 0 (center), and +1 (high). The design is constructed by combining two-level factorial designs with incomplete block designs. The experimental runs are located at the midpoints of the edges of the experimental space, plus additional points at the center. A defining feature is that BBDs do not include experimental runs where all factors are simultaneously at their extreme (highest or lowest) levels. To accurately model a peak or valley, the mathematical model must include second-order, or quadratic, terms (e.g., terms like ). The full second-order model for a response y is generally expressed as in Equation (1) [91]:
where is the intercept, are the linear coefficients, are the quadratic coefficients that capture curvature, are the interaction coefficients, and is the random error. To estimate the quadratic coefficients (), each continuous factor must be studied at a minimum of three levels. RSM designs, including the Box–Behnken design, are specifically structured to provide data at three or more levels, enabling the efficient estimation of this complete second-order model. Therefore, the choice to employ RSM is an implicit acknowledgment that a non-linear relationship is anticipated and that the experimental goal has evolved from simple factor screening to precise process optimization.
The most significant advantage is that the design avoids combinations where all factors are at their highest or lowest levels at the same time. This is very useful when such extreme conditions could be unsafe, damaging to equipment, or known to produce undesirable results. This makes the BBD feel “safer” for certain processes. BBDs are highly efficient and generally require fewer experimental runs than other response surface designs, such as Central Composite Designs (CCDs), for the same number of factors. This makes them a more economical choice, saving time and resources. For example, a 4-factor BBD requires 27 runs, while a comparable CCD requires 31. The design is specifically created to efficiently estimate the coefficients of a full second-order model, allowing for the effective analysis of main effects, interaction effects, and quadratic effects (curvature). Details of the Box–Behnken design (BBD) structure used in this study are summarized in Table 7.
Table 7.
Structural Breakdown of the Default 4-Factor, 27-Run Box–Behnken Design in Minitab.
The factor levels in the experimental design (Table 8) were centered on the parent tool’s geometry and extended toward their practical limits to ensure a comprehensive assessment. A Box–Behnken design with 27 experimental runs was generated using Minitab 22 for these four continuous factors, providing a statistically efficient framework for the subsequent optimization.
Table 8.
Randomized design table designed with RSM.
3.5. Artificial Neural Network (ANN) and Genetic Algorithm (GA)
The optimal Artificial Neural Network (ANN) configuration was identified through extensive iterative tuning, examining architecture, training algorithms, and overfitting controls. Rather than relying on a single untuned model, a full optimization phase ensures performance and consistency, with key parameters listed in Table 9. This pre-tuned approach automatically generated regression and performance plots, error histograms, training-state data, architecture diagrams, parameter-importance rankings, design-space predictions, and genetic algorithm results—introducing several innovations beyond conventional ANN methods. All ANN and GA-related modeling, analysis, and visualization were conducted in MATLAB R2025a.
Table 9.
ANN and GA optimization settings.
3.6. Finite Element Modeling
The test conditions and parameters for conducting finite element analysis were configured in AdvantEdge Cutting Simulation Software v.10.0.1 (Third Wave Systems) to match real-world tests. The software was run on a computer with a 6-core (12-thread) 3.3 GHz processor (Max. Boost Clock up to 4.55 GHz) and 16 GB of 4800 MHz RAM. Create a “Corner Cut” sequence with an “End Mill” toolpath in “Down Mill (Climb)” mode to create a 3D milling project. Geometry, dimensions, mechanical, and chemical properties of the material billet were configured to match the supplied material, with geometry minimized to optimize computational time while maintaining representativeness. The material’s ultimate tensile strength and hardness values are 1641 MPa and 62 HRC, respectively, in accordance with the standards set in the software. The cemented carbide Grade-K coating was configured using the same values as the cutting tool, using a density of 2500 kg/m3 at 2.5 µm, a Young’s modulus of 3 × 10¹¹ Pa, a Poisson ratio of 0.2, a thermal conductivity of 200 W/m/°C, and a heat capacity of 700 J/kg/°C. All cutting parameters and the cutting tool’s geometry, dimensions, material, and coating were identical to its physical counterpart. For finite element analysis, the initial conditions were 20 °C workpiece temperature and 0.35 tool-workpiece coefficient of friction. The force analysis reference point was the onset of mean cutting forces after one full tool revolution. Each test run had unique tool geometric design parameters, as shown in Table 10, to meet the primary research objective. Next, manually recommended values and coefficients from the AdvantEdge documentation were used to start the meshing phase, using adaptive meshing and other geometry-specific settings. Figure 5 shows the tool and workpiece features, boundary conditions, and meshing.
Table 10.
Meshing parameters and values for finite element analysis.
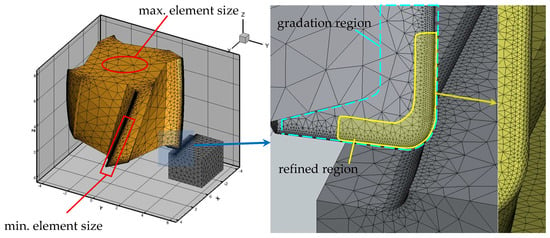
Figure 5.
Features, boundary conditions, and meshing.
4. Results
This study examines the way end mill geometric design parameters in Table 6 affect 1.2379 (AISI D2) cold work tool steel machining performance. The performance was assessed by cutting force, tool wear, and surface roughness. Response Surface Methodology (RSM) and an Artificial Neural Network modeled these output parameters. A Genetic Algorithm (GA) was used to optimize the models, and the results are compared.
4.1. Resultant Cutting Force
As defined by the response surface methodology (RSM) design of experiments (DOE) in Table 8, Figure 6 shows the cutting forces measured when machining 1.2379 steel with end mills of different geometric parameters. The geometric parameters are A (radial rake angle), B (radial relief angle), C (land width), and D. The initial RSM model, including linear, interaction, and quadratic terms, fit experimental data well with a high coefficient of determination (R2 = 87.64%). The other main linear effects (A, C, D) were not statistically significant (p > 0.05) in an ANOVA except for factor B. This implies that complex curvature and interaction effects strongly influence the system’s behavior rather than simple linear relationships. The predictive power of the weak model, due to the presence of meaningless (non-significant) high-level terms, has been strengthened by backward elimination of these terms while preserving the model hierarchy. As a result, the R2 value representing the explanatory power of the model decreased by more than 10%, while the R2-pred value representing the predictive power increased by nearly 10%. The high difference between these values and the fact that the values did not change significantly despite the removal of some terms indicates overfitting. This is because it has been found that the resulting model limits the ability to predict new data by capturing noise and trends in the data set.
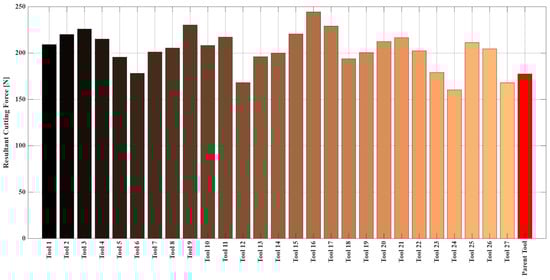
Figure 6.
Measured resultant cutting force values for each cutting tool.
The decision was made to retain the full, unreduced, pure RSM model, and the factor relationships were visualized, and the ANOVA was conducted as shown in Figure 7. The obtained model will not be reliable for predicting data outside the existing data set. However, since the model can recognize the data well, it will be able to determine the complex effect of the geometry parameters and their interaction with each other. To overcome this limitation and achieve superior prediction capabilities, a new approach has been developed by combining genetic algorithms (GA) with ANN. Following the failure of RSM to capture the complex and nonlinear relationship between the end milling process, geometric parameters, and results, an ANN model was developed and tested. This modeling approach was chosen because it is better at capturing complex relationships due to its data-driven nature. The optimized ANN, which demonstrated exceptional data recognition and prediction performance with high correlation coefficients for training (R = 0.96), validation (R = 0.99), and testing (R = 0.95), resulted in a cumulative R2 value of 0.96227. The lack of significant differences in correlation values during the training, validation, and testing phases indicates that high-performance modeling avoids overfitting. The architecture of this successful network, regression graphs, and error values are shown in Figure 8. Five sensitivity analyses were performed to interpret the “black box” model and identify the most important geometric parameters. Table 11 shows the parameter impact scores and rankings, revealing the factors that dominate cutting force behavior. Because RSM performed poorly on new datasets, the ANN-GA model provides more reliable cutting-force optimization parameters. Sensitivity analysis showed that cutting force is most influenced by land width (C), followed by radial rake angle (A) and radial relief angle (B), while the gashing axial rake angle (D) has minimal effect. Figure 9 and Table 12 compare both models with actual test data. Although RSM generally follows ANN trends, its polynomial fit fluctuates more and often over- or underestimates extreme values, indicating overfitting and weaker predictive capability for this highly non-linear process.
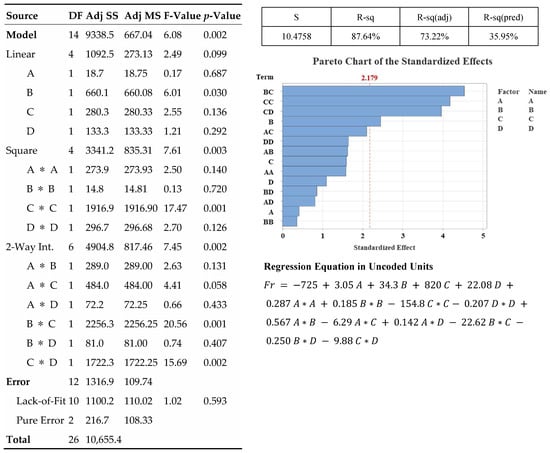
Figure 7.
Summary of response surface methodology results of resultant cutting force.
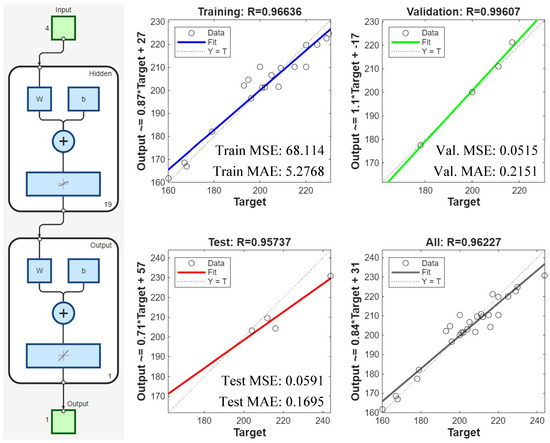
Figure 8.
ANN architecture (left) and ANN regression plots showing predicted resultant cutting forces (Fr) for training, testing, validation, and overall error (right).
Table 11.
Comprehensive analysis of geometric parameter effects on resultant cutting force.
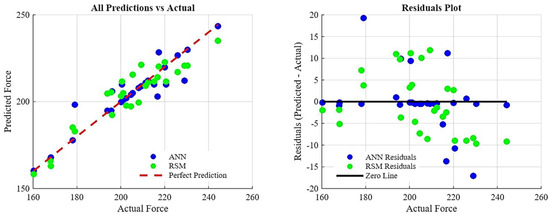
Figure 9.
Actual and predicted values (left) and residuals plot (right) by ANN and RSM.
Table 12.
Comparison of actual results with optimization outcomes from RSM and ANN–GA models for resultant cutting force.
Table 12 compares resultant cutting forces from different geometric configurations. The experimental test plan’s geometric parameters reduced cutting force by 9.67% compared to the commercial “Parent Tool,” an immediate improvement. More importantly, RSM, ANN, and ANN-GA optimization methods proposed parameters that reduced force by 27.51% to 19.55%. Systematic optimization outperforms iterative experimental testing. In Figure 10, 3D plots show how parameter values affect cutting force. According to metal cutting theory, the radial rake angle (A) and friction angle (β) determine the shear plane angle (ϕ). A higher rake angle (γ) usually leads to a higher shear angle. The lower cutting force target will only be achieved on a smaller cutting plane, and this will be referred to as efficient cutting, where finer chips are cut with less energy [81,82,83,84]. In some cases, a negative rake angle might be necessary; however, unlike the negative case, this will cause thicker chips on a larger cutting plane, leading to increased forces. This will also represent the material being compressed to a significant degree before the cutting tool is damaged, using the mechanics of plowing rather than cutting the material [81].
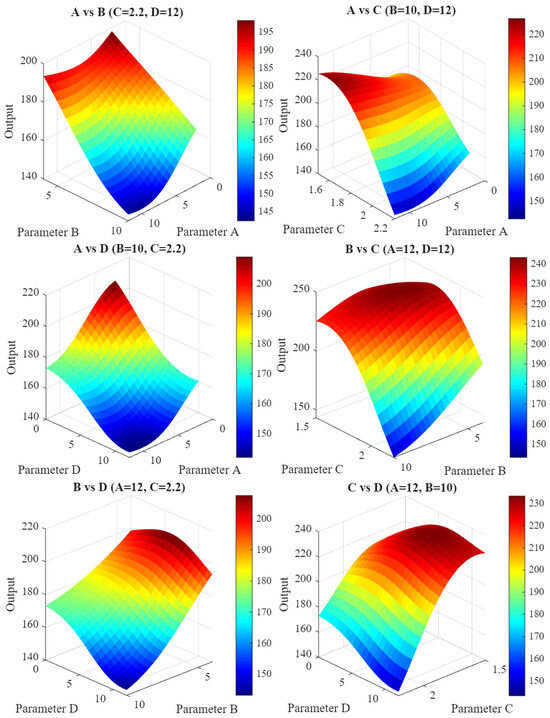
Figure 10.
3D surface plots illustrating the effects of parameters on resultant cutting force.
Cutting force, power consumption, and material deformation are minimized through a positive rake angle design, improving surface quality. The critical issue here, and indeed the disadvantage, is the weakening of the cutting edge [92]. The positive and increasing angle design creates the volume of the cutting edge, reducing the amount of material supporting the edge. This will cause the edge to become prone to chipping, cracking, and breaking during harsh operations where high stress is generated. Conversely, a negative rake geometry will strengthen the edge [93]. Increasing the amount of material supporting the cutting-edge volume, coupled with increasing the mass of the cutting edge, improves resistance to shock loads and mechanical stress, providing the ideal geometry for harsh operations. The primary objective of this study is not only to process difficult materials but also to ensure good surface quality; therefore, the high cutting forces, power requirements, and heat generation that increase surface roughness and quality associated with a negative chip angle limit its applicability [94].
Consequently, a more positive and therefore sharper chip geometry will reduce cutting forces and minimize surface quality [95,96], but at the same time, as the tool weakens, it will reduce resistance to the mechanical load and stress generated by cutting, paving the way for the tool to lose its functionality [82,97]. The commercially used “parent tool” reflects this balance between geometry parameters. However, new designs should also explore whether more balanced conditions exist. In evaluating the results of the study, the RSM, ANN, and ANN-GA optimization approaches suggest that higher rake angles are appropriate to reduce forces and improve surface quality by sacrificing team strength. This finding, which has technical and scientific support, can play a significant role in achieving optimal results if the tool’s structural integrity is maintained.
The radial relief angle (B) provides clearance to prevent the tool flank from rubbing against the workpiece surface during machining [98,99,100]. Even though the commercially used “parent tool” forms a slightly more conservative 9-degree angle, experts from the collaborating cutting tool company and academic colleagues set a maximum allowable value of 10 degrees for this parameter due to manufacturability and tool structural integrity constraints. Both the RSM and ANN-GA optimization results converged on this maximum limiting value of 10 degrees, confirming its effectiveness in reducing cutting forces. A larger relief angle reduces friction, heat, and work hardening or built-up edge formation by reducing the tool flank-workpiece contact area [101]. The cross-sectional area supporting the cutting edge must be reduced by removing more material from behind it. Sharper but more fragile geometry contributes to it being more prone to chipping and fracture under high mechanical loads [98]. Using a smaller relief angle improves mechanical strength but greatly increases thermal load, as reduced clearance raises friction and heat generation. Thus, measures that enhance durability can worsen thermal issues, making careful balance essential in tool design. High-temperature-resistant coatings like AlCrN or AlTiN, along with high-pressure air for chip removal and cooling, are needed to protect the carbide substrate without causing coolant-induced thermal shock. Overall, studying this angle is important because it directly supports effective thermal management strategies.
The parameter ranking revealed that the land width (C) geometry parameter is the most important factor affecting the cutting force. Experiments also showed that two of the three test runs with the lowest values were at the upper limit of the experimentally tested ranges (2.2 mm). Consistent with this, the RSM, ANN, and ANN-GA approaches also provide evidence that repeatedly implementing the upper bound value in the design will play a role in achieving optimal values. The situation can be technically explained by examining the role of the geometry parameter. In tool manufacturing, the shaping of this region is emphasized as a kind of intentional dulling (blunting) process, aimed at increasing the tool’s toughness and resistance to chipping, cracking, and fracture. The goal of achieving a wider cutting edge as a result of this process will increase the volume of material supporting the cutting edge and naturally make the tool more mechanically resilient and durable [86]. However, this will cause the interaction interface of the cutting tool to deteriorate during cutting, leading to an increase in factors such as cutting forces, chatter vibrations, and flank wear that represent performance [102]. The design goal is to find a cutting-edge width that is narrow enough to avoid excessive cutting pressure, yet wide enough not to reduce machining efficiency or compromise the structural integrity of the cutting tool. The conclusion that can be drawn from the above and the optimization results is that this geometric parameter is an important design variable and trade-off [103].
Although the gashing axial rake angle (D) had the smallest effect on cutting force, it was chosen for evaluation because it is critical in plunging and pocketing. In center-cutting end mills, this angle controls chip formation and evacuation during axial cuts, where chip removal is most difficult. A positive gashing axial rake angle guides chips away from the tool center, preventing recutting, tool damage, and poor surface quality. Thus, effective chip flow driven by this angle plays an important role in overall machinability. The parameter was present in the top-performing experimental tests, but the radial geometry parameters had a greater impact. More positive angles promote an efficient “scooping” action rather than a resistive “plowing” action during plunging, which reduces power consumption and cutting forces, minimizes tool deflection, and improves milled slot surface finish. A more positive gashing axial rake angle removes material from behind the cutting edge, making the geometry thinner, sharper, and more fragile. This makes end-cutting edges prone to chipping, micro-fractures, and catastrophic failure, especially during interrupted cuts or when machining hard materials, and can cause harmonic vibrations in less rigid setups. In conclusion, increasing the gashing axial rake angle improves chip evacuation and reduces axial cutting forces but weakens the tool’s end-cutting edges.
4.2. Tool Wear
Figure 11 shows optical microscope images of all experimental tools, including the benchmark “parent tool,” to examine geometric design parameter-induced tool wear. Several SEM and energy-dispersive X-ray spectroscopy tools were chosen for a more in-depth analysis. This subset included two tools with catastrophic fracture failure or macro-chipping and two with uniform flank wear to compare failure mechanisms. The parent tool underwent SEM imaging and EDS analyses for baseline reference. Damaged tools showed fracture wear or macro-chipping as the main wear mechanism. Some of the successful tools had uniform flank wear and micro-chipping along the cutting edge. The high hardness and abrasiveness of 1.2379 cold work tool steel places severe mechanical and thermal loads on the cutting-edge during end milling, causing these wear mechanisms. Crack initiation and propagation at the tool–workpiece interface due to high compressive stresses and intermittent contact can cause macro-chipping or catastrophic fracture, especially in sharp or poorly supported tools. The dominant mechanism in tools with structural integrity was uniform flank wear caused by gradual abrasion from hard carbide particles in the work material. Localized micro-chipping in tools might be caused by cyclic thermal and mechanical stresses near the cutting edge. Figure 12 shows the SEM micrographs and EDS spectra. Cutting tool EDS analyses focused on non-damaged [green] and severely damaged [red] areas. Table 13 shows semi-quantitative elemental compositions from these analyses. This analytical procedure aimed to identify and confirm the tool’s coating and substrate’s elemental composition and to observe and quantify elemental changes caused by different tool wear mechanisms. The EDS spectra and elemental analysis were expected to occur in the non-damaged and damaged regions, resulting from the tool coating being worn/chipped/cracked, leading to a decrease in the proportions of aluminum and nitrogen elements. Since chromium is already present in the chemical composition of the material, the expectation was for its proportions to change rather than decrease or increase. Indeed, the results confirmed this. It was clearly observed that the coating on the non-damaged regions was no longer present in the damaged regions, leaving the tool unprotected.
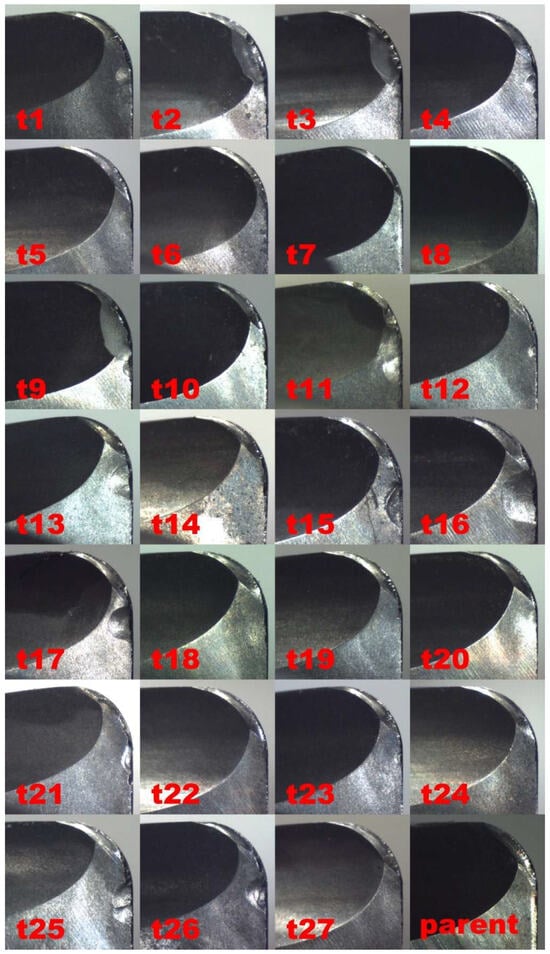
Figure 11.
Tool wear under microscope for coded tools with different geometries.
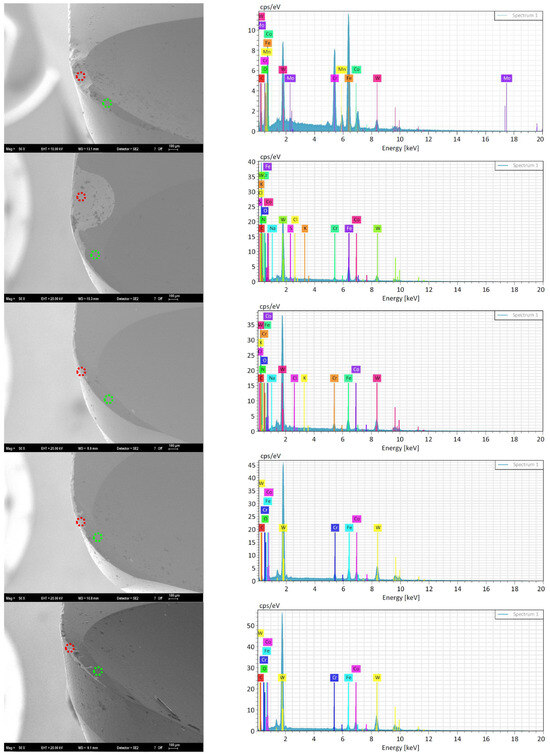
Figure 12.
SEM and EDS images of cutting tools with damaged (red circles) and non-damaged (green circles) areas.
Table 13.
Comparison of EDS analysis results for non/less damaged and damaged areas of the tools.
Frequent catastrophic fractures in the initial RSM-ANN-GA comparison made quantitative flank-wear measurements impossible, requiring a switch to binary fracture analysis. Because RSM cannot handle binary outputs, the evaluation was performed using the ANN-GA framework and other classification methods. As shown in Figure 13, four classifiers were tested: ANN achieved the highest accuracy (75%), followed by decision tree (62.5%), SVM (50%), and logistic regression (32.5%). ANN’s parameter importance ranked C > B > A > D, with parameter A showing a negative score due to complex non-linear effects. The fracture-rate visualization in Figure 13 offers the key insight by showing the percentage of fractured tools for each parameter level, based on post-process microscopic inspection, linking geometry directly to catastrophic failure risk.
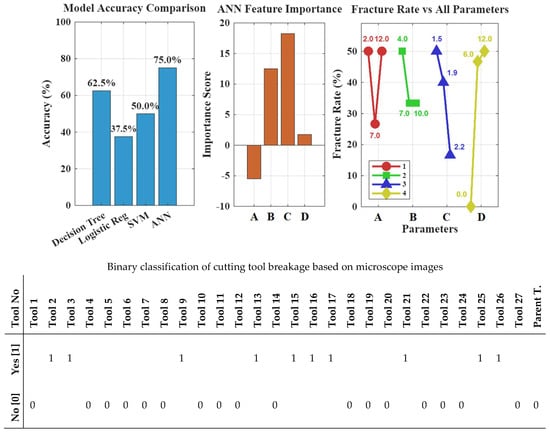
Figure 13.
Accuracy comparison of optimization approaches based on binary classification of cutting tools, along with parameter importance scores and breakage rates corresponding to parameter values.
A complex relationship throughout geometric parameters and tool wear has been discovered, which is distinct from their effects on resultant cutting force. Wear analysis confirmed the initial assumption that increasing the radial rake angle (A) to positive values would reduce cutting force and improve surface quality at the expense of edge strength. The severe trade-off between cutting efficiency and structural integrity was confirmed by a 50% tool fracture rate at 12 degrees rake. The more conservative, and seemingly optimal, value in the “Parent Tool.” is commercially justified. The radial relief angle (B) helped manage the friction–strength trade-off: too little relief caused high friction and more fractures, while increasing the angle slightly lowered fracture risk by reducing contact and heat. However, larger angles thin and weaken the edge, reducing wear resistance. The land width (C) was the most influential parameter, providing greater support behind the edge and lowering fracture rates by up to 17%. Its optimal value may lie at or beyond the upper limit of this study. The gashing axial rake angle (D), least important for both wear and cutting force, unexpectedly reduced tool life. In finishing operations with low chip loads, chip evacuation is less demanding, and a positive angle overly thins the end-cutting edges, promoting chipping and catastrophic failure despite potential chip-flow benefits.
4.3. Surface Roughness
In a manner comparable to the resultant cutting force investigation, average surface roughness (Ra) was used to assess surface quality. Figure 14 and Figure 15 represent average Ra values and error margins for surfaces machined according to the RSM experimental plan and RSM results. Comparable to resultant cutting force analysis, the RSM model for Ra fit the training data adequately but possessed low predictive accuracy for values outside the dataset, indicating generalizability limitations. Figure 16 displays that the collaborative ANN model performed better with 83–86% prediction accuracy. The Ra phenomenon is complex, with closely clustered data points and significant and overlapping error margins, suggesting that many machined surfaces were statistically equivalent in quality. Table 14 reflects that Ra parameter importance ranking, B > C > D > A, contradicts the rankings for resultant cutting force and tool wear, demonstrating surface generation’s unique and multifactorial nature. In Figure 17, the actual Ra values and those predicted by the ANN-GA model show strong consistency with the overall trend, despite minor deviations.
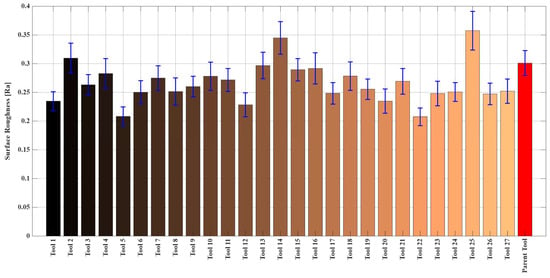
Figure 14.
Measured surface roughness values for each cutting tool.
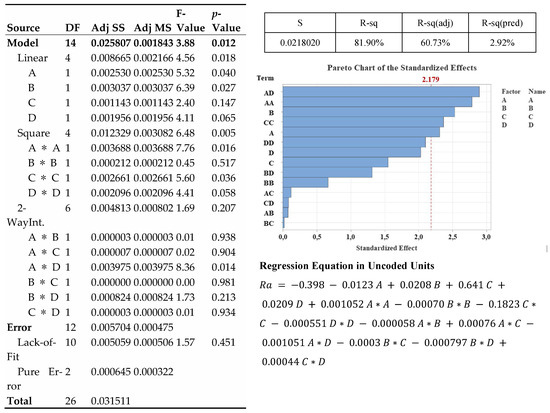
Figure 15.
Summary of response surface methodology results.
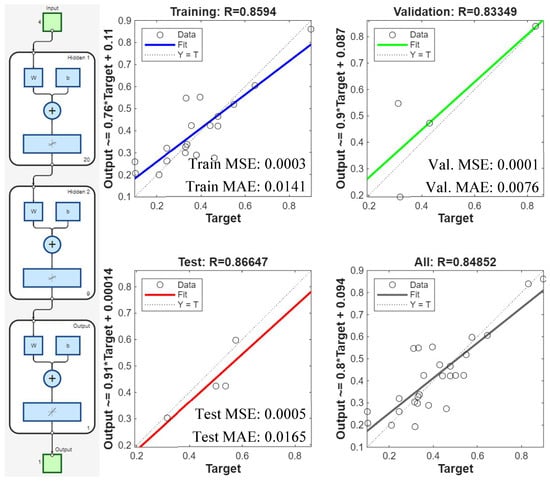
Figure 16.
ANN architecture (left) and ANN regression plots showing predicted surface roughness (Ra) for training, testing, validation, and overall error (right).
Table 14.
Comprehensive analysis of geometric parameter effects on surface roughness.
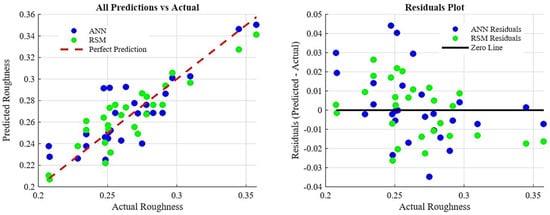
Figure 17.
Actual and predicted values (left) and residuals plot (right) by ANN and RSM.
Finally, Table 15 compares the three lowest Ra values experimentally, the “parent tool” value, and the RSM and ANN-GA models’ optimal values. Major differences in geometric parameter sets proposed by each optimization approach to achieve a low Ra are found. This discrepancy shows that complex parameter interactions can cause multiple geometric combinations to produce similar surface quality as can be seen in detail in Figure 18 in the form of 3D surface plots. This highlights the potential for improved surfaces to finish through optimized, non-intuitive tool geometries that would be challenging to identify without advanced modeling. Several interactions and trade-offs between geometric parameters and Ra. Experimental tests and the commercial “parent tool” recommended 7 degrees for the radial rake angle (A). The RSM model is estimated to be a lower value, but its low predictive power results in unreliable. ANN and ANN-GA recommended 12 degrees, consistent with the respective cutting force optimizations. The mechanical benefit of a larger positive rake angle is thinner chip formation with less material deformation, improving surface quality. This shows that the optimal value is part of a unique, synergistic geometric set.
Table 15.
Comparison of actual results with optimization outcomes from RSM and ANN–GA models for surface roughness.
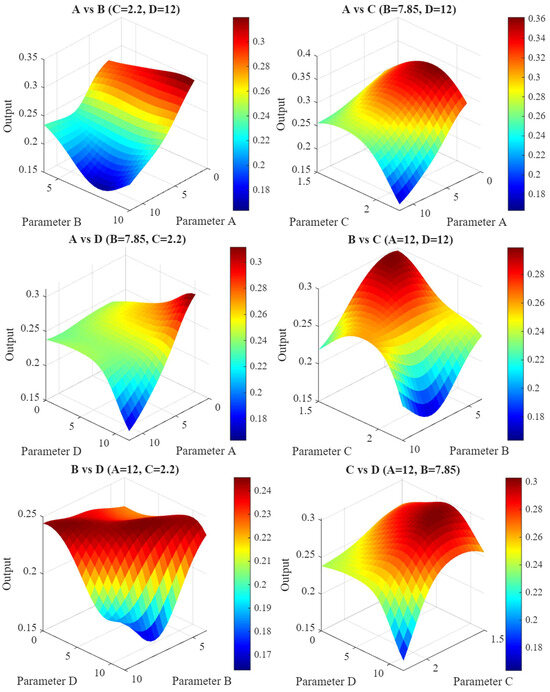
Figure 18.
3D surface plots illustrating the effects of parameters on output responses.
Radial relief angle (B) was slightly more complicated. Experimental and optimization results diverged from the parent tool, indicating a non-linear optimum. High friction and heat from an insufficient angle accelerate tool wear and degrade surface quality. An excessively large angle weakens the cutting edge and impairs surface finish [98]. The results show that intermediate values within the tested range are optimal for friction reduction and edge strength to maintain surface integrity. Land width (C) matched previous outputs; the experimental plan’s highest value was chosen for optimal performance. A wider land increases volumetric support behind the cutting edge, improving tool strength and stability without affecting surface quality, laying the groundwork for consistent finishing. Wide land can reduce machined part surface quality due to negative effective geometry. Increased contact area can cause tool deflection and vibrations, which affect surface finish [104].
4.4. Finite Element Analysis
Optimization methods were used to model and compare FEA resultant cutting forces to test results. The RSM model had a high coefficient of determination for FEA data, achieving higher predictive accuracy than experimental data, however it was below the robust prediction threshold (Figure 19). FEA’s improved performance suggests that it can capture fundamental process mechanics in an idealized environment without external noise such as machine tool vibrations, material inconsistencies, or operator error, granting the RSM’s polynomial model stronger signals. Figure 20 illustrates how the ANN-GA approach modeled FEA data nearly flawlessly. Even in a simulation, it can recognize all data points and generate accurate predictions, demonstrating its superior ability to handle complex, non-linear machining relationships. The controlled simulation allows RSM and ANN-GA models to be more accurate than experimental data when employed with FEA data. The stochastic noise and variability of physical experiments can be eliminated by FEA software, which allows more precise modeling of the functional relationships between geometry and force.
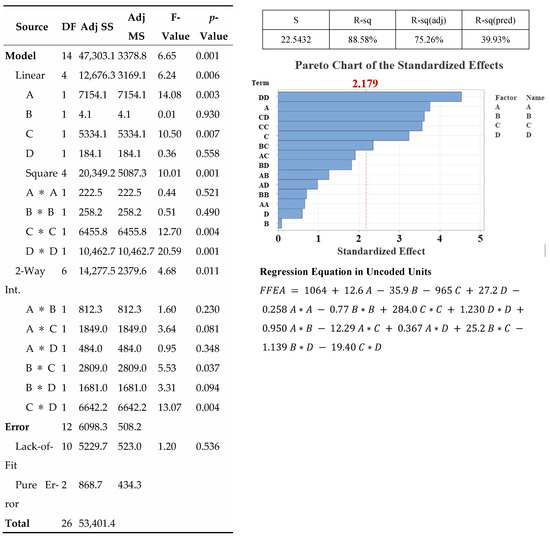
Figure 19.
Summary of response surface methodology results.
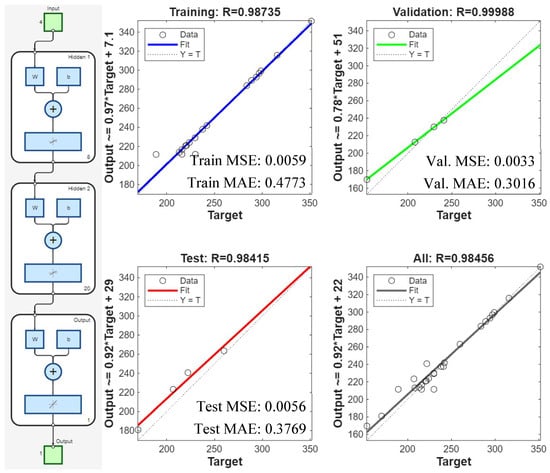
Figure 20.
ANN architecture (left) and ANN regression plots showing predicted FEA resultant cutting force (Fr) for training, testing, validation, and overall error (right).
The FEA results confirmed the experimental findings: width of land (C) was most influential, followed by radial rake angle (A), relief angle (B), and gashing axial rake angle (D) as shown in Table 16 and Figure 21. This consistency confirms the trends’ robustness. In Table 17, the optimization models’ optimal parameter values for FEA data are a major difference. Like other outputs, FEA-based optimizations recommend a high radial rake angle, but mid-range values for land width and gashing axial rake angle. In the FEA data, the lowest radial relief angle was optimal, demonstrating how the simulation’s absence of real-world uncertainties like chatter and runout can affect the friction-strength trade-off. The nature of the standard metal cutting model’s fundamental assumptions, finite element analysis (FEA) recommendations and experimental results for the radial relief angle contradict. The FEA simulation assumes infinite cutting-edge strength by calculating stress and forces exclusively based on material shear and flow and treating the cutting tool as a rigid body which does not wear or fail. Consequently, flank friction’s adverse consequences are not included in the model. From such idealized perspective, a lower relief angle (e.g., 4°) forms a stronger, larger wedge of material supporting the cutting edge. This stiffer geometry concentrates deformation within the workpiece and reflects the high stresses of shearing tough 1.2379 steel, which the model interprets as a more “efficient” cut and reduces the predicted force. Figure 22 suggests that fracture was caused by localized stress concentration rather than uniform distribution. When stresses were evenly distributed, a uniform wear pattern developed. The remaining cases behaved as stated in the actual experiment’s results. Experimental validation demonstrates that parasitic friction forces outweigh this theoretical advantage in practice. Low relief angles increase flank-workpiece rubbing, which generates heat and increases cutting force. The idealized FEA model prioritizes structural integrity and predicts lower forces with a strong wedge, but experimental results show that a higher radial relief angle is better in practice because it drastically reduces friction, outweighing the theoretical strength advantage in the machining environment.
Table 16.
Comprehensive parameter effect analysis for surface roughness.
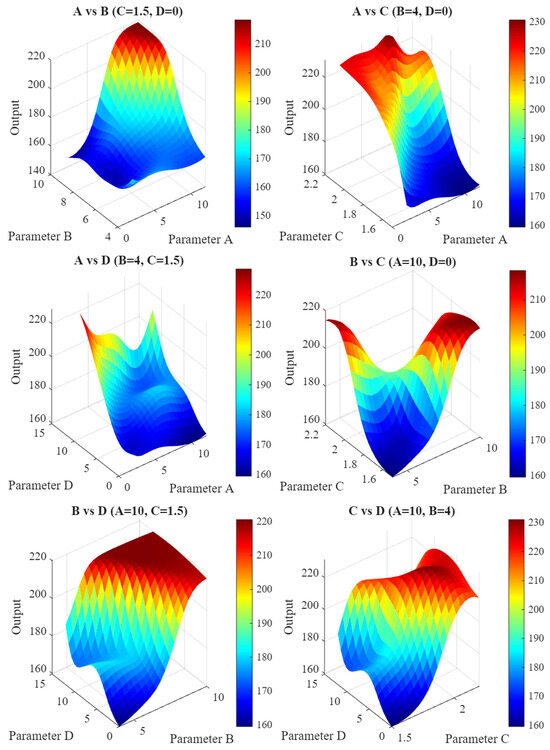
Figure 21.
3D surface plots illustrating the effects of parameters on output responses.
Table 17.
Comparison of actual results with optimization outcomes from RSM and ANN–GA models for resultant cutting force results of finite element analysis versus real experimental tests.
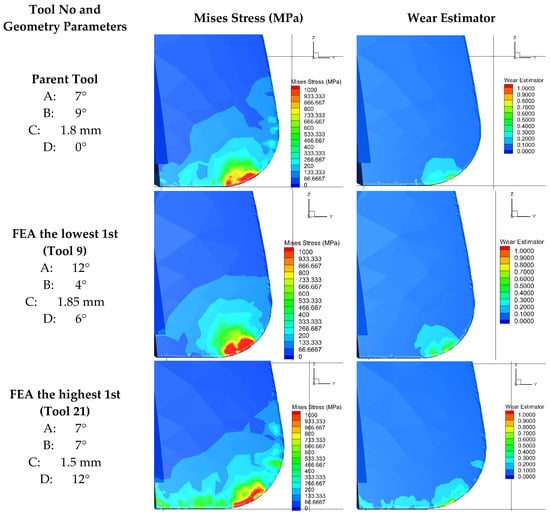
Figure 22.
Comparative analysis of Von Mises stress distribution and wear predictions from FEA.
5. Conclusions, Limitations and Future Research
This study examined, analyzed, and interpreted four different geometric parameters modified using a “parent (reference)” tool geometry as a template to explore the function and design limitations of 1.2379 cold work tool steel in end milling. Although the theoretical effect of each parameter on the machining process can be estimated, the unique geometry and cutting mechanics effect resulting from the interactions between the geometry parameters requires more comprehensive and detailed optimization and analysis of the experimental results. The complexity of this process would enable the identification of an optimal geometry in which all parameters work in harmony with each other, utilizing numerous tools such as response surface methodology, artificial neural networks, genetic algorithms, and finite element analysis. Furthermore, emphasis has also been placed on serious inadequacy and lack of relevant literature. Therefore, the goal is to achieve an ideal tool geometry (or design) that provides certain benefits while sacrificing others, assuming that the specified requirements are understood. Each tool geometry parameter and value has been evaluated and recommended based on individual outputs. This is because the tool, mold, and die manufacturing industries mostly prioritize mold quality. From this perspective, a tool that promises a stable machining process, minimizing the possibility of wear and breakage based on mechanical and thermal stresses and providing the desired surface quality, is desired. Therefore, based on the expertise of the collaborating company, industry professionals, and academic colleagues, an experimental framework has been developed with geometric parameters selected according to the research objectives.
Identification of a single “optimal” end mill geometry which consistently meets 1.2379 steel finishing standards and provides optimal tool durability for tool and die surfaces is challenging. The ideal geometry depends on the machining operation, so manufacturers must prioritize one or more performance objectives—such as surface quality, dimensional accuracy, or tool wear—rather than all. Technically superior processes often fail cost-effectiveness tests. Thus, companies frequently trade off performance, favoring surface quality and dimensional accuracy against tool wear and cutting forces.
The resultant cutting force, tool wear, and surface roughness outputs have been examined using RSM and ANN–GA optimization. The main findings and conclusions are below:
- The RSM model demonstrated high accuracy in fitting data (R2 = 87.64%) but unreliable predictive capability (R2pred = 35.95%) for cutting force. ANN model data fitting and prediction were consistently accurate (R = 0.96). The width of the land (C) parameter was the most influential variable due to its impact on cutting-edge toughness and chipping and fracture resistance. The parent tool experienced lower average cutting forces compared to the new geometries. The tool geometry predicted to minimize cutting force by ANN–GA hybrid optimization is A = 9.92°, B = 9.99°, C = 2.20 mm, and D = 11.13°.
- Findings for tool wear were substantially distinct from other outputs. The initial goal was to evaluate uniform wear behavior and correlate wear with cutting force or surface roughness, but most tools experienced catastrophic fracture wear or macro-chipping. A binary classification method was used to distinguish fractured and non-fractured tools because quantitative wear analysis was not feasible. Decision tree, logistic regression, support vector machine, and artificial neural network models were used to classify, with the ANN model possessing the highest accuracy (75%). RSM was unsuitable for this analysis. Comparable to cutting force, the width of the land (C) parameter was the most important factor, affecting edge strength and load distribution. No fracture was found in the parent tool, but microscopic and SEM examinations showed flank wear and micro-chipping. The geometry predicted to minimize fracture risk by the ANN–GA hybrid optimization is A = 7°, B = 7°, C = 2.20 mm, and D = 0°. Tools that did not fracture were generally in better condition.
- RSM model showed moderate accuracy in fitting data (R2 = 81.9%) but limited predictive capability (R2pred = 2.92%) for surface roughness. In contrast, the ANN model outperformed in data recognition and prediction accuracy (R ≈ 0.86). The most important parameter affecting surface roughness is the radial relief angle (B), which controls the balance between friction reduction and cutting-edge strength to preserve surface integrity rather than cutting force. The parent tool had higher average surface roughness than tools with newly designed geometries, but most alternative geometries had lower roughness and improved reliability due to model prediction. The geometry with the lowest surface roughness according to ANN–GA hybrid optimization is A = 12°, B = 7.85°, C = 2.20 mm, and D = 12°.
- FEA had been employed to model tools and assess cutting force output. The results were computationally based on metal cutting theory and did not fully replicate the experimental setup, which meant they deviated from the real-world test results. The RSM model had high data fitting accuracy (R2 = 88.58%) but low predictive capability (R2pred = 39.93%), despite having a significant prediction value. The ANN model had near-perfect data recognition and prediction (R = 0.98 for both). The FEA parameter influence ranking matched experimental cutting force analyses. A table comparing FEA predictions and experimental test results was used to evaluate. The optimal tool geometry predicted by ANN–GA hybrid optimization was A = 9.22°, B = 4.13°, C = 1.91 mm, and D = 3.27°. This is because FEA assumes infinite cutting-edge strength and ignores flank friction through computing stresses and forces based on material shear and flow behavior.
Afterwards weighing the study’s results with the collaborating company, it was agreed that significant results had been achieved. Simultaneous to the above, the study’s limitations were assessed to identify decisions that could have been improved before and during the research. This evaluation provided valuable and novel insights for future research. As stated in the industrial and academic perspectives section, certain proprietary findings will remain confidential due to competitive considerations, but the following outcomes are expected to assist academic researchers and industry practitioners. Furthermore, future studies should implement several workflow and methodological improvements.
- A.
- The primary recommendation is to use design of experiments (DoE) to reduce the number of tests. This approach reduces experimental workload by excluding certain parameter combinations, but it limits the model’s predictive power and obscures the true behavior of parameters in complex systems by not representing intermediate interactions. Similarly, in this study, low test numbers and low test repetition numbers may reduce the confidence in the repeatability of the test results (outputs) to be obtained from such a test plan and the subsequent optimization study, and may constitute an obstacle to the correct definition of regression equations or patterns in the data obtained as a result of complex parameter interactions. Although artificial neural network modeling works efficiently with limited data in this study, data-based approaches such as artificial neural networks do not always perform well in situations involving complex interrelationships between parameters and outputs, and this situation is also limiting in terms of data quantity. Therefore, future studies should use full factorial experimental designs and a greater number of repetitions. Despite requiring more tests, this approach provides a better understanding of parameter effects and more reliable industrial and academic results.
- B.
- The second suggestion is to create a customized tool for finishing operations by modifying key geometric design parameters. Increasing flutes and optimizing helix angle might enhance cutting performance and surface quality. Following customization, the revised geometry parameters can be systematically modified for investigating their impact on tool behavior and machining outcomes.
- C.
- The third recommendation is to improve the implementation of finite element analysis (FEA) software in future studies. FEA’s assumption of idealized, infinite geometry may differ from experimental results, but its stress and wear estimators, including chipping prediction modules, provide valuable insights into tool wear mechanisms. FEA at an early stage of research could improve experimental design and reduce test numbers. Alternatively, comparing FEA predictions and large experimental datasets would better validate simulation accuracy and applicability to practical machining conditions.
- D.
- A final recommendation is to increase the number of experiments and ensure a minimum of two repetitions per test to improve reliability and repeatability of results. This is crucial for determining the most beneficial tool geometry for surface roughness. To more accurately evaluate tool performance and machining quality, future research would benefit from vibration analysis, surface topography characterization, and 3D scanning for dimensional and geometrical accuracy assessments.
Author Contributions
Conceptualization, T.B.Ş., O.D., A.E. and M.A.; Methodology, T.B.Ş., O.D., H.K. and S.Y.; Software, T.B.Ş.; Validation, T.B.Ş., H.K., A.E. and M.A.; Formal analysis, T.B.Ş., O.D. and A.E.; Investigation, T.B.Ş., H.K., S.Y. and M.A.; Resources, T.B.Ş., Ç.G.A., A.E. and M.A.; Data curation, T.B.Ş., Ç.G.A., S.Y. and M.A.; Writing—original draft, T.B.Ş., O.D., A.E. and M.A.; Writing—review and editing, T.B.Ş. and O.D.; Visualization, T.B.Ş. and Ç.G.A.; Supervision, A.E.; Project administration, O.D. and A.E.; Funding acquisition, A.E. and M.A. All authors have read and agreed to the published version of the manuscript.
Funding
The authors gratefully acknowledge the financial support provided by the Marmara University Scientific Research Project Coordination Unit under Project No. FDK-2024-11385, the Council of Higher Education (YÖK) and Marmara University under the Research Universities Support Program (ADEP) Project No. ADF-2025-11485, and the Scientific and Technological Research Council of Turkey (TÜBİTAK) under Project Type 1002-A (Project No. 125M809). The authors also express their sincere appreciation to their industrial collaborator, Karcan Cutting Tools Industry and Trade Inc., and its expert team for their valuable technical contributions and collaboration.
Data Availability Statement
The original contributions presented in this study are included in the article. Further inquiries can be directed to the corresponding author.
Conflicts of Interest
Authors Hasan Kuş and Çağla Gökbulut Avdan were employed by the company Karcan Cutting Tools Industry and Trade Inc., Semih Yüksel was employed by the company Unirobotics Robotik Sistemler A.S. The remaining authors declare that the research was conducted in the absence of any commercial or financial relationships that could be construed as a potential conflict of interest.
References
- Groover, M.P. Fundamentals of Modern Manufacturing: Materials, Processes, and Systems; John Wiley & Sons: Hoboken, NJ, USA, 2010. [Google Scholar]
- ASM International Handbook Committee. ASM Handbook, Volume 16–Machining; ASM International: Materials Park, OH, USA, 1989. [Google Scholar]
- Kalpakjian, S.; Schmid, S. Manufacturing Engineering & Technology; Pearson Education: Upper Saddle River, NJ, USA, 2013. [Google Scholar]
- Boothroyd, G.; Dewhurst, P.; Knight, W.A. Product Design for Manufacture and Assembly; CRC Press: Boca Raton, FL, USA, 2010. [Google Scholar]
- Schulz, H.; Moriwaki, T. High-speed machining. CiRP Ann. 1992, 41, 637–643. [Google Scholar] [CrossRef]
- Rosenberg, N. Technological change in the machine tool industry, 1840–1910. J. Econ. Hist. 1963, 23, 414–443. [Google Scholar] [CrossRef]
- Altan, T.; Lilly, B.; Yen, Y. Manufacturing of dies and molds. CiRP Ann. 2001, 50, 404–422. [Google Scholar] [CrossRef]
- Jhavar, S.; Paul, C.; Jain, N. Causes of failure and repairing options for dies and molds: A review. Eng. Fail. Anal. 2013, 34, 519–535. [Google Scholar] [CrossRef]
- Kumari, A.; Acherjee, B. Material Selection for Milling Cutter Inserts in High-Speed Machining Applications Using the CARCACS Method. Results Eng. 2025, 26, 105063. [Google Scholar] [CrossRef]
- Bole, S.; Sarkar, S. A Study on the Effect of Prior Hot Forging on Microstructure and Mechanical Properties of AISI D2 Steel After Quenching. Met. Sci. Heat Treat. 2024, 65, 683–690. [Google Scholar] [CrossRef]
- Denkena, B.; Köhler, J.; Bergmann, B. Development of cutting edge geometries for hard milling operations. CIRP J. Manuf. Sci. Technol. 2015, 8, 43–52. [Google Scholar] [CrossRef]
- Jing, L.; Chen, M.; An, Q. Study on Performance of PVD AlTiN Coatings and AlTiN-Based Composite Coatings in Dry End Milling of Hardened Steel SKD11. Metals 2021, 11, 2019. [Google Scholar] [CrossRef]
- Elghazaly, S.; Gyula, K.; Elghazaly, W. Optimizing morphology of primary carbides and mechanical properties during processing of cast-cold work AISI D2-steel press forming dies. Int. J. Met. 2019, 13, 337–344. [Google Scholar] [CrossRef]
- Kuřík, M.; Lacza, J.; Vlach, T.; Sobotová, J. Study of the properties and structure of selected tool steels for cold work depending on the parameters of heat treatment. Mater. Technol. 2017, 51, 585–589. [Google Scholar] [CrossRef]
- Kumar, S.; Singh, H.; Kumar, R.; Chohan, J.S. Parametric optimization and wear analysis of AISI D2 steel components. Mater. Today Proc. 2023, 62, 150–156. [Google Scholar] [CrossRef]
- Tlija, M.; Rashid, T.; Sana, M.; Farooq, M.U.; Ammarullah, M.I. AISI D2 steel machining and manufacturing process optimization for tooling applications in biomedical industry. AIP Adv. 2024, 14, 105129. [Google Scholar] [CrossRef]
- Li, B.; Zhang, S.; Yan, Z.; Zhang, J. Effect of edge hone radius on chip formation and its microstructural characterization in hard milling of AISI H13 steel. Int. J. Adv. Manuf. Technol. 2018, 97, 305–318. [Google Scholar] [CrossRef]
- Klocke, F.; Krämer, A.; Sangermann, H.; Lung, D. Thermo-mechanical tool load during high performance cutting of hard-to-cut materials. Procedia CIRP 2012, 1, 295–300. [Google Scholar] [CrossRef]
- Nath, C.; Brooks, Z.; Kurfess, T.R. Machinability study and process optimization in face milling of some super alloys with indexable copy face mill inserts. J. Manuf. Process. 2015, 20, 88–97. [Google Scholar] [CrossRef]
- Singh, K.K.; Kartik, V.; Singh, R. Stability modeling with dynamic run-out in high speed micromilling of Ti6Al4V. Int. J. Mech. Sci. 2019, 150, 677–690. [Google Scholar] [CrossRef]
- Diniz, A.E.; Ferreira, J.; Silveira, J. Toroidal milling of hardened SAE H13 steel. J. Braz. Soc. Mech. Sci. Eng. 2004, 26, 17–21. [Google Scholar] [CrossRef]
- Jing, L.L.; Liu, G.; Chen, M. Study on surface integrity in hard milling of hardened die steel. Mater. Sci. Forum 2006, 532–533, 540–543. [Google Scholar] [CrossRef]
- Petrovic, M.; Voloder, A. Flexural strength reduction in cemented carbides. Acta Phys. Pol. A 2015, 128, B23–B25. [Google Scholar] [CrossRef]
- Guo, B.; Zhang, L.; Cao, L.; Zhang, T.; Jiang, F.; Yan, L. The correction of temperature-dependent Vickers hardness of cemented carbide base on the developed high-temperature hardness tester. J. Mater. Process. Technol. 2018, 255, 426–433. [Google Scholar] [CrossRef]
- Tabakov, V.P.; Vereschaka, A.S.; Vereschaka, A.A. Multilayer composition coatings for cutting tools: Formation and performance properties. Mech. Ind. 2017, 18, 706. [Google Scholar] [CrossRef]
- Malekan, M.; Ilvig, C.F.; Aghababaei, R. Effects of edge radius and coating thickness on the cutting performance of AlCrN-coated tool. Int. J. Precis. Eng. Manuf. 2024, 25, 2059–2075. [Google Scholar] [CrossRef]
- Kang, K.; Su, S.; Yu, B.; Sun, Z.; Hu, S.; Wang, Z.; Zhao, C.; Wu, L.; Luo, G.; Wei, R. The review and prospect of tool coating technology. Int. J. Adv. Manuf. Technol. 2025, 137, 3107–3139. [Google Scholar] [CrossRef]
- Peng, B.; Bergs, T.; Schraknepper, D.; Klocke, F.; Döbbeler, B. A hybrid approach using machine learning to predict the cutting forces under consideration of the tool wear. Procedia CIRP 2019, 82, 302–307. [Google Scholar] [CrossRef]
- Kar, S.; Niranjan, C.; Swamy, P.S.N.R.; Majumder, T. Application of machine learning and MOGA for predictive modelling and optimization of Inconel 718 machining in WEDM. Eng. Res. Express 2025, 7, 045406. [Google Scholar] [CrossRef]
- Karmi, Y.; Boumediri, H.; Reffas, O.; Chetbani, Y.; Ataya, S.; Khan, R.; Yallese, M.A.; Laouissi, A. Integration of Hybrid Machine Learning and Multi-Objective Optimization for Enhanced Turning Parameters of EN-GJL-250 Cast Iron. Crystals 2025, 15, 264. [Google Scholar] [CrossRef]
- Basar, G.; Kahraman, F.; Der, O. Multi-Response Optimization of Drilling Parameters in Direct Hot-Pressed Al/B4C/SiC Hybrid Composites Using Taguchi-Based Entropy–CoCoSo Method. Materials 2025, 18, 4319. [Google Scholar] [CrossRef]
- Malghan, R.L.; Rao, K.; Shettigar, A.K.; Rao, S.S.; D’Souza, R. Forward and reverse mapping for milling process using artificial neural networks. Data Brief 2018, 16, 114–121. [Google Scholar] [CrossRef]
- Tsai, M.-H.; Lee, J.-N.; Tsai, H.-D.; Shie, M.-J.; Hsu, T.-L.; Chen, H.-S. Applying a neural network to predict surface roughness and machining accuracy in the milling of SUS304. Electronics 2023, 12, 981. [Google Scholar] [CrossRef]
- Mongan, P.G.; Hinchy, E.P.; O’Dowd, N.P.; McCarthy, C.T.; Diaz-Elsayed, N. An ensemble neural network for optimising a CNC milling process. J. Manuf. Syst. 2023, 71, 377–389. [Google Scholar] [CrossRef]
- Wang, J.; Chen, T.; Kong, D. Knowledge-based neural network for surface roughness prediction of ball-end milling. Mech. Syst. Signal Process. 2023, 194, 110282. [Google Scholar] [CrossRef]
- Ehsan, S.; Ali, M.A.; Khan, S.A.; Sana, M.; Yasir, M.; Anwar, S.; Farooq, M.U. Understanding the Effects of Cutting Conditions on Vibrations, Surface Integrity, Machining Temperature and Tool Wear Mechanisms in End Milling of AISI D2 Steel. Tribol. Int. 2024, 198, 109894. [Google Scholar] [CrossRef]
- Patel, R.D.; Bhavsar, S.N.; Patel, A.K. Experimental investigation on cutting force during end milling of AISI D2 tool steel using AlCrN coated tool. Mater. Today Proc. 2023, 80, 1397–1402. [Google Scholar] [CrossRef]
- Imani, H.; Hashemi, J.; Sadeghi, M.; Rasti, A. An Experimental Comparison of Dimensional and Geometrical Tolerances in Milled Holes on AISI D2 Steel. Amirkabir J. Mech. Eng. 2018, 50, 671–680. [Google Scholar]
- Beşliu, I.; Amarandei, D.; Cerlincă, D. Analysis of chip formation and cutting forces in end milling AISI D2 tool steel with different cutting tool geometries. In Proceedings of the MATEC Web of Conferences, 22nd International Conference on Innovative Manufacturing Engineering and Energy - IManE&E, Chisinau, Republic of Moldova, 31 May–2 June 2018; Volume 178. [Google Scholar]
- Wada, T.; Hanyu, H. Tool wear of aluminum/chromium/tungsten/silicon-based-coated end mill cutters in milling hardened steel. Solid State Phenom. 2017, 263, 85–89. [Google Scholar] [CrossRef]
- Luqman, N.; Shukor, S.M.; Hadzley, M. The effect of cutting parameters on tool wear in end milling of AISI D2 tool steel. Proc. Mech. Eng. Res. Day 2017, 2017, 124–125. [Google Scholar]
- Cheema, E.A.; Kumar, E.R.; Rathi, E.V. Optimization and prediction of surface roughness on cnc milling machine by using artificial nueral network on d2 steel. Int. J. Commer. IT Soc. Sci. 2015, 2, 64. [Google Scholar]
- Izamshah, R.; Mo, J.; Arfauz, M.; Ding, S.; Azam, M.; Kasim, M. Effect of parameter condition on surface roughness for machining AISI D2 hardened tool steel. J. Adv. Manuf. Technol. 2014, 8, 47–56. [Google Scholar]
- Halim, M.A.A.; Kasim, M.S.; Sulaiman, M.A.; Mohamad, E.; Ito, T. Effect of Cutting Parameters on Surface Roughness during End Milling of AISI D2 Tool Steel. In Proceedings of the Design & Systems Conference 2014, Redondo Beach, CA, USA, 21–22 March 2014; Japan Society of Mechanical Engineers: Tokyo, Japan, 2014; pp. 2308-1–2308-6. [Google Scholar]
- Singh, G.; Mangat, H.S.; Sodhi, H.S. Optimization of end milling process for d2 (die steel) by using response surface methodology. J. Prod. Eng. 2014, 17, 73–78. [Google Scholar]
- Iqbal, A.; He, N.; Li, L. Empirical Modeling the Effects of Cutting Parameters in High-Speed End Milling of Hardened AISI D2 under MQL Environment. In Proceedings of the World Congress on Engineering 2011, London, UK, 6–8 July 2011. [Google Scholar]
- Qi, B.; He, N.; Li, L. Experimental Study in HSM of Hardened Steel AISI D2. Adv. Mater. Res. 2009, 69, 374–378. [Google Scholar] [CrossRef]
- Iqbal, A.; Dar, N.; He, N.; Khan, I.; Li, L. Optimizing cutting parameters in minimum quantity of lubrication milling of hardened cold work tool steel. Proc. Inst. Mech. Eng. Part B J. Eng. Manuf. 2009, 223, 43–54. [Google Scholar] [CrossRef]
- Iqbal, A.; Ning, H.; Khan, I.; Liang, L.; Dar, N.U. Modeling the effects of cutting parameters in MQL-employed finish hard-milling process using D-optimal method. J. Mater. Process. Technol. 2008, 199, 379–390. [Google Scholar] [CrossRef]
- Kang, M.C.; Kim, K.H.; Shin, S.H.; Jang, S.H.; Park, J.H.; Kim, C. Effect of the minimum quantity lubrication in high-speed end-milling of AISI D2 cold-worked die steel (62 HRC) by coated carbide tools. Surf. Coat. Technol. 2008, 202, 5621–5624. [Google Scholar] [CrossRef]
- Monka, P.P.; Monkova, K.; Majstorovic, V.D.; Božić, Ž.; Andrej, A. Optimal cutting parameter specification of newly designed milling tools based on the frequency monitoring. Int. J. Adv. Manuf. Technol. 2021, 115, 777–794. [Google Scholar] [CrossRef]
- Ahmed, F.; Kumaran, S.T.; Ahmad, F. Analysis of wear mechanisms and chip morphology during machining of tool steel using TiAlSiCrN-coated WC-Co ball end mills. Results Mater. 2022, 20, 100487. [Google Scholar] [CrossRef]
- Kusyi, Y.; Kuk, A.; Topilnytskyy, V.; Rebot, D.; Bojko, M. Influence of constructive and geometric parameters of the end cutters on the microprofile characteristics of casting surfaces. Technol. Audit Prod. Reserves 2021, 2, 6–10. [Google Scholar] [CrossRef]
- Joshi, S.N.; Bolar, G. Influence of end mill geometry on milling force and surface integrity while machining low rigidity parts. J. Inst. Eng. Ser. C 2021, 102, 1503–1511. [Google Scholar] [CrossRef]
- Narooei, K.D.; Ramli, R. Optimal selection of cutting parameters for surface roughness in milling machining of AA6061-T6. Int. J. Eng. 2022, 35, 1170–1177. [Google Scholar] [CrossRef]
- Turner, S.; Merdol, D.; Altintas, Y.; Ridgway, K. Modelling of the stability of variable helix end mills. Int. J. Mach. Tools Manuf. 2007, 47, 1410–1416. [Google Scholar] [CrossRef]
- Ji, J.; Yang, Q.; Chen, P.; Lu, K.; Wu, Y. An improved mathematical model of cutting temperature in end milling Al7050 based on the influence of tool geometry parameters and milling parameters. Math. Probl. Eng. 2021, 2021, 5705091. [Google Scholar] [CrossRef]
- Subramanian, M.; Sakthivel, M.; Sooryaprakash, K.; Sudhakaran, R. Optimization of end mill tool geometry parameters for Al7075-T6 machining operations based on vibration amplitude by response surface methodology. Measurement 2013, 46, 4005–4022. [Google Scholar] [CrossRef]
- Sethupathy, A.; Shanmugasundaram, N. Prediction of cutting force based on machining parameters on AL7075-T6 aluminum alloy by response surface methodology in end milling. Mater. Werkst. 2021, 52, 879–890. [Google Scholar] [CrossRef]
- Zhang, X.; Zhang, J.; Zhou, H.; Ren, Y.; Xu, M. A novel milling force model based on the influence of tool geometric parameters in end milling. Adv. Mech. Eng. 2018, 10, 1687814018798185. [Google Scholar] [CrossRef]
- Doluk, E.; Rudawska, A. Effect of Machining settings and tool geometry on surface quality after machining of Al/CFRP sandwich structures. Adv. Sci. Technol. Res. J. 2022, 16, 22–33. [Google Scholar] [CrossRef] [PubMed]
- Izamshah, R.; Rafiq, M.; Lamat, A.; Kasim, M.; Salleh, M.; Liew, P.; Aziz, M.; Abdullah, R. Effects of cutter geometry and cutting parameters on machining Al/SiC metal matrix composites (MMC). Int. J. Nanoelectron. Mater. 2021, 14, 343–352. [Google Scholar]
- Aslantas, K.; Alatrushi, L.K. Experimental study on the effect of cutting tool geometry in micro-milling of Inconel 718. Arab. J. Sci. Eng. 2021, 46, 2327–2342. [Google Scholar] [CrossRef]
- Ma, J.-W.; Jia, Z.-Y.; He, G.-Z.; Liu, Z.; Zhao, X.-X.; Qin, F.-Z. Influence of cutting tool geometrical parameters on tool wear in high-speed milling of Inconel 718 curved surface. Proc. Inst. Mech. Eng. Part B J. Eng. Manuf. 2019, 233, 18–30. [Google Scholar] [CrossRef]
- Tang, J.; Deng, C.; Chen, X.; Zhai, H. Analysis and optimization of milling deformations of TC4 alloy thin-walled parts based on finite element simulations. Machines 2023, 11, 628. [Google Scholar] [CrossRef]
- Ren, J.; Zhou, J.; Wei, J. Optimization of cutter geometric parameters in end milling of titanium alloy using the grey-Taguchi method. Adv. Mech. Eng. 2015, 7, 721093. [Google Scholar] [CrossRef]
- Li, A.; Zhao, J.; Pei, Z.; Zhu, N. Simulation-based solid carbide end mill design and geometry optimization. Int. J. Adv. Manuf. Technol. 2014, 71, 1889–1900. [Google Scholar] [CrossRef]
- Zoghipour, N.; Tascioglu, E.; Celik, F.; Kaynak, Y. The influence of edge radius and lead content on machining performance of brass alloys. Procedia CIRP 2022, 112, 274–279. [Google Scholar] [CrossRef]
- Nemes, J.; Asamoah-Attiah, S.; Budak, E.; Kops, L. Cutting load capacity of end mills with complex geometry. CIRP Ann. 2001, 50, 65–68. [Google Scholar] [CrossRef]
- Altintaş, Y.; Lee, P. A general mechanics and dynamics model for helical end mills. CIRP Ann. 1996, 45, 59–64. [Google Scholar] [CrossRef]
- Yuksel, S.; Sirin, T.B.; Ay, M.; Uçar, M.; Kurt, M. A study on end mill tool geometry parameters for end milling of 316L: Finite element analysis and response surface methodology optimization based on resultant cutting force. J. Braz. Soc. Mech. Sci. Eng. 2024, 46, 452. [Google Scholar] [CrossRef]
- Son, H.J.; Cho, Y.T. Optimized end mill design for high-hardness steel machining through finite element analysis and performance evaluation. Int. J. Adv. Manuf. Technol. 2025, 138, 4767–4778. [Google Scholar] [CrossRef]
- Chi-Hsiang, C.; Yung-Cheng, W.; Bean-Yin, L. The optimal design of micro end mill for milling SKD61 tool steel. Int. J. Adv. Manuf. Technol. 2013, 68, 165–173. [Google Scholar] [CrossRef]
- Kim, Y.-H.; Ko, S.-L. Development of design and manufacturing technology for end mills in machining hardened steel. J. Mater. Process. Technol. 2002, 130, 653–661. [Google Scholar] [CrossRef]
- Koshy, P.; Dewes, R.; Aspinwall, D. High speed end milling of hardened AISI D2 tool steel (∼58 HRC). J. Mater. Process. Technol. 2002, 127, 266–273. [Google Scholar] [CrossRef]
- Babu, B.H.; Rao, K.V.; Ben, B.S. Modeling and optimization of dead metal zone to reduce cutting forces in micro-milling of hardened AISI D2 steel. J. Braz. Soc. Mech. Sci. Eng. 2021, 43, 142. [Google Scholar] [CrossRef]
- Khan, S.A.; Anwar, S.; Ishfaq, K.; Afzal, M.Z.; Ahmad, S.; Saleh, M. Wear performance of modified inserts in hard turning of AISI D2 steel: A concept of one-step sustainable machining. J. Manuf. Process. 2020, 60, 457–469. [Google Scholar] [CrossRef]
- Li, P.; Oosterling, J.; Hoogstrate, A.; Langen, H.; Munnig Schmidt, R. Design of micro square endmills for hard milling applications. Int. J. Adv. Manuf. Technol. 2011, 57, 859–870. [Google Scholar] [CrossRef]
- bin Abdul Rahim, M.A.S.; bin Minhat, M.; Hussein, N.I.S.B.; bin Salleh, M.S. A comprehensive review on cold work of AISI D2 tool steel. Metall. Res. Technol. 2018, 115, 104. [Google Scholar] [CrossRef]
- ISO 286-2:2010; Geometrical product specifications (GPS)—ISO code system for tolerances on linear sizes—Part 2: Tables of standard tolerance classes and limit deviations for holes and shafts. ISO (the International Organization for Standardization): Geneva, Switzerland, 2010.
- Hermawan, Y.; Soenoko, R.; Irawan, Y.S.; Setyabudi, S.A. Cutting Forces, Chips Formation and Surface Roughness in Rock Cutting Using Negative Rake Angle. Manuf. Technol. 2020, 20, 27–35. [Google Scholar] [CrossRef]
- Cao, P.; Zhu, Z.; Buck, D.; Guo, X.; Ekevad, M.; Wang, X.A. Effect of rake angle on cutting performance during machining of stone-plastic composite material with polycrystalline diamond cutters. J. Mech. Sci. Technol. 2019, 33, 351–356. [Google Scholar] [CrossRef]
- Takekazu, S.; Shinichi, T.; Masaki, W.; Masayuki, O.; Kuniaki, U. Influences of surface roughness of rake face on cutting performance in ductile materials. In Proceedings of the 8th International Conference on Progress of Machining Technology, ICPMT2006, Matsue, Japan, 9–11 November 2006; pp. 233–236. [Google Scholar]
- Li, R.; Yao, Q.; Xu, W.; Li, J.; Wang, X. Study of cutting power and power efficiency during straight-tooth cylindrical milling process of particle boards. Materials 2022, 15, 879. [Google Scholar] [CrossRef]
- Regaieg, A.; Belguith, R.; Sai, L.; Bouzid, W. Geometric modeling of the rubbing zone limits in 3-axis ball-end milling. Int. J. Adv. Manuf. Technol. 2023, 125, 5557–5570. [Google Scholar] [CrossRef]
- Gao, P.; Wang, X.; Liang, Z.; Xiang, J.; Li, W.; Xie, J. Effects of WC grain size and Co content on microscale wear behavior of micro end mills in aluminum alloy 7075 machining. Int. J. Adv. Manuf. Technol. 2019, 104, 2401–2413. [Google Scholar] [CrossRef]
- ISO 13399-1:2006; Cutting tool data representation and exchange. ISO (the International Organization for Standardization): Geneva, Switzerland, 2006.
- Vadde, K.K.; Syrotiuk, V.R.; Montgomery, D.C. Optimizing protocol interaction using response surface methodology. IEEE Trans. Mob. Comput. 2006, 5, 627–639. [Google Scholar] [CrossRef]
- Kamalakannan, V.; Rajaram, S.; Iyyadurai, J.; Arockiasamy, F.S. Fundamental study on influence of independent factors on response variable using response surface methodology and Taguchi method. Eng. Proc. 2024, 61, 37. [Google Scholar]
- Kisan Chatki, P.; Mohan Mirashe, M.; Warokar, A.S.; Mahajan, U.N. Box-Behnken design in optimization of the green liquid chromatographic method for the quantification of Afatinib in drug product: AQbD approach. J. Liq. Chromatogr. Relat. Technol. 2024, 47, 349–359. [Google Scholar] [CrossRef]
- Buenaño, L.; Ali, E.; Jafer, A.; Zaki, S.H.; Hammady, F.J.; Khayoun Alsaadi, S.B.; Karim, M.M.; Ramadan, M.F.; Omran, A.A.; Alawadi, A. Optimization by Box–Behnken design for environmental contaminants removal using magnetic nanocomposite. Sci. Rep. 2024, 14, 6950. [Google Scholar] [CrossRef] [PubMed]
- Shah, R.K.; Ghosh, A. The influence of substrate microstructure and radial rake angle on the performance of TiAlN coated end mills in slot milling of SS304. Manuf. Lett. 2025, 44, 668–677. [Google Scholar] [CrossRef]
- Jiang, Y.; Xin, J.; Yin, Z.; Shan, W.; Chen, Y.; Zhang, L. Study on the influence of tool rake angle on stress wave effect in high-speed cutting. J. Phys. Conf. Ser. 2025, 3067, 012012. [Google Scholar] [CrossRef]
- Aydın, K.; Katmer, Ş.; Gök, A.; Şeker, U. Experimental and statistical investigation of the machining performance of wave form end mills on AISI 316L stainless steel. J. Fac. Eng. Archit. Gazi Univ. 2021, 36, 2225–2238. [Google Scholar]
- Gowthaman, S.; Jagadeesha, T. Comparative studies of variation in end mill radial rake angle and cutting conditions on cutting force and surface integrity during machining of nimonic 263. Mater. Res. Express 2020, 7, 036503. [Google Scholar] [CrossRef]
- Zain, A.M.; Haron, H.; Sharif, S. Application of GA to optimize cutting conditions for minimizing surface roughness in end milling machining process. Expert Syst. Appl. 2010, 37, 4650–4659. [Google Scholar] [CrossRef]
- Zhu, Z.; Guo, X.; Ekevad, M.; Cao, P.; Na, B.; Zhu, N. The effects of cutting parameters and tool geometry on cutting forces and tool wear in milling high-density fiberboard with ceramic cutting tools. Int. J. Adv. Manuf. Technol. 2017, 91, 4033–4041. [Google Scholar] [CrossRef]
- Liang, Z.; Li, S.; Zhou, T.; Wang, X.; Gao, P.; Zhang, D.; Teng, L. Fabrication and milling performance of micro ball-end mills with different relief angles. Int. J. Adv. Manuf. Technol. 2018, 98, 919–928. [Google Scholar] [CrossRef]
- Taylor, C.; Sims, N.; Turner, S. Process damping and cutting tool geometry in machining. IOP Conf. Ser. Mater. Sci. Eng. 2011, 26, 012009. [Google Scholar] [CrossRef]
- Siddhpura, A.; Paurobally, R. A study of the effects of friction on flank wear and the role of friction in tool wear monitoring. Aust. J. Mech. Eng. 2012, 10, 141–156. [Google Scholar] [CrossRef]
- Xue, K.; Chen, P.; Liu, W.; Zou, B.; Li, L.; Chen, W.; Wang, X.; Xu, Z. Geometric structures for Sialon ceramic solid end Mills and its performance in high-speed milling of nickel-based superalloys. Coatings 2023, 13, 1483. [Google Scholar] [CrossRef]
- Grabowski, R.; Denkena, B.; Köhler, J. Prediction of process forces and stability of end mills with complex geometries. Procedia CIRP 2014, 14, 119–124. [Google Scholar] [CrossRef][Green Version]
- Eksioglu, C.; Kilic, Z.; Altintas, Y. Discrete-time prediction of chatter stability, cutting forces, and surface location errors in flexible milling systems. J. Manuf. Sci. Eng. 2012, 134, 061006. [Google Scholar] [CrossRef]
- Suresh Kumar Reddy, N.; Venkateswara Rao, P. Selection of optimum tool geometry and cutting conditions using a surface roughness prediction model for end milling. Int. J. Adv. Manuf. Technol. 2005, 26, 1202–1210. [Google Scholar] [CrossRef]


Disclaimer/Publisher’s Note: The statements, opinions and data contained in all publications are solely those of the individual author(s) and contributor(s) and not of MDPI and/or the editor(s). MDPI and/or the editor(s) disclaim responsibility for any injury to people or property resulting from any ideas, methods, instructions or products referred to in the content. |
© 2025 by the authors. Licensee MDPI, Basel, Switzerland. This article is an open access article distributed under the terms and conditions of the Creative Commons Attribution (CC BY) license.