Abstract
Spent carbon cathode (SCC), a hazardous solid waste discharged from aluminum electrolysis, exhibits significant fluoride and cyanide leaching toxicities. Existing high-temperature disposal strategies are constrained by high investment costs for specialized equipment, low product added value, and unclear application scenarios, hindering their large-scale implementation. Consequently, substantial quantities of SCC remain underutilized, resulting in the waste of valuable carbon and fluoride components. This study focuses on the targeted conversion of valuable components in SCC through the innovative integration of simple processes, including atmospheric high-temperature roasting, deep purification, Al-based inducer addition, and pH regulation. Volatilization kinetics and solution equilibrium chemistry were used to investigate impurity removal mechanisms and to guide cryolite synthesis, respectively. The results demonstrate the successful recovery of high-purity regenerated graphite with a high carbon content, low sulfur content, and a high degree of graphitization. Simultaneously, cryolite with a high NaF/AlF3 molecular ratio was synthesized from the roasting flue gas absorption liquor by controlling ionic composition and pH. Guided by the principles of cleaner production and resource recycling, the entire recovery process generates negligible waste gas, wastewater, or solid residue emissions. In conclusion, the proposed disposal strategy achieved the targeted conversion of SCC into high-value products while mitigating environmental pollution risks, offering both environmental and economic benefits. This innovative design provides a feasible pathway for the large-scale disposal and utilization of SCC.
1. Introduction
Aluminum electrolysis cells undergo maintenance shutdowns every 5–8 years to replace damaged cathodes and other linings [1]. The resulting spent carbon cathode waste has become an unavoidable hazardous waste generated during aluminum electrolysis [2]. The high concentrations of fluorides (2.28–16.43 wt%) and cyanides (0.2–1.0 wt%) in SCC pose serious threats to the ecological environment and human health [3,4,5]. Historically, SCC has mainly been managed through open-air stockpiling and rigid landfilling. Without effective stabilization of toxic substances, this practice poses significant risks of leaching toxicity into soil and water sources [6,7]. Concurrently, SCC contains abundant graphite carbon (50–70 wt%), indicating its considerable resource potential [8,9]. Statistics show that producing 1 ton of primary aluminum generates approximately 24–30 kg of SCC [10]. In China, the primary aluminum output is projected to reach approximately 44 million tons by 2025, inevitably accompanied by large quantities of environmentally harmful SCC emissions. Therefore, the development of economical, environmentally friendly, and sustainable strategies for recovering valuable components from SCC is urgently required to promote green development in the Al electrolysis industry.
Current strategies for recovering valuable components from SCC are primarily categorized into chemical and physical separation methods. In recent years, mainstream chemical separation methods have included hydrometallurgical leaching and molten salt roasting [11,12,13]. Zhang et al. [14] employed microwave-assisted acid leaching to remove harmful components from SCC and prepared high-quality graphite with a graphitization degree of 97.61 wt% via iron-catalyzed graphitization. A previous study compared the defluorination effects of Na2CO3/Na2SiO3-assisted roasting on SCC. Under optimal parameters, the carbon contents of solids roasted with Na2CO3 and Na2SiO3 were 95.78 wt% and 86.57 wt%, respectively, while the corresponding fluoride contents were 1.4 wt% and 1.27 wt% [15]. A NaCl-Na2CO3 binary molten salt roasting system was used for SCC detoxification and carbon recovery [16]. The recovered carbon purity was 81 wt%, and the fluoride ion leaching concentration decreased from 4620 to 856 mg/L. Lv et al. [17] proposed a process combining NaOH molten-salt roasting with two-stage hydrometallurgical leaching. The regenerated graphite achieved a carbon content of 98.67 wt%, and 96.55% of the fluorine was recovered as cryolite. These studies indicate that both hydrometallurgical leaching and molten-salt roasting achieve efficient separation of valuable components through chemical reactions between the reactive medium and non-carbon impurities. However, the complex process flows limit their scalability.
Recently, high-temperature roasting has superseded flotation as the primary method for the physical separation of SCC. Zhu et al. [18] proposed microwave-assisted high-temperature roasting to remove fluorides from SCC. After microwave treatment, the graphite carbon exhibited a pitted structure, and fluorides were effectively removed, achieving a defluorination rate of 95.4% at 1500 °C. Huang et al. [19] removed fluorides and other toxic substances from SCC blocks by flash Joule heating. Multiple flash Joule heating treatments at 150 V improved the microexpanded structure while maintaining a high degree of graphitization. Previous studies have explored the technical feasibility of treating SCC using vacuum distillation [20]. Under treatment conditions of 700 °C and 60 Pa, the carbon purity increased from 47.61 wt% to 67.08 wt%, accompanied by a significant rise in calorific value. This method separates substances at high temperatures to decompose toxic components in the SCC or convert them to flue gas. However, high-temperature equipment, such as vacuum, microwave, and Joule-heating devices, is expensive. Without clearly defined economic value and application scenarios for recovered products, large-scale promotion and application are difficult. In addition, the volatilization kinetics of toxic substances during high-temperature roasting, as well as their recovery and utilization, require further clarification and supplementation.
Therefore, this study employed an external-field-free, high-temperature roasting method to treat SCC, aiming to reduce equipment costs. This study investigates the gas-phase separation mechanism of toxic substances during roasting from a kinetic perspective and designs targeted conversion pathways to transform regenerated graphite (RG) and roasting flue gas into high-value products, such as high-purity graphite (HPG) and cryolite, thereby enhancing the market value of the recovered materials. To address these technical challenges, volatilization kinetics was introduced to characterize the effect of particle size on the volatilization and separation of toxic substances. Various leaching strategies have been employed for the deep purification of regenerated graphite. Simultaneously, based on solution equilibrium chemistry, aluminum-based inducers were used to convert the fluorides in the flue gas absorption liquor into cryolite.
2. Materials and Methods
2.1. Materials
SCC was obtained from a damaged 400 kA series electrolytic cell at an aluminum electrolysis plant in Henan, China. SCC underwent successive coarse and fine crushing. Fractions with particle size ranges of 5–3 mm, 3–1 mm, 1–0.15 mm, and <0.15 mm were sieved and dried at 110 ± 10 °C for 24 h for subsequent use. All the leaching reagents, aluminum-based inducers, and pH regulators were of analytical grade.
2.2. Experimental Procedure
The recovery of valuable components from SCC involves three stages-high-temperature roasting, purification of regenerated graphite, and treatment of flue gas absorption liquor (Figure 1).
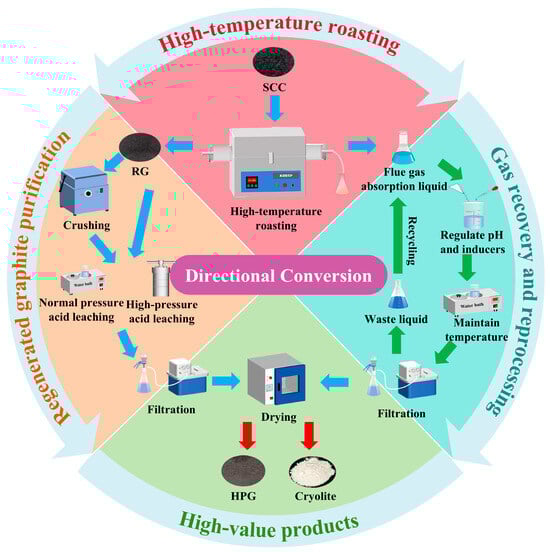
Figure 1.
Flowchart for recovering valuable components from SCC.
2.2.1. High-Temperature Roasting
A weighed amount of the SCC was placed in a lidded graphite crucible, which was then positioned in the central heating zone of the tube furnace. Under an Ar atmosphere, high-temperature roasting was conducted at specified temperatures (1300, 1400, 1500, and 1600 °C) and durations (1, 2, 3, and 4 h). A measured quantity of deionized water in a conical flask was used to absorb the roasting flue gas. After roasting, the regenerated graphite was retrieved for subsequent purification.
2.2.2. Regenerated Graphite Purification
Untreated or refined regenerated graphite was added to a polytetrafluoroethylene reaction vessel. Atmospheric and high-pressure acid leaching were performed. The detailed reaction conditions are listed in Table 1. After the acid leaching reaction was complete, multiple water extractions were performed until the filtrate reached neutrality. High-purity regenerated graphite was recovered after solid–liquid separation.

Table 1.
Deep purification schemes for regenerated graphite.
2.2.3. Flue Gas Absorption Liquor Treatment
The fluoride ion concentration and pH of the flue gas absorption liquor were measured. Subsequently, the fluoride ion concentration, aluminum-based inducer dosage, and pH were sequentially adjusted according to the scheme detailed in Table S1. Specifically, 100 mL of the absorption liquor was measured, and an aluminum-based inducer was added with stirring. The pH was then adjusted using an acidic regulator, followed by crystallization at 70 °C for 24 h. After the reaction, the cryolite product was separated by solid–liquid extraction and dried at 60 °C.
2.3. Characterization
The volatilization rate of fluorides in SCC was calculated using Equation (1):
where R is the volatilization rate (%), m1 is the mass of SCC before roasting (g), and m2 is the mass after roasting (g).
The industrial compositions of SCC and RG were determined in accordance with the Chinese non-ferrous metal industry standard (YS/T 63 [21]). Leaching solutions for RG were prepared according to the Chinese Environmental Protection Industry standard HJ/T 299-2007 [22]. The fluoride ion concentration was measured using an ion meter (Orion Versa Star Pro, Thermo Fisher Scientific, Waltham, MA, USA) coupled with a fluoride ion-selective electrode.
For RG samples with different particle size ranges (5–3, 3–1, 1–0.15, and <0.15 mm), the pore structure, specific surface area, and nitrogen adsorption–desorption isotherms were determined using a specific surface area and porosity analyzer (TriStar II 3020, Micromeritics, Norcross, GA, USA). X-ray diffraction (XRD, Ultima IV, Rigaku, Tokyo, Japan) and X-ray fluorescence spectroscopy (XRF, XRF-1800, Shimadzu, Kyoto, Japan) were used to analyze the crystal structure and elemental composition of HPG, RG, SCC, and cryolite. The microstructure and elemental distribution of the cryolite were characterized using field-emission scanning electron microscopy (FESEM) with energy-dispersive spectroscopy (EDS) (Gemini 1, Zeiss, Oberkochen, Germany; X-Max20, Oxford, High Wycombe, UK). The aluminum ion concentration in the solution was measured using inductively coupled plasma optical emission spectrometry (ICP-OES; Avio 200, PerkinElmer, Waltham, MA, USA).
2.4. Volatility Kinetics
The Arrhenius equation [23] was employed as the kinetic model, Equation (2):
where K is the rate constant, A is the pre-exponential factor (s−1), E is the activation energy (kJ/mol), R is the universal gas constant (8.314 J·mol−1·K−1), and T is the absolute temperature (K).
The volatilization rate of non-carbon impurities in the SCC is given by Equation (3):
where α is the conversion rate, n is the reaction order, and t is the roasting time.
At any given time and temperature, the conversion rate α is defined as the ratio of the instantaneous volatilization rate Rt to the maximum achievable rate Rmax at that temperature, as shown in Equation (4):
where α represents the conversion rate of the reaction; Rt represents the volatilization rate (%) of non-carbon impurities in SCC at that moment; Rmax represents the maximum volatilization rate (%) of non-carbon impurities in SCC at that temperature.
To determine the reaction order n of the mechanistic function f(α), the kinetic mechanistic function G(α) was introduced, as shown in Equation (5):
The functions G(α) and f(α) corresponding to different reaction orders n are listed in Table 2.
Table 2.
Correspondence between reaction order and f(α) and G(α).
The conversion rate α versus time t was derived based on the relationship between volatilization rate data and roasting time for different particle sizes, temperatures, and durations. Finally, a kinetic model for the volatilization of non-carbon impurities in SCC was established.
3. Results and Discussion
3.1. Treatment of SCC by High-Temperature Roasting
3.1.1. Effect of Roasting Parameters on the Volatility of Non-Carbon Impurities
During high-temperature roasting, the noncarbon impurities in the SCC undergo phase changes and detach from the carbon matrix. The effects of roasting temperature, particle size, and duration on the volatilization rate of noncarbon impurities are shown in Figure 2. For a given particle size, the volatilization rate increased progressively with higher roasting temperatures and longer roasting durations (Figure 2). The maximum volatilization rates for the 5–3, 3–1, 1–0.15, and <0.15 mm fractions were 30.24, 28.59, 27.74, and 33.56 wt%, respectively, achieved at 1600 °C after 4 h. This trend is likely attributable to penetration of residual noncarbon impurities deep into the SCC crevices during roasting. Their phase transformations require a stronger driving force and a longer diffusion path. Thus, higher temperatures and longer times provide the necessary energy and pathways to promote impurity volatilization [24,25].
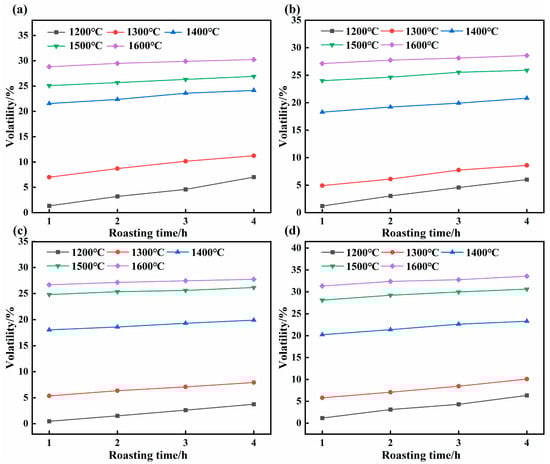
Figure 2.
Effect of roasting parameters on the volatilization rate of non-carbon impurities: (a) 5–3 mm, (b) 3–1 mm, (c) 1–0.15 mm, and (d) <0.15 mm.
Consequently, at a fixed temperature, the volatilization rate increases with prolonged roasting time. Under optimal conditions of particle size <0.15 mm, 1600 °C, and 4 h, the non-carbon impurity volatilization rate reached 33.56 wt%. Mechanical crushing exposes the encapsulated impurities, enhancing heat transfer in the roasting environment and thereby facilitating their phase migration [26,27]. Therefore, both increasing the temperature and extending the time are beneficial for the gas-phase volatilization of non-carbon impurities in SCC.
3.1.2. Volatility Kinetics Analysis
For SCC of different particle sizes (5–3, 3–1, 1–0.15, and <0.15 mm), the relationship between reaction conversion α and time at 1400 °C was obtained from the data in Figure 2 and Equation (4). The integral function G(α) corresponding to various reaction orders n (0, 1/2, 2/3, 1, 2) from Table 2 was then plotted against roasting time t, as shown in Figure S1. The linearity between G(α) and t for different n was not visually distinct from Figure S1a,c,e,g. Therefore, linear fitting was performed, and the results are summarized in Table 3.
Table 3.
Fitting results of various mechanistic functions at 1400 °C for different particle sizes.
As shown in Table 3, for a reaction order n = 1 at 1400 °C, the mechanistic functions for all four particle sizes exhibited the best fit. Thus, the volatilization kinetics for SCC at 1400 °C can be described by a first-order model. Since roasting temperature does not alter the reaction mechanism within the investigated temperature range, the kinetics at 1200, 1300, 1500, and 1600 °C also followed first-order behavior [28]. Subsequently, the first-order integral function G(α) was used to fit the data for all particle sizes across different roasting temperatures; the results are presented in Figure S2 and Table 4.
Table 4.
Fitting results of the first-order mechanistic function for different particle sizes and roasting temperatures.
As shown in Table 4, the linear fit of the four SCC particle sizes across the high-temperature roasting range (1200 °C, 1300 °C, 1400 °C, 1500 °C, 1600 °C) is good. According to lnK = lnA-E/RT, lnK has a linear relationship with 1/T. Using the relationship between K and T in Table 4, a linear fit of lnK versus 1/T was performed, and the results are shown in Figure S3. Figure S3 shows that the volatilization kinetics for all four SCC particle sizes follow first-order kinetics and that, as particle size decreases, the activation energy for the volatilization of non-carbon impurities during high-temperature roasting decreases. From the perspective of reaction activation energy, the order of priority for the volatilization of non-carbon impurities in the four SCC particle sizes is <0.15 mm > 1–0.15 mm > 3–1 mm > 5–3 mm.
3.1.3. Mechanism of Toxic Substance Removal in SCC During High-Temperature Roasting
The mechanism of toxic substance removal from SCC during roasting is illustrated in Figure 3. The lubricating nature of graphite in SCC causes the electrolytes to concentrate into finer particles during crushing [29]. Consequently, the initial ash content in SCC increased as the particle size decreased (Figure 3a). As the energy required for the phase transformation of a given volatile impurity is constant, finer SCC particles with a higher initial ash content exhibit a relatively lower ash removal efficiency and higher residual ash after roasting (Figure 3a). Figure 3b shows that after roasting, the fluoride leaching toxicity of RG decreased by over 99% for all particle sizes, with the absolute leachate concentration decreasing as particle size increased (20.62 → 15.71 → 7.89 → 5.82 mg/L). This trend is consistent with the ash content results (Figure 3a). Notably, the leaching toxicity of all RG samples was significantly below the Chinese safety threshold (GB5085.3-2007 [30]) of 100 mg/L.
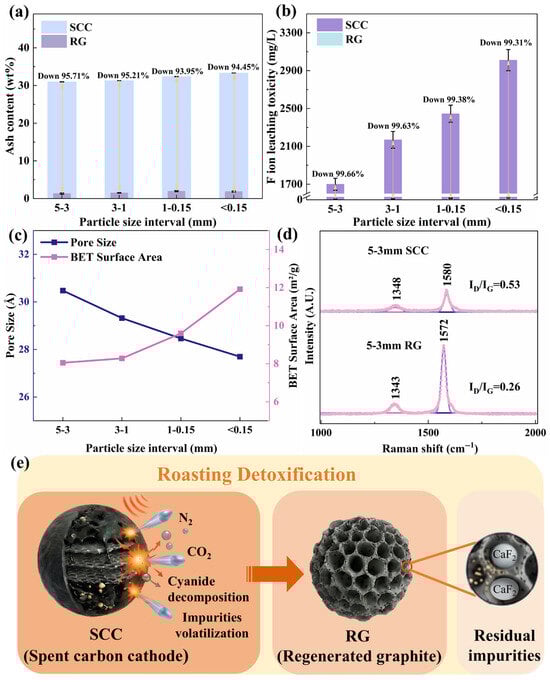
Figure 3.
Removal mechanism of toxic substances from SCC during high-temperature roasting: (a) Ash content, (b) Leaching toxicity, (c) Pore size and specific surface area, (d) Graphitization degree, and (e) Detoxification pathway.
Figure 3c indicates that the pore structure of all regenerated graphite samples was mesoporous, with the pore volume gradually increasing with increasing particle size. This provides diffusion pathways for the volatilization of embedded non-carbon impurities, which is consistent with the ash and leaching toxicity trends (Figure 3a,b). The pore-size distribution and adsorption–desorption isotherms of RG (Figure S4) showed pores primarily in the 10–80 Å range, with a dominant peak at 15–20 Å. Smaller particles exhibited greater adsorption capacity, and all the adsorption–desorption curves displayed type IV characteristics with H3 hysteresis loops, indicating the presence of slit-shaped mesopores with a non-uniform size distribution [31,32]. Simultaneously, the specific surface area of the regenerated graphite decreased as the SCC particle size increased. Under the same roasting conditions and impurity content, a larger specific surface area was beneficial for the thermal exchange and phase transformation of volatile impurities. The results of the volatilization kinetics support this view.
Figure 3d confirms that high-temperature roasting significantly enhanced the graphitization degree of RG (ID/IG: 0.53 → 0.26). As depicted in Figure 3e, the external heat was gradually transferred from the particle surface to the interior during roasting. Low-melting-point impurities, such as NaF and Na3AlF6, absorb heat, vaporize, escape through internal pores, and are subsequently captured in the absorption liquor for cryolite synthesis. However, high-melting-point impurities, such as CaF2, cannot be volatilized under atmospheric-pressure roasting conditions (Figure S5). Therefore, a deep purification step was introduced to remove residual impurities, further increasing the product value. Additionally, by incorporating a low-temperature oxidation zone, highly toxic cyanides (NaCN, Na3Fe(CN)6, and Na4Fe(CN)6) in the SCC were oxidized to N2 and CO2. Overall, high-temperature roasting effectively removed most of the toxic substances from the SCC.
3.2. Purification of Regenerated Graphite
As shown in Figure 3a, most of the impurities were removed during roasting. However, the carbon content of the resulting RG remains relatively low because of the persistence of nonvolatile high-melting-point impurities (Figure S5). Therefore, RG derived from the four SCC particle size fractions was subjected to deep purification via atmospheric pressure and high-pressure acid leaching. The effect of secondary mechanical comminution on the purification efficiency was also investigated (Figure 4). Both leaching methods showed significantly improved efficiencies after comminution (Figure 4a,b). Secondary crushing further reduced particle size and increased specific surface area, thereby shortening diffusion pathways during leaching and increasing the contact area and number of reactive sites for acid attack [2,33,34]. Under identical leaching conditions, the final carbon content of the purified graphite (whether comminuted or not) decreased with decreasing initial particle size. The regenerated graphite with a higher initial carbon content yielded a product with a correspondingly higher purity, which is consistent with the roasting results in Figure 3a.
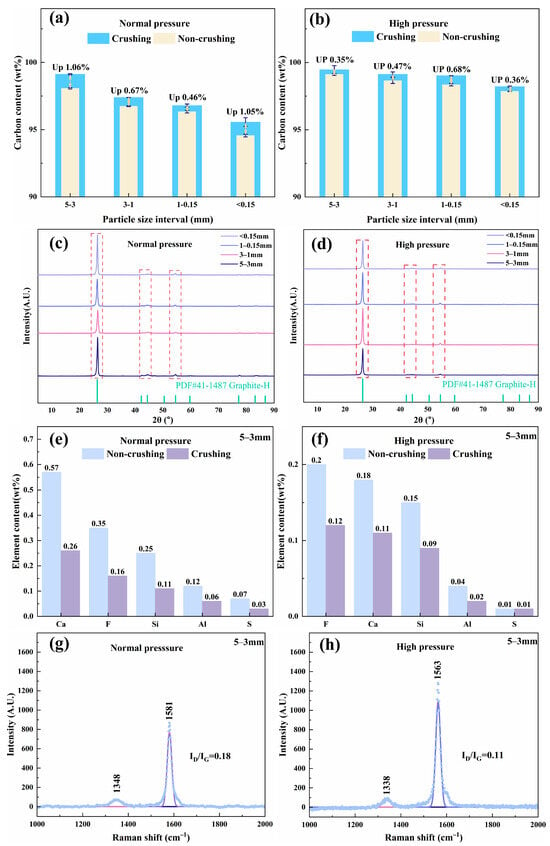
Figure 4.
Deep purification effects of RG: (a,b) carbon content, (c,d) phase composition, (e,f) impurity element content, and (g,h) degree of graphitization.
Furthermore, under the same comminution conditions, high-pressure leaching outperformed atmospheric leaching in terms of the purification efficiency. Higher pressures provided a stronger driving force for acid penetration into the particle interior, enhancing the dissolution of impurities [35]. For RG from 5 to 3 mm SCC, after secondary comminution and high-pressure acid leaching, high-purified regenerated graphite (HPG) achieved a carbon content of 99.46 wt%.
Figure 4c,d show that after deep purification, no impurity diffraction peaks were detected in the XRD patterns of RG from any particle size fraction, confirming the effective removal of residual impurities via secondary comminution and acid leaching. For the optimal 5–3 mm fraction, high-pressure acid leaching removed impurity elements (Ca, F, Si, Al, and S) more effectively than atmospheric leaching (Figure 4e,f). Secondary comminution further promoted the removal of impurities. These results are consistent with the carbon content data (Figure 4a,b). Moreover, under optimal purification conditions, the ID/IG ratio of PRG decreased from 0.18 to 0.11, indicating a further increase in the degree of graphitization (Figure 4g,h). The resulting HPG, possessing high carbon content (99.46 wt%), high graphitization (ID/IG: 0.11), and low sulfur content (0.01 wt%), exhibits significant potential for high-value applications.
3.3. Flue Gas Absorption Liquid Treatment
3.3.1. Ion Balance Calculation
During the SCC roasting, the main components absorbed by the flue gas solution were F and Na. Al-based activators were added based on elemental supplementation to provide an Al source for the synthesis of cryolite products. The relevant reactions involving F, Na, and Al ions in the solution system during cryolite synthesis are listed in Table S2 [1,36,37,38].
The above equations primarily include water dissociation (Equation (6)), hydrofluoric acid dissociation (Equations (7) and (8)), sodium fluoride complexation (Equation (9)), aluminum hydrolysis (Equations (10)–(13)), aluminum fluoride hydrolysis (Equations (14)–(19)), and cryolite synthesis (Equations (20)–(24)). The material and ion balances for F, Na, and Al were proposed using the equations above (Table S3) [11].
On this basis, the F, Na, and Al ion concentrations in the flue gas absorption solution (0.1053, 0.1214, and 0.0244 mol/L, respectively) were input into the ion equilibrium equations for calculation. The effect of the pH on the ion equilibrium distribution in the solution system is shown in Figure 5. In strongly alkaline conditions (pH > 9), free F− dominates, which is unfavorable for cryolite precipitation. As the pH decreased, the concentration of AlF63− increased, reaching a maximum near pH 9. With further acidification, AlF63− decreases while AlF3 and AlF4− become more prevalent. In strongly acidic media (pH < 3), AlF3 became the dominant species, peaking at approximately pH 1 before declining as AlF2+ and HF increased. Based on this analysis, pH 9 was selected as the target for cryolite synthesis.
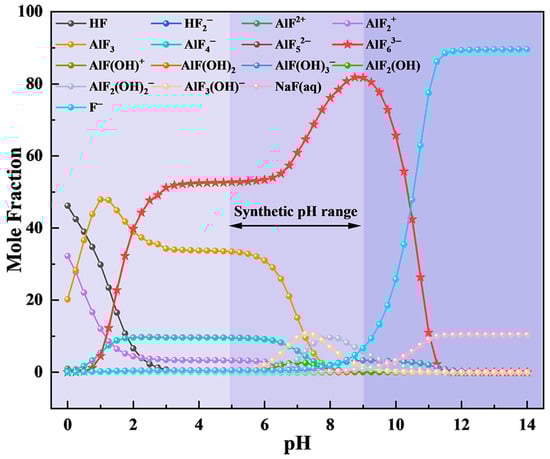
Figure 5.
Effect of pH on the ionic equilibrium distribution of exhaust waste liquid.
3.3.2. Cryolite Synthesis
The effects of the F− ion concentration, inducer addition, and pH of the flue gas absorption solution on cryolite were investigated, with the specific schemes and results shown in Table S1 and Figure 6, respectively. Characteristic XRD peaks of Na3AlF6 were absent at low F− concentrations (Figure 6a). As the F− concentration increased, these peaks intensified (Figure 6b), indicating their significant influence on the precipitation yield and Al utilization (Figure 6c). While lower F− concentrations gave relatively high yields and Al utilization, the product crystallinity was poor (Figure 6a). Excessively high F− concentrations led to a decline in peak intensity. Therefore, 2000 mg/L was selected as the optimal F− concentration.
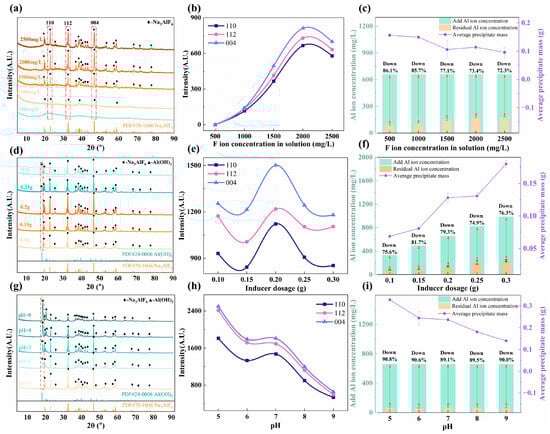
Figure 6.
Influence of parameters on cryolite synthesis: (a–c) F− ion concentration, (d–f) Inducer dosage, and (g–i) pH.
With increasing inducer dosage, the Na3AlF6 peak intensity initially increased (Figure 6d,e). However, beyond 0.2 g, the diffraction peaks of Al(OH)3 appeared and grew stronger, accompanied by a decrease in the Na3AlF6 peaks. The Al-based inducer hydrolyzed in water, increasing the pH and favoring the formation of Al(OH)3 over Na3AlF6 [39]. At the same time, an excessive amount of the inducer combined with a high concentration of Al ions facilitated the combination of Al3+ with OH− to form Al(OH)3 [39,40]. Both the amount of sedimentation and Al utilization were positively correlated with the amount of added inducer (Figure 6f). However, as shown in Figure 6d, an excessively high amount of inducer led to the production of Al(OH)3. Therefore, 0.2 g was chosen as the optimal amount of the inducer.
Figure 6g shows that as the pH increased from 5 to 9, the product phase shifted from pure Na3AlF6 to a mixture with Al(OH)3, with the latter peak strengthening. This aligns with the known stability of cryolite under acidic conditions and that of aluminum hydroxide in alkaline media [41,42]. Correspondingly, Na3AlF6 peak intensity diminished with increasing pH (Figure 6h). Both the precipitation yield and Al utilization were optimal at pH 5 (Figure 6i).
3.3.3. Characterization of Cryolite Products
The cryolite was synthesized under the optimal parameter combination of F− concentration (2000 mg/L), inducer addition (0.2 g), and pH (5), and compared with commercial products. The results are shown in Figure 7.
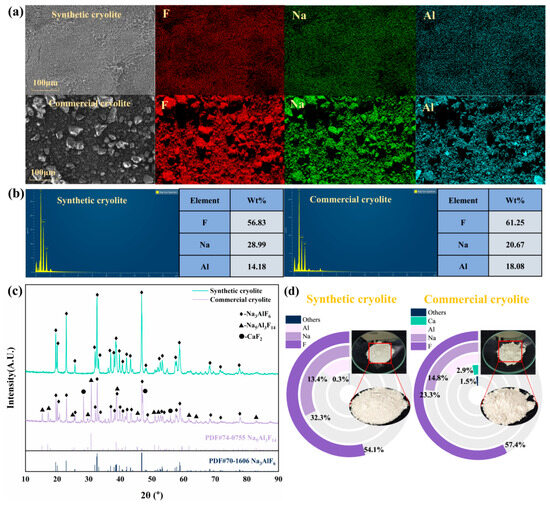
Figure 7.
Comparison of physicochemical properties of synthesized cryolite and commercial cryolite under optimal conditions: (a) microstructure and element distribution; (b) elemental composition; (c) phase composition; and (d) elemental composition.
Figure 7a shows that there are significant differences in the microscopic morphology between the synthetic and commercial cryolites. The synthesized cryolite consisted of uniformly sized powdery particles, whereas the commercial product contained irregular, randomly distributed granules. EDS mapping confirmed the homogeneous distribution of Al, F, and Na in the synthesized material. Its elemental composition met the Chinese standard GB/T 4291-2017 [43] requirements (F ≥ 52 wt%, Al ≥ 12 wt%, Na ≤ 33.0 wt%). The molecular ratio (NaF/AlF3) of the synthesized cryolite was 2.40, which was significantly higher than that of the commercial product (1.34). XRD analysis (Figure 7c) revealed a pure Na3AlF6 phase for the synthesized material, whereas the commercial cryolite contained minor impurities (Na5Al3F14, CaF2).
Simultaneously, the synthesized cryolite exhibited higher crystallinity, as indicated by sharper diffraction peaks. XRF analysis (Figure 7d) showed the commercial product contained 2.9 wt% Ca and 1.5 wt% other impurities. In contrast, the synthesized cryolite had only 0.3 wt% total impurities and a Na:Al ratio closer to the theoretical 3:1. Overall, it demonstrated superior purity, stoichiometry, crystallinity, and particle uniformity compared with the commercial benchmark, highlighting its high market value.
3.4. Analysis of Economic and Environmental Benefits
Based on the proposed strategy for the targeted conversion of valuable components in SCC, the carbon component was transformed into HPG with high carbon content, high graphitization, and low sulfur content through high-temperature roasting and deep purification. Simultaneously, the fluorine component was selectively converted into cryolite with a high NaF/AlF3 molecular ratio through inducer addition and pH regulation (Figure 8). Overall, HPG and cryolite demonstrate significant potential for high-value utilization and market prospects. Additionally, the targeted conversion of valuable components in SCC into high-value products helps offset the disposal costs proposed in this strategy (Tables S4 and S5). Furthermore, atmospheric high-temperature roasting is associated with lower equipment investment and operational costs than vacuum, microwave, or Joule heating. From the perspective of the market value of the recovered products and the investment cost of the core equipment, the proposed strategy shows significant economic benefits (Table S6).
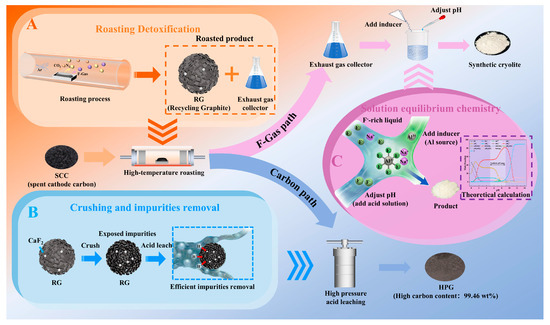
Figure 8.
Economic benefit analysis. (A) Roasting detoxification; (B) Crushing and impurities removal; (C) Solution equilibrium chemistry.
In addition, during high-temperature roasting, low-melting-point fluorides undergo phase transformations and volatilization. Fluoride-containing roasting gases were captured using an absorbent solution. Subsequently, under the influence of aluminum-based inducers and pH control, these products were successfully converted into cryolite products. These innovative designs prevented secondary pollution during the migration and transformation of fluorides. Furthermore, based on the concept of cleaner production, the acidic solution generated from deep purification of recycled graphite can be used for pH regulation. The solution remaining after the cryolite extraction can be recycled for gas absorption. Throughout the targeted conversion process, negligible wastewater, exhaust gas, or residue was discharged, demonstrating significant environmental benefits.
4. Conclusions
The disposal strategy proposed in this study successfully achieved the targeted conversion of valuable carbon/fluorine components in SCC through innovative coupling of various simple processes.
- (1)
- Appropriately increasing the particle size, roasting temperature, and roasting duration are all beneficial for the phase transformation and volatilization of noncarbon impurities in SCC. The kinetic results indicated that the activation energy for the volatilization of non-carbon impurities during high-temperature roasting decreased with decreasing particle size. It should be noted that the reason why the optimization of high-temperature roasting parameters is opposite to the volatilization kinetics results in terms of particle size is the non-uniform distribution of non-carbon impurities in SCC of different particle sizes. With the same roasting parameters and impurity content, reducing particle size increased the specific surface area, facilitating heat transfer and phase transformation of noncarbon impurities. However, high-melting-point impurities (such as CaF2) are difficult to volatilize and remove during high-temperature roasting under normal pressure.
- (2)
- The combination of secondary mechanical crushing and high-pressure acid leaching was more conducive to the deep purification of recycled graphite. The increased specific surface area and high pressure jointly enhanced the reaction efficiency between non-carbon impurities and the reaction medium. Under the optimal deep purification parameter combination, high-purity recycled graphite with a carbon content of 99.46 wt% was successfully recovered. At the same time, the high-purity recycled graphite also exhibits a high graphitization degree (ID/IG: 0.11) and a low sulfur content (0.01 wt%). Accordingly, recycled graphite with excellent physicochemical properties has a significantly higher added value and potential for multi-scenario applications.
- (3)
- Under the guidance of the solution equilibrium chemistry, Na and F in the flue gas absorption liquid are driven and directed to form Na3AlF6 through Al-based inducers and pH regulation. The results showed that the synthesized cryolite exhibited a high NaF/AlF3 molecular ratio, uniform particle size distribution, and qualified elemental content, demonstrating its high added value and market application prospects. In addition, deeply purified cryolite extraction wastewater can be used in stages for acid-base regulation and flue gas absorption, thereby avoiding the environmental pollution risks posed by acidic fluoride-containing waste liquids.
- (4)
- Based on the concept of a circular economy, the feasibility of using high-purity graphite to prepare prebaked anodes and synthetic cryolite products as raw materials for Al electrolysis will be further explored in future research. The objective is to establish a targeted conversion and resource-recycling pathway for valuable components from hazardous waste generated during the aluminum electrolysis production process.
Supplementary Materials
The following supporting information can be downloaded at https://www.mdpi.com/article/10.3390/min16030300/s1, Figure S1: RG adsorption-desorption curves and pore size distribution: (a) 5–3 mm, (b) 3–1 mm, (c) 1–0.15 mm, (d) <0.15 mm; Figure S2: Linear fitting plots of G(α) versus t at different roasting temperatures: (a) 5–3 mm, (b) 3–1 mm, (c) 1–0.15 mm, (d) <0.15 mm; Figure S3: Linear fitting plots of lnK versus 1/T for different particle sizes: (a) 5–3 mm, (b) 3–1 mm, (c) 1–0.15 mm, (d) <0.15 mm; Figure S4: RG adsorption-desorption curves and pore size distribution: (a) 5–3 mm, (b) 3–1 mm, (c)1–0.15 mm, (d) <0.15 mm; Figure S5: XRD of SCC and RG; Table S1: Experimental scheme for optimization of synthetic cryolite parameters. Table S2: Possible reactions of Na, Al, and F ions in solution; Table S3: The material and ion balances for F, Na, and Al; Table S4: Price of electricity, water, and chemical reagents; Table S5: Economic benefit analysis; Table S6: Comparison of economic efficiency with mature technologies (microwave, vacuum roasting, molten salt).
Author Contributions
Y.T.: Conceptualization, Formal analysis, Writing—Original Draft. L.Z.: Formal analysis, Validation, Investigation. Z.C.: Methodology, Investigation. J.Z.: Investigation. W.L.: Investigation. Z.Y.: Writing—Review and Editing, Supervision. Q.Z.: Software, Investigation. All authors have read and agreed to the published version of the manuscript.
Funding
This work was supported by the National Natural Science Foundation of China (52464055), the China Postdoctoral Science Foundation (2024M760673), the Guizhou Provincial Science and Technology Projects (NO. [2023] General212, NO. [2023] General103, NO. LH [2024]Major028, and KJZY [2025]001), and the Guizhou Provincial Department of Education Science and Technology Projects (NO. [2023]057).
Data Availability Statement
The data presented in this study are available on request from the corresponding author.
Conflicts of Interest
The authors declare that they have no known competing financial interests or personal relationships that could have appeared to influence the work reported in this paper.
References
- Lisbona, D.F.; Somerfield, C.; Steel, K.M. Leaching of Spent Pot-Lining with Aluminium Nitrate and Nitric Acid: Effect of Reaction Conditions and Thermodynamic Modelling of Solution Speciation. Hydrometallurgy 2013, 134–135, 132–143. [Google Scholar] [CrossRef]
- Yao, Z.; Zhong, Q.; Xiao, J.; Ye, S.; Tang, L.; Wang, Z. Efficient Separation of Fluoride and Graphite Carbon in Spent Cathode Carbon from Aluminum Electrolysis by Mechanical Activation Assisted Alkali Fusion Treatment. Miner. Eng. 2021, 161, 106717. [Google Scholar] [CrossRef]
- Chen, Y.; Li, P.; Bu, X.; Chehreh Chelgani, S.; Kong, Y.; Liang, X. Resource Utilization Strategies for Spent Pot Lining: A Review of the Current State. Sep. Purif. Technol. 2022, 300, 121816. [Google Scholar] [CrossRef]
- He, L.; Tu, C.; He, S.; Long, J.; Sun, Y.; Sun, Y.; Lin, C. Fluorine Enrichment of Vegetables and Soil around an Abandoned Aluminium Plant and Its Risk to Human Health. Environ. Geochem. Health 2021, 43, 1137–1154. [Google Scholar] [CrossRef]
- Sleap, S.B.; Turner, B.D.; Sloan, S.W. Kinetics of Fluoride Removal from Spent Pot Liner Leachate (SPLL) Contaminated Groundwater. J. Environ. Chem. Eng. 2015, 3, 2580–2587. [Google Scholar] [CrossRef]
- Andrade-Vieira, L.F.; Palmieri, M.J.; Davide, L.C. Effects of Long Exposure to Spent Potliner on Seeds, Root Tips, and Meristematic Cells of Allium Cepa L. Environ. Monit. Assess. 2017, 189, 489. [Google Scholar] [CrossRef]
- Sun, G.; Zhang, G.; Liu, J.; Xie, W.; Evrendilek, F.; Buyukada, M. (Co-)Combustion Behaviors and Products of Spent Potlining and Textile Dyeing Sludge. J. Clean. Prod. 2019, 224, 384–395. [Google Scholar] [CrossRef]
- Yang, K.; Gong, P.; Tian, Z.; Lai, Y.; Li, J. Recycling Spent Carbon Cathode by a Roasting Method and Its Application in Li-Ion Batteries Anodes. J. Clean. Prod. 2020, 261, 121090. [Google Scholar] [CrossRef]
- Liu, F.; Xie, M.; Liu, W.; Zhao, H. Footprint of Harmful Substances in Spent Pot Lining of Aluminum Reduction Cell. Trans. Nonferrous Met. Soc. China 2020, 30, 1956–1963. [Google Scholar] [CrossRef]
- Mazumder, B.; Devi, S.R. Adsorption of Oils, Heavy Metals and Dyes by Recovered Carbon Powder from Spent Pot Liner of Aluminum Smelter Plant. J. Environ. Sci. Eng. 2008, 50, 203–206. [Google Scholar]
- Yao, Z.; Zhong, Q.; Xiao, J.; Ye, S.; Tang, L.; Zhang, Z. An Environmental-Friendly Process for Dissociating Toxic Substances and Recovering Valuable Components from Spent Carbon Cathode. J. Hazard. Mater. 2021, 404, 124120. [Google Scholar] [CrossRef]
- Yang, K.; Li, J.; Huang, W.; Zhu, C.; Tian, Z.; Zhu, X.; Fang, Z. A Closed-Circuit Cycle Process for Recovery of Carbon and Valuable Components from Spent Carbon Cathode by Hydrothermal Acid-Leaching Method. J. Environ. Manag. 2022, 318, 115503. [Google Scholar] [CrossRef]
- Meng, L.; Hao, T.; Xu, E.; Miao, Z.; Jiang, X.; Zhao, S.; Wang, H.; Song, Z. Green and Efficient Separation of Fluorine from Spent Aluminum Electrolyte by Aluminum Sulfate Solution: Leaching Behavior and Mechanism. Sep. Purif. Technol. 2025, 357, 130089. [Google Scholar] [CrossRef]
- Zhang, X.; Xu, L.; Ren, Y.; Xie, C.; Wei, Q.; Shu, J. Graphitization Transformation of Aluminum Electrolytic Spent Carbon Cathode. Ceram. Int. 2024, 50, 32118–32128. [Google Scholar] [CrossRef]
- Zhang, B.; Zhu, C.; Zhou, S.; Wei, Y.; Li, B.; Wang, H. Defluoridation of Spent Cathode Carbon Using Molten Salt Assisted Roasting. Sep. Purif. Technol. 2025, 356, 129885. [Google Scholar] [CrossRef]
- Li, B.; Ding, Y.; Jiao, Y.; Xu, F.; Wang, X.; Zheng, F.; Zou, J.; Gao, Q.; Hu, H. A Sustainable Strategy for Spent Cathode Carbon Blocks Hazardous Waste Recycling Using Binary Molten Salt Thermal Treatment. J. Therm. Sci. 2024, 33, 1082–1093. [Google Scholar] [CrossRef]
- Lv, X.; Sun, X.; Bu, W.; Tan, X.; Zhu, J.; Han, Z. An Efficient Recycling Process of Spent Cathode Carbon Blocks via Low Temperature Molten Salt Roasting and Two Stage Leaching. Sep. Purif. Technol. 2025, 361, 131566. [Google Scholar] [CrossRef]
- Zhu, Z.; Xu, L.; Han, Z.; Liu, J.; Zhang, L.; Yang, C.; Xu, Z.; Liu, P. Defluorination Study of Spent Carbon Cathode by Microwave High-Temperature Roasting. J. Environ. Manag. 2022, 302, 114028. [Google Scholar] [CrossRef]
- Huang, P.; Zhu, R.; Zhang, X.; Zhang, W. A Milliseconds Flash Joule Heating Method for the Regeneration of Spent Cathode Carbon. J. Environ. Sci. Health Part A 2022, 57, 33–44. [Google Scholar] [CrossRef] [PubMed]
- Li, N.; Jiang, Y.; Lv, X.; Gao, L.; Chattopadhyay, K. Vacuum Distillation-Treated Spent Potlining as an Alternative Fuel for Metallurgical Furnaces. JOM 2019, 71, 2978–2985. [Google Scholar] [CrossRef]
- YS/T 63:2021; Test Methods for Carbonaceous Materials Used for Aluminium Production. Ministry of Industry and Information Technology of the People’s Republic of China: Beijing, China, 2021.
- HJ/T 299-2007; Solid Waste—Extraction Procedure for Leaching Toxicity—Sulphuric Acid and Nitric Acid Method. State Environmental Protection Administration of the People’s Republic of China: Beijing, China, 2007.
- Frugier, P.; Godon, N.; Vernaz, E.; Larché, F. Influence of Composition Variations on the Initial Alteration Rate of Vitrified Domestic Waste Incineration Fly-Ash. Waste Manag. 2002, 22, 137–142. [Google Scholar] [CrossRef] [PubMed]
- Xie, M.; Zhao, H.; Wu, Z.; Liu, W.; Li, R.; Liu, F. Study on Kinetics of Vacuum Heat Treatment Process of the Spent Cathode Carbon Blocks from Aluminum Smelters. J. Sustain. Metall. 2020, 6, 715–723. [Google Scholar] [CrossRef]
- Zhu, Z.; Xu, L.; Han, Z.; Liu, J.; Zhang, L.; Tian, S.; Xu, Y.; Koppala, S. Optimization of Response Surface Methodology (RSM) for Defluorination of Spent Carbon Cathode (SCC) in Fire-Roasting Aluminum Electrolysis. Miner. Eng. 2022, 182, 107565. [Google Scholar] [CrossRef]
- Chen, Z.; Chen, S.; Dai, W.; Wang, Y.; Evrendilek, F.; Liu, J.; Liang, G.; Zhong, S.; Yang, Z.; Zhang, G.; et al. Insights into Optimal Gas-Ash-Energy Nexus: Oxy-Steam Combustion of Spent Pot Lining. J. Clean. Prod. 2023, 425, 138707. [Google Scholar] [CrossRef]
- Xie, M.; Li, R.; Zhao, H.; Liu, W.; Lu, T.; Liu, F. Detoxification of Spent Cathode Carbon Blocks from Aluminum Smelters by Joint Controlling Temperature-Vacuum Process. J. Clean. Prod. 2020, 249, 119370. [Google Scholar] [CrossRef]
- Padilla, R.; Aracena, A.; Ruiz, M.C. Reaction Mechanism and Kinetics of Enargite Oxidation at Roasting Temperatures. Metall. Mater. Trans. B 2012, 43, 1119–1126. [Google Scholar] [CrossRef]
- Li, K.; Lan, X.; Gao, J.; Guan, W.; Li, X.; Shi, A.; Guo, Z. Efficient Recovery of Carbon and Electrolyte from Spent Cathode Carbon Block via Supergravity-Enhanced Separation. Sep. Purif. Technol. 2026, 383, 136272. [Google Scholar] [CrossRef]
- GB 5085.3-2007; Identification Standard for Hazardous Wastes—Identification for Leaching Toxicity. State Environmental Protection Administration of the People’s Republic of China, General Administration of Quality Supervision, Inspection and Quarantine of the People’s Republic of China: Beijing, China, 2007.
- Wang, M.; Tan, Q.; Li, J. Unveiling the Role and Mechanism of Mechanochemical Activation on Lithium Cobalt Oxide Powders from Spent Lithium-Ion Batteries. Environ. Sci. Technol. 2018, 52, 13136–13143. [Google Scholar] [CrossRef]
- Ruan, S.; He, X.; Huang, H.; Gan, Y.; Xia, Y.; Zhang, J.; Wan, W.; Wang, C.; Xia, X.; Zhang, W. Innovative Approaches of Porous Carbon Materials Derived from Energy Waste and Their Electrochemical Properties. Energy Mater. 2025, 5, 500066. [Google Scholar] [CrossRef]
- Tan, Q.; Deng, C.; Li, J. Enhanced Recovery of Rare Earth Elements from Waste Phosphors by Mechanical Activation. J. Clean. Prod. 2017, 142, 2187–2191. [Google Scholar] [CrossRef]
- Zhang, Y.; Zheng, S.; Du, H.; Xu, H.; Zhang, Y. Effect of Mechanical Activation on Alkali Leaching of Chromite Ore. Trans. Nonferrous Met. Soc. China 2010, 20, 888–891. [Google Scholar] [CrossRef]
- Wu, D.; Wang, D.; Liu, Z.; Rao, S.; Zhang, K. Selective Recovery of Lithium from Spent Lithium Iron Phosphate Batteries Using Oxidation Pressure Sulfuric Acid Leaching System. Trans. Nonferrous Met. Soc. China 2022, 32, 2071–2079. [Google Scholar] [CrossRef]
- Lisbona, D.F.; Somerfield, C.; Steel, K.M. Treatment of Spent Pot-Lining with Aluminum Anodizing Wastewaters: Selective Precipitation of Aluminum and Fluoride as an Aluminum Hydroxyfluoride Hydrate Product. Ind. Eng. Chem. Res. 2012, 51, 12712–12722. [Google Scholar] [CrossRef]
- Lisbona, D.F.; Somerfield, C.; Steel, K.M. Leaching of Spent Pot-Lining with Aluminum Anodizing Wastewaters: Fluoride Extraction and Thermodynamic Modeling of Aqueous Speciation. Ind. Eng. Chem. Res. 2012, 51, 8366–8377. [Google Scholar] [CrossRef]
- Ntuk, U.; Tait, S.; White, E.T.; Steel, K.M. The Precipitation and Solubility of Aluminium Hydroxyfluoride Hydrate between 30 and 70 °C. Hydrometallurgy 2015, 155, 79–87. [Google Scholar] [CrossRef]
- Mahinroosta, M.; Allahverdi, A. Pilot-Scale Valorization of Hazardous Aluminum Dross into γ-Al2O3 Nanoadsorbent for Efficient Removal of Fluoride. Environ. Technol. Innov. 2021, 23, 101549. [Google Scholar] [CrossRef]
- Tropenauer, B.; Klinar, D.; Golob, J. Improved Understanding of Sodium Hydroxide Concentration Role and Kinetic Model of Cryolite Reactive Extraction in Cathode Spent Pot Linings. Pol. J. Chem. Technol. 2021, 23, 37–44. [Google Scholar] [CrossRef]
- Cao, X.; Peng, J.; Dong, W.; Li, Y.; Wang, Y.; Di, Y. Review on the Preparation of Cryolite from Industry Waste Containing Fluorine. J. Sustain. Metall. 2024, 10, 419–434. [Google Scholar] [CrossRef]
- Wan, B.; Li, W.; Sun, W.; Liu, F.; Chen, B.; Xu, S.; Chen, W.; Yi, A. Synthesis of Cryolite (Na3AlF6) from Secondary Aluminum Dross Generated in the Aluminum Recycling Process. Materials 2020, 13, 3871. [Google Scholar] [CrossRef] [PubMed]
- GB/T 4291-2017; Synthetic Cryolite. General Administration of Quality Supervision, Inspection and Quarantine of the People’s Republic of China, Standardization Administration of the People’s Republic of China: Beijing, China, 2017.


Disclaimer/Publisher’s Note: The statements, opinions and data contained in all publications are solely those of the individual author(s) and contributor(s) and not of MDPI and/or the editor(s). MDPI and/or the editor(s) disclaim responsibility for any injury to people or property resulting from any ideas, methods, instructions or products referred to in the content. |
© 2026 by the authors. Licensee MDPI, Basel, Switzerland. This article is an open access article distributed under the terms and conditions of the Creative Commons Attribution (CC BY) license.