Article

Microwave-Assisted Acid Activation of Clays Composed of 2:1 Clay Minerals: A Comparative Study

1
Department of Inorganic Chemistry, Crystallography and Mineralogy, Facultad de Ciencias, Campus de Teatinos s/n, Universidad de Málaga, 29071 Málaga, Spain
2
Department of Geology and Geochemistry, Facultad de Ciencias, Universidad Autónoma de Madrid, Campus de Cantoblanco, 28049 Madrid, Spain
3
Instituto Geológico y Minero de España (IGME), 28760 Madrid, Spain
*
Author to whom correspondence should be addressed.
Minerals 2018, 8(9), 376; https://doi.org/10.3390/min8090376
Submission received: 7 July 2018 / Revised: 21 August 2018 / Accepted: 27 August 2018 / Published: 30 August 2018
(This article belongs to the Special Issue Authigenic Clay Minerals: Mineralogy, Geochemistry and Applications)

Abstract

:
The effect of the microwave-assisted acid treatment (MAT) on the structure and texture of dioctahedral (montmorillonite) and trioctahedral (saponite) smectites, kerolitic clays and sepiolites were studied by scanning electron microscopy, nitrogen adsorption, X-ray fluorescence, X-ray diffraction and Fourier transform infrared spectroscopy. This study shows that in the smectite group of minerals the effectiveness of MAT is notably influenced by the chemical composition of the octahedral sheet, whereas in kerolitic clays it is influenced by the proportion of the expandable phase in the mixed layer sequence. On the other hand, the reactivity of sepiolites depends on the width of the natural fibres. With these treatments, extremely high specific surface area (SSA) increments are achieved in just 16 min. The SSA increments reach values up to 231 m2/g (%ΔSBET = 80) in sepiolites, 198 m2/g (%ΔSBET = 155) in Mg-smectites, and 161 m2/g (%ΔSBET = 61) in kerolitic clays.

1. Introduction

Some clay materials named after special clays are composed of mostly one clay mineral that has important physical and chemical properties for the industrial and technological applications. Composed of 2:1 clay minerals, the main special clays include bentonite, sepiolite and kerolitic clay.
Sepiolite (Mg8Si12O30(OH)4(OH2)4·nH2O) is a clay mineral, the structure of which is similar to other 2:1 trioctahedral phyllosilicates (e.g., talc). Sepiolite has a continuous two-dimensional tetrahedral sheet, but it lacks continuous octahedral sheets. Indeed, discontinuities in the octahedral sheets and inversions of the silica sheets give rise to structural tunnels and ribbons expanded along the a-axis. Sepiolite is included in the class of modulated non-planar hydrous phyllosilicates [1,2].
The structure of the smectite group of clay minerals is based on the stacking of negatively charged 2:1 layers. For this reason, the presence of hydrated exchangeable cations, which are located in interlayer positions (mostly Ca2+, Mg2+, Na+) [3] is necessary. Moreover, depending on whether the octahedral sheet is filled with trivalent or divalent cations, smectite minerals can be either dioctahedral (e.g., montmorillonite) or trioctahedral (e.g., saponite, stevensite).
Kerolitic clays are composed of kerolite/Mg–smectite mixed layers. Random interstratifications (mixed layers) of kerolite and Mg-smectite (stevensite, saponite) layers can occur [4,5,6,7,8]. The structure of kerolite is believed to be similar to talc (and thus, a variety of talc), but with the presence of H2O, either on the edges associated with broken bonds or in the interlayer [9]. Brindley et al. reported the composition as Mg3Si4O10(OH)2·nH2O where n = 0.8–1.2 [10].
The physical and chemical properties of these special clays, and therefore their industrial applications [11], are influenced by several features such as: high cation exchange capacity, high surface area, laminar to fibrous shape, small particle size, and layer charge. The activation is a common process to enhance the properties of these clay materials.
Various surface modification methods (activation), such as heat and acid treatment, have been studied by many researchers [12,13,14,15,16,17,18,19,20,21,22,23,24,25,26,27,28,29,30,31] in order to improve the adsorption capacity of sepiolites. Acid treatments in particular, have classically been used to increase the surface area and to obtain solids with high porosity and a high number of acidic centres from this clay mineral [17]. With these acid treatments, variable amounts of structural Mg2+ ions are removed from the sepiolite structure, whereas the tetrahedral sheets are released forming an amorphous silica gel. The presence of this phase of amorphous silica increases the surface area [18,19]. Several studies have shown the ability for adsorption on acid activated sepiolite [20,21,22].
Actually, many chemical processes use microwave techniques for heating [32,33,34,35,36,37]. They offer advantages over conventional methods including a higher heating rate and provide homogeneous heating, notably reducing the treatment time required to reach high surface area values [38,39,40]. The aim of this work was to compare the effect of microwave-assisted acid treatment on three special clays composed of 2:1 clay minerals. For this study, representative samples of bentonites, sepiolites and kerolitic clays were chosen.

2. Materials and Methods

2.1. Starting Materials

Six special clays (bentonites, kerolitic clays and sepiolites) were tested in this study. The Bentonites were comprised of samples of Bm, composed of montmorillonite (SWy-1, from Crook County, OR, USA), and Bs, composed of saponite (SapCa-2, from Ballarat, CA, USA), both supplied by the Clay Minerals Repository.
The kerolitic clays (samples K1 and K2) were collected from the Esquivias deposit (Madrid Basin, Spain). These “bleaching earths” occur in quarries and outcrops near the Esquivias village, 40 km south of Madrid. In this zone, the Magnesian Unit [6] is about 15 m thick, including up to four beds of kerolite-stevensite mixed layers. The thickness of the single Mg–clay lutite beds ranges from 1 to 4 m (average: 1.5 m) depending on the location in the deposit. The lutites are characterized by their pinkish to pale brown colour and granular to massive lithofacies. Earlier mineralogical research [5,41] showed that they are composed mostly of mixed layered kerolite-stevensite, although the presence of sepiolite and saponite was also reported [6,8,42,43].
Two samples of sepiolite from the Vicálvaro (Sp1) and Batallones (Sp2) deposits, both in the Madrid Basin, were selected. These materials are well known and have been the subject of many studies in recent years [43,44].

2.2. Microwave-Assisted Acid Treatment (MAT)

Five grams of each starting sample were treated with 50 mL of 0.2 N HNO3 for 4, 8, 12 and 16 min under 800 W of microwave radiation, in an open glass cylinder reactor [39,40]. A commercially available microwave system EMS20100OX (Electrolux, Stockholm, Sweden) operating at 800 W and 2.45 GHz was used for the treatments. The microwave irradiation was applied in a discontinuous form [38,39] to avoid exceeding 100 °C in the system. After 1 min of microwave irradiation, the suspensions were cooled for 5 min at room temperature. Thus, the treatment time is that of irradiation plus the cooling time after every minute of irradiation. After the microwave-assisted acid treatment, the samples were centrifuged and washed with deionized water until the NO3 ions were completely eliminated (confirmed by a Griess test), and finally, the samples were air-dried. The acid for the experiments was selected according to Franco et al. [39]. These authors proved that the effect of nitric acid in the structure of several sepiolites was stronger than that of hydrochloric acid.

2.3. Analytical Methodology

Powder patterns were collected on an X’Pert Pro MPD automated diffractometer (PANalytical B.V., Almelo, The Netherlands) equipped with a Ge(111) primary monochromator (strictly monochromatic CuKα1 radiation) and an X’Celerator detector. The overall measurement time was 33 min per pattern in order to obtain very good statistics over the 2θ range of 2–65° with 0.017° step size. Clay fraction samples (<2 µm) of starting samples were prepared from suspensions oriented on glass slides. The clay fraction minerals were identified on oriented air-dried samples, with ethylene glycol solvation, and also after heating at 550 °C.
The percentage of expandable layers in the kerolite/Mg-smectite mixed layers was calculated using the NEWMOD program [5]. The parameters used to model kerolite/Mg-smectite mixed layers were d(001) Mg–Sm = 17.1 Å, d(001), Ke = 9.65 Å, defect free distance = 2, “high N” = 3–7 and reichweite R = 0 (random interstratification).
DRIFT spectra were collected on a Varian 3100 FT-IR spectrophotometer (Varian, Hiroshima, Japan) with a Harrick HVC-DRP cell. We used 200 scans to obtain the interferograms using the spectrum of KBr to calculate the background. About 30 mg of finely ground clay-based materials were placed in the sample holder.
X-ray fluorescence analysis (XRF) (major elements) of untreated and activated samples was performed using the MagiX X-ray fluorescence spectrometer of PANanytical (PANalytical B.V., Almelo, The Netherlands). Sodium was determined with an atomic absorption (AA) spectrophotometer (Varian 220-FS QU-106). Loss on ignition (LOI) was calculated after heating to 950 °C.
N2 adsorption-desorption isotherms of the starting and treated samples were measured at −196 °C using a Micromeritic ASAP 2020 apparatus (static volumetric technique) (Micromeritic, Norcross, GA, USA). The total specific surface areas (SBET) were determined through the Brunauer-Emmett-Teller (BET) equation [45]. The total specific surface areas (SBET) were determined through the BET equation [46]. The external specific surfaces areas (Stext) and micropore areas (Stmicro) were estimated using the t-plot method [45]. One aliquot (0.15 g) of each sample was outgassed for 16 h at 200 °C under vacuum. Nevertheless, taking into account that the thermal treatment affects the sepiolite structure and consequently its SBET, for sepiolite samples two aliquots of each were degassed for 16 h at 120 and 200 °C, respectively. With this methodology we can determine the influence of the thermal treatment on the modification of the real SBET values of starting sepiolites.
Gold-sputtered (10 nm thick) samples were studied by scanning electron microscopy (SEM) using a JEOL SM-6490 LV (Peabody, MA, USA) combined with X-ray energy dispersive spectroscope (EDX).

3. Results and Discussion

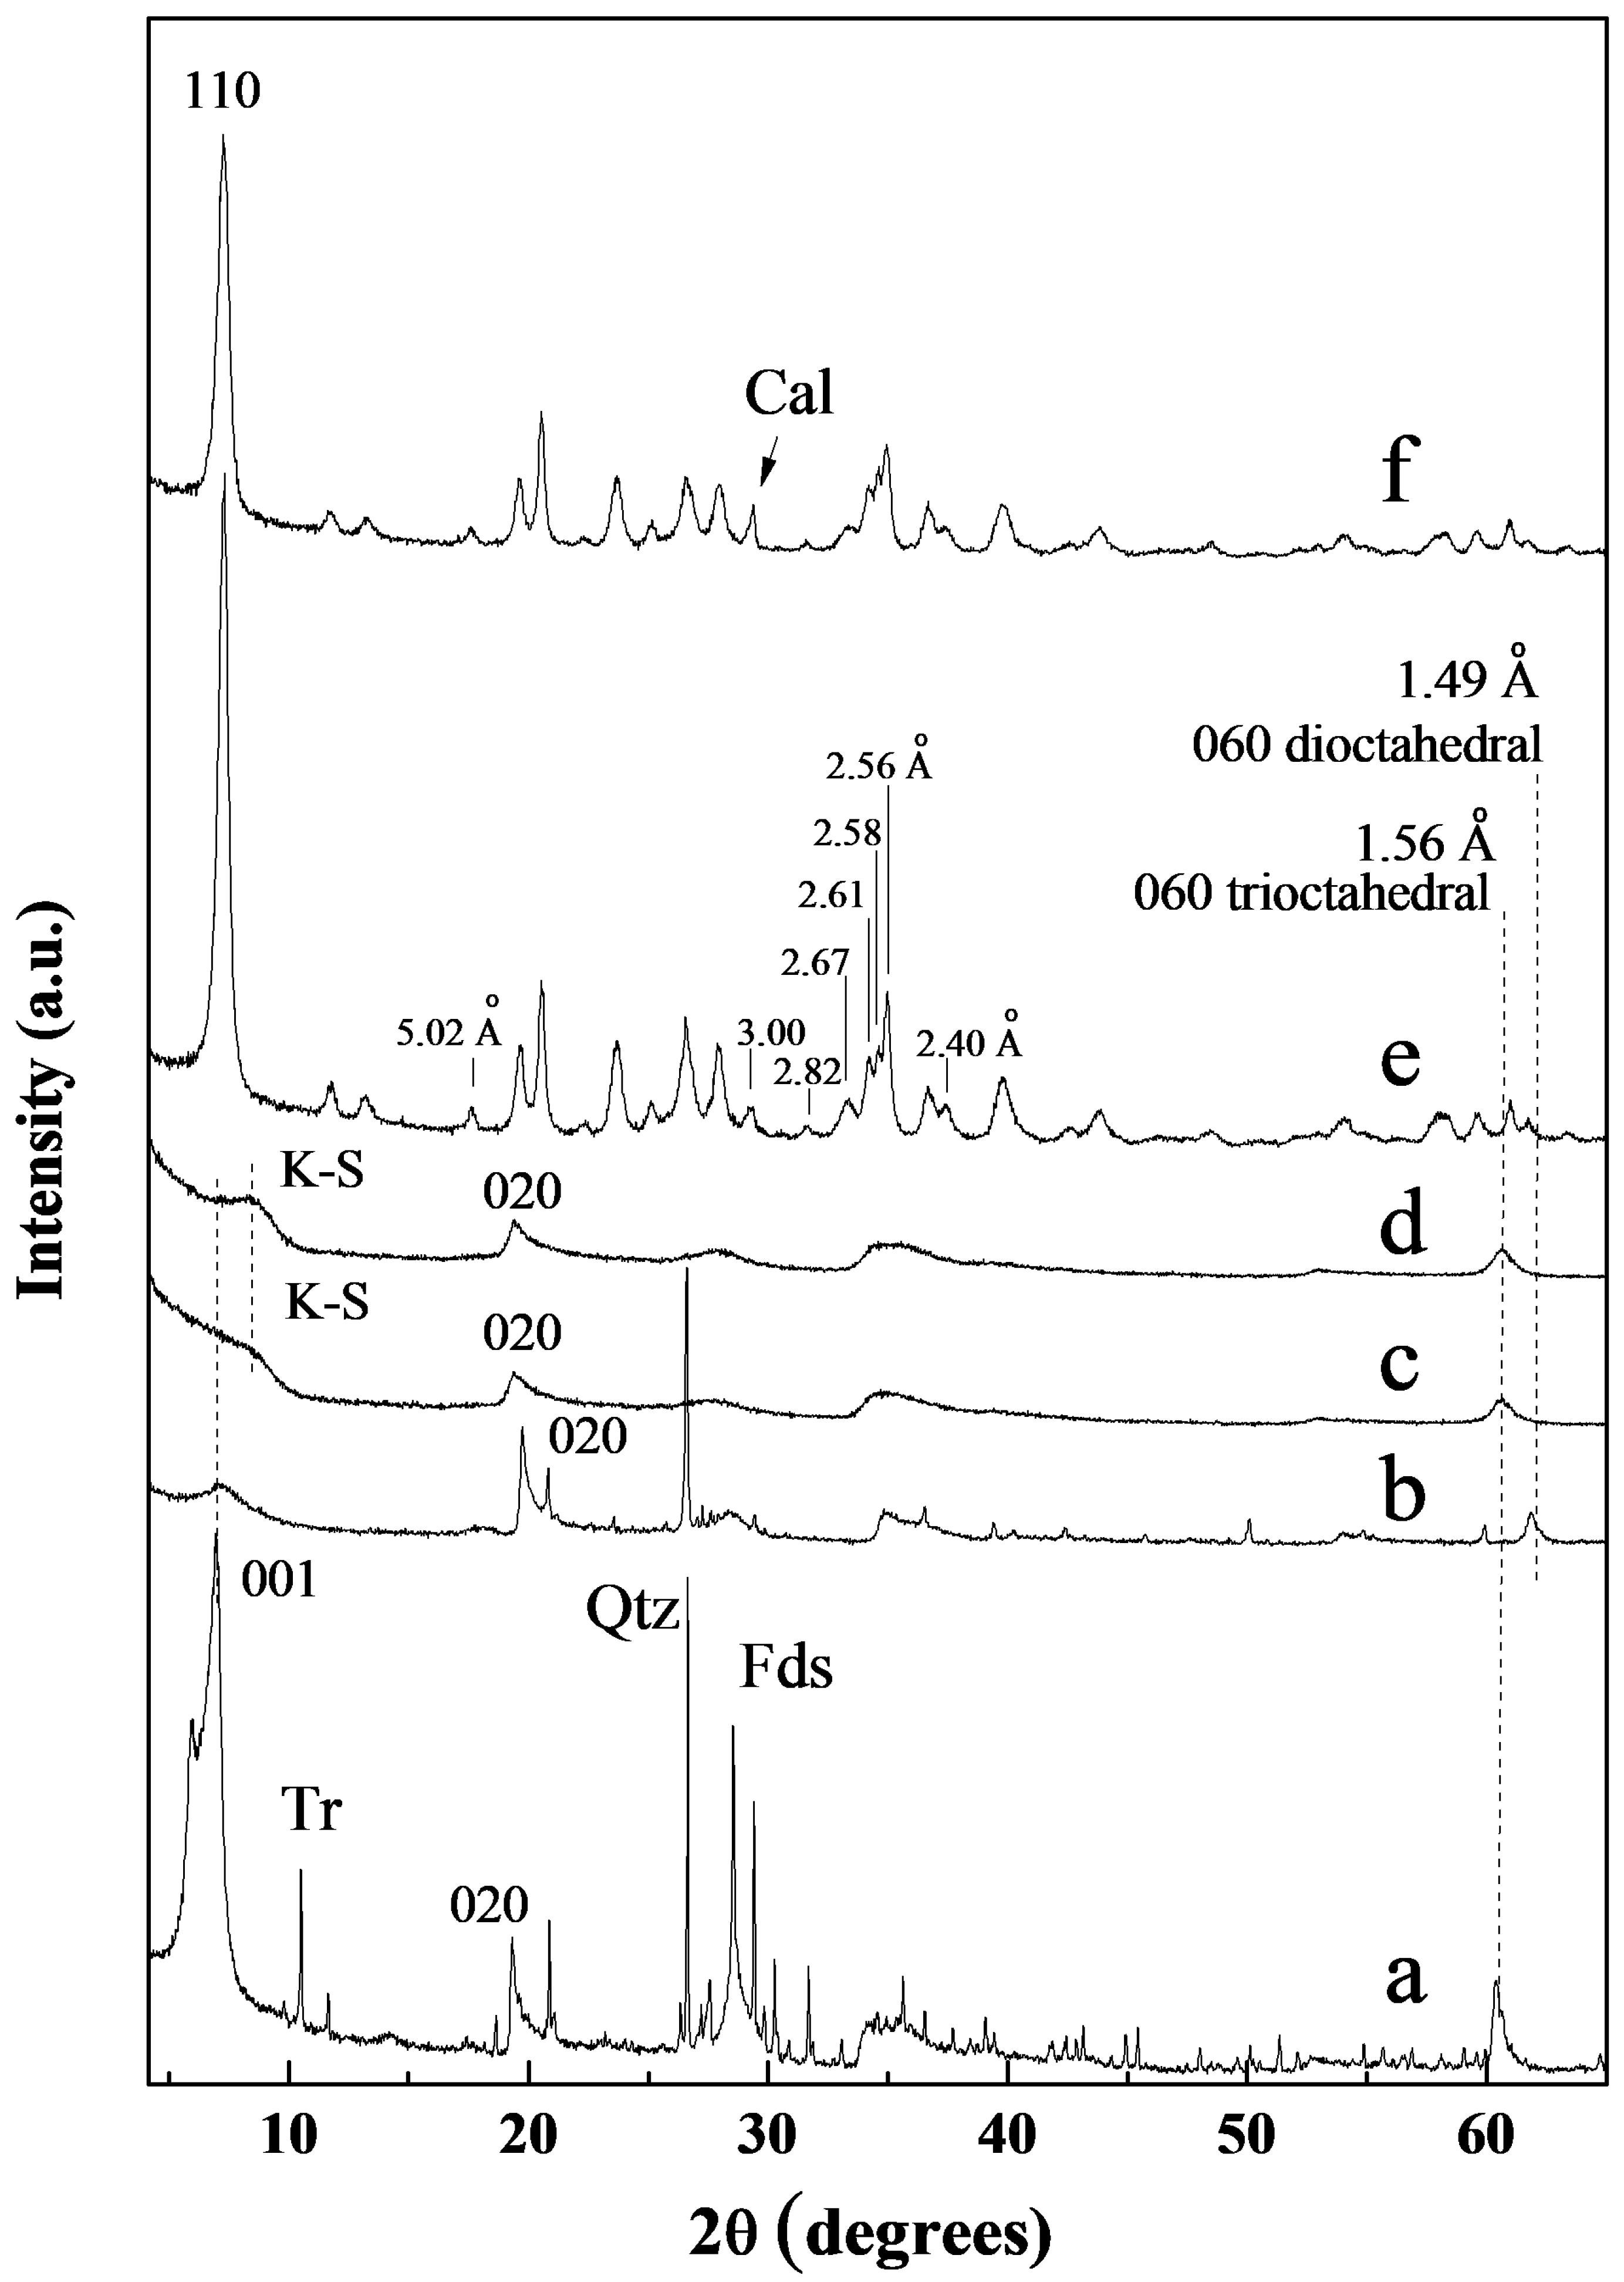
3.1. X-Ray Diffraction of the Starting Minerals

3.1.1. Bentonite

The XRD powder patterns of the starting saponite (Bs) and montmorillonite (Bm) are shown in Figure 1a,b. The 001 reflection of the Bs sample shows two components that may be related to the great variability in the hydration degree of the interlayer space. Moreover, the intensity of this doublet is notably higher than the 001 peak of the Bm sample, suggesting a higher ordering along the c* axis in the Bs sample [47]. The position of 060 reflection agree with the trioctahedral character (d(060) = 1.52 Å) of the 2:1 layers of the Bs sample and the dioctahedral character (d(060) = 1.49 Å) of the Bm sample [47]. On the other hand, the Bm sample has a minor amount of quartz, and the Bs sample has minor amounts of quartz, feldspars and tremolite (Figure 1).

3.1.2. Kerolitic Clay

Figure 1c,d shows the XRD powder patterns of the starting kerolitic clays (K1 and K2). The XRD profiles show a diffraction profile similar to those previously reported for kerolite-stevensite mixed layers [5]. The starting kerolitic samples show a broad 001 basal reflection towards low angles, as well as symmetrical third-order basal reflections at 3.19 Å. 02,11 and 06,33 reflections at 4.54 and 1.525 Å, respectively, are sharp and strong, whereas 13,20, and 15,24,31 at 2.56 and 1.72 Å, respectively, are very broad. The line broadening effect is consistent with a very small particle size and the turbostatic nature of the layer stacking [8]. Moreover, the b parameter (9.15 Å) taken from a 06 diffraction reflection indicates a trioctahedral structure. Comparison of the XRD patterns of kerolitic clay samples (K1 and K2) with that of saponite (Bs) shows weaker and wider reflections corroborating their higher structural disorder. Following the procedures used by de Vidales et al. and Pozo et al. [5,6], it was identified that K1 has similar proportions of kerolite and stevensite (50%) (type II), while sample K2 has 80% kerolite in the mixed layer (type I).

3.1.3. Sepiolite

The XRD powder patterns of the two starting sepiolites (Sp1 and Sp2) are displayed in Figure 1e,f. Sample Sp1 is almost a pure sepiolite, whereas an almost negligible amount of calcite was found in Sp2. Some differences in the profiles suggest differences in crystallinity and chemical compositions [44]. Small differences in the d-spacing of 110 reflections have been related to slight differences in the crystalline cell, since isomorphic substitution can produce compositional variations [48]. Therefore, the slightly higher d-spacing values of the 110 reflection of Sp2 suggest that this sepiolite sample could have small compositional differences from Sp1.
Reflections at 5.02, 3.00, 2.82, 2.67, 2.61, 2.58, 2.56, and 2.40 Å in both Sp1 and Sp2 are well defined. This suggests that both starting samples are well ordered sepiolites (HCS) [49]. Nevertheless, the lowest FWHM of the 110 reflection corresponding to Sp1 indicates that it has a slightly higher “crystallinity” than Sp2.

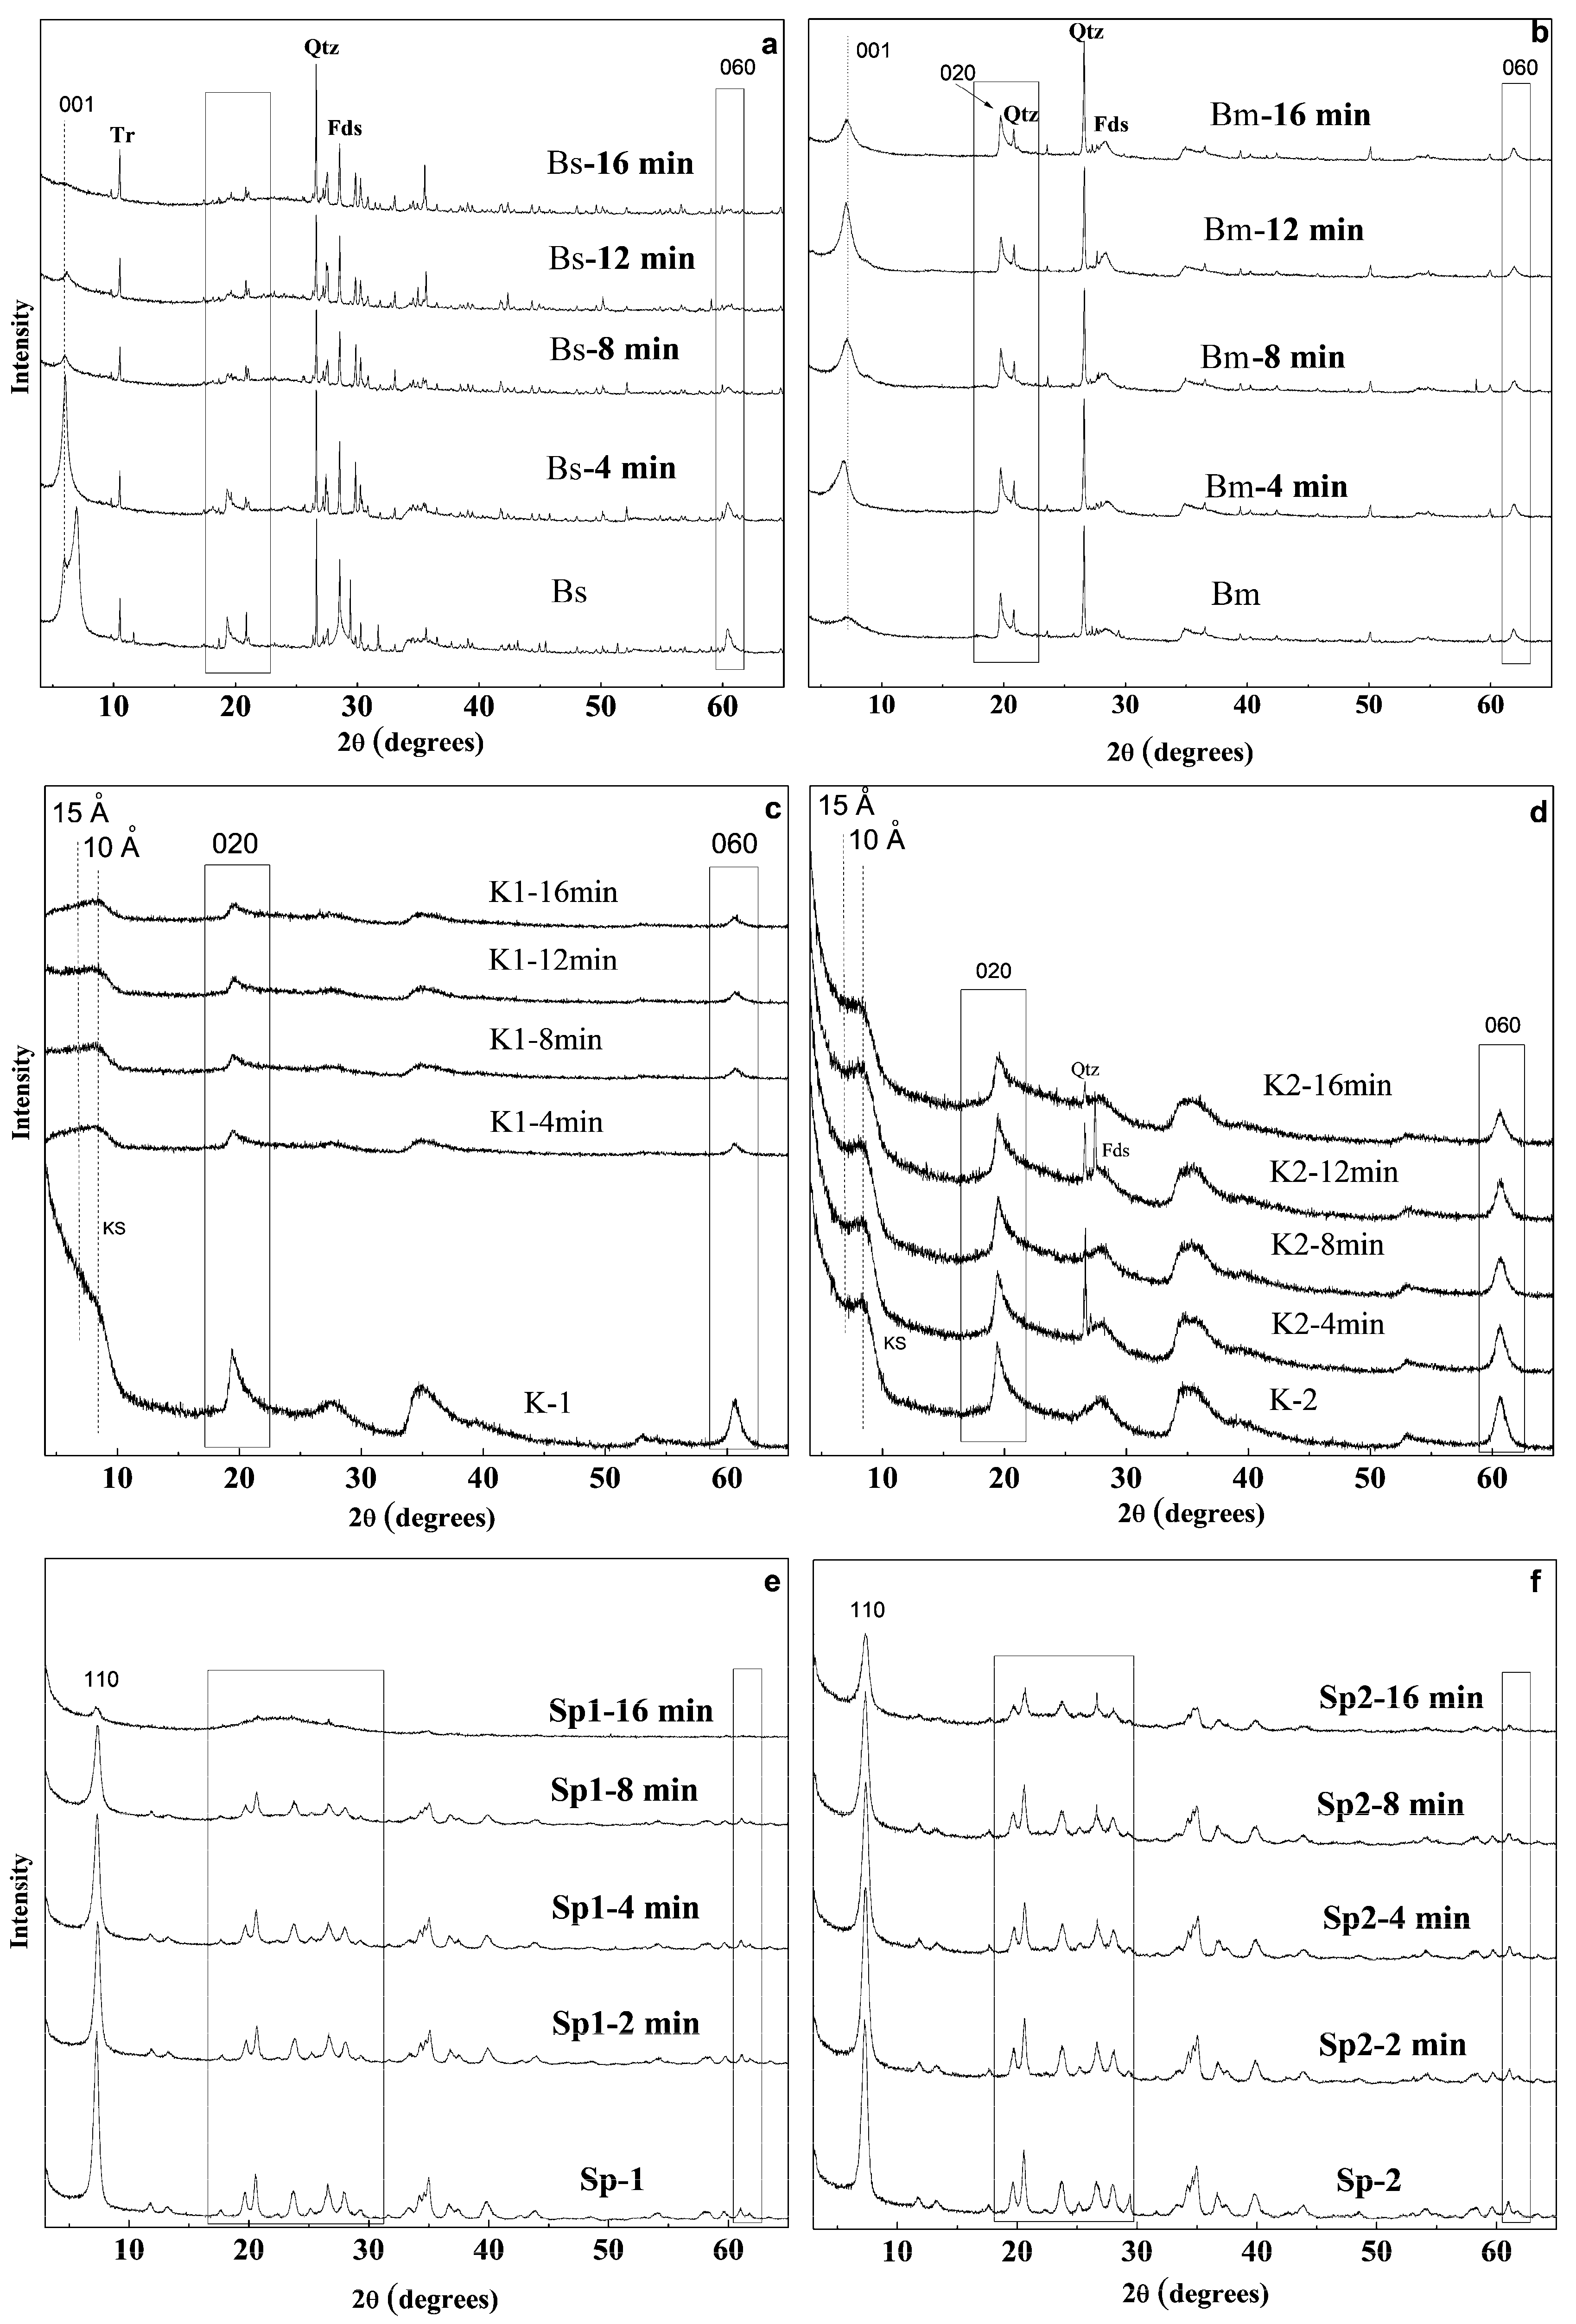
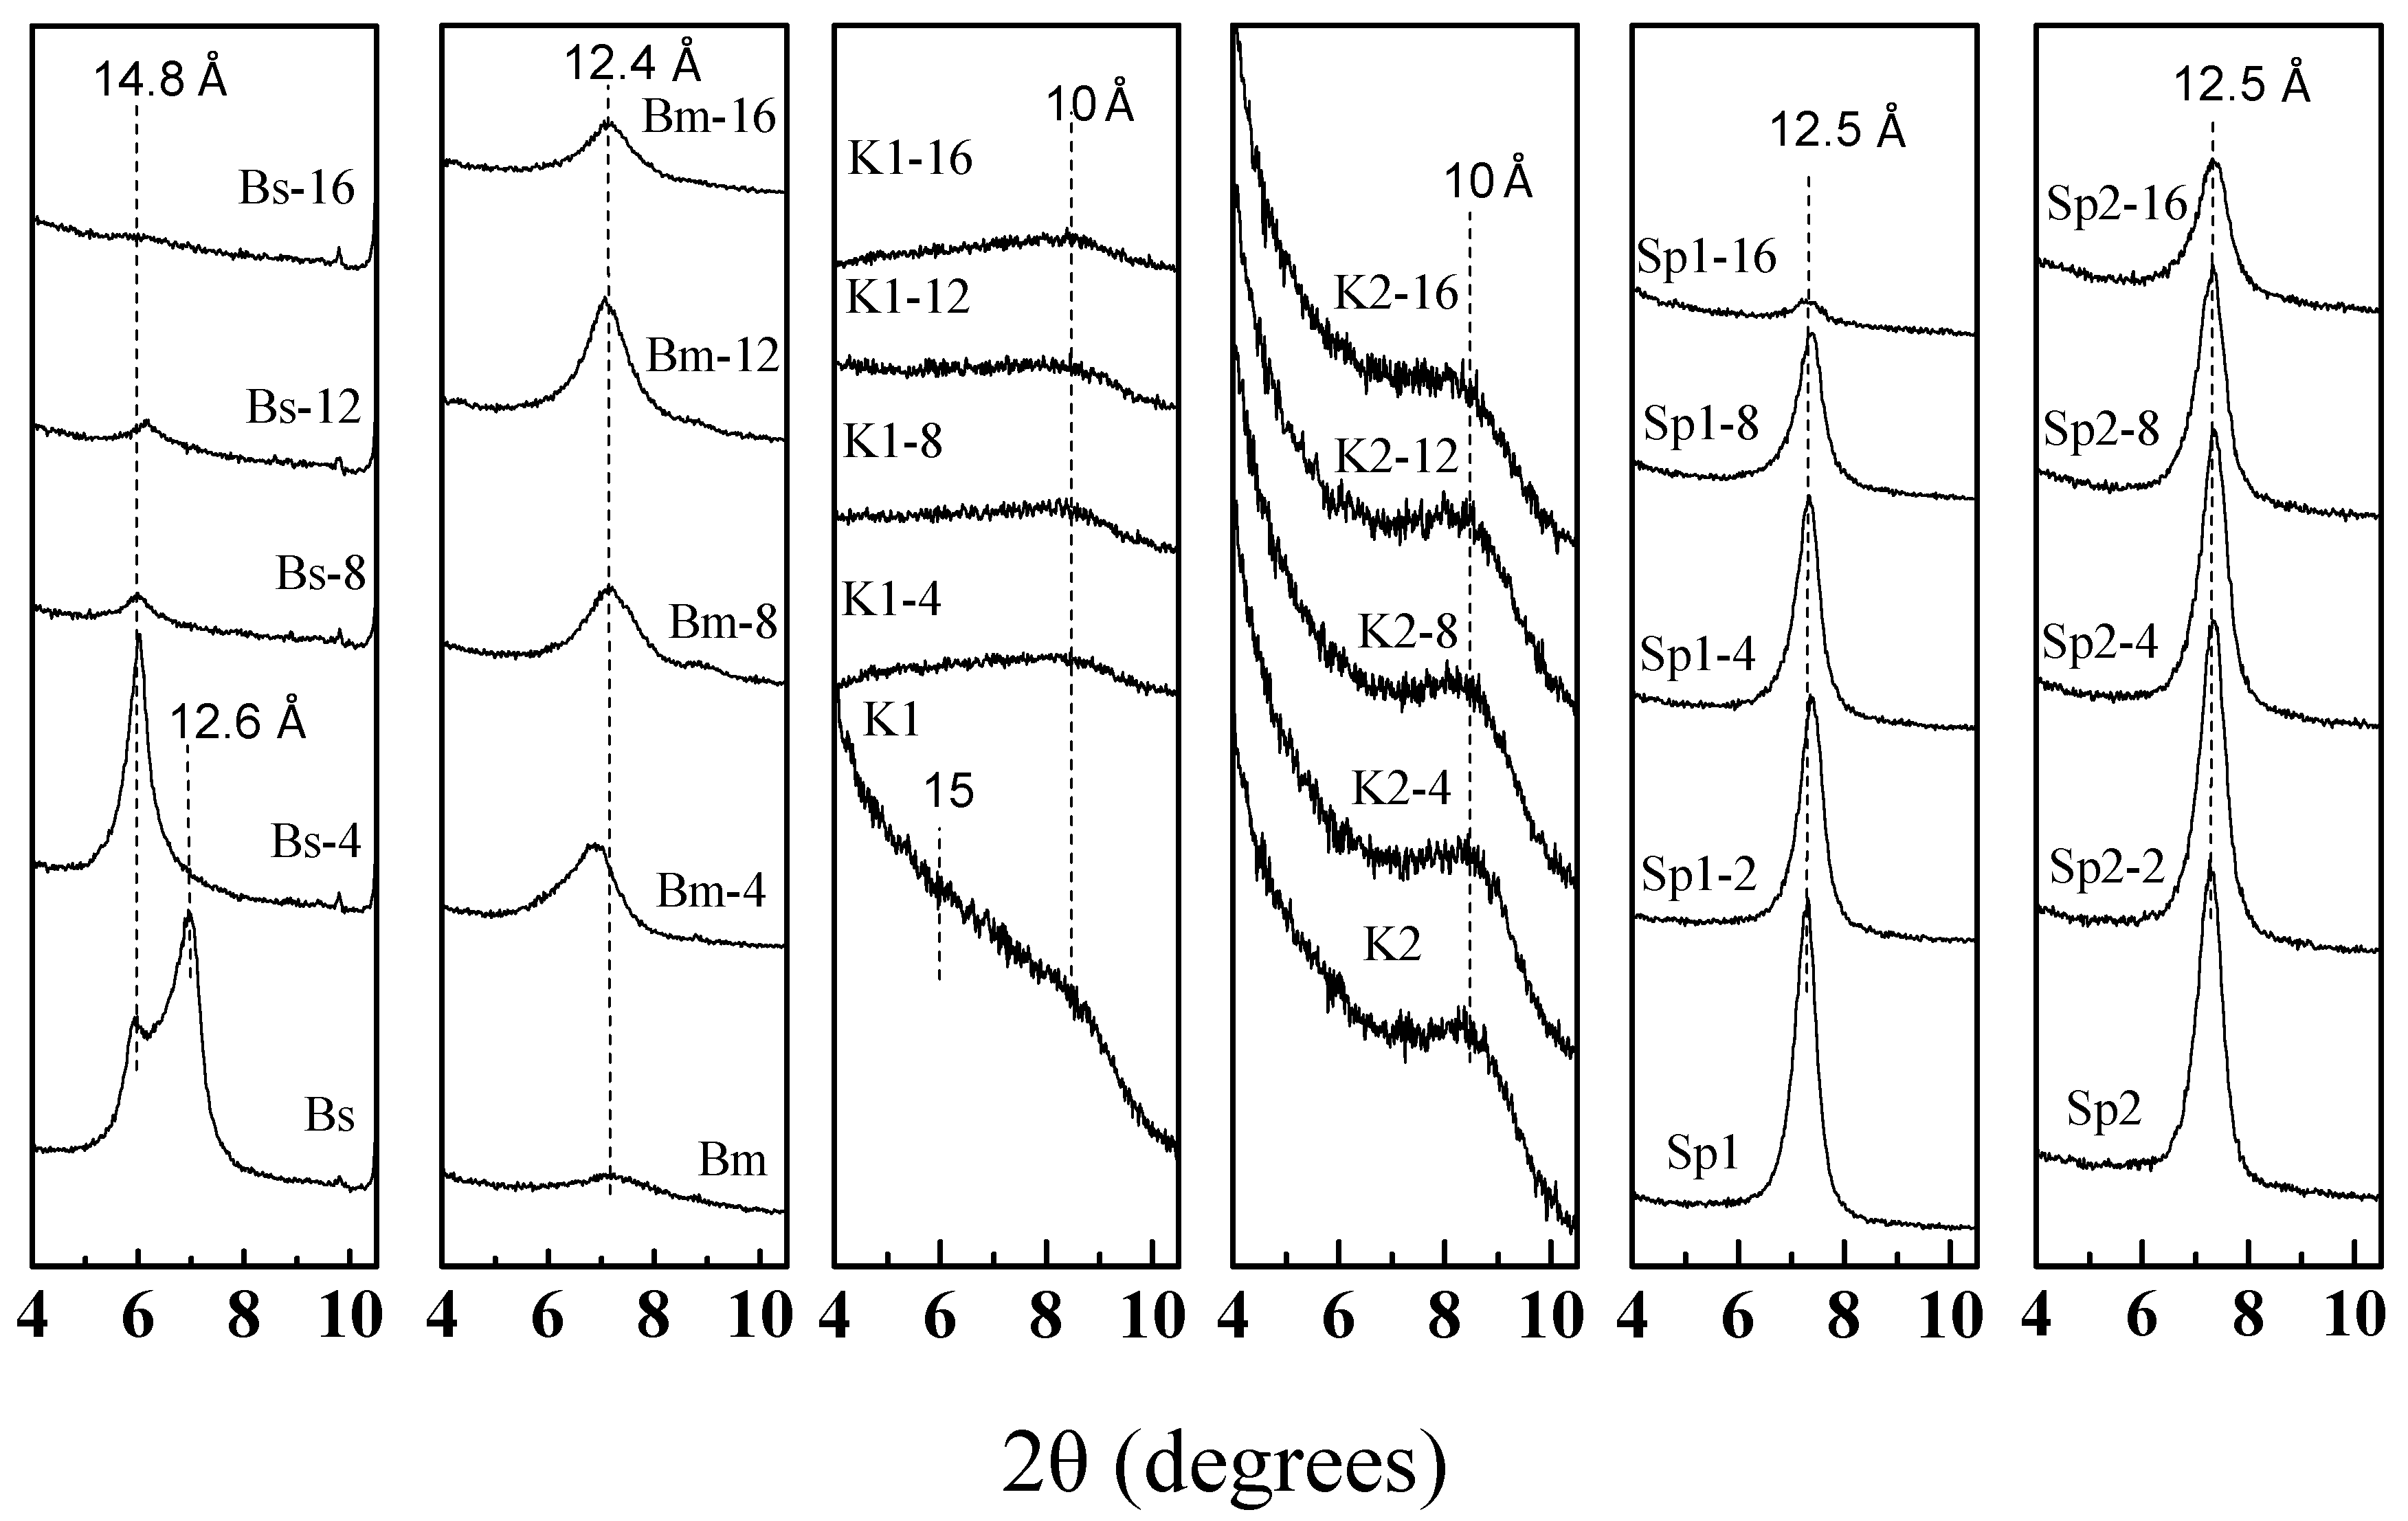
3.2. X-Ray Diffraction of the Microwave-Assisted Acid-Treated Samples

3.2.1. Bentonite

Figure 2a,b show the XRD diffraction patterns of the natural smectites (Bs and Bm) and the treated samples in order to identify the structural transformations occurring during the microwave-assisted acid treatment. Two different trends in the behaviour of smectite samples are observed.
The trioctahedral smectite (Bs) (Figure 2a) shows intense changes in the diffraction profile throughout the treatment. These modifications can be detected from the first minutes of the experiment, indicating that saponite has a great reactivity to the conditions in which the acid treatment is performed [40].
The major modifications are observed in the reflections located between 19–22 and 61–63° 2θ (Figure 2a). Reflections located between 19 and 22° 2θ of this trioctahedral smectite decrease in intensity at the same time that they are replaced by a broad band between 19 and 30° 2θ. In addition, reflection 060 widens considerably and decreases until it almost completely disappears after the first 12 min of treatment.
The loss of the ordering along the c* axis can be observed with the 001 reflection (Figure 3) [47]. The starting Bs sample displays two 001 reflections at 14.8 and 12.6 Å corresponding to the same layered mineral with two different hydration degrees in the interlayer space. After 4 min of MAT treatment, the hydration degree, at least in the interlayer space, is homogenous showing a unique basal spacing at 14.8 Å. Figure 3 shows a dramatic loss of the 001 reflection after 8 min of treatment and the almost complete disappearance after 16 min of treatment. This result seems to indicate that two processes are occurring simultaneously: (1) A progressive loss of the original lamellar structure and (2) a gradual reduction of particle size, as indicated by the decrease of the 060 reflection [29,40]. The appearance of a broad band between 19 and 30° 2θ suggests the precipitation of a solid residue of amorphous silica [41,50].
On the other hand, the X-ray diffraction patterns of the treated dioctahedral smectite (Bm) (Figure 2b) shows that the reflections located between 19–22° 2θ appear almost unchanged even after 16 min of treatment compared with that of the untreated sample. Figure 3 shows that at least 12 min of treatment are necessary to slightly decrease the 001 diffraction peak of Bm (12.4 Å). This result suggests that the structure of the Bm sample shows a great resistance to the MAT treatment, at least in the conditions made for this work [40]. The 001 reflection of Bm increases in the first 4 min of MAT treatment. This suggests an increase of the ordering along the c* axis, possibly caused by a greater homogeneous hydration of the interlayer space of the sample [47] that occurs when it is submerged in the acid solution.

3.2.2. Kerolitic Clay

Figure 2c,d shows the XRD patterns of kerolite/stevensite mixed layer samples (K1 and K2) and the obtained materials after 4, 8, 12 and 16 min of microwave-assisted acid treatments. In the K1 sample, the acid treatments cause a general decrease of the diffraction reflections, especially the basal one (near 15 Å), a small reflection remaining at 10 Å (Figure 3). On the other hand, the K2 sample (Figure 2d), mainly formed by kerolite (80% in the mixed layer) [5] presents a resistance to acid treatments notably higher than those observed in the K1 sample. In this case, it was observed that in general, most of the diffraction reflections maintain their intensity in the first 12 min of treatment but a slight decrease at 16 min is observed. These results suggest that MAT treatment causes the loss of the stevensite layers (15 Å) [40] in the stacking sequence of the mixed layers, whereas the kerolite layers remain unchanged [5].

3.2.3. Sepiolite

Different behaviour may also be observed in the case of the sepiolite samples Sp1 and Sp2 (Figure 2e,f). The comparison of the X-ray diffraction profiles of the Sp1 sample and the acid-activated materials shows that the microwave-assisted acid treatment causes a progressive decrease of the original diffraction reflections, which is more evident after 8 min of treatment. From this time of treatment, the 110 reflection of Sp1 decreases considerably, remaining a negligible shoulder at 16 min. Figure 2e also shows that reflections located between 20 and 40° 2θ broaden and decrease in intensity with the treatment time, while a broad band appears instead between 20 and 30° 2θ. This result suggests the appearance of an amorphous phase whose proportion increases with the progressive disappearance of sepiolite [39].
On the contrary, in the case of the Sp2 sample, 110 reflection intensity retains almost 50% of its initial intensity even after 16 min of treatment, suggesting that the Sp2 sample appears to be more resistant than Sp1 (Figure 2f) [39]. Considering that both starting sepiolites have similar structural ordering and similar chemical compositions, other factors, such as differences in length and thickness of the fibres can be responsible for this different resistance.

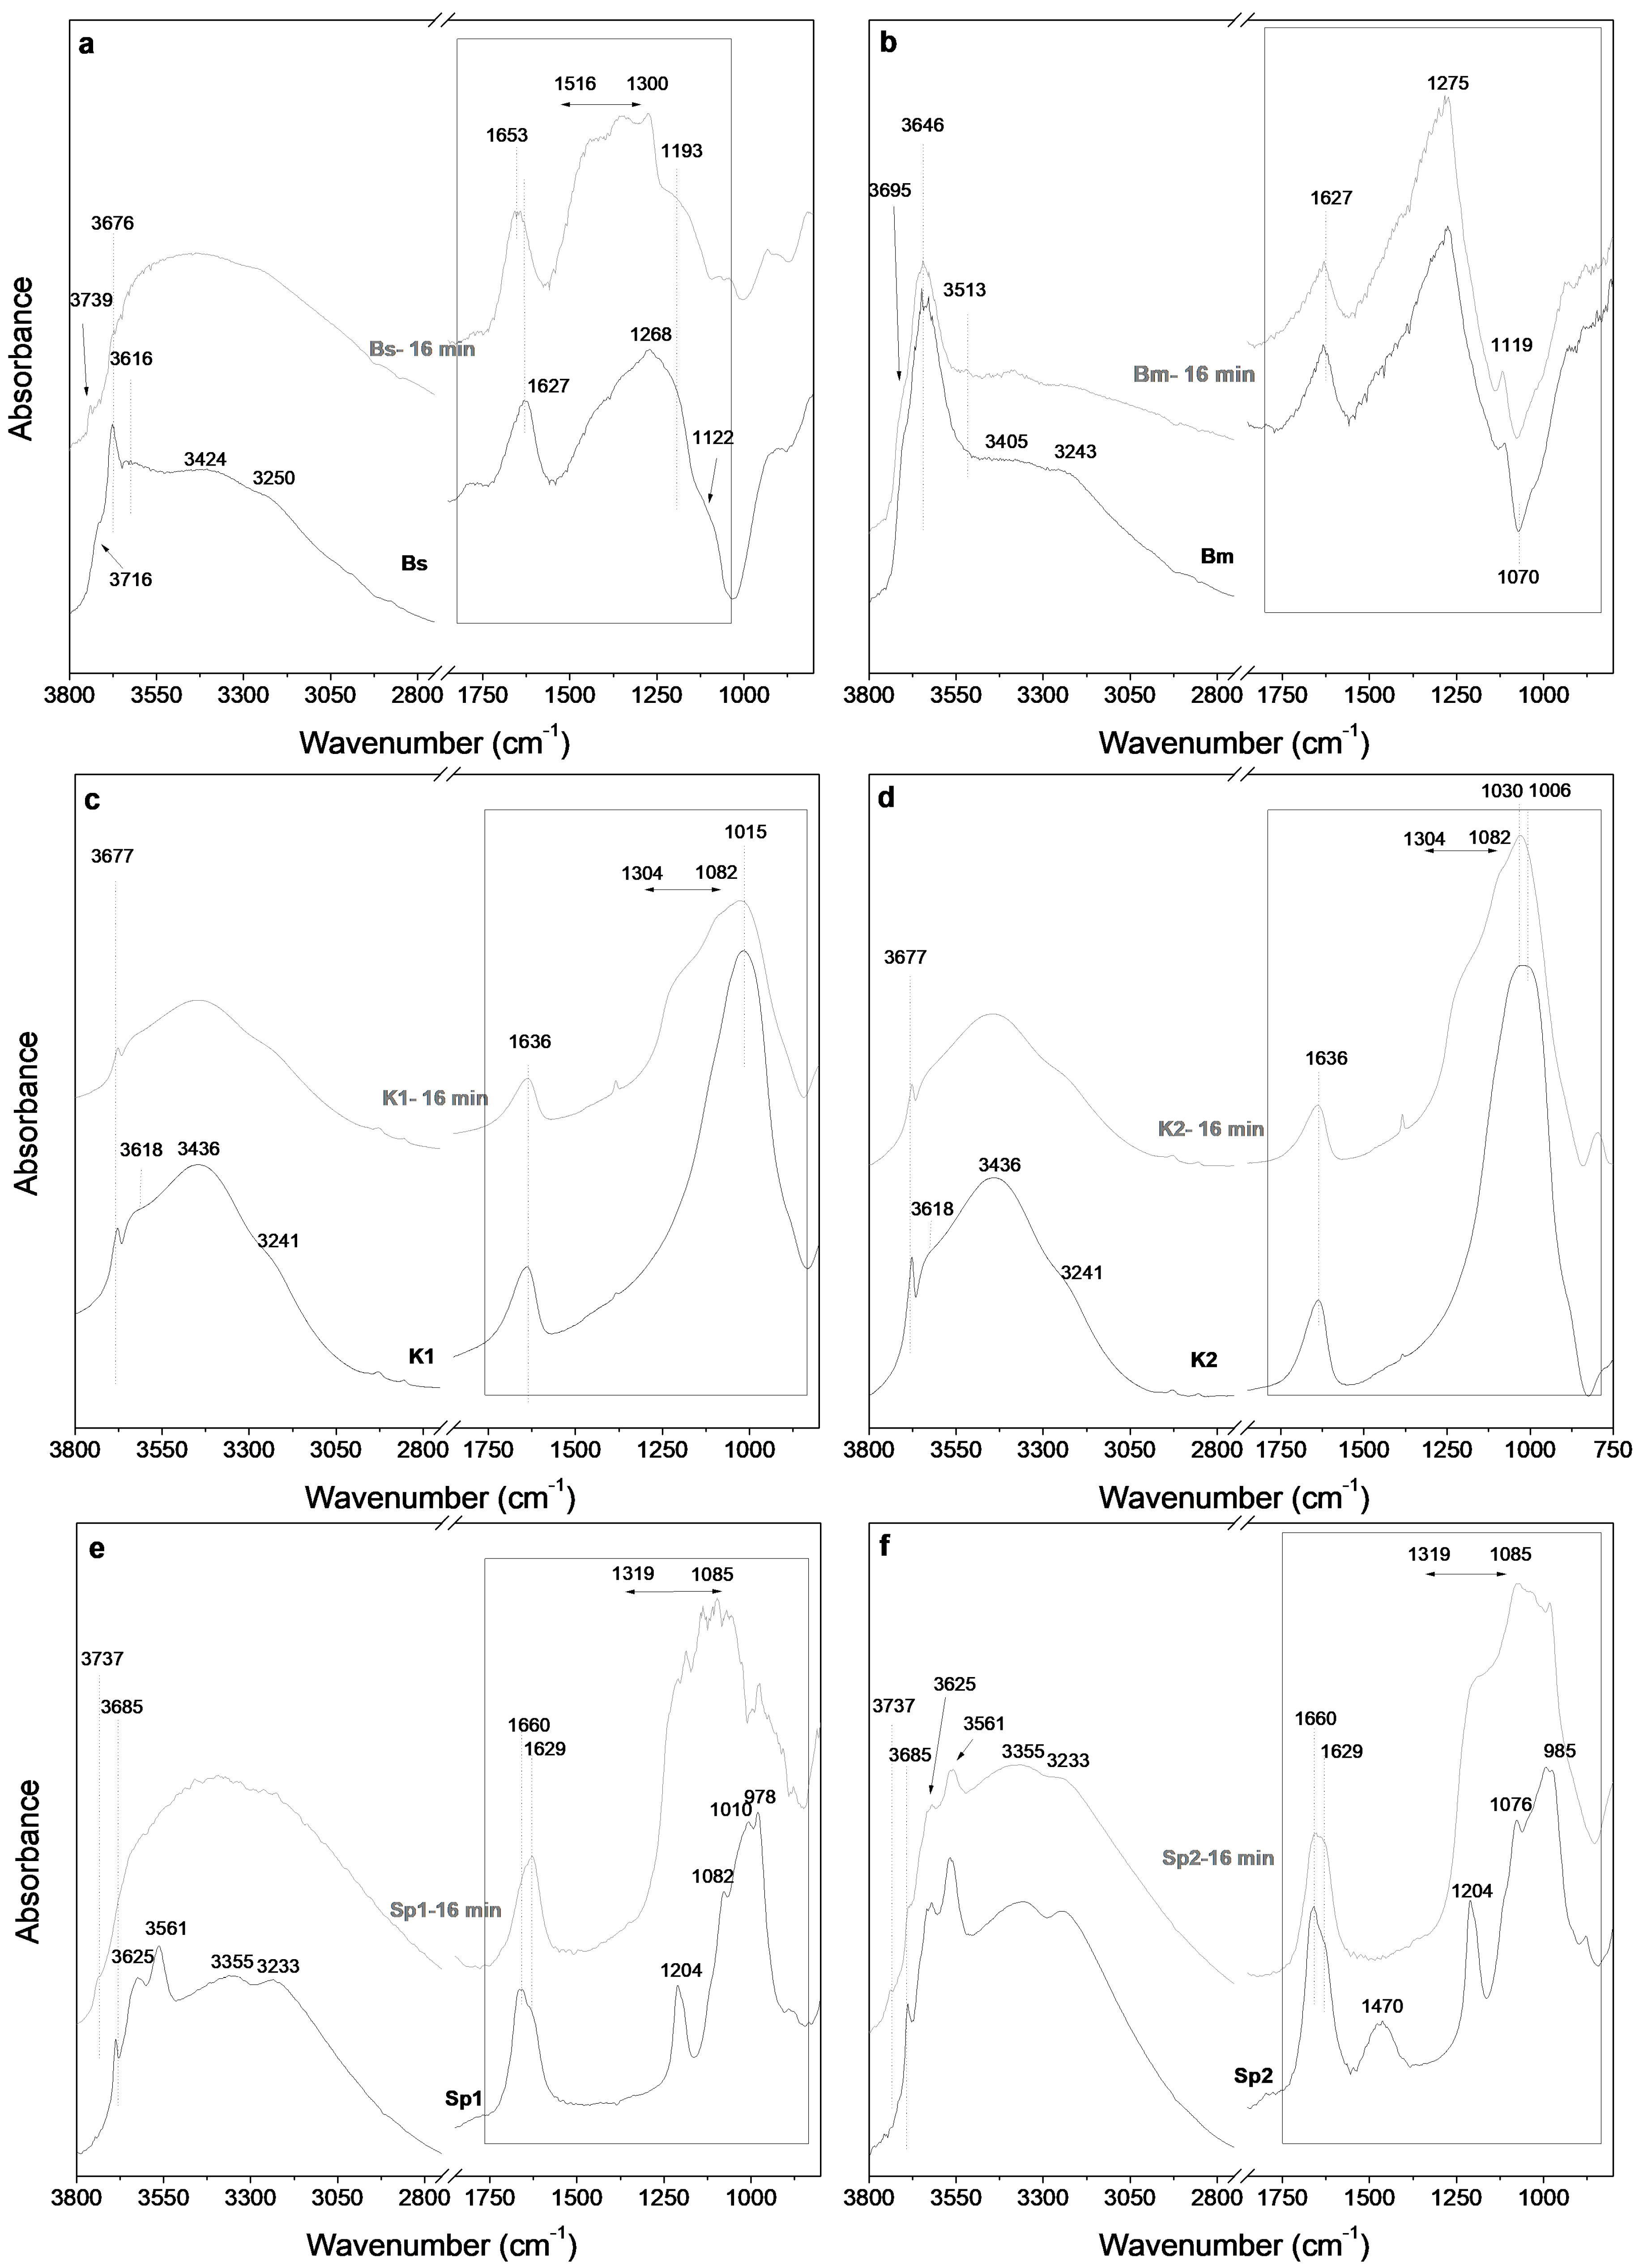
3.3. Fourier Transform Infrared Spectroscopy Study of the Starting Samples and the Microwave-Assisted Acid-Treated Samples

3.3.1. Bentonite

Figure 4a,b shows the FTIR spectra of the starting smectite samples (Bs and Bm) and the material obtained after 16 min of MAT. The OH stretching region (between 3800 and 2800 cm1) of the Bs sample displays an intense peak at 3676 cm1 accompanied by a weak shoulder at 3716 cm1, and a broad band centred at 3616 cm1. The band at 3676 cm1 is related to the OH stretching mode of structural Mg(OH)2 groups in the octahedral sheet of saponite and stevensite structure [50,51]. The band at 3716 cm1 is assigned to the νOH of isolated Si–OH groups located on the external surface of laminar particles [52], whereas the band at 3616 cm1 is related to the OH stretching modes of Al(OH)Si groups formed by isomorphic substitutions of Si(IV) by Al(III) in the tetrahedral sheet of saponite [53,54].
In the case of the Bm sample (dioctahedral smectite), Figure 4b shows that the OH stretching band appears at lower wavenumbers compared to those of the Bs sample (trioctahedral smectites). The OH region of the FTIR spectrum (3800–2800 cm1) is dominated by an intense band at 3646 cm1 assigned to the Al(OH)Al-stretching vibrations [55]. A small shoulder can be observed at 3695 cm1, related to the presence of pyrophyllite-like local structural fragments [55] or to a small amount of Mg in the octahedral sheet of montmorillonite [40].
Figure 4a,b also shows the Si–O stretching region of the FTIR spectra of the Bs and Bm samples. In both cases, the wide bands centred at 1268 (for the Bs sample) and 1275 cm1 (for the Bm sample) are related to the Si–O stretching band [56] and the band at 1627 cm1 (for both samples) are related to the water bending mode [57]. The FTIR profile of Bm sample suggest the existence of a negative band centred at 1070 cm1. This anomalous feature is related to the absorption and specular reflectance that currently give the DRIFT technique [58]. This can be minimized by a mechanical treatment of the sample.
The OH stretching region (3800–2800 cm1) of Figure 4a shows that, in the case of saponite, the 3676 cm1 band disappears completely within the MAT treatment and is replaced by a band at 3739 cm1.This is commonly observed in the FTIR spectra of the acid activated smectites and is usually related to the OH stretching mode of Si–OH groups [25] while bands at 3633 cm1 broaden progressively and shift to 3680 cm1. After the acid treatment, three changes in the FTIR spectra are observed: (1) The water bending band of the Bs sample shifts from 1627 to 1653 cm1, suggesting a change in the local environment of the adsorbed water molecules or the presence of acid water (H3O+) whose bending band appears near 1700 cm1, (2) A decrease in intensity of the wide band at 1268 cm1 (3) The appearance of a new set of bands in the range 1516–1300 cm1, which are classically related to the Si–O–Si stretching bands of low “crystallinity” phases, mainly amorphous silica, originated in the treatment [59,60].
On the contrary, no significant changes could be observed in the FTIR spectra of the Bm samples after the microwave-assisted acid treatment (Figure 4b) corroborating that the structural transformations observed in saponite do not take place in montmorillonite.
Although the best technique to study the OH group of these clay minerals is through the deuteration of these species, it is very important to highlight the complementarity of the actual FTIR spectra and XRD profile of the minerals and the obtained materials. There is a direct relationship between the modifications observed in the X-ray diffraction patterns and the FTIR spectra. This complementarity suggests the loss of the layered structure of the Bs and Bm samples simultaneously with the dissolution of the OH groups of the octahedral layers and the consequent formation of an amorphous silica phase [40].

3.3.2. Kerolitic Clay

Figure 4c,d represent the FTIR spectra of starting kerolitic clay samples. The 3800–2800 cm−1 region of the starting samples shows a narrow band centred at 3677 cm−1 and a small shoulder at 3618 cm−1. They are classically ascribed to the OH stretching bands of Mg(OH)2 groups located in the octahedral sheet of talc structure [50,51], whereas the small shoulder centred at 3618 cm−1 is related to the presence of a small proportion of Al in the octahedral sheets [55]. Two wider bands, related to the OH-stretching modes of water molecules [58] located in the interlayer space of the stevensite phase and at the outer surface of the particles, are centred at 3438 and 3244 cm−1.
Figure 4c,d also show, between 1800 and 800 cm−1, the Si–O stretching region of the FTIR spectra of the starting samples. In this region the more intense band appears centred at 1015 cm−1. This is ascribed to the Si–O stretching modes of trioctahedral phyllosilicates [57].
A comparison of the FTIR spectra of starting K1 and K2 with the 16-min treated samples shows that the acid treatments cause a progressive decrease of the band centred at 3672 cm−1, assigned to stretching modes of Mg–OH groups, as well as a generalized decrease of the stretching modes of the water molecules (3438 and 3244 cm−1 bands). These can be related to the loss of the OH groups during the dissolution of the Mg2+ cations of the octahedral sheets but also to the loss of water molecules [40]. Moreover, simultaneously to the loss of OH groups within the octahedral sheet, a strong decrease in the intensity of the Si–O stretching band (1018 cm−1) is observed. The occurrence of a new band between 1304 and 1082 cm−1, is related to amorphous silica segregation [60,61].

3.3.3. Sepiolite

The FTIR spectra of the starting sepiolite samples are shown in Figure 4e,f. According to Frost [61], between 3800 and 2800 cm−1, sepiolite shows two bands at 3685, and 3625 cm−1 associated with the stretching vibration of the Mg–OH groups and a band at 3561 cm−1 assigned to the stretching modes of water molecules coordinated with magnesium. Moreover, two bands at 3355 and 3233 cm−1 are attributed to zeolitic and coordinated water [62].
Previous studies show that several types of water are present in sepiolite [50]. The best spectroscopic method for studying water is to examine the H–O–H bending mode band centred at 1650 cm−1 since this band does not overlap other bands of sepiolite. In this region of the FTIR spectra, two major bands are observed at 1660 and 1629 cm−1 in the starting sepiolites. According to Farmer [60], these bands can be attributed to the zeolitic and adsorbed water, respectively, whereas bands between 1225 and 1000 cm−1 are assigned to Si–O stretching modes [61]. A band at 1470 cm−1 in the FTIR spectrum of Sp2 (Figure 4f) is attributed to the (CO3)2− antisymmetric and symmetric stretching modes, which indicates the presence of carbonate.
Figure 4e,f also shows the FTIR spectra of the 16 min treated sepiolite samples. These FTIR spectra reveal the almost disappearance of the OH stretching bands at 3685, 3625 and 3561 cm1 in Sp1, whereas in Sp2 the FTIR spectra show that these bands decrease in intensity but remain clearly visible in the profile. This suggests the complete loss of the OH groups along the MAT treatment of Sp1 while this loss is only partial in the case of Sp2. The FTIR spectra of acid-treated sepiolite also show the appearance of a small band at 3733 cm1, which is commonly observed in acid-treated minerals and is related to the Si–OH groups [25].
Figure 4e,f also shows that the band of the zeolitic water (1660 cm1) decreases in intensity along the MAT treatment while the band related to adsorbed water (1629 cm1) increases, suggesting the evolution of water molecules from sepiolite channels that are lost in the structural changes caused by the dissolution of octahedral sheets.
Figure 4e,f shows strong changes in the bands related to the bands of the Si–O stretching modes. These bands are partially replaced with wider bands located between 1319 and 1085 cm1. These new bands are classically related to amorphous silica [59,60].
Moreover, the FTIR of Sp2 at 2 min of MAT treatments (not shown in Figure 4), shows the complete disappearance of the band at 1470 cm1, suggesting that the dissolution of carbonates occurs at the beginning of the treatment.

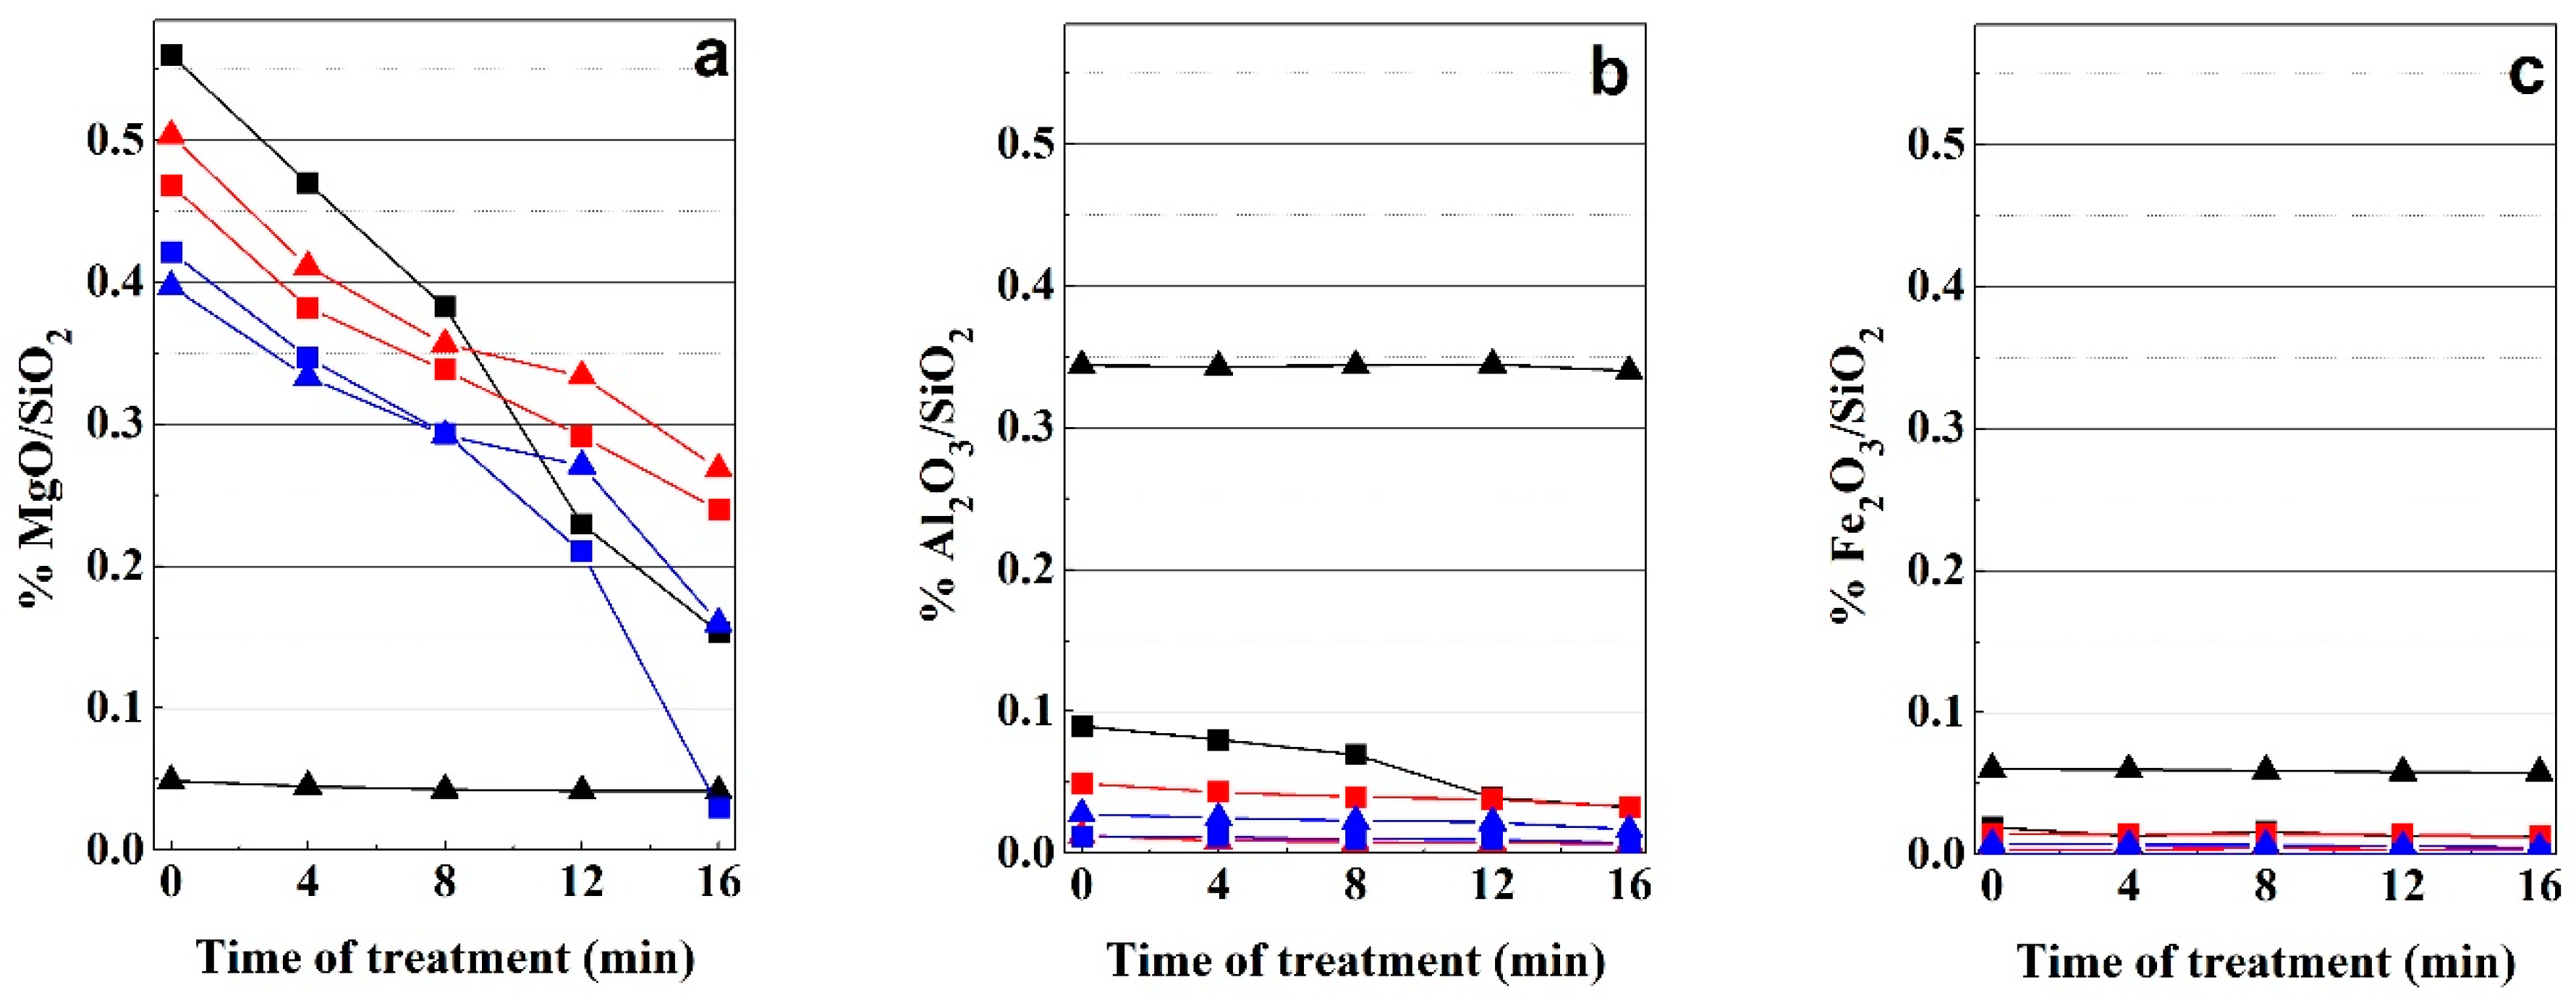
3.4. Evolution of the Chemical Composition

3.4.1. Bentonite

Table 1 shows the chemical analysis of starting samples and obtained materials after 16 min of MAT, whereas the variation of MgO/SiO2, Al2O3/SiO2 and Fe2O3/SiO2 weight ratios of chemical composition of the materials obtained through the microwave-assisted acid treatment are shown in Figure 5. This graph corroborates the different behaviour of smectites with the microwave-assisted acid treatment according to the composition of the octahedral sheet. An intense dissolution of Mg2+ ions of the octahedral sheet in the trioctahedral smectite (Bs) is observed. In this case, the dissolution of 32% of Mg2+ of octahedral sheet occurs in the first 8 min of treatment and an additional 45.2% is lost at 16 min of treatment. In the case of dioctahedral smectite (Bm), the amount of this element in the octahedral sheet is notably smaller compared with that of the Bs sample (Figure 5a), and the loss of Mg2+ is notably smaller; 12% in the first 8 min and an additional 2% at 16 min.
The Al3+ cations of the octahedral sheet of Bs and Bm appear to be more resistant to the dissolution with the microwave-assisted acid treatment. The amount of Al3+ in the Bs sample represents 26% of the Al content in the Bm sample. In this case, the proportion of Al3+ in Bm remains almost unchanged along the entire treatment, whereas in Bs, the dissolution of 24% of Al3+ of the octahedral sheet occurs in the first 8 min and an additional loss of 47.93% at 16 min of treatment possibly due to the crumbling of the octahedral sheets of 2:1 layers in saponite. On the contrary, the Fe3+ amounts remain almost unchanged along the treatment in both di- and trioctahedral smectite samples.

3.4.2. Kerolitic Clay

The chemical composition of the kerolitic clay samples indicates that starting samples are formed mostly by trioctahedral clay minerals with Mg as predominant cation in the octahedral layer (MgO, 25–28 wt %). The detection of a small amount of Al, Fe and K should be mostly related to detrital minerals (feldspar, illite-mica) identified in the mineralogical characterization as well as to minor discrete saponite commonly associated with kerolite-stevensite mixed-layer deposits. The low content of detrital minerals or other Mg-smectites, other than stevensite in the mixed layer, explains the low content of Al, Fe and K in the kerolite-rich sample (K2).
In the case of kerolitic clay samples, a large decrease in the Mg content relative to silica is shown. This can be explained by the dissolution of part of the Mg2+ located in the octahedral sheet of the kerolitic clay. This process is simultaneous accompanied by the formation of an amorphous silica phase. The samples show a similar Mg2+ loss rate up to 8 min of treatment but show a slightly different behaviour above this time of treatment (Figure 5). In the first 8 min, K1 sample lost 28% of the initial amount of Mg2+ and K2 sample lost 29% of this cation. From 8 to 16 min K1 sample lost 21% of its Mg2+ cations whereas K2 sample lost 19%. On the contrary, Al3+ and the scarce amounts of Fe3+ are released at lower rates (Figure 5). Mg2+ loss rates are significantly lower than those observed in the case of saponite. This result suggests that the presence of kerolite layers in the mixed layers decreases the reactivity of these materials against the acid treatments. In these samples the small amounts of Al3+ and Fe3+ remain almost constant along the entire treatment.

3.4.3. Sepiolite

The variation of the octahedral cation percentages in sepiolite samples are also shown in Figure 5. This figure reveals that MAT causes the release of Mg2+ ions of the octahedral sheet, whereas the amount of Si remains in the solid. Mg2+ ion dissolution rates are similar in the two sepiolites in the first 8 min of treatment (31% for Sp1 and 26% for Sp2), whereas it is higher in Sp1 (62%) than Sp2 (33%) between 8 and 12 min. In the Sp1 sample, Mg2+ cations disappear almost completely after 16 min of treatment. According to the observed decrease of the 110 reflection in these sepiolite samples (Figure 1c), this result suggests a direct relation between the dissolution of Mg2+ cations and the loss of the sepiolite structure. Similar to that observed in kerolitic samples, the small amounts of Al3+ and Fe3+ observed in sepiolite remains almost constant along the entire treatment.

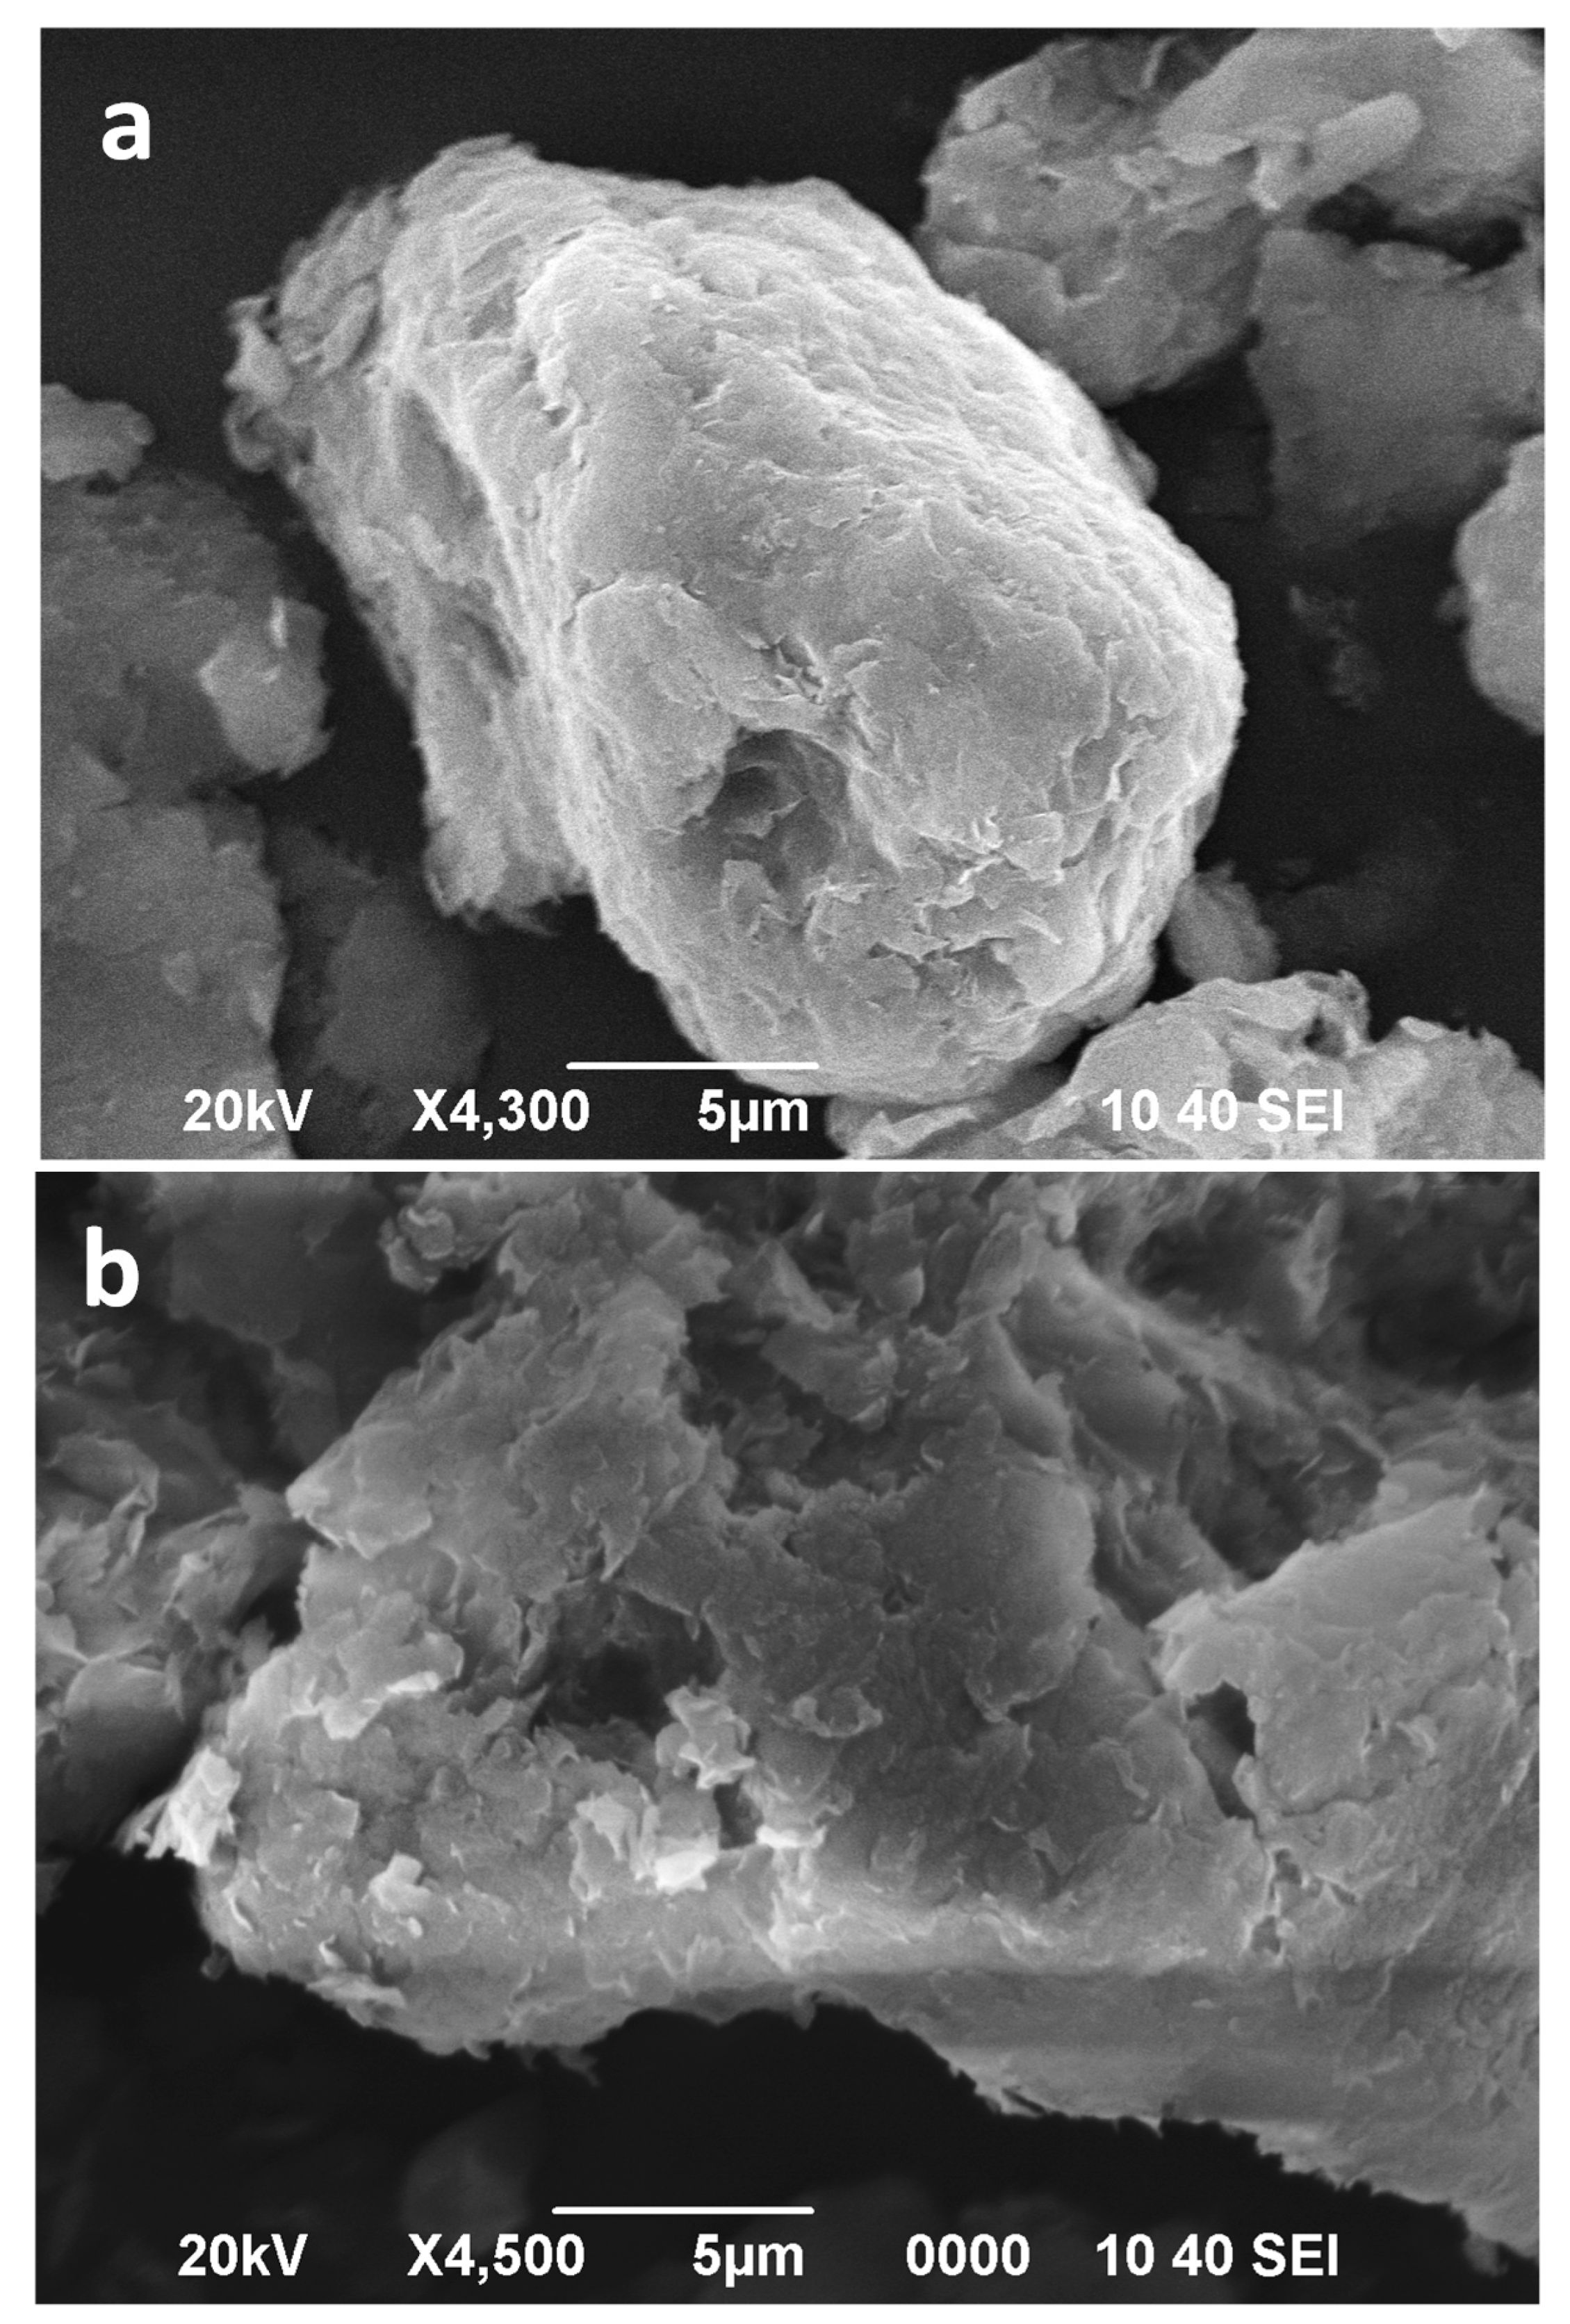
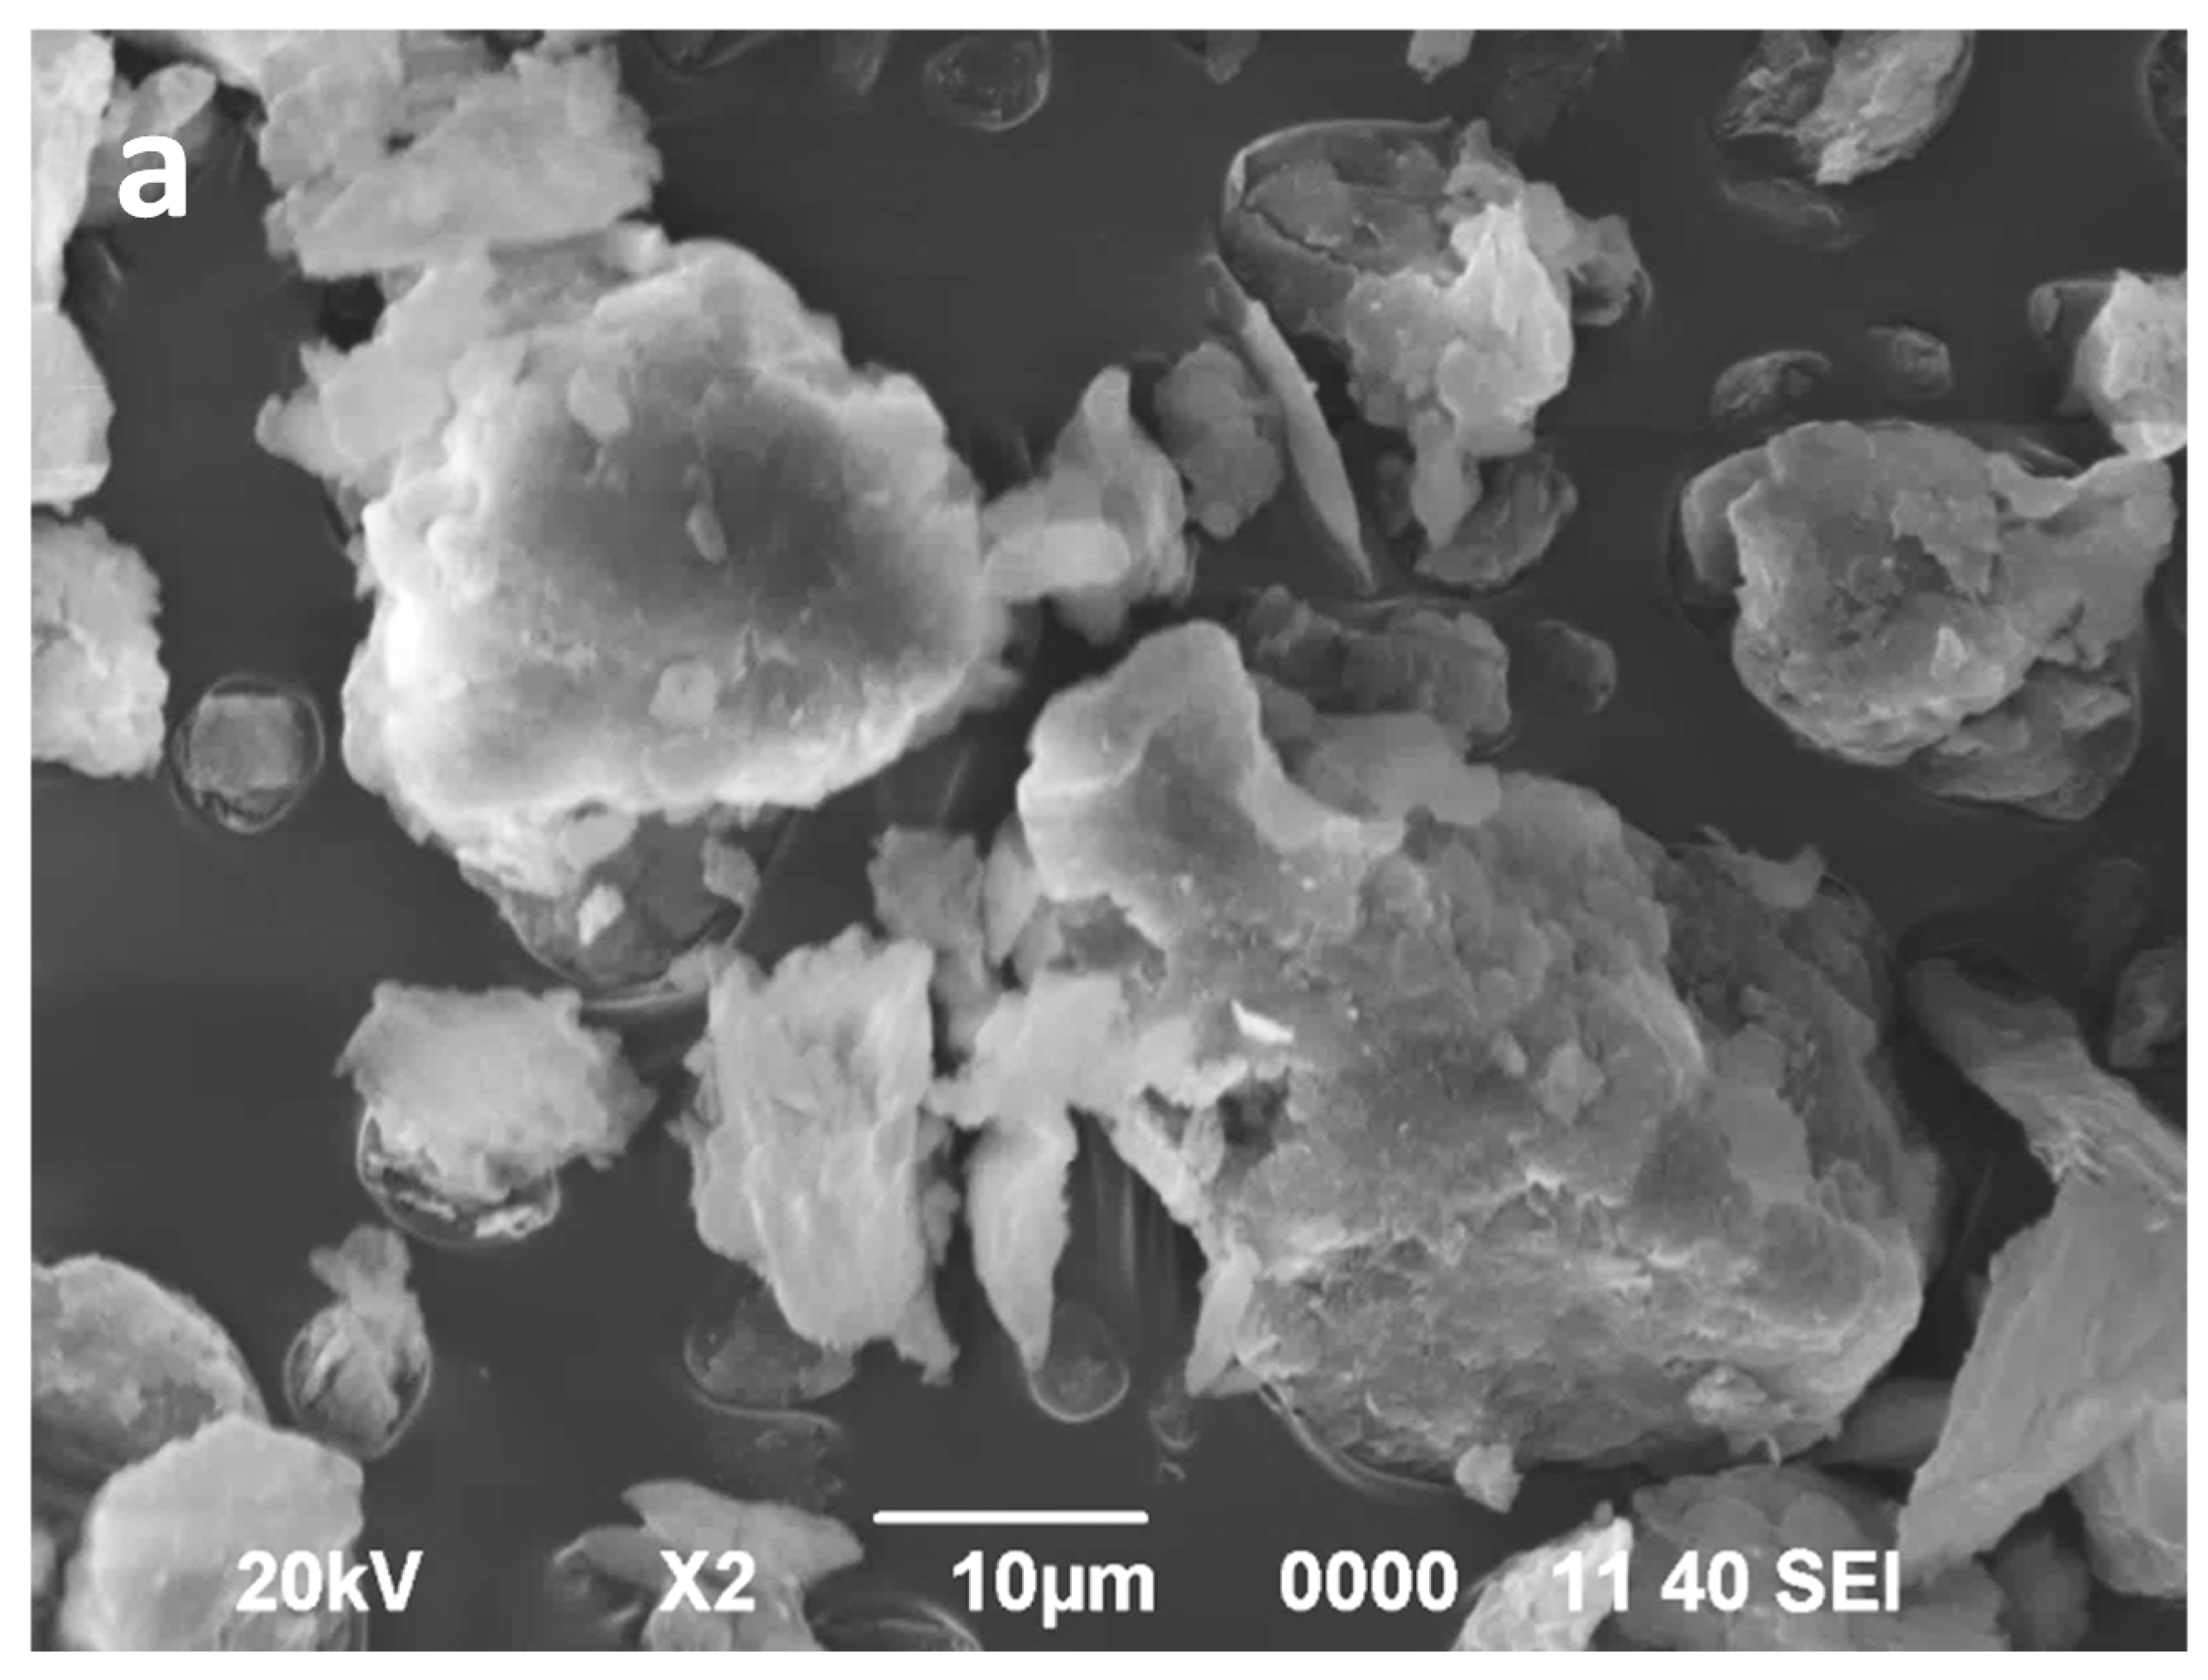
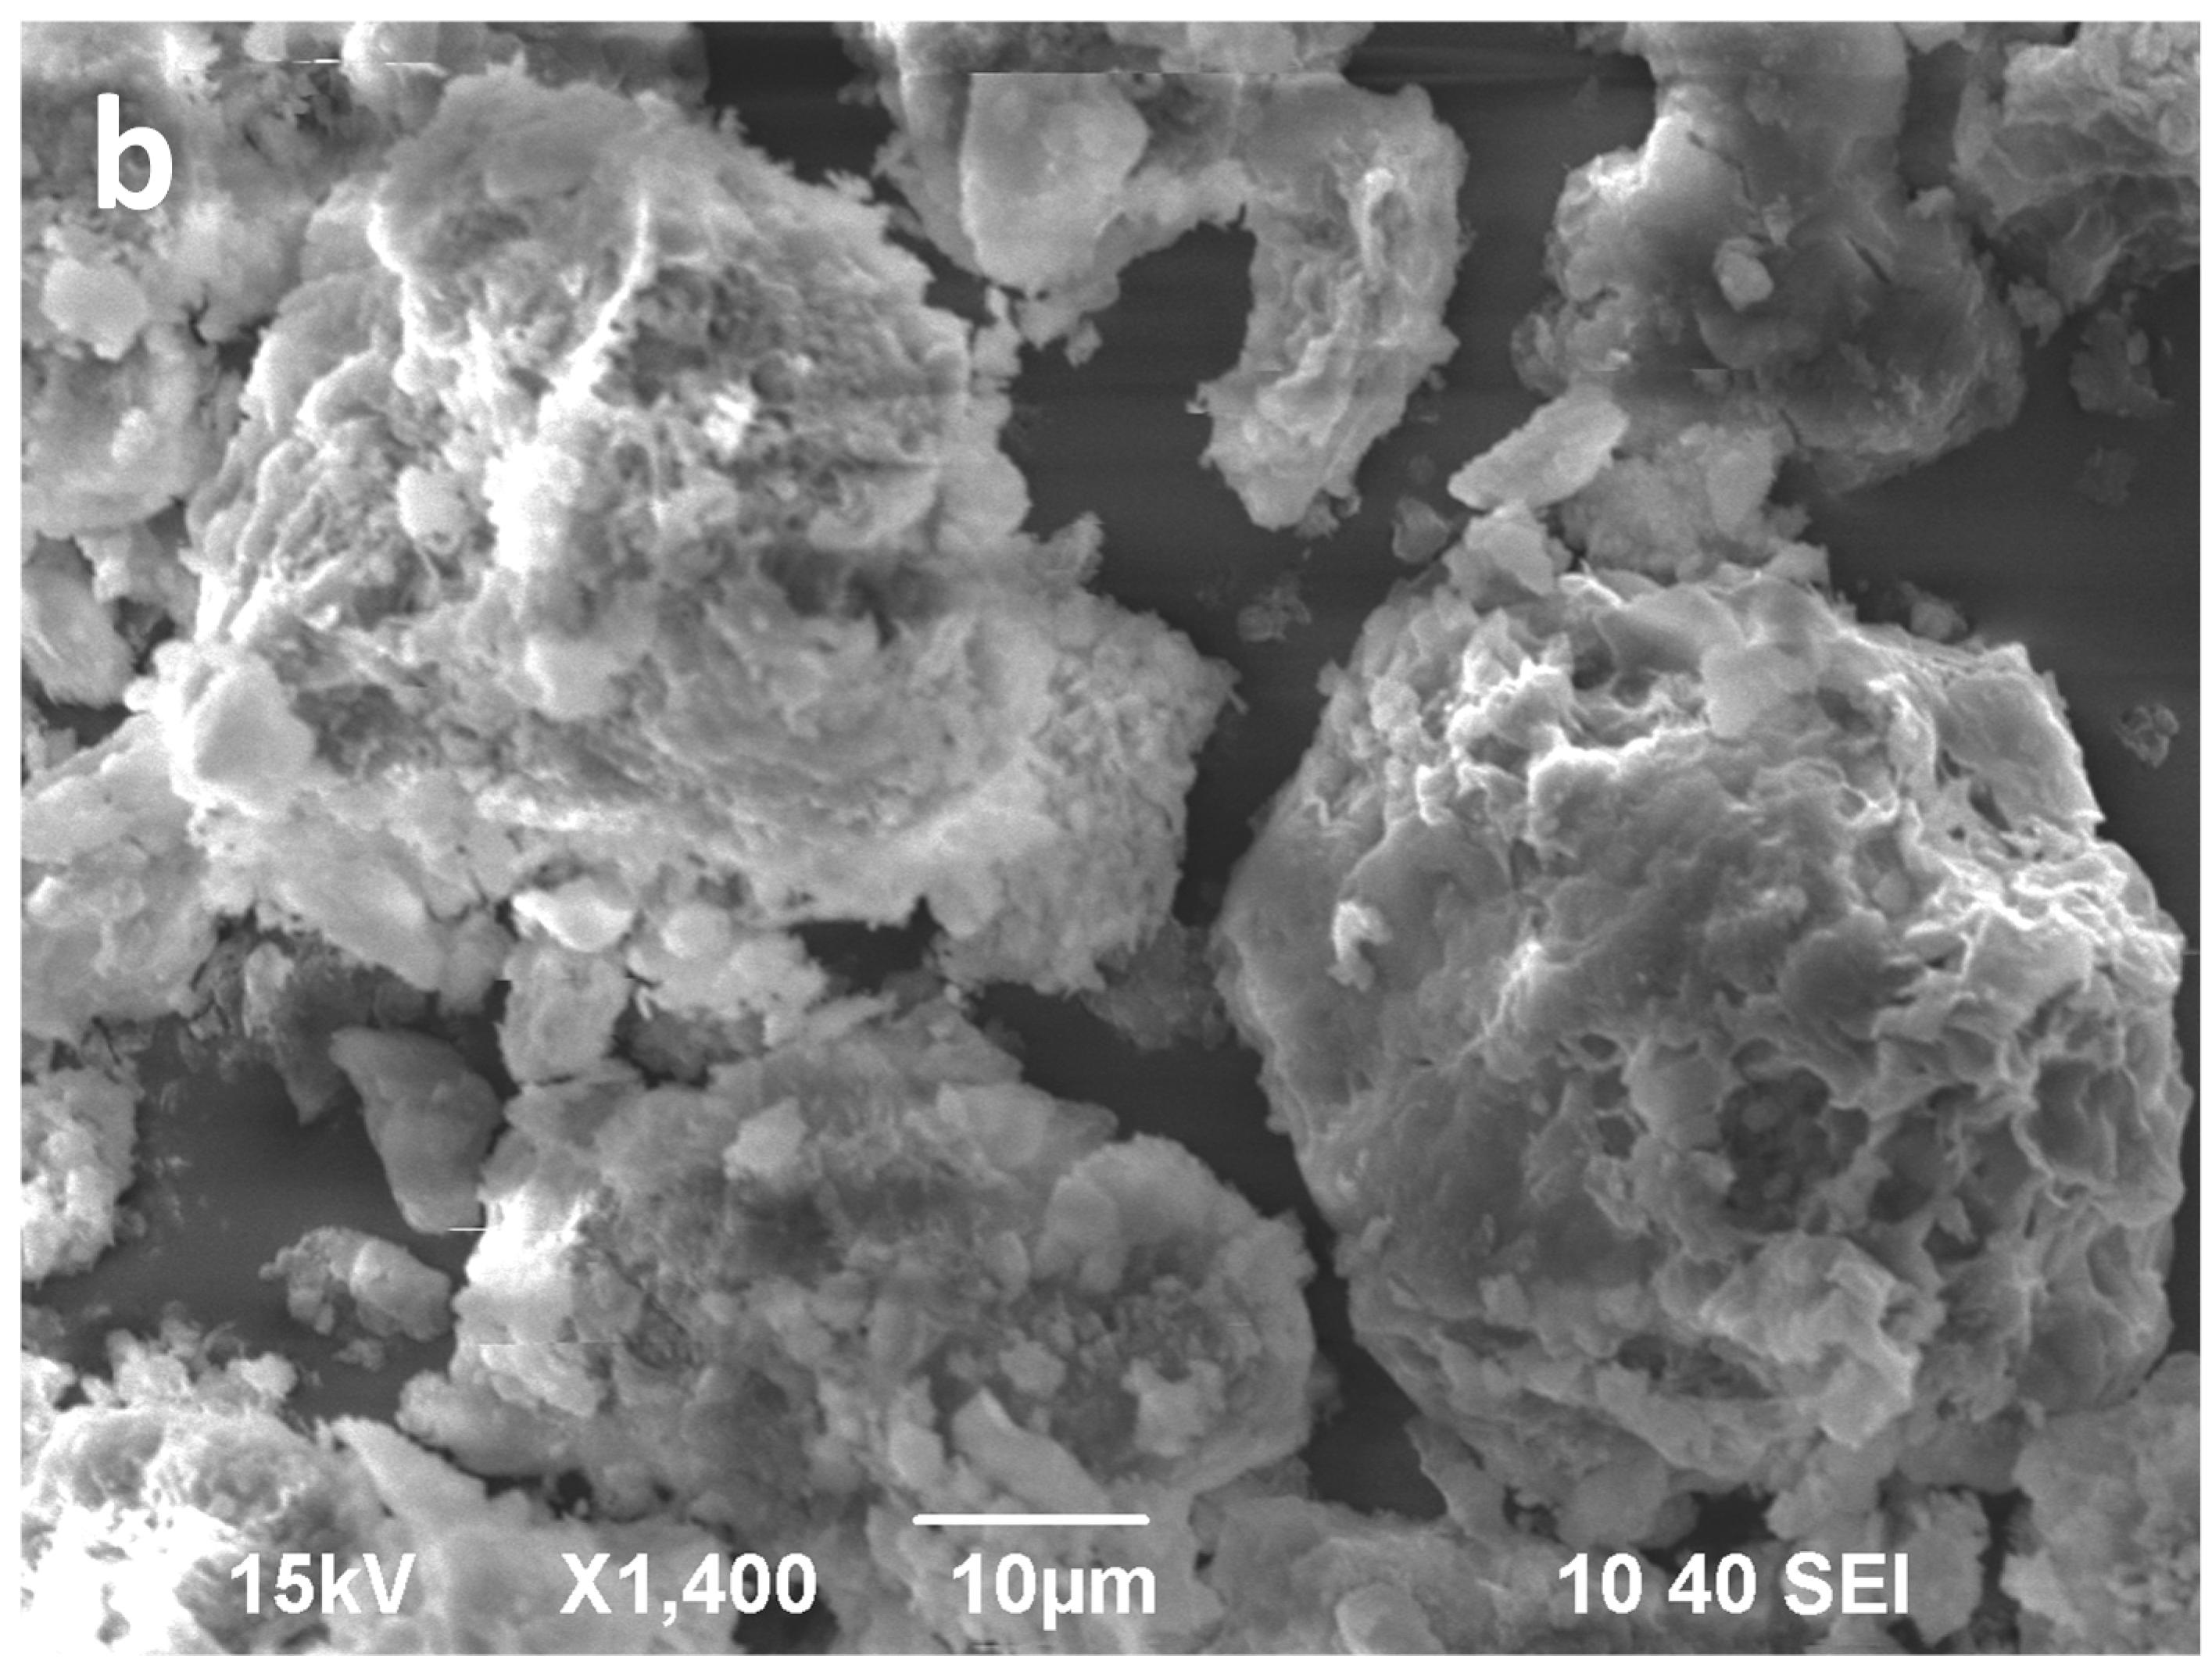
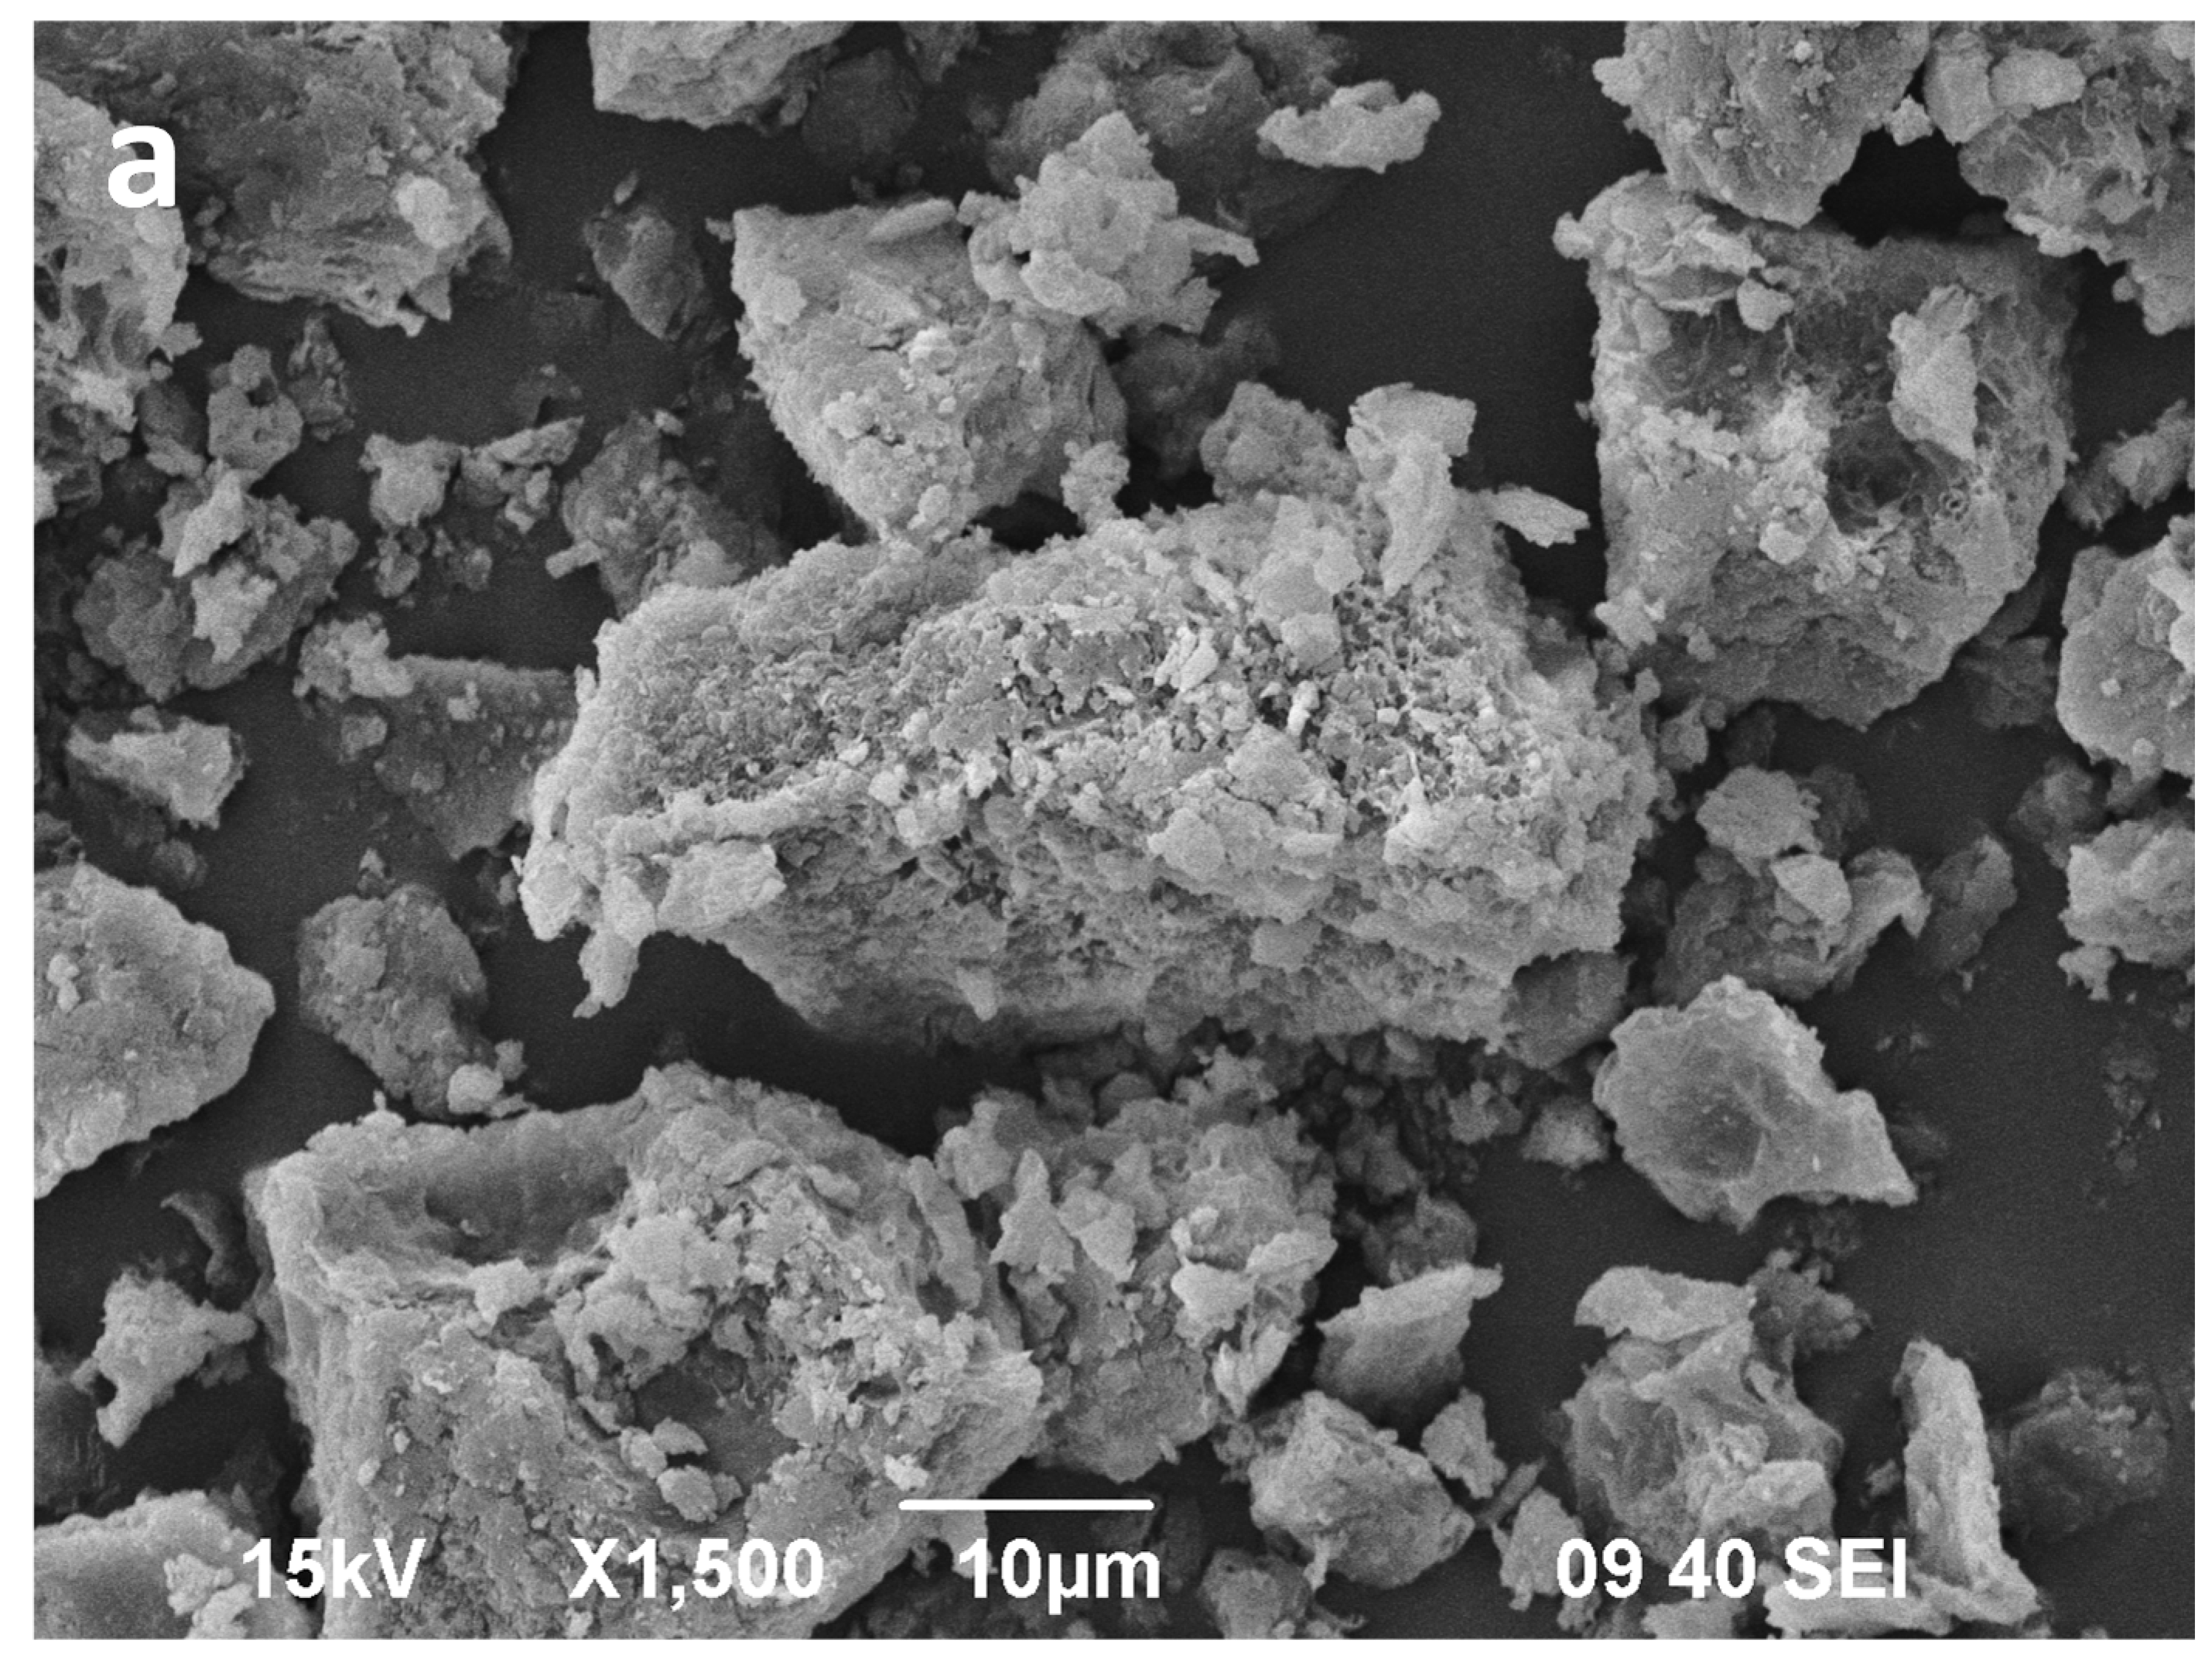
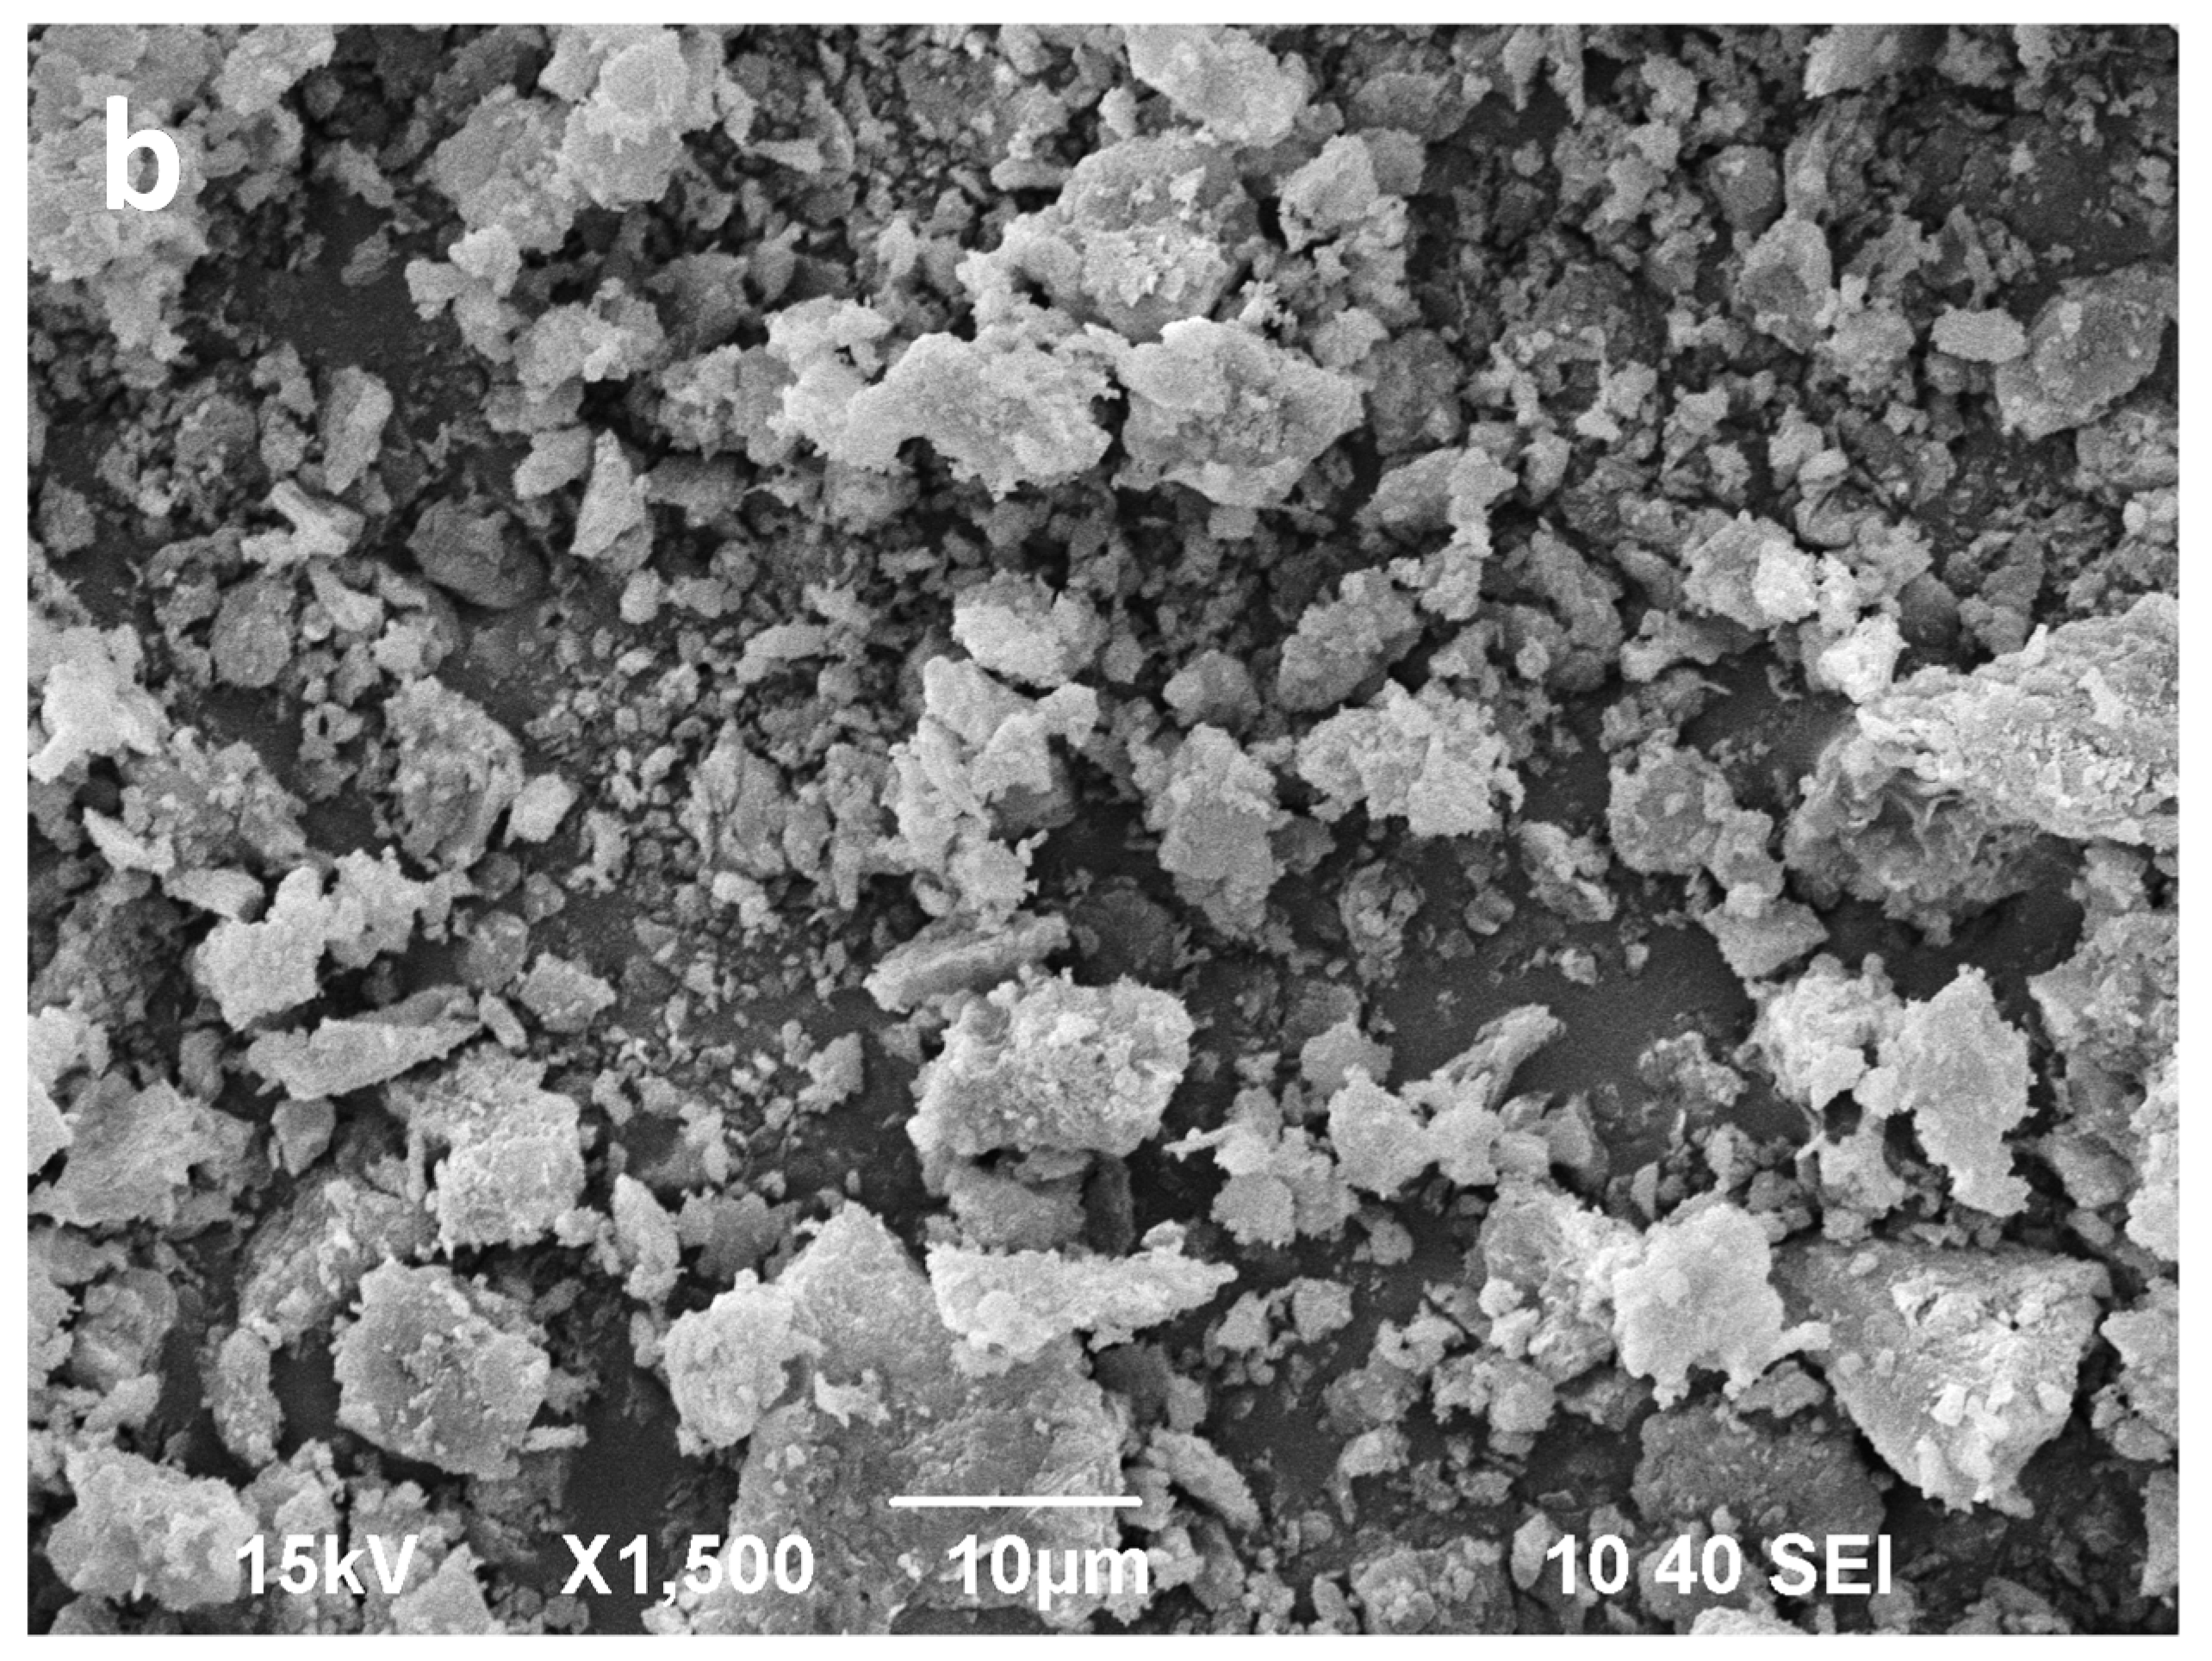
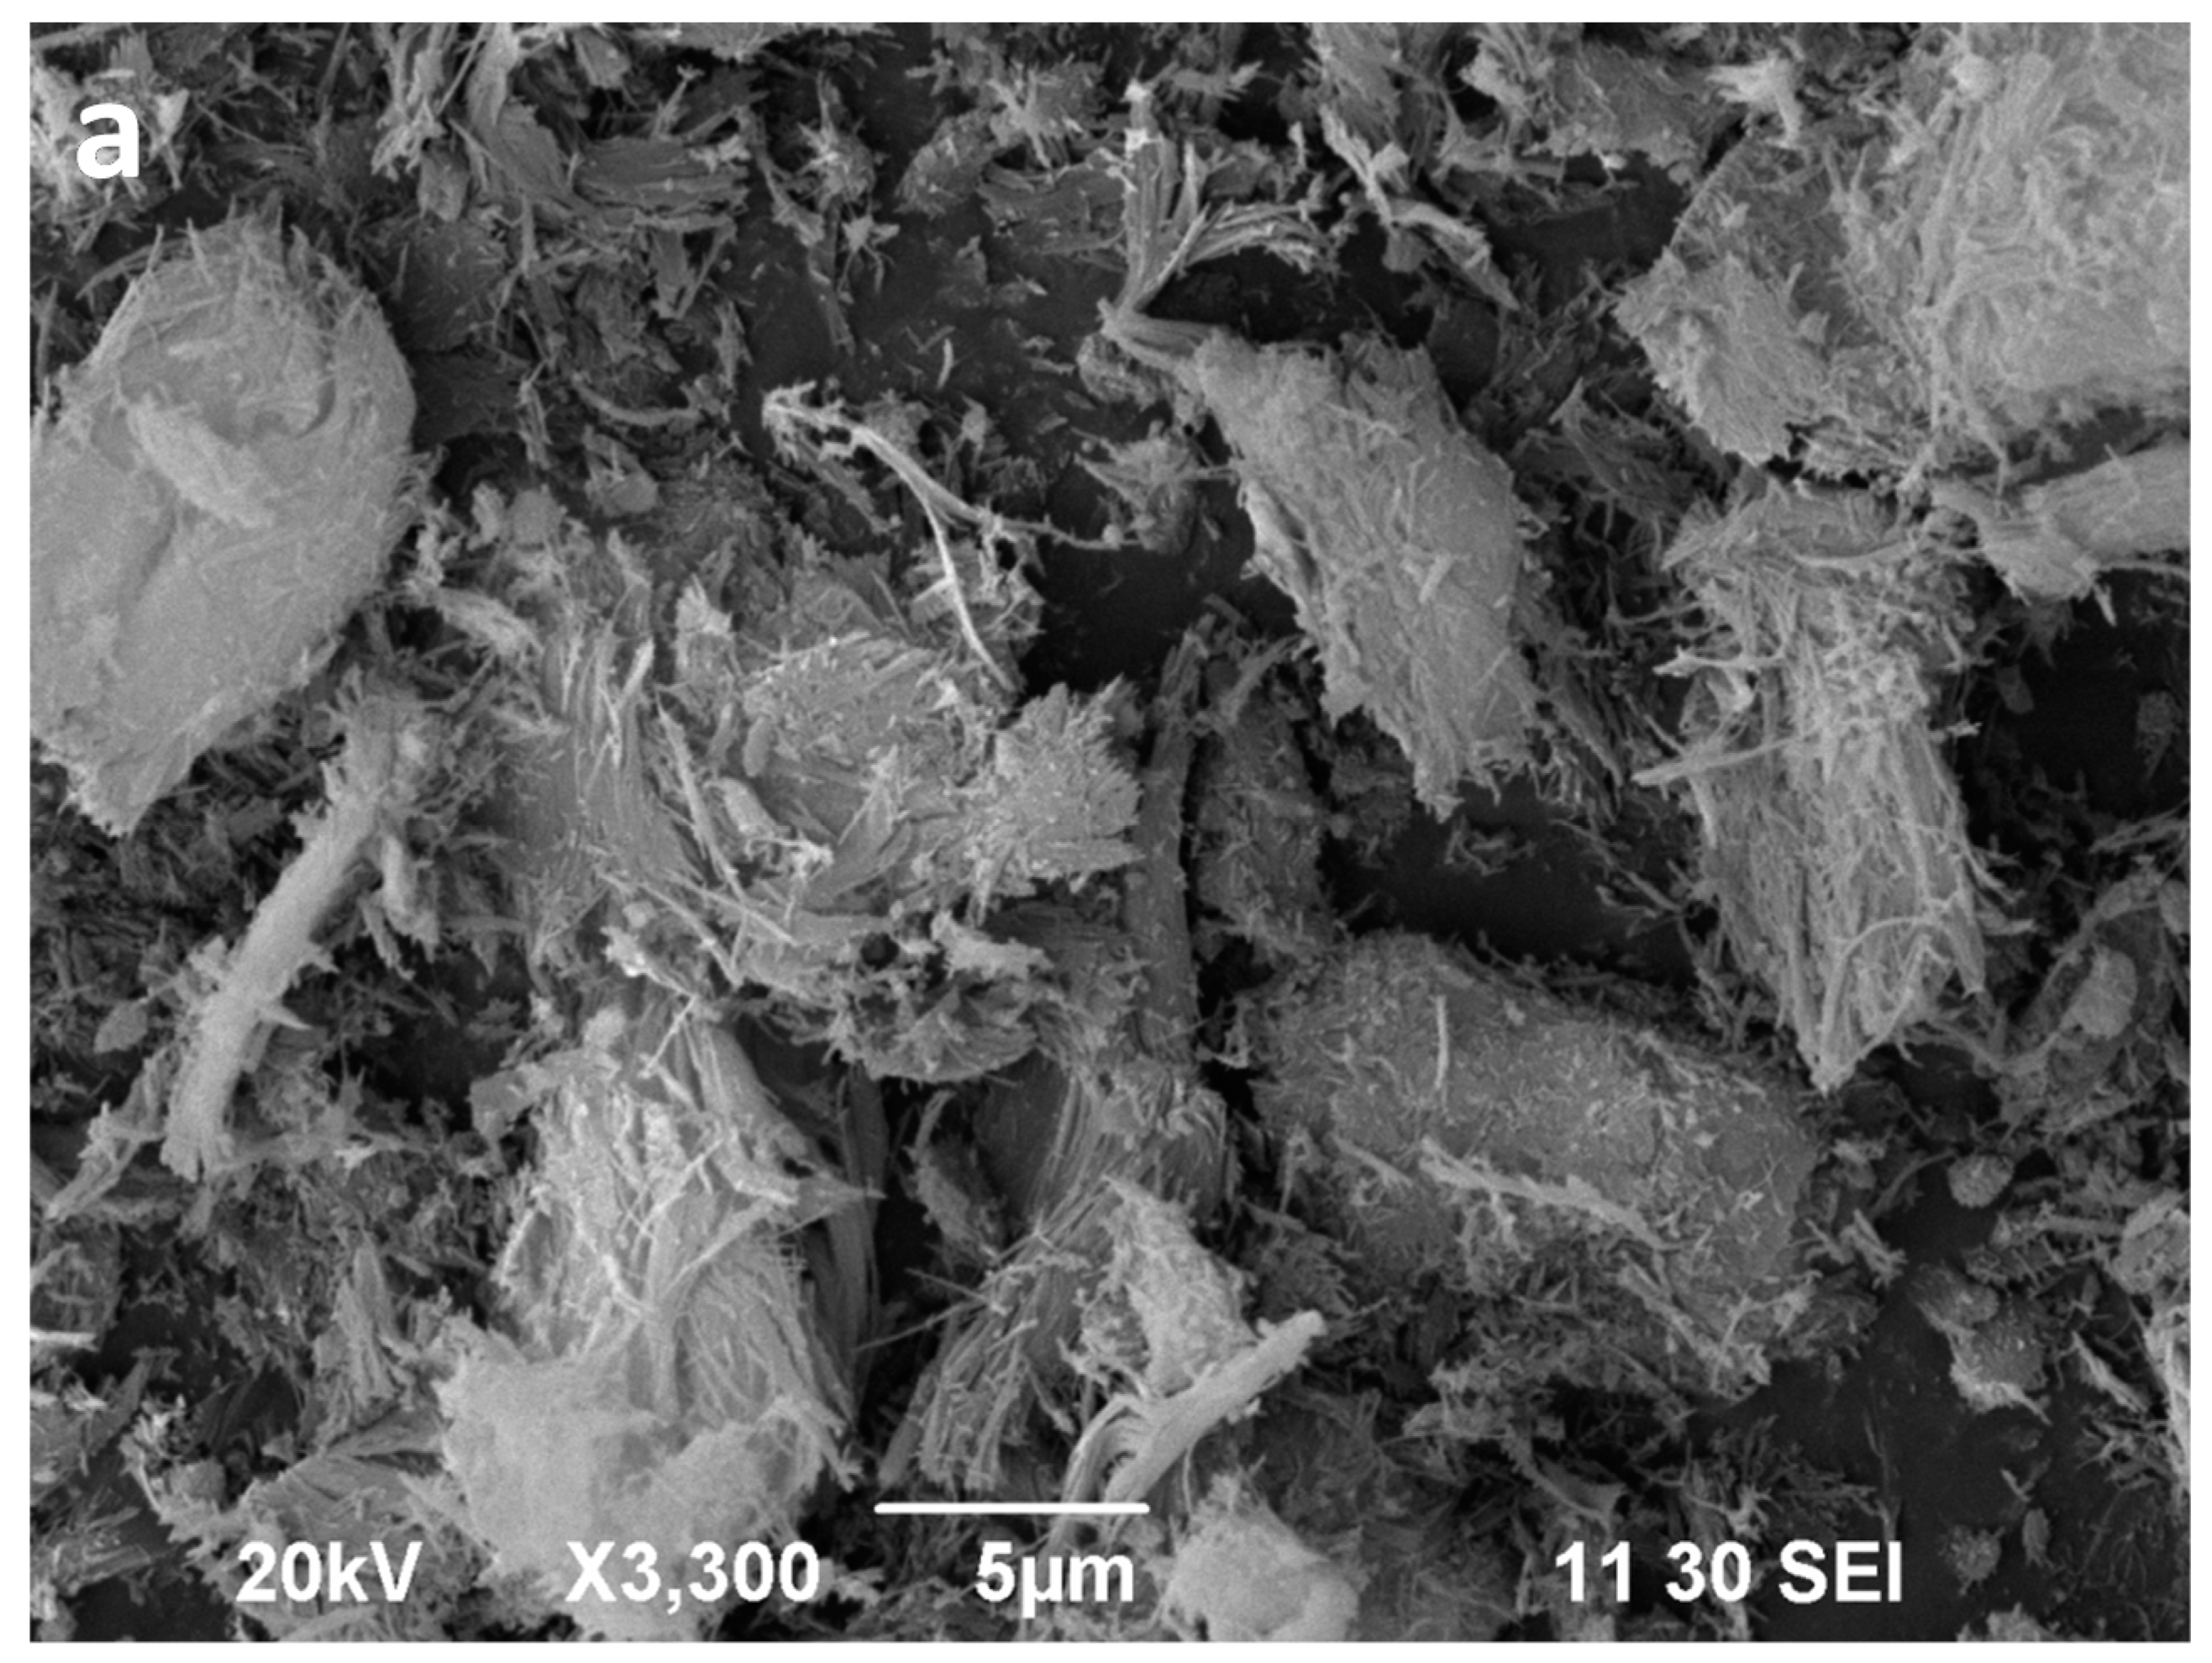
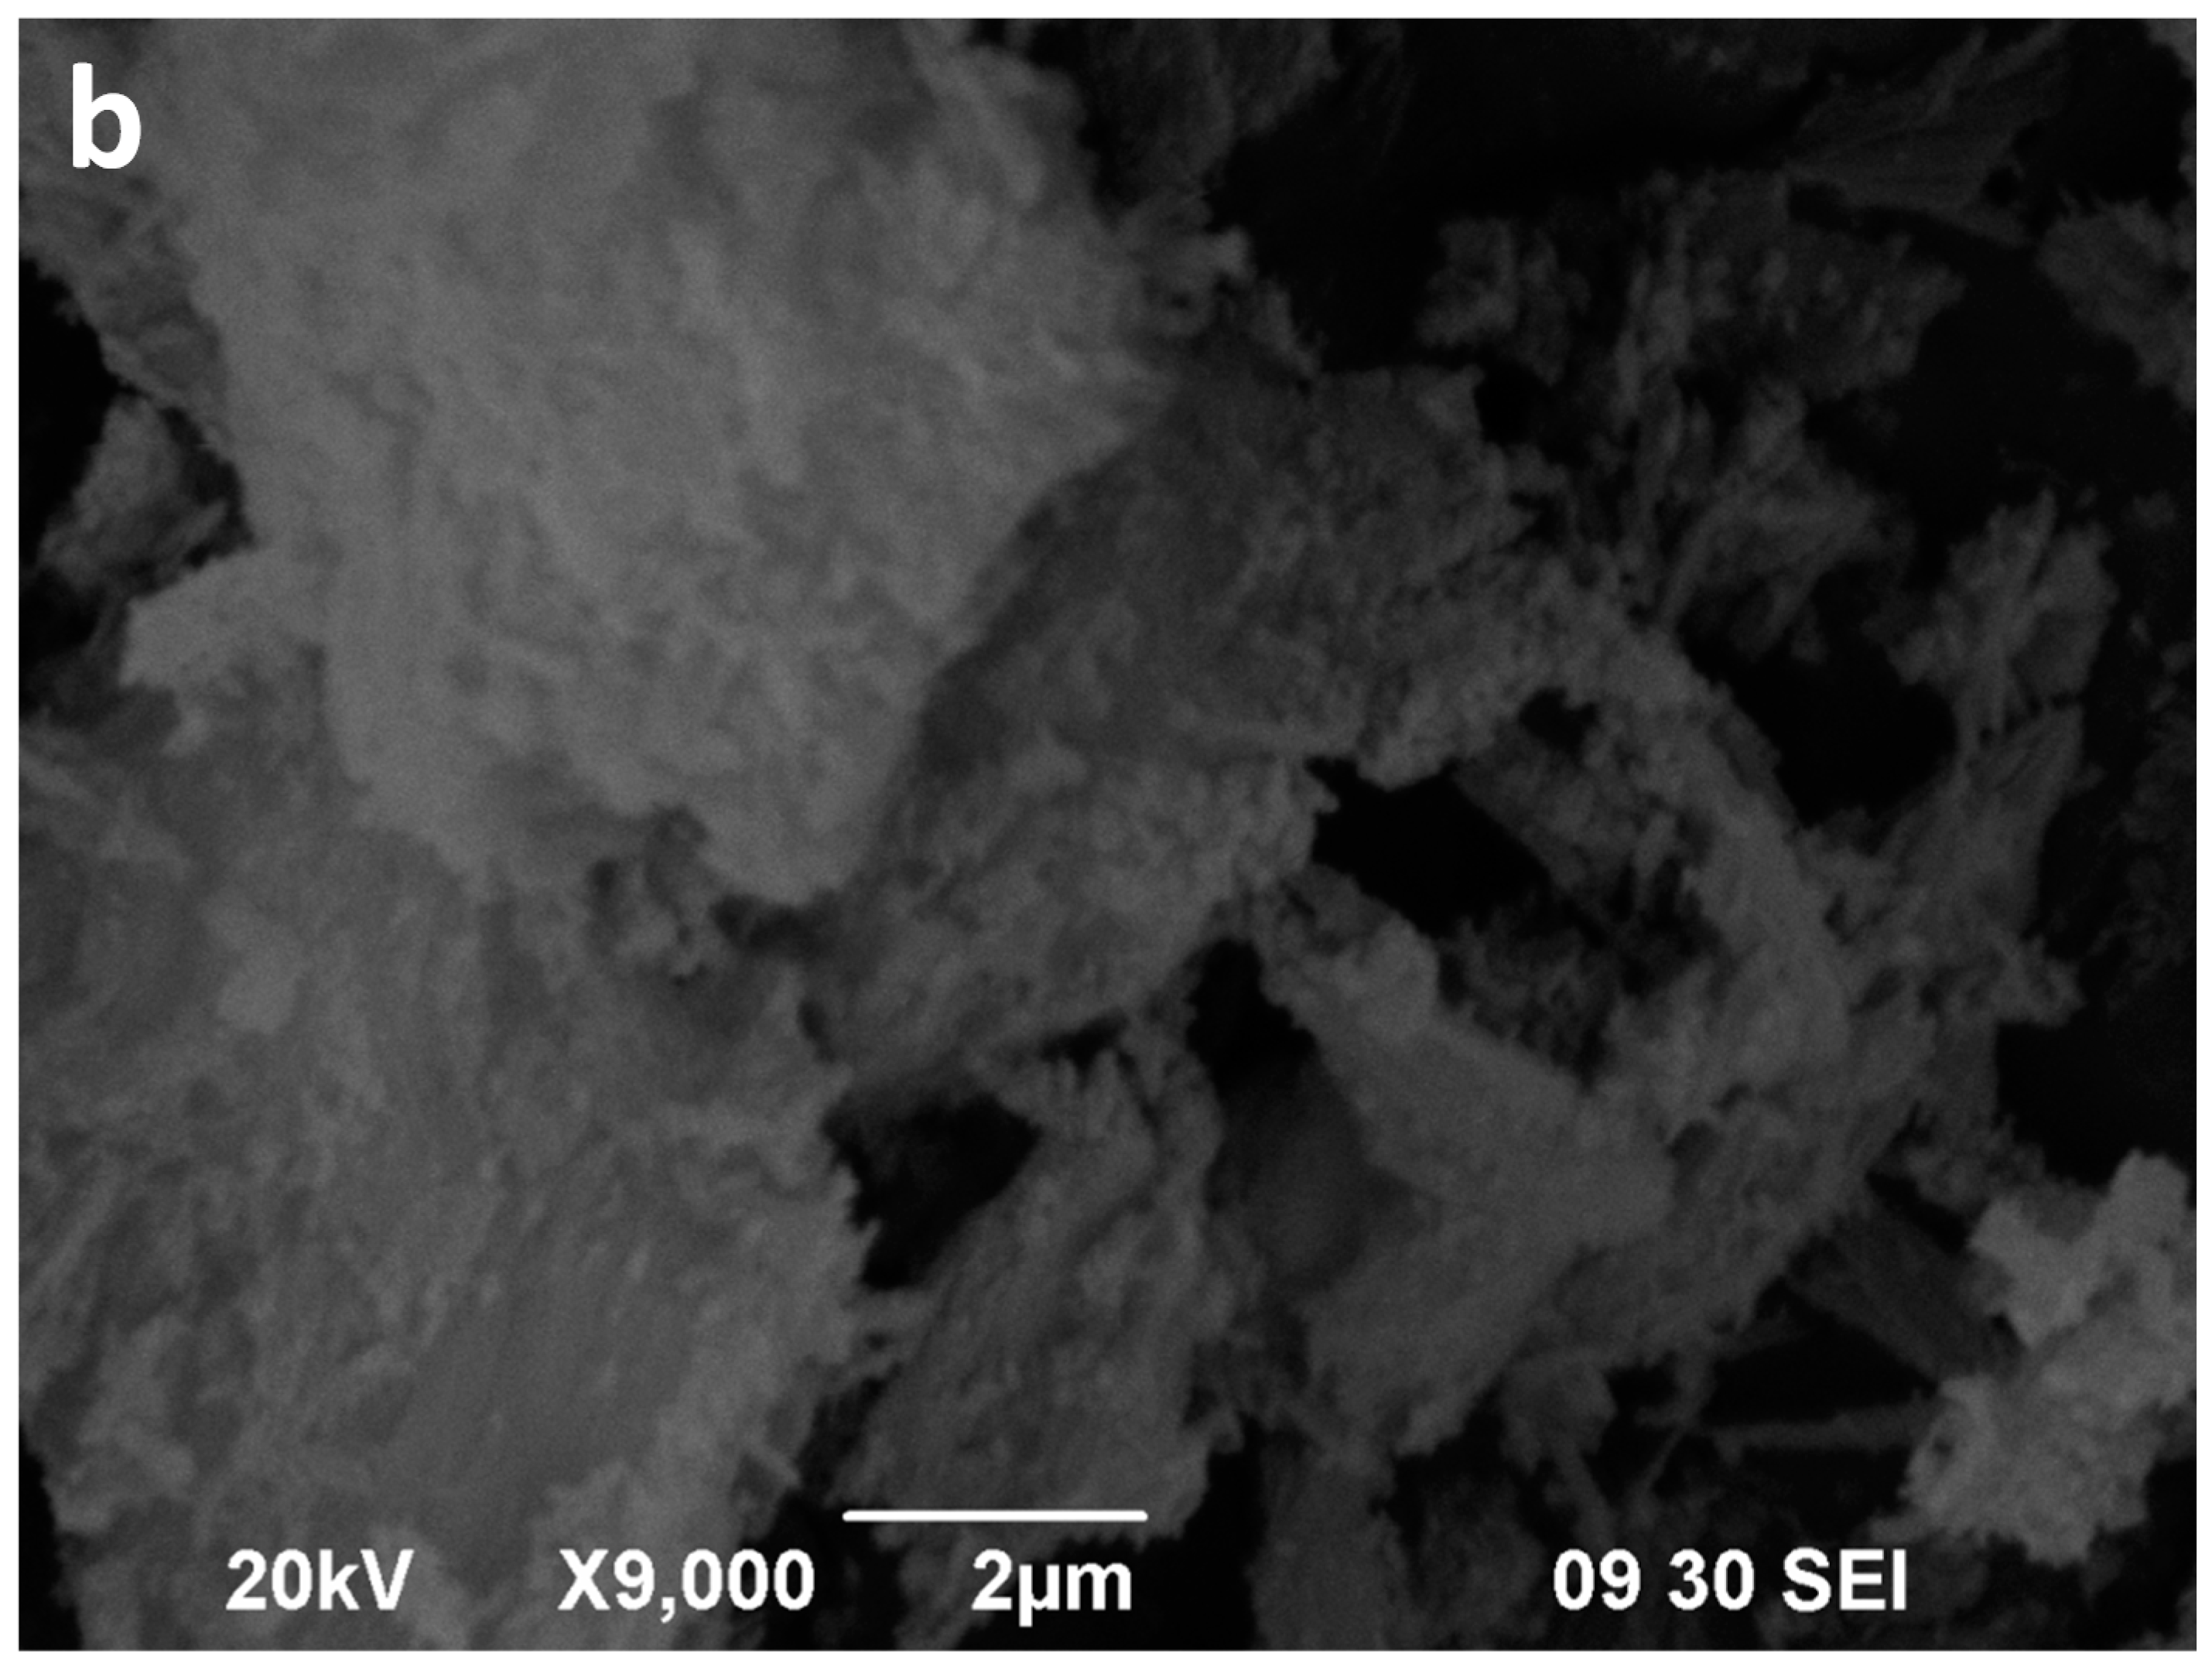
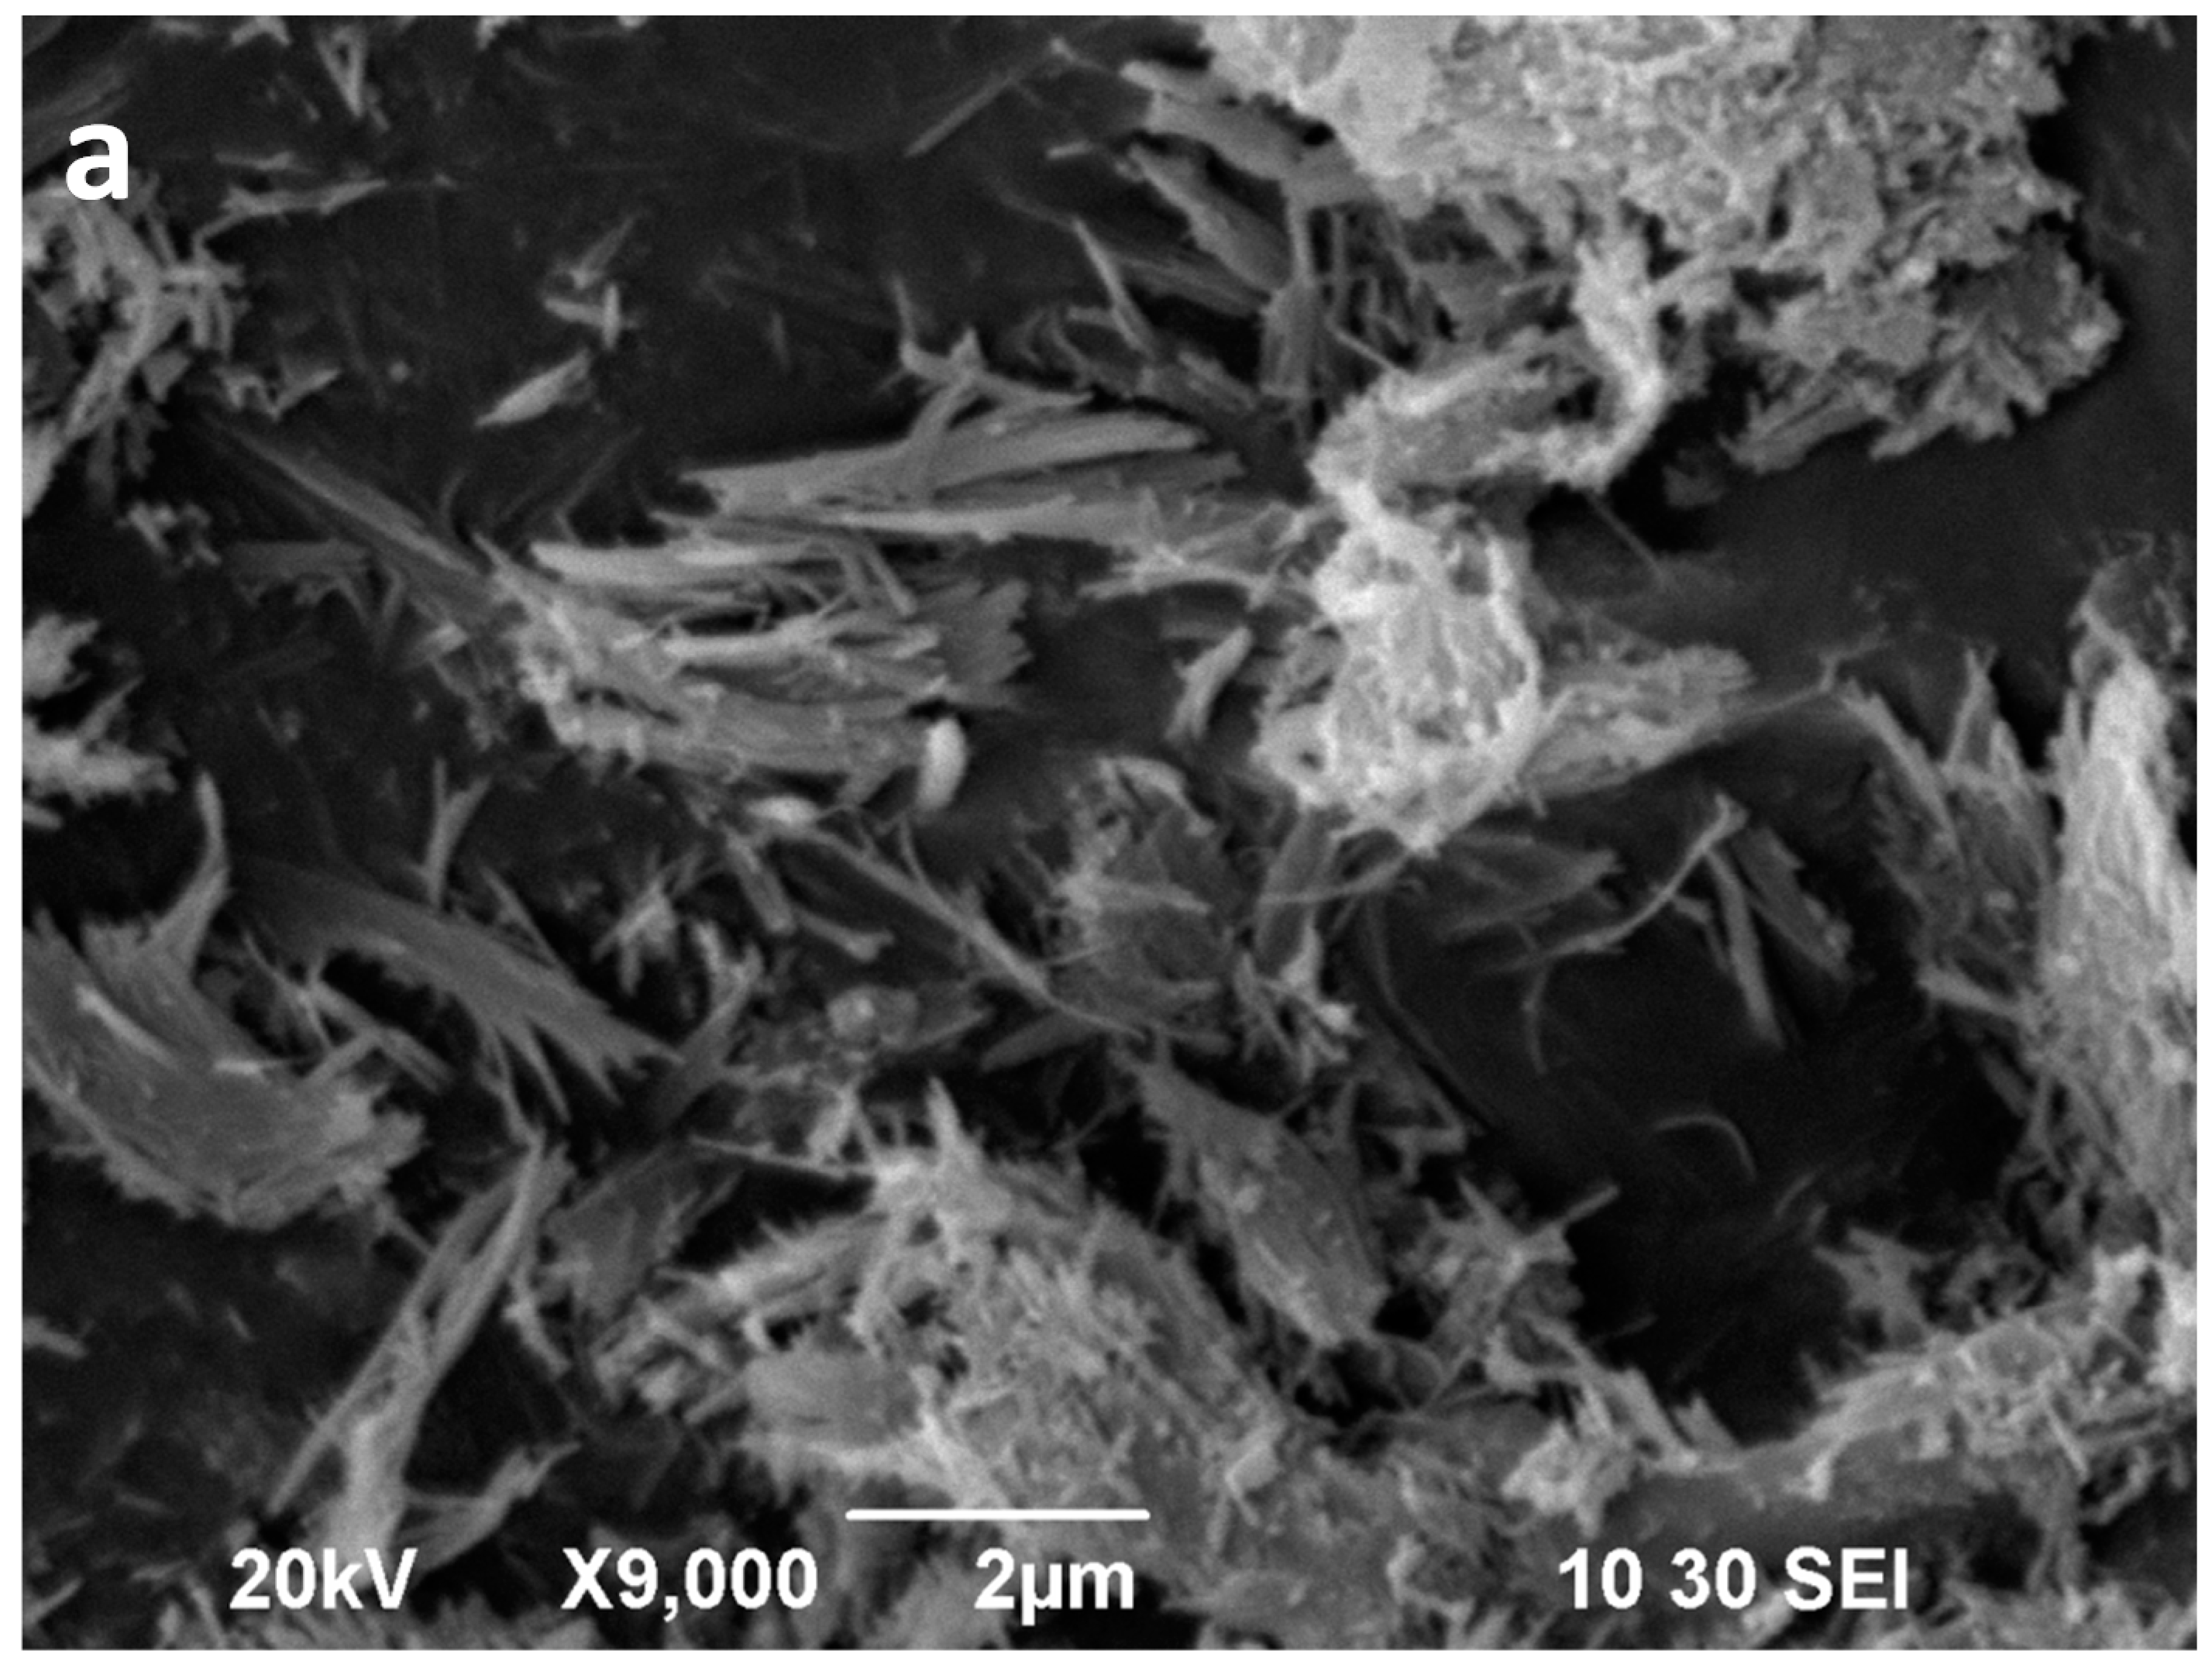
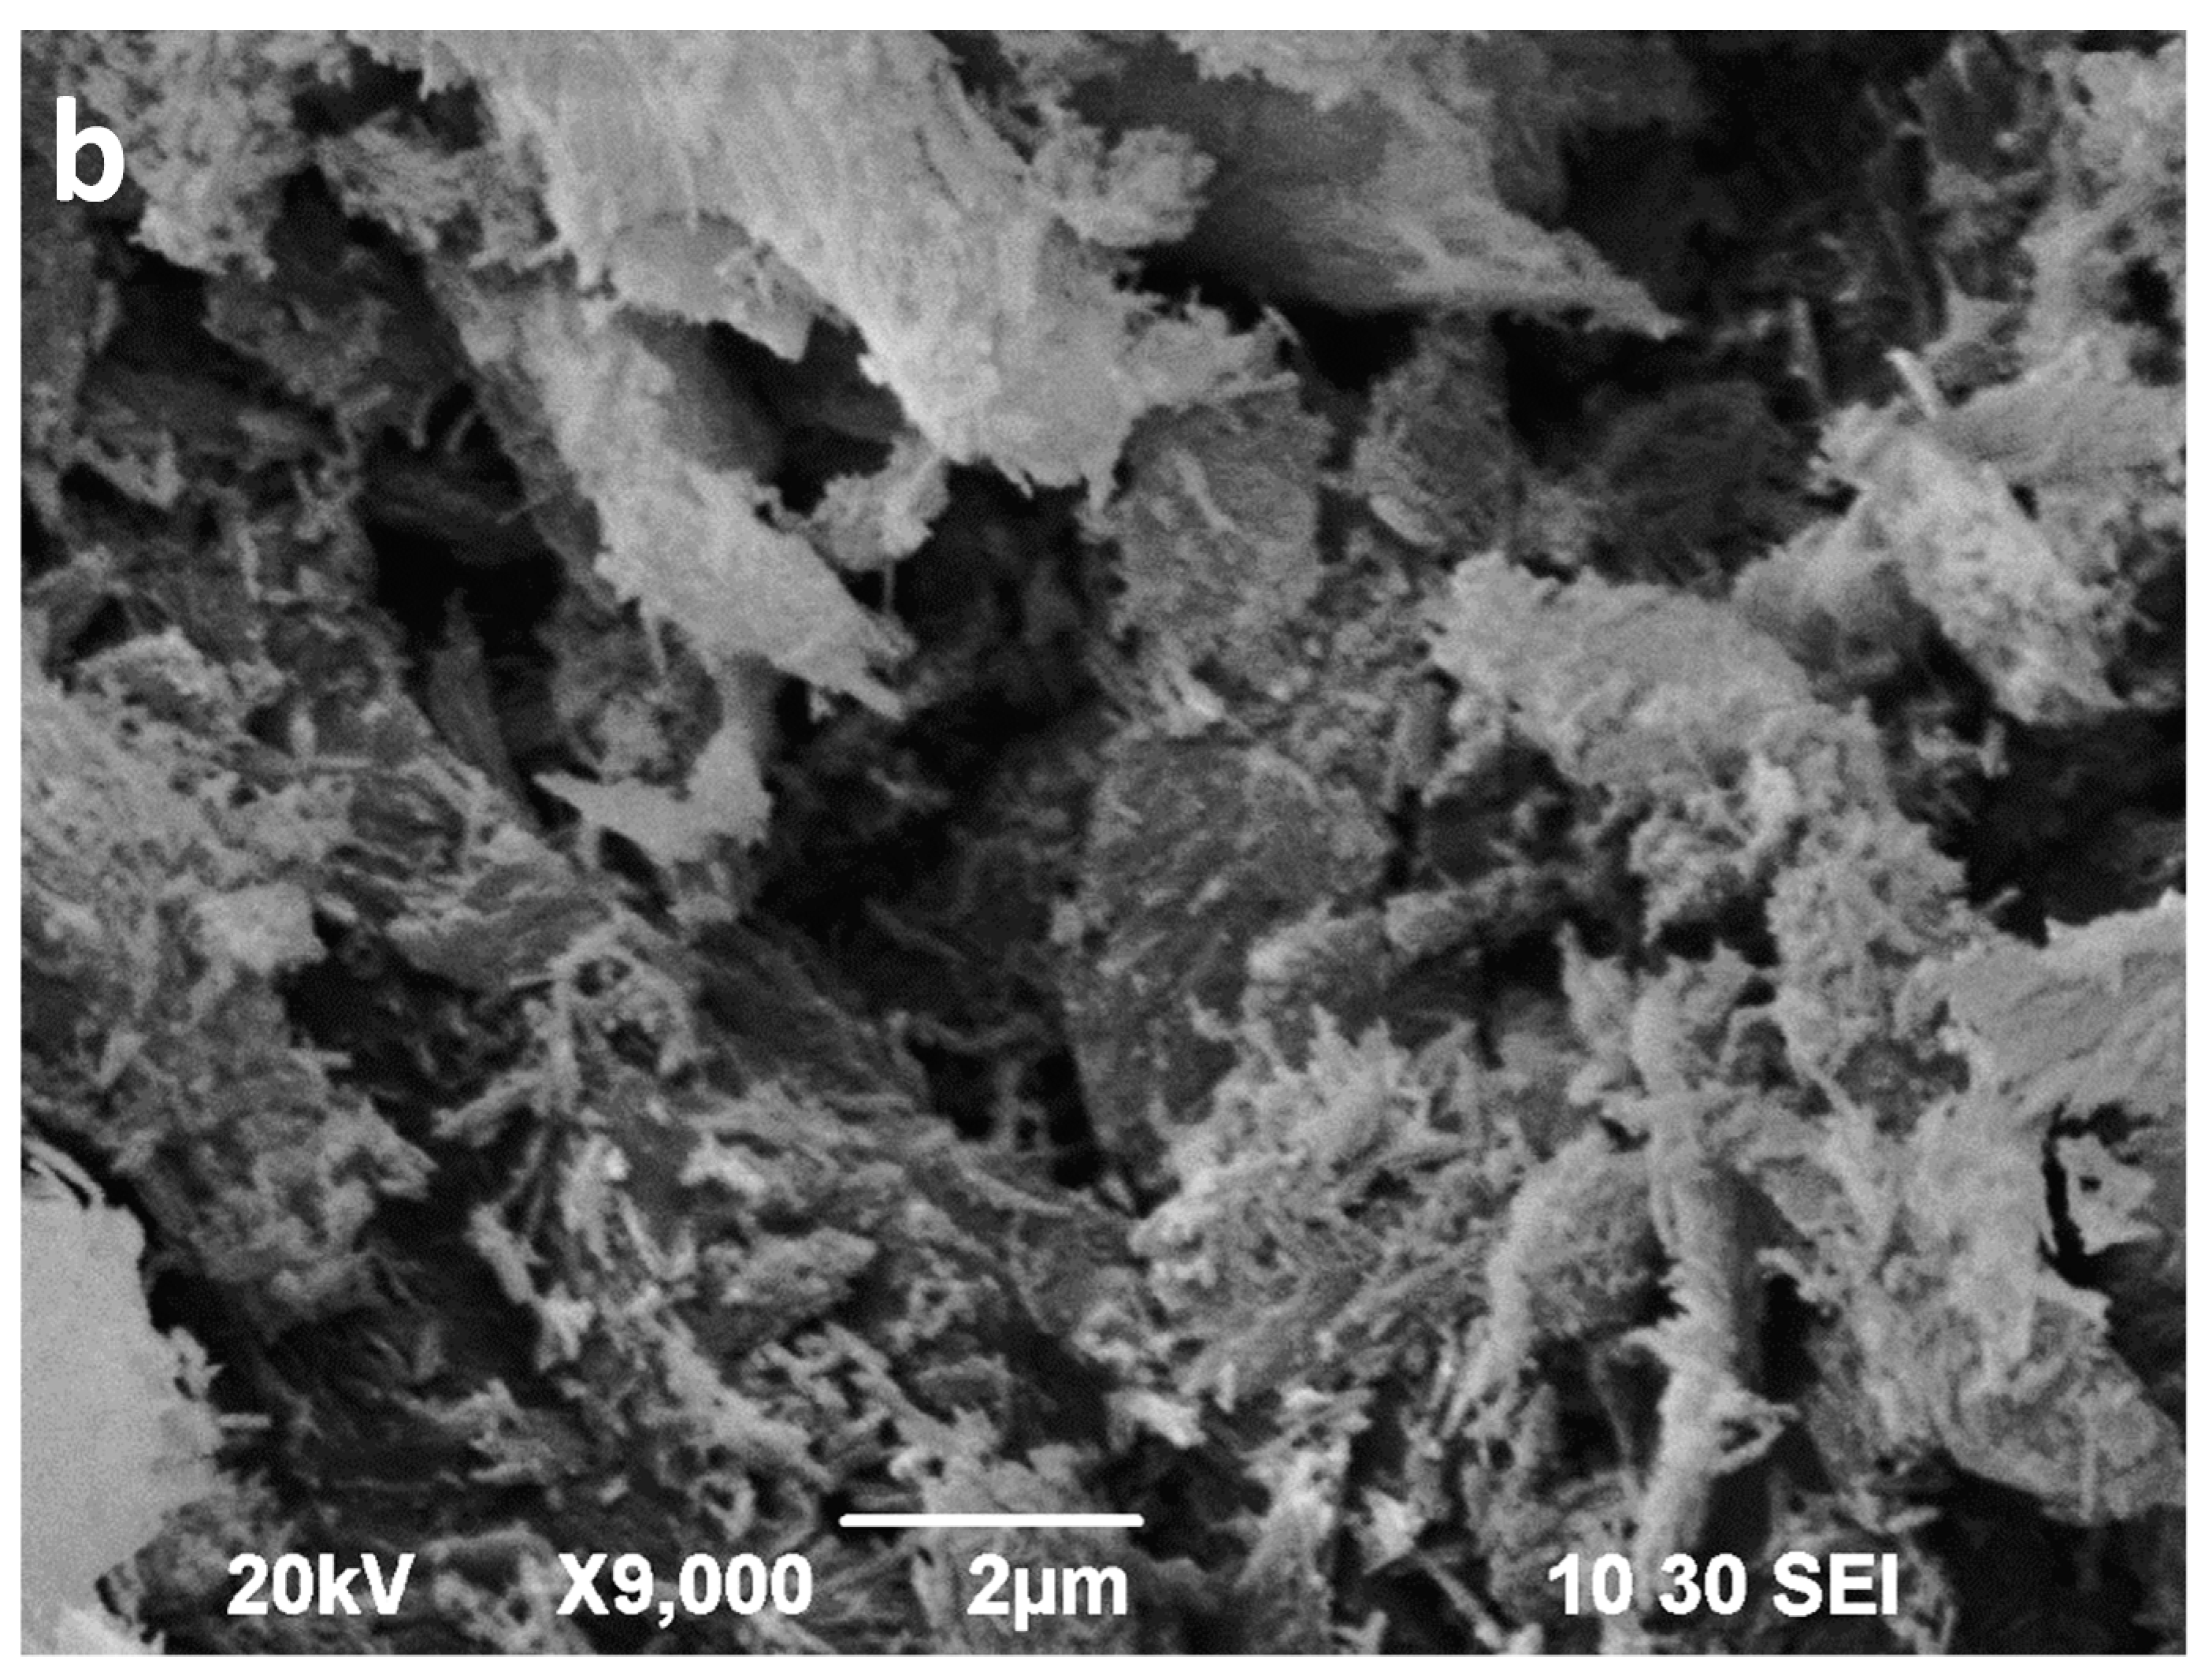
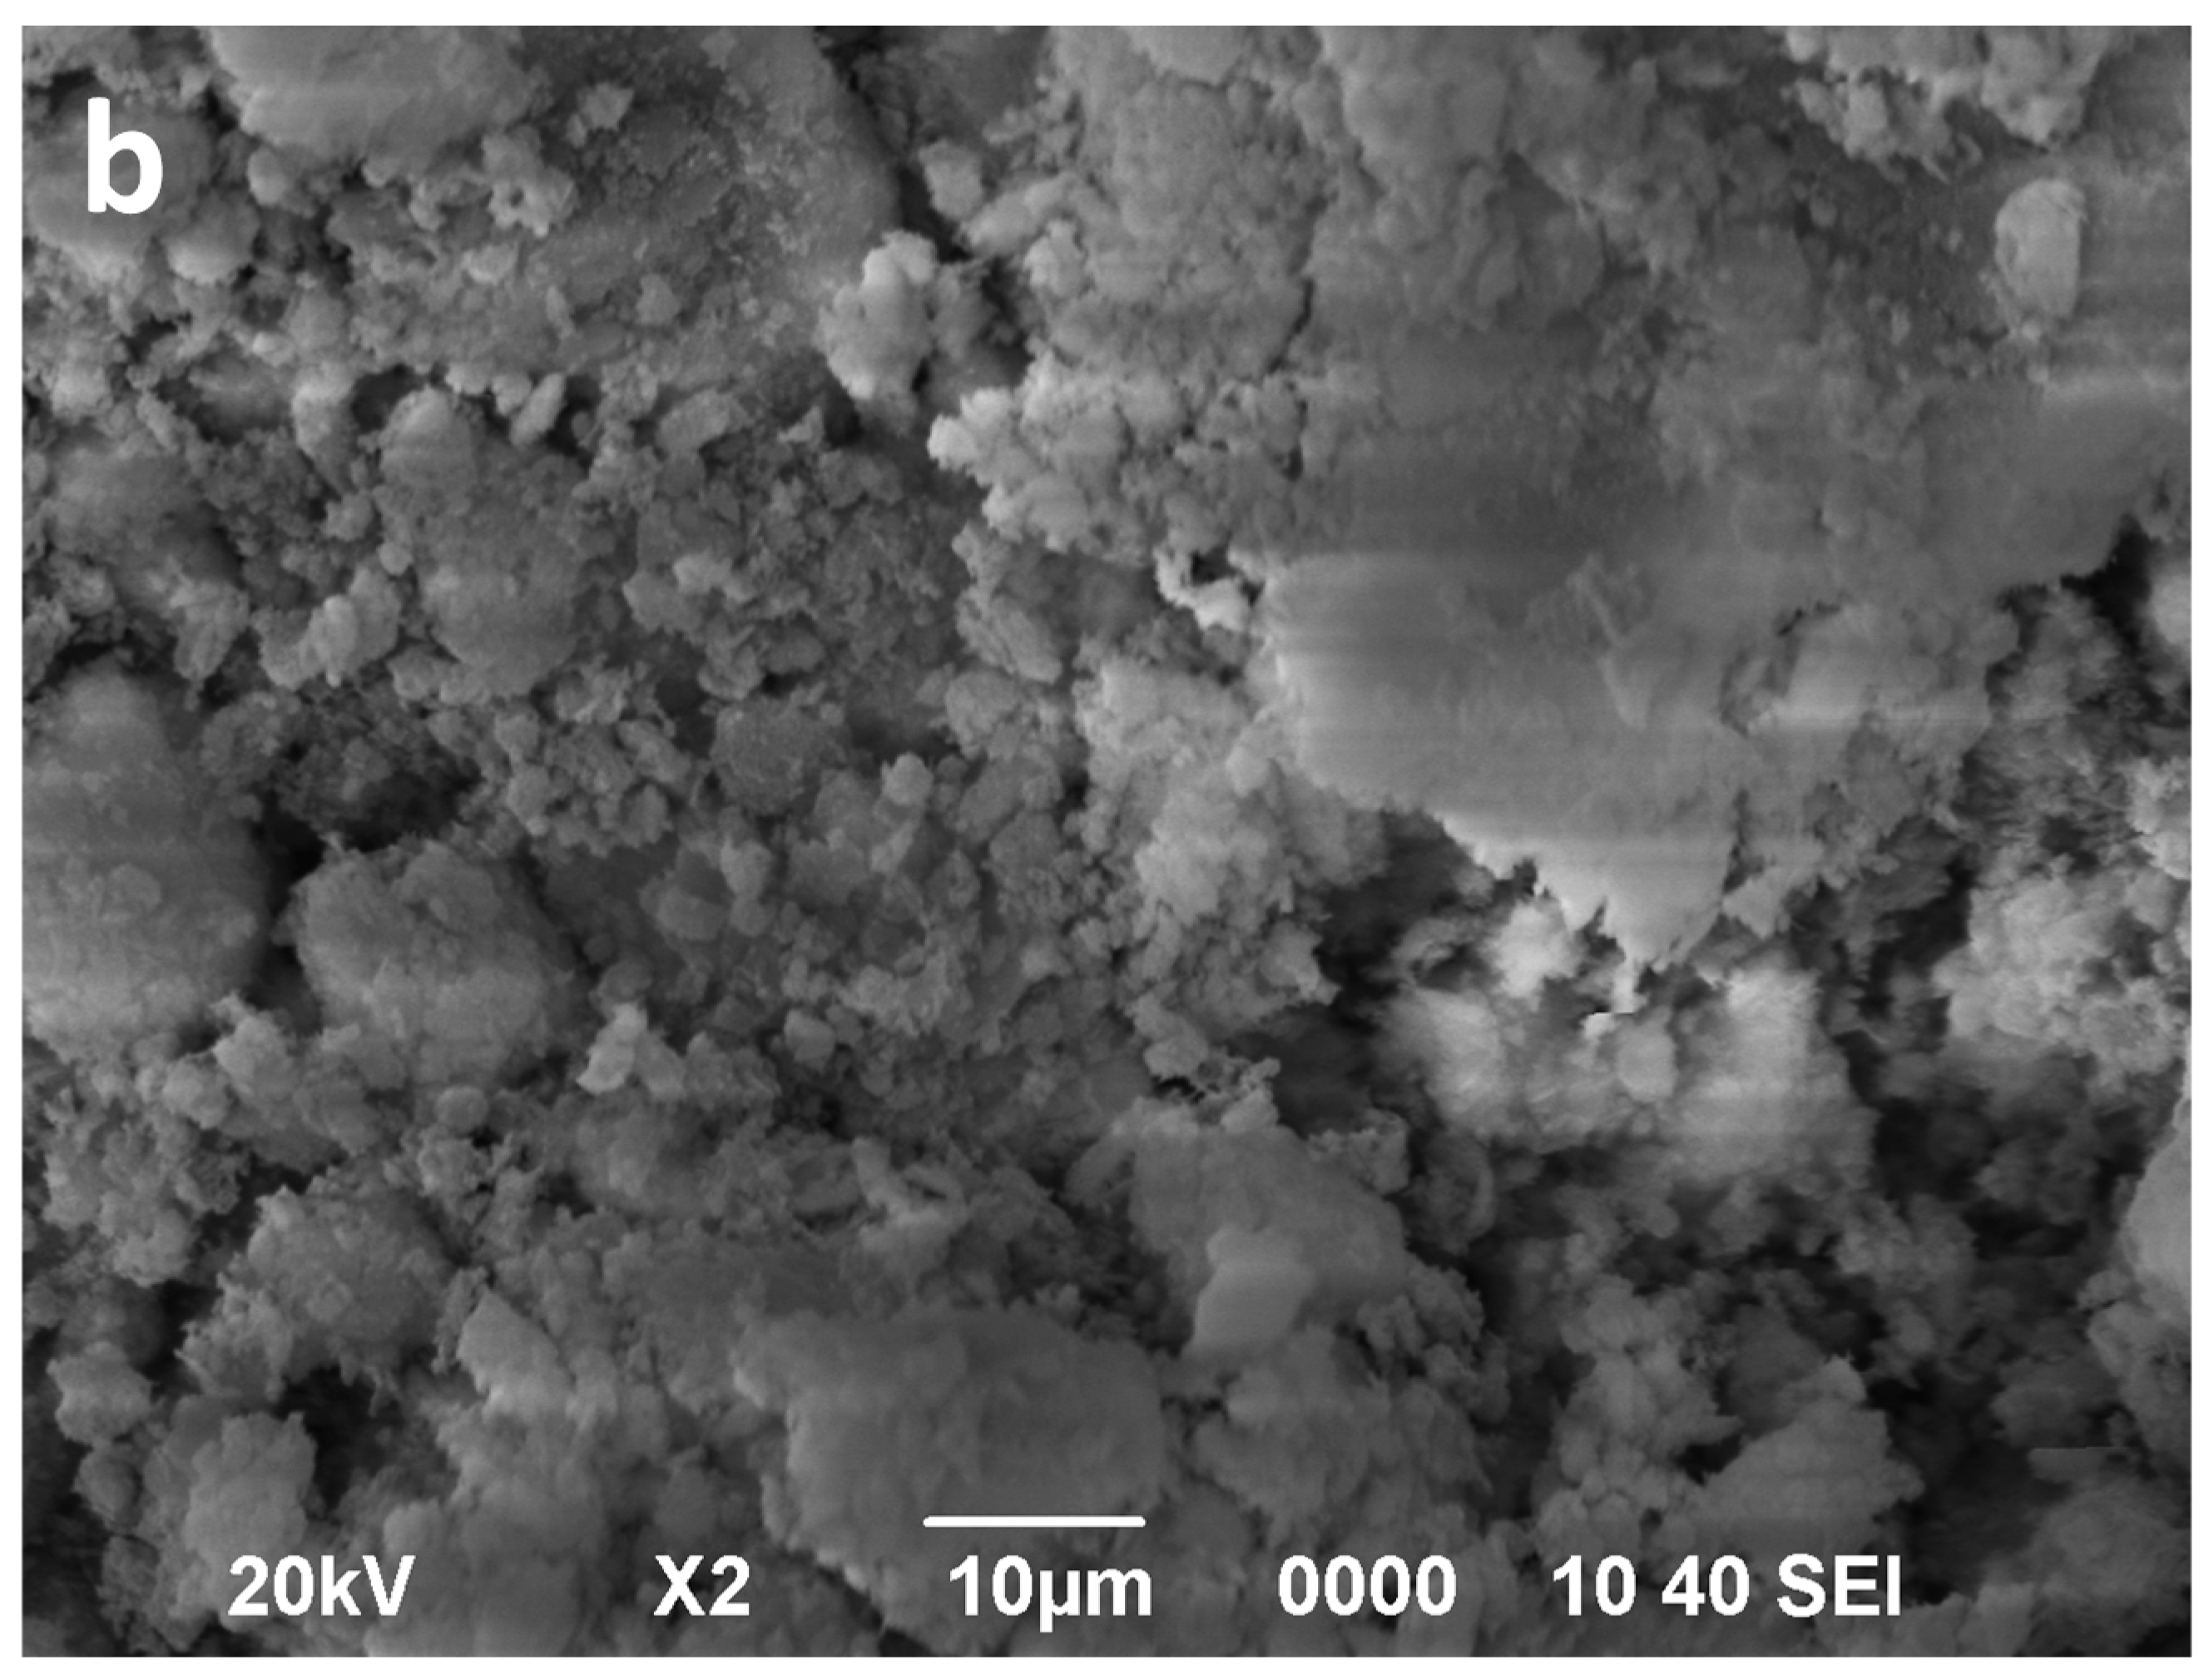
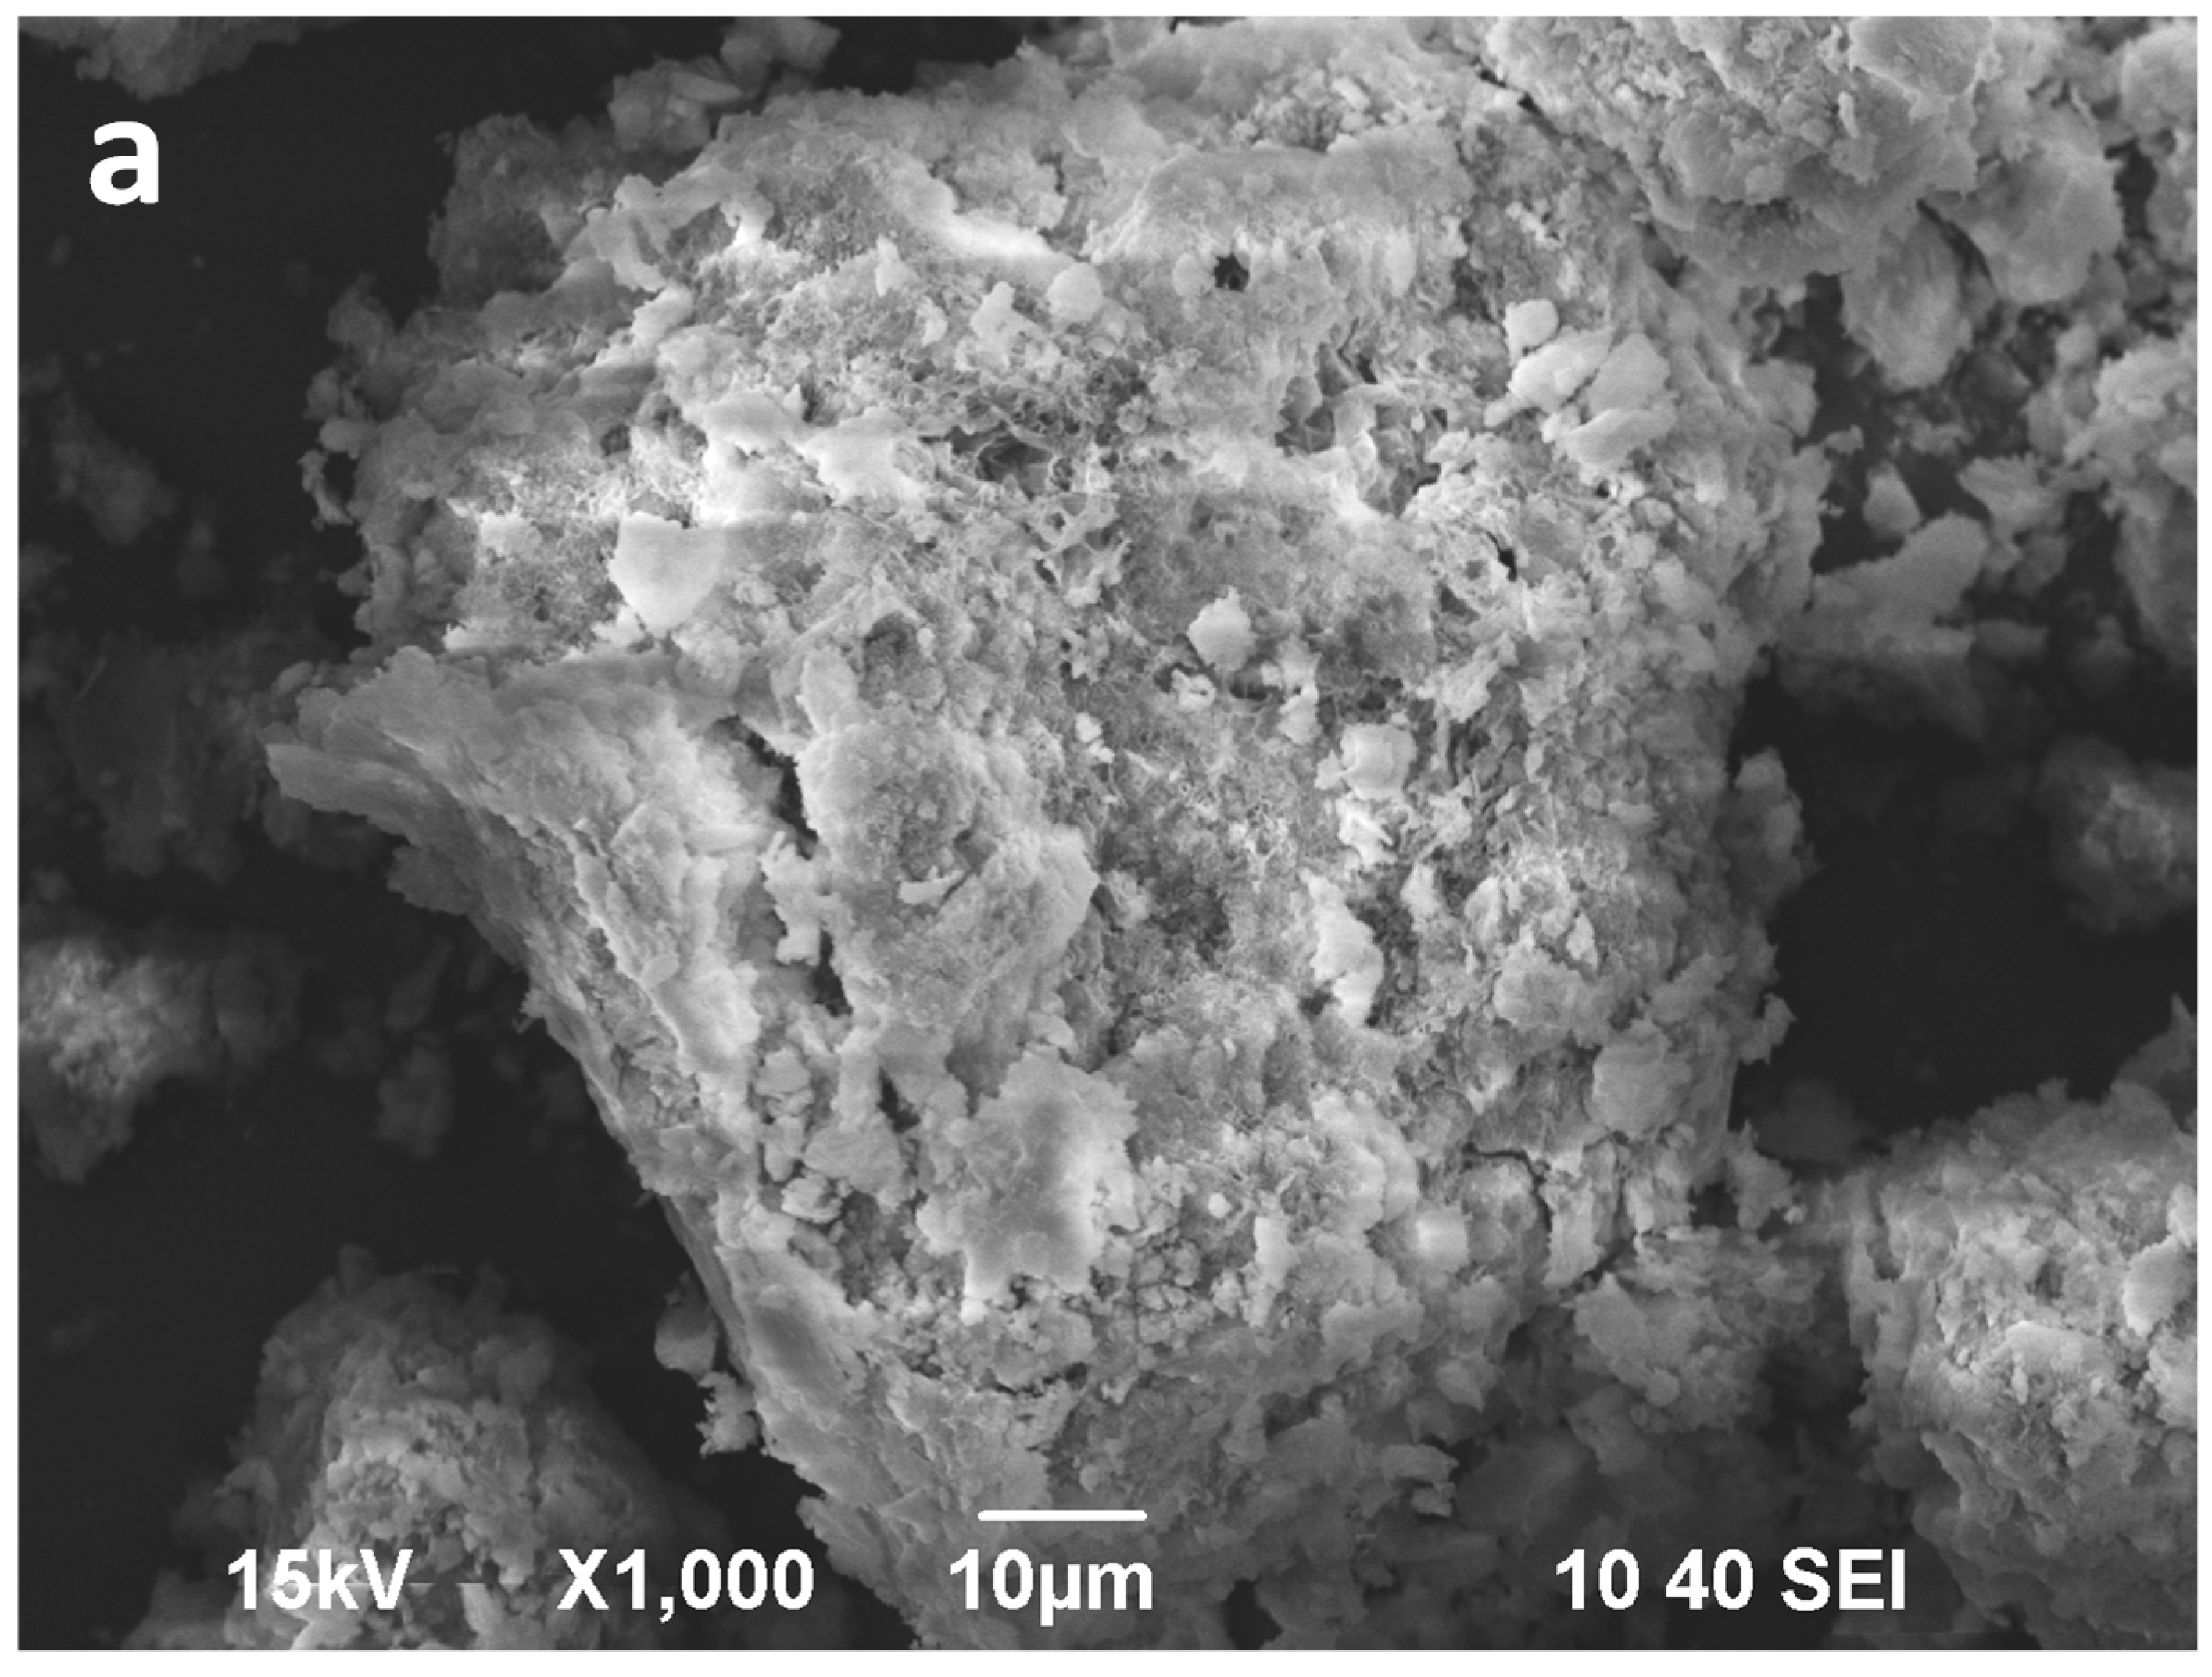
3.5. SEM Examination

SEM micrographs of starting clays and the obtained materials after 16 min of microwave-assisted acid treatment are shown in Figure 6, Figure 7, Figure 8, Figure 9, Figure 10 and Figure 11.

3.5.1. Bentonite

The individual particles of starting montmorillonite (Bm) display laminar morphologies with particle sizes smaller than 5 μm, which appears to be associated in soft aggregates of irregular morphologies (Figure 6a). After 16 min of microwave-assisted acid treatment the individual particles show no significant modification in the shape and distribution of sizes compared to those of the natural montmorillonite (Figure 6b).
The Bs sample shows aggregates similar dimensions than those of the Bm sample. These aggregates are formed by extremely thin lamellar particles with larger dimensions along the (001) faces and with very jagged contours (Figure 7a). Contrary to that observed in Bm sample, the microwave-assisted acid treatment of Bs sample (Figure 7b) strongly affects the morphological features of the saponite particles and its aggregates. This treatment causes the size of the aggregates and their individual particles to decrease.

3.5.2. Kerolitic Clay

Regarding kerolitic clays, the individual particles of the starting K1 sample exhibit extremely thin lamellar morphologies that appear to be, in general, smaller than those observed in the saponite sample (S) (Figure 8a). The sizes of the higher proportion of the individual particles are smaller than 10 μm. These individual particles form highly porous aggregates with sizes ranging between 20 and 50 μm. Similar observations can be made in the SEM micrograph of K2 particles shown in Figure 9a.
Figure 8 and Figure 9 also show SEM micrographs of the 16-min acid-activated K1 and K2 samples. A detailed comparison of Figure 8a,b suggests that no significant decrease in the size of the porous aggregates occurs after 16 min of MAT. However, some textural changes in the external surface of aggregates suggest changes in their porosity. On the contrary, the comparison of Figure 9a,b suggests a slight decrease in the size of the porous aggregates of K2 sample. Nevertheless, the proportion of clay-sized particles (<2 µm) appears to be unchanged during the treatment in both K1 and K2 samples.

3.5.3. Sepiolite

The starting sepiolites (Sp1 and Sp2) show their typical fibrous habit (Figure 10a and Figure 11a). In the Sp1 sample the individual fibres are commonly longer than 6 μm (Figure 10a), whereas in Sp2, the main population consists of fibres shorter than 2 μm (Figure 11a). Moreover, the diameter of the fibres seems remarkably wider in Sp2. These fibres commonly form bundles consisting of parallel or tangled fibres [59]. The two starting sepiolites also differ regarding size and morphology of their aggregates. In general, the largest aggregates are found in the Sp1 sample (Figure 10a) and the smallest in Sp2 (Figure 11a).
The SEM images of the acid activated sepiolites show a slight disaggregation of the blocky aggregates (bundles) in the first minutes (not shown), followed by a sharp decrease in the length of aggregates as well as in the length of the individual fibres. Finally, after 16 min of MAT, the fibres show a very poorly defined morphology (Figure 10b and Figure 11b). In the Sp1 sample, 16 min of MAT causes the almost disappearance of fibrous particles (Figure 10b), whereas some small fibres, smaller than 1 μm, remain in Sp2, coexisting with the new irregular particles (Figure 11b).

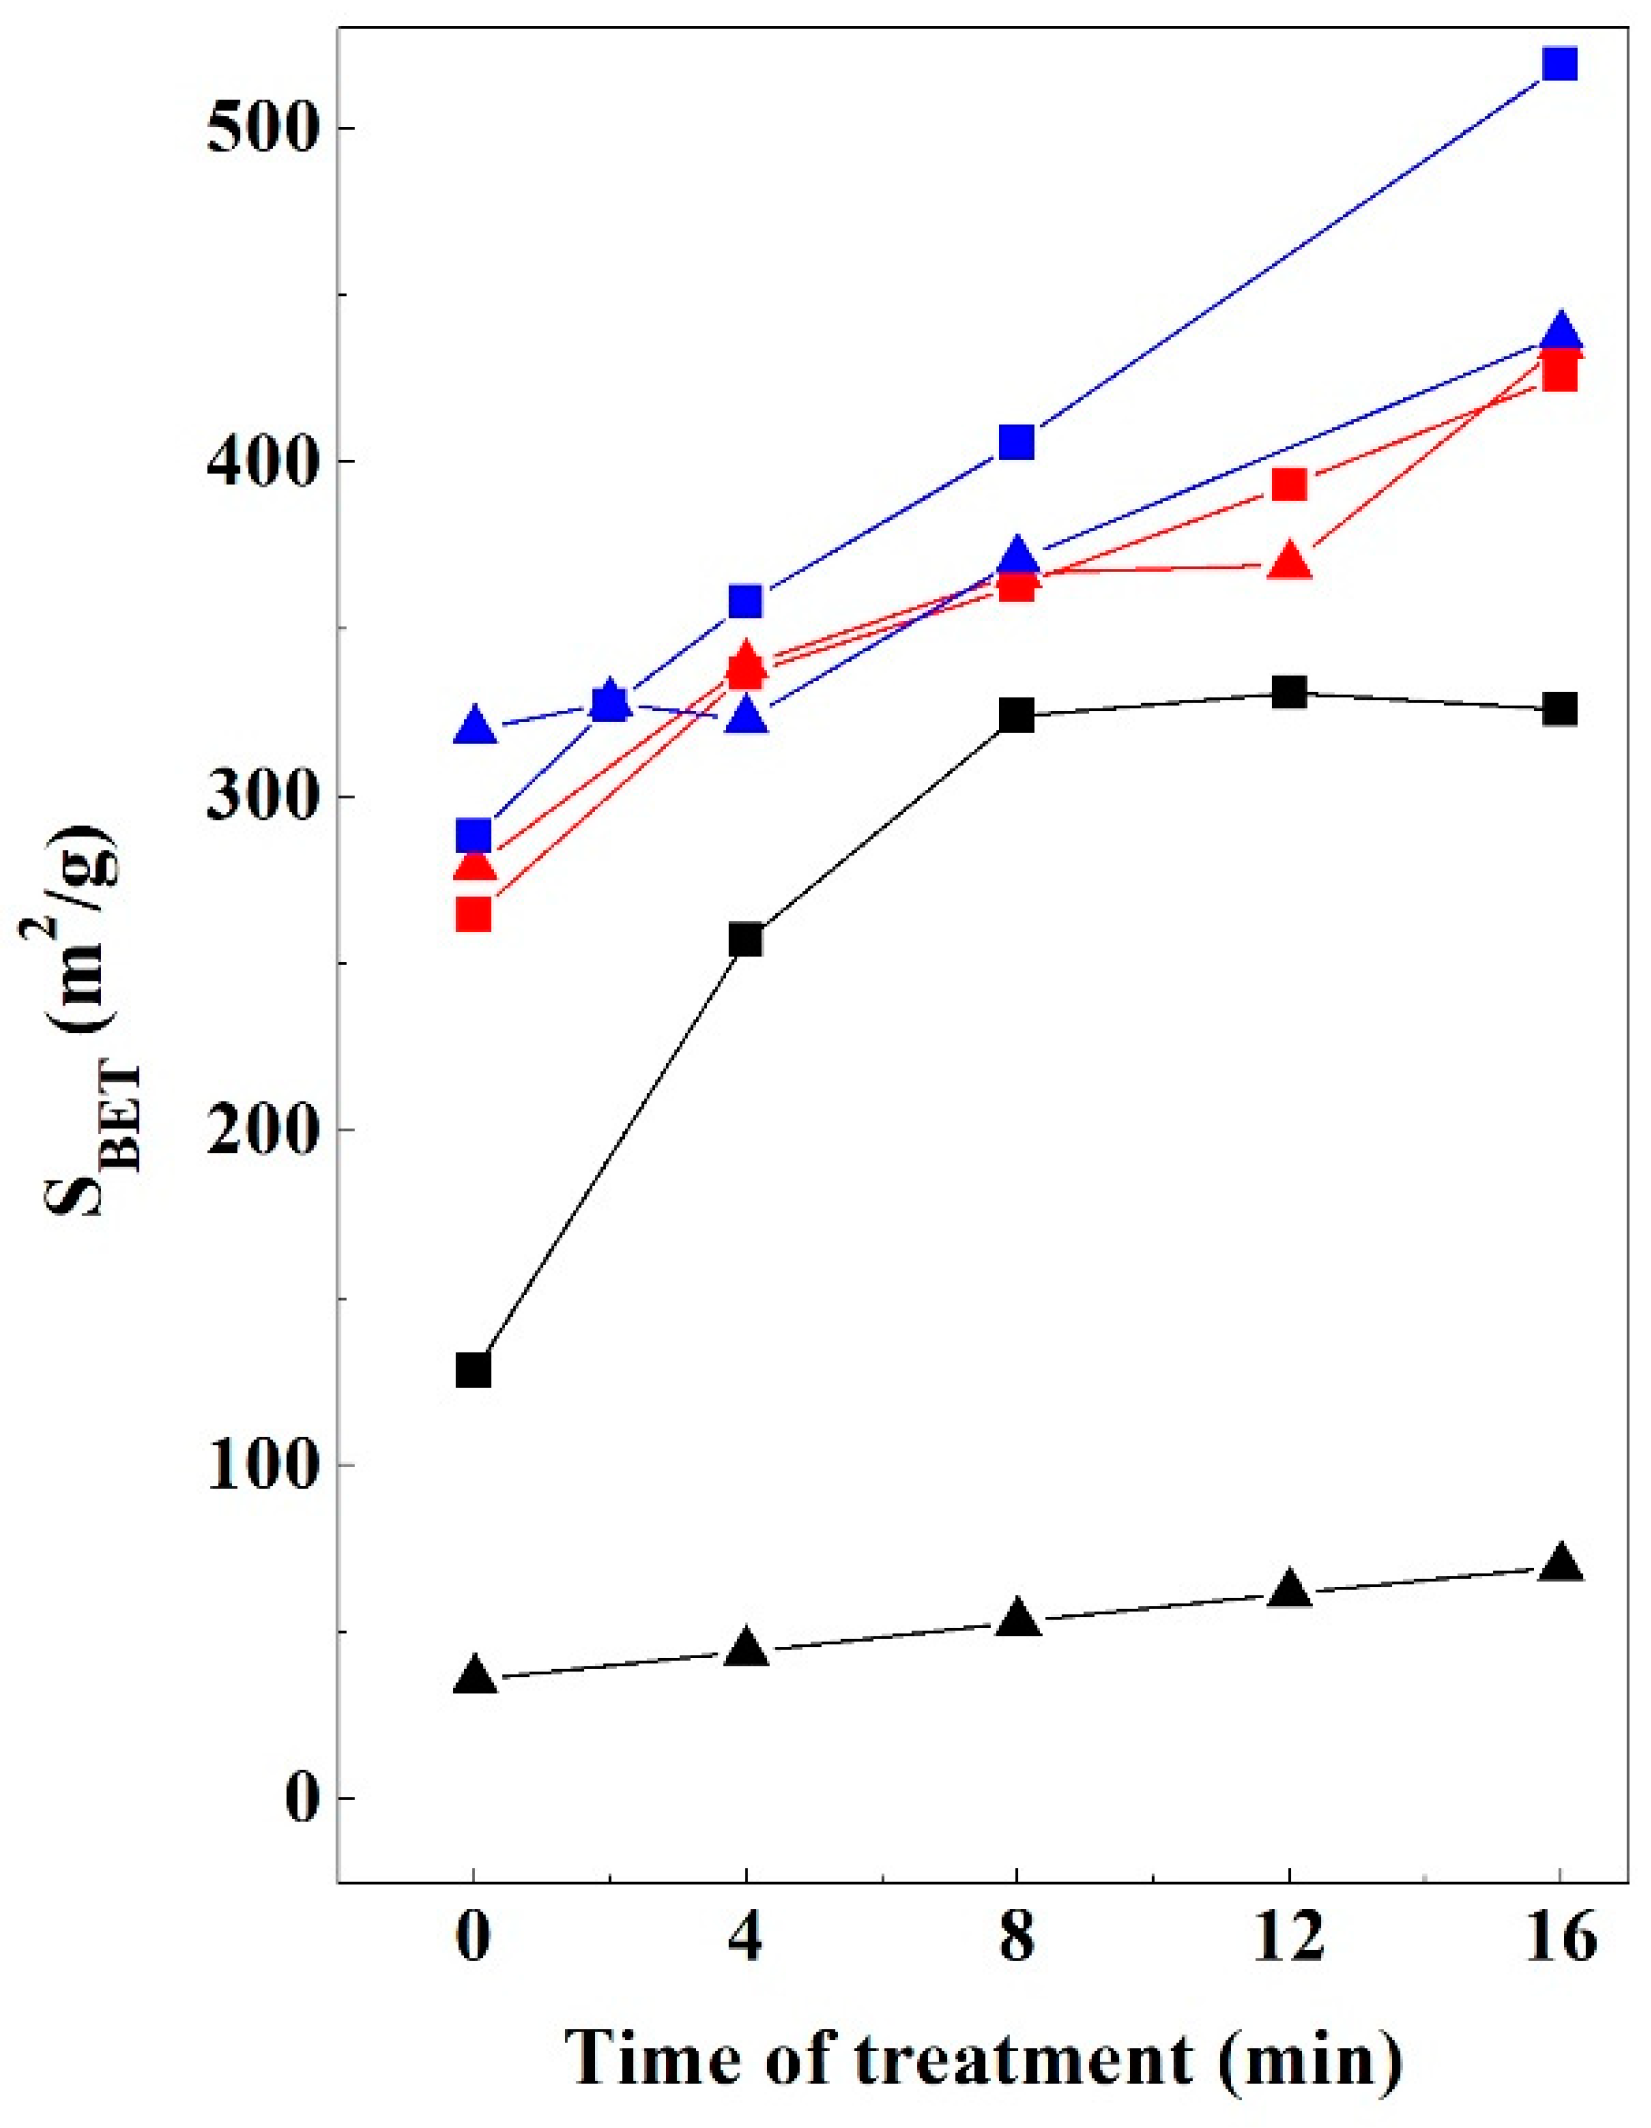
3.6. Textural Properties Evolution

The textural properties of the starting clays and the obtained materials after 16 min of microwave-assisted acid treatment were determined by N2 adsorption-desorption at −196 °C. The variation of the specific surface area (SSA), determined by the BET equation [45] of the samples throughout the treatment time is shown in Figure 12. The SSA values of the bentonites are notably lower than those of kerolitic clay and sepiolite samples, suggesting that the initial SSA values are closely related to the observed particle sizes in the untreated samples.

3.6.1. Bentonite

Saponite (Bs) and montmorillonite (Bm) samples have SSA values of 128 and 49 m2/g, respectively (Table 2). In the Bm sample the SSA values increase very little (ΔSBET = 13 m2/g; %ΔSBET = 27) during the treatment time. Nevertheless, the Bs samples show a noticeable increase in their SSA values compared to montmorillonite, at 8 min reaching an SSA value of 324 m2/g, while from the treatment time the SSA appears to be invariable, suggesting that it has achieved the maximum activation (ΔSBET = 198 m2/g; %ΔSBET = 155). Contrary to that observed in Bm sample, the great particle size reductions observed during microwave-assisted acid treatment of saponite and an increase in the porosity produce a noticeable increase in their SSA values.

3.6.2. Kerolitic Clay

The SSA values of the starting kerolitic clays are significantly higher than other magnesian clay minerals such as saponite or sepiolite [39,40]. The SSA values of the starting kerolitic clays (K1 and K2) are very similar (265, and 279 m2/g, respectively) values in agreement with those reported by other authors [5]. Both samples have a similar trend during the entire treatment showing the higher SSA values in the K2 sample. According to Table 2 the greatest contribution to the SSA comes from the micropores in the K1 sample, but from the external surface of the particles in K2. This result agrees with the observed modifications in the SEM images (Figure 8 and Figure 9). In both cases, the MAT treatment causes similar increments of SSA. In the case of K1, SSA increases from 265 to 426 m2/g (ΔSBET = 161 m2/g; %ΔSBET = 61), and in the case of K2 from 279 to 435 m2/g (ΔSBET = 156 m2/g; %ΔSBET = 56).

3.6.3. Sepiolite

In order to obtain SSA values close to reality, samples must be properly degassed without affect the structure of sepiolite [59]. For this reason, to find the appropriate conditions for the analysis of the samples, starting and treated sepiolite samples were kept for 16 h at two different temperatures (120 and 200 °C). Table 2 shows that SSA values are notably influenced by the temperature used to degas the sample. When samples are degassed at 200 °C, the two starting sepiolites exhibit a similar external surface area (Stext), a similar and very small microporous area (Stmicro), and, therefore, a similar BET surface area (SBET). Thus, SBET values are notably smaller than those reported in the literature [49,51]. Nevertheless, the obtained Stmicro and SBET values of natural sepiolites are notably higher when samples are degassed at 120 °C. These results suggest that the surface area from samples degassed at 200 °C is influenced by some textural or structural modifications [60], which strongly affect the microporous surface area (Table 2).
On the contrary, in the 8- and 16-min-treated sepiolite samples, in general the Stmicro and SBET values are notably higher when these samples are degassed at 200 °C. This result suggests that the SSA values of these treated sepiolite samples are not affected by any structural transformation. In acid-treated sepiolite, a higher temperature allows the complete degassing of the sample and therefore the obtaining of SSA values closer to reality [39].
On the other hand, the evolution of Stmicro and Stext of bentonite and kerolite samples after the MAT does not show erratic behaviour. For this reason, we only analysed the samples after degas at the same temperature (200 °C). These values can be slightly enhanced by a thermal activation but the low SSA value observed in the starting and treated-Bm samples shows that the thermal activation at 200 °C has a very small influence in the SSA values.
The starting sepiolite samples (Sp1 and Sp2) show different SSA values (288 and 320 m2/g, respectively). In the first 8 min, the SSA value in Sp1 increases by 41% (from 288 to 406 m2/g), increasing an additional 39.6% at 16 min of treatment (from 406 to 519 m2/g). Regarding the Sp2 sample, an increase of only 16% is observed in the first 8 min of treatment (from 320 to 371 m2/g) followed by an additional increase of 21% at 16 min (from 371 to 438 m2/g). In the case of Sp1, SSA increases from 288 to 519 m2/g (ΔSBET = 231 m2/g; %ΔSBET = 80), and in the case of K2 from 320 to 438 m2/g (ΔSBET = 118 m2/g; %ΔSBET = 37). The larger increase in SSA in the Sp1 sample appears to be related to the higher textural modifications shown in the SEM micrographs (Figure 10 and Figure 11). In both cases, with the assistance of microwaves during the acid treatment, it is possible to obtain, after 16 min of treatment, materials with an SSA value equivalent to those obtained after 48 h with conventional heating methods [17,29].
For an appropriate comparison, Table 3 summarizes the main modifications obtained with the different clay mineral studied after 16 min of microwave-assisted acid treatment. This table shows the increments of SSA (ΔSBET; %ΔSBET) as the difference between the SBET of the 16 min acid-treated sample and the corresponding starting clay. This table shows that higher increments are obtained with Sp1 and Bs samples that also display a higher loss of octahedral cations. It is interesting to note that both kerolitic clay materials have a similar loss of octahedral cations and similar SBET increments. This result is not consistent with the different structural modification observed by XRD. This result suggests that, contrary to what was observed with saponite and stevensite, the layered structure of kerolite is roughly maintained despite the loss of about 36% of the octahedral cations.

4. Conclusions

This study shows the effectiveness of microwave-assisted acid treatment in several 2:1 clay minerals. With these treatments, extremely high specific surface area (SSA) increases are achieved in just 16 min. The highest SSA increments were obtained with a sepiolite (up to 231 m2/g in 16 min). Nevertheless, notably higher SSA increments were obtained with Mg–smectites (up to 198 m2/g in 16 min) and kerolitic clays (up to 161 m2/g). This is a significant breakthrough compared to conventional acid treatments that reached smaller increments after 48 h of treatment. The increase in the specific surface area obtained with the microwave-assisted acid treatment can be used as an indicator of the extension of the activation process or the reactivity of the 2:1 clay minerals to this type of treatment. This reactivity appears to depend on several factors including octahedral sheet compositions and the structure of the specific 2:1 clay minerals.

Author Contributions

M.P. provided the samples for this work. F.F. and M.P. conceived and designed the experimental research and reviewed background research. F.F. supervised data acquisition and compilation. L.P. and J.A.C. carried out the experiments, data reduction and calculations. E.B. carried out the X-ray fluorescence analysis. All authors contributed to the interpretation of the results as well as writing and editing the paper. The authors have approved the submitted version and agree to be personally accountable for their own contributions and for ensuring that questions related to the accuracy or integrity of any part of the work, even one in which the author was not personally involved, are appropriately investigated, resolved, and documented in the literature.

Acknowledgments

The authors are very grateful for the inestimable help of the reviewers who have significantly improved the article and to Petra Gannholm for the careful review of English. The authors also wish to thank the project BIA2017-82391-R for the financial support. The preparation of this paper is included within the activities of the RNM-199 (Universidad de Málaga) and C-144 (Universidad Autónoma de Madrid, Geomaterials and Geological Processes) Research Groups.

Conflicts of Interest

The authors declare no conflict of interest. The founding sponsors had no role in the design of the study; in the collection, analyses, or interpretation of data; in the writing of the manuscript, and in the decision to publish the results.

References

  1. Guggenheim, S.; Adams, J.M.; Bain, D.C.; Bergaya, F.; Brigatti, M.F.; Drits, V.A.; Formoso, M.L.L.; Galán, E.; Kogure, T.; Stanjek, H. Summary of recommendations of nomenclature committees relevant to clay mineralogy: Report of the Association Internationale pour l’Etude des Argiles (AIPEA) Nomenclature Committee for 2006. Clays Clay Miner. 2006, 54, 761–772. [Google Scholar] [CrossRef]
  2. Guggenheim, S.; Adams, J.M.; Bain, D.C.; Bergaya, F.; Brigatti, M.F.; Drits, V.A.; Formoso, M.L.L.; Galán, E.; Kogure, T.; Stanjek, H. Summary of recommendations of nomenclature committees relevant to clay mineralogy: Report of the Association Internationale pour l’Etude des Argiles (AIPEA) Nomenclature Committee for 2006. Clay Miner. 2006, 41, 863–878. [Google Scholar] [CrossRef]
  3. Brindley, G.W.; Brown, G. X-ray diffraction procedures for clay mineral identification. In Crystal Structures of Clay Minerals and Their X-Ray Identification; Brindley, G.W., Brown, G., Eds.; Mineralogical Society: London, UK, 1980; pp. 305–356. ISBN 9780903056373. [Google Scholar]
  4. Eberl, D.D.; Jones, B.F.; Khoury, H.N. Mixed layer kerolite-stevensite from the Amargosa Desert, Nevada. Clays Clay Miner. 1982, 30, 321–326. [Google Scholar] [CrossRef]
  5. Martin de Vidales, J.L.; Pozo, M.; Alia, J.M.; Garcia Navarro, F.; Rull, F. Kerolite-stevensite mixed-layers from the Madrid Basin, Central Spain. Clay Miner. 1991, 26, 329–342. [Google Scholar] [CrossRef]
  6. Pozo, M.; Casas, J. Origin of kerolite and associated Mg clays in palustrine-lacustrine environments. The Esquivias deposit (Neogene Madrid Basin, Spain). Clay Miner. 1999, 34, 395–418. [Google Scholar] [CrossRef]
  7. Dekov, V.M.; Cuadros, J.; Shanks, W.C.; Koski, R.A. Deposition of talc-kerolite-smectite-smectite at seafloor hydrothermal vent fields: Evidence from mineralogical, geochemical and oxygen isotope studies. Chem. Geol. 2008, 247, 171–194. [Google Scholar] [CrossRef]
  8. Steudel, A.; Friedrich, F.; Schuhmann, R.; Friedrich, R.; Ruf, U.; Sohling, U.; Emmerich, K. Characterization of a fine-grained interstratification of turbostratic talc and saponite. Minerals 2017, 7, 5. [Google Scholar] [CrossRef]
  9. Miller, A.K.; Guggenheim, S.; Van Groos, A.F.K. Bond energy of adsorbed and interlayer water kerolite dehydration at elevated pressures. Clays Clay Miner. 1991, 39, 127–130. [Google Scholar] [CrossRef]
  10. Brindley, G.W.; Sempels, R.E. Preparation and properties of some hydroxy-aluminium beidellites. Clay Miner. 1977, 12, 229–237. [Google Scholar] [CrossRef]
  11. Murray, H.H. Traditional and new applications for kaolin, smectite, and palygorskite: A general overview. Appl. Clay Sci. 2000, 17, 207–221. [Google Scholar] [CrossRef]
  12. González-Pradas, E.; Socias-Viciana, M.; Saifi, M.; Ureña-Amate, M.D.; Flores-Cespedes, F.; Fernández-Pérez, M.; Villafrenca-Sánchez, M. Adsorption of chloridazon from aqueous solution on heat and acid treated sepiolites. Water Res. 2005, 39, 1849–1857. [Google Scholar] [CrossRef] [PubMed]
  13. Tan, Ö.; Yilmaz, L.; Zaimoglu, A.S. Variation of some engineering properties of clays with heat treatment. Mater. Lett. 2004, 58, 1176–1179. [Google Scholar] [CrossRef]
  14. Kara, M.; Yuzer, H.; Sabah, E.; Celik, M.S. Adsorption of cobalt from aqueous solutions onto sepiolite. Water Res. 2003, 37, 224–232. [Google Scholar] [CrossRef]
  15. Dekany, I.; Turi, L.; Fonseca, A.; Nagy, B.J. The structure of acid treated sepiolites: Small-angle X-ray scattering and multi MAS-NMR investigations. Appl. Clay Sci. 1999, 14, 141–160. [Google Scholar] [CrossRef]
  16. Balci, S. Thermal decomposition of sepiolite and variations in pore structure with and without acid pre-treatment. J. Chem. Technol. Biotechnol. 1996, 66, 72–78. [Google Scholar] [CrossRef]
  17. Jiménez-López, A.; López-González, J.D.; Ramírez-Sáenz, A.; Rodríguez-Reinoso, F.; Valenzuela-Calahorro, C.; Zurita-Herrera, L. Evolution of surface area in a sepiolite as a function of acid and heat treatments. Clay Miner. 1978, 13, 375–385. [Google Scholar] [CrossRef]
  18. Inukai, K.; Miyawaki, R.; Tomura, S.; Shimosaka, K.; Irkec, T. Purification of Turkish sepiolite through hydrochloric acid treatment. Appl. Clay Sci. 1994, 9, 11–29. [Google Scholar] [CrossRef]
  19. Aznar, A.J.; Gutiérrez, E.; Díaz, P.; Álvarez, A.; Poncelet, G. Silica from sepiolite: Preparation, textural properties, and use as support to catalyst. Microporous Mater. 1996, 6, 105–114. [Google Scholar] [CrossRef]
  20. Sabah, E.; Turan, M.; Çelik, M.S. Adsorption mechanism of canonic surfactants onto acid and heat-activated sepiolites. Water Res. 2002, 36, 3957–3964. [Google Scholar] [CrossRef]
  21. Vico, L.I. Acid-base behaviour and Cu2+ and Zn2+ complexation properties of the sepiolite/water interface. Chem. Geol. 2003, 198, 213–222. [Google Scholar] [CrossRef]
  22. Kendall, T. Smectite Clays. In Industrial Clays; Kendall, T., Ed.; Industrial Minerals Information Ltd.: London, UK, 1996; pp. 1–12. [Google Scholar]
  23. Čičel, B.; Komadel, P. Structural formulae of layer silicates. In Quantitative Methods in Soil Mineralogy; Luxmoore, R.J., Ed.; Soil Science Society of America, Inc.: Madison, WI, USA, 1994; pp. 114–136. [Google Scholar]
  24. Kaviratna, H.; Pinnavaia, T.J. Acid hydrolysis of octahedral Mg2+ Sites in 2:1 layered silicates: An assessment of edge attack and gallery access mechanisms. Clays Clay Miner. 1994, 42, 717–723. [Google Scholar] [CrossRef]
  25. Komadel, P.; Madejová, J. Acid activation of clay minerals. In Handbook of Clay Science; Bergaya, F., Theng, B.K.G., Lagaly, G., Eds.; Elsevier: Amsterdam, The Netherlands, 2006; Volume 1, pp. 263–287. [Google Scholar]
  26. Rice, N.M.; Strong, L.W. The leaching oflateritic nickel ores in hydrochloric acid. Can. Metall. Quart. 1974, b13, 485–493. [Google Scholar] [CrossRef]
  27. Komadel, P.; Schmidt, D.; Madejová, J.; Čičel, B. Alteration of smectites by treatments with hydrochloric acid and sodium carbonate solutions. Appl. Clay Sci. 1990, 5, 113–122. [Google Scholar] [CrossRef]
  28. Komadel, P.; Bujdák, J.; Madejová, J.; Šucha, V.; Elsass, F. Effect of non-swelling layers on the dissolution of reduced-charge montmorillonite in hydrochloric acid. Clay Miner. 1996, 31, 333–345. [Google Scholar] [CrossRef]
  29. Vicente-Rodríguez, M.A.; López González, J.D.; Bañares-Muñoz, M.A. Preparation of microporous solids by acid treatment of a saponite. Microporous Mater. 1995, 4, 251–264. [Google Scholar] [CrossRef]
  30. Tkáč, I.; Komadel, P.; Müller, D. Acid-treated montmorillonites-A study by 29Si and 27Al MAS NMR. Clay Miner. 1994, 29, 11–19. [Google Scholar] [CrossRef]
  31. Breen, C.; Madejová, J.; Komadel, P. Characterization of moderately acid-treated, size-fractionated montmorillonites using IR and MAS NMR spectroscopy and thermal analysis. J. Mater. Chem. 1995, 5, 469–474. [Google Scholar] [CrossRef]
  32. Adams, J.M.; McCabe, R.W. Clay Minerals as Catalysts. In Handbook of Clay Science; Bergaya, F., Theng, B.K.G., Lagaly, G., Eds.; Elsevier: Amsterdam, The Netherlands, 2006; Volume 1, pp. 541–581. [Google Scholar]
  33. García Carmona, J.; Rodriguez Clemente, R.; Gómez Morales, J. Comparative preparation of microporous VPI-5 using conventional and microwave heating techniques. Zeolites 1997, 18, 340–346. [Google Scholar] [CrossRef]
  34. Choudhary, V.R.; Tillu, V.H.; Narkhede, V.S.; Borate, H.B.; Wakharkar, R.D. Microwave assisted solvent-free synthesis of dihydropyrimidinones by Biginelli reaction over Si-MCM-41 supported FeCl3 catalyst. Catal Commun. 2003, 4, 449–453. [Google Scholar] [CrossRef]
  35. Deksnys, T.P.; Menezes, R.R.; Fagury-Neto, E.; Kiminami, R.H.G.A. Synthesis of Al2O3/SiC in microwave oven: Study of the processing parameters. Cerâmica 2005, 51, 343–348. [Google Scholar] [CrossRef]
  36. Deng, S.G.; Lin, Y.S. Microwave heating synthesis of supported sorbents. Chem. Eng. Sci. 1997, 52, 1563–1575. [Google Scholar] [CrossRef]
  37. Roy, R.; Komarneni, S.; Yang, J.L. Controlled microwave heating and melting of gels. J. Am. Ceram. Soc. 1985, 68, 392–395. [Google Scholar] [CrossRef]
  38. Korichi, S.; Elias, A.; Mefti, A. Characterization of smectite after acid activation with microwave irradiation. Appl. Clay Sci. 2009, 42, 432–438. [Google Scholar] [CrossRef]
  39. Franco, F.; Pozo, M.; Cecilia, J.A.; Benítez-Guerrero, M.; Pozo, E.; Martín Rubí, J.A. Microwave assisted acid treatment of sepiolite: The role of composition and “crystallinity”. Appl. Clay Sci. 2014, 102, 15–27. [Google Scholar] [CrossRef]
  40. Franco, F.; Pozo, M.; Cecilia, J.A.; Benítez-Guerrero, M.; Lorente, M. Effectiveness of microwave assisted acid treatment on dioctahedral and trioctahedral smectites. The influence of octahedral composition. Appl. Clay Sci. 2016, 120, 70–80. [Google Scholar] [CrossRef]
  41. Martín de Vidales, J.L.; Pozo, M.; Medina, J.A.; Leguey, S. Formación de sepiolita-paligorskita en litofacies lutítico-carbonáticas en el sector de Borox-Esquivias (Cuenca de Madrid). Estud. Geol. 1988, 44, 7–18. [Google Scholar] [CrossRef]
  42. Santiago Buey, C.; Suárez Barrios, M.; García Romero, E.; Doval Montoya, M. Mg-Rich Smectite “Precursor” Phase in the Tagus Basin, Spain. Clays Clay Miner. 2000, 48, 366–373. [Google Scholar] [CrossRef]
  43. Pozo, M.; Calvo, J.P. Madrid Basin (Spain): A natural lab for the formation and evolution of magnesian clay minerals. In Magnesian Clays: Characterization Origin and Applications; Pozo, M., Galán, E., Theng, B.K.G., Lagaly, G., Eds.; AIPEA Pub.: Rio de Janeiro, Brazil, 2015. [Google Scholar]
  44. Galán, E.; Pozo, M. Palygorskite and sepiolite deposits in continental environments. Description, genetic patterns and sedimentary settings. In Developments in Palygorskite–Sepiolite Research. A New Outlook on These Nanomaterials. Developments in Clay Science; Galán, E., Singer, A., Eds.; Elsevier: Amsterdam, The Netherlands, 2011; Volume 3, pp. 125–173. [Google Scholar]
  45. Lippens, B.C.; De Boer, J.H. Studies on pore systems in catalysts: V. The t method. J. Catal. 1965, 4, 319–323. [Google Scholar] [CrossRef]
  46. Brunauer, S.; Emmett, P.H.; Teller, E. Adsorption of gases in multimolecular layers. J. Am. Ceram. Soc. 1938, 60, 309–319. [Google Scholar] [CrossRef]
  47. Galán, E.; Aparicio, P. Methodology for the identification and characterization of magnesian clays. In Magnesian Clays: Characterization, Origin and Applications; AIPEA Educational, Series; Pozo, M., Galán, E., Eds.; Digilabs: Bari, Italy, 2015; Volume 2, pp. 63–121. [Google Scholar]
  48. Sánchez del Río, M.; García Romero, E.; Martínez Criado, G. Variability in sepiolite: Diffraction studies. Am. Miner. 2011, 96, 1443–1454. [Google Scholar] [CrossRef]
  49. Pozo, M.; Calvo, J.P.; Pozo, E.; Moreno, A. Genetic constraints on crystallinity, thermal behaviour and surface area of sepiolite from the Cerro de los Batallones deposit (Madrid Basin, Spain). Appl. Clay Sci. 2014, 91, 30–45. [Google Scholar] [CrossRef]
  50. Van der Marel, H.W.; Beutelspacher, H. Atlas of Infrared Spectroscopy of Clay Minerals and Their Admixtures; Elsevier: Amsterdam, The Netherlands, 1976; Volume 396. [Google Scholar]
  51. Kloprogge, J.T.; Frost, R.L. Study of the thermal behavior of rectorite by in-situ infrared emission spectroscopy. N. Jb. Miner. Mh. 2000, 4, 145–157. [Google Scholar]
  52. Bisio, C.; Boccaleri, E.; Marchese, L.; Superti, G.B.; Pastore, H.O.; Thommes, M. Understanding physico-chemical properties of saponite synthetic clays. Microporous Mesoporous Mater. 2008, 107, 90–101. [Google Scholar] [CrossRef]
  53. Janin, A.; Maache, M.; Lavalley, J.C.; Joly, J.F.; Raatz, F.; Szydlowski, N. FT-IR study of the silanol groups in dealuminated HY zeolites: Nature of the extraframe debris. Zeolites 1991, 11, 391–396. [Google Scholar] [CrossRef]
  54. Weitkamp, J. Zeolites and catalysis. Solid State Ion. 2000, 131, 175–188. [Google Scholar] [CrossRef]
  55. Zviagina, B.B.; McCarty, D.K.; Środoń, J.; Drits, V.A. Interpretation of infrared spectra of dioctahedral smectites in the region of OH-stretching vibrations. Clays Clay Miner. 2004, 52, 399–410. [Google Scholar] [CrossRef]
  56. Madejová, J. FTIR techniques in clay mineral studies. Vib. Spectrosc. 2003, 31, 1–10. [Google Scholar] [CrossRef]
  57. Farmer, V.C. The Infrared Spectra of Minerals; Mineralogical Society: London, UK, 1974; p. 539. [Google Scholar]
  58. Anderson, T.H.; Weaver, F.W.; Owen, N.L. Anomalies in diffuse reflectance infrared spectra of wood and wood polymers. J. Mol. Struct. 1991, 249, 257–275. [Google Scholar] [CrossRef]
  59. Madejová, J.; Bujdák, J.; Janek, M.; Komadel, P. Comparative FT-IR study of structural modifications during acid treatment of dioctahedral smectites and hectorite. Spectrochim. Acta A Mol. Biomol. Spectrosc. 1998, 54, 1397–1406. [Google Scholar] [CrossRef]
  60. Valentín, J.L.; López-Manchado, M.A.; Rodríguez, A.; Posadas, P.; Ibarra, L. Novel anhydrous unfolded structure by heating of acid pre-treated sepiolite. Appl. Clay Sci. 2007, 36, 245–255. [Google Scholar] [CrossRef]
  61. Frost, R.L.; Locos, O.B.; Ruan, H.; Kloprogge, J.T. Near-infrared and mid-infrared spectroscopic study of sepiolites and palygorskites. Vib. Spectrosc. 2001, 27, 1–13. [Google Scholar] [CrossRef]
  62. Frost, R.L.; Cash, G.A.; Kloprogge, J.T. ‘Rocky Mountain leather’, sepiolite and attapulgite-an infrared emission spectroscopic study. Vib. Spectrosc. 1998, 16, 173–184. [Google Scholar] [CrossRef]
Figure 1. X-ray diffractograms of Bs (a), Bm (b), K1 (c), K2 (d), Sp1 (e) and Sp2 (f). Qtz: Quartz; Fds: Feldspars; Tr: Tremolite; Cal: Calcite.
Minerals 08 00376 g001
Figure 2. X-ray diffraction patterns of Bs (a), Bm (b), K1 (c), K2 (d), Sp1 (e) and Sp2 (f) and acid-treated samples. Qtz: Quartz; Fds: Feldspars; Tr: Tremolite.
Minerals 08 00376 g002
Figure 3. X-ray diffraction patterns of Bs, Bm, K1, K2, Sp1, Sp2 and acid-treated samples.
Minerals 08 00376 g003
Figure 4. Comparison of the FTIR spectra of saponite Bs (a), montmorillonite Bm (b), kerolite K1 (c), kerolite K2 (d), sepiolite Sp1 (e) and sepiolite Sp2 (f) and the material obtained after 16 min of MAT.
Minerals 08 00376 g004
Figure 5. Variation of MgO/SiO2 (a), Al2O3/SiO2 (b), and Fe2O3/SiO2 (c) along the experiments: Bm (black triangle), Bs (black square), K1 (red square), K1 (red triangle), Sp1 (blue square), Sp2 (blue triangle).
Minerals 08 00376 g005
Figure 6. SEM images of Bm (a), Bm after 16 min of microwave-assisted acid treatment (b).
Minerals 08 00376 g006
Figure 7. SEM images of Bs (a) and Bs after 16 min of microwave-assisted acid treatment (b).
Minerals 08 00376 g007aMinerals 08 00376 g007b
Figure 8. SEM images of the kerolite K1 (a) and kerolite K1 after 16 min of microwave-assisted acid treatment (b).
Minerals 08 00376 g008aMinerals 08 00376 g008b
Figure 9. SEM images of the kerolite K2 (a) and kerolite K2 after 16 min of microwave-assisted acid treatment (b).
Minerals 08 00376 g009aMinerals 08 00376 g009b
Figure 10. SEM images of the sepiolite Sp1 (a), sepiolite Sp1 after 16 min of microwave-assisted acid treatment (b).
Minerals 08 00376 g010aMinerals 08 00376 g010b
Figure 11. SEM images of the sepiolite Sp2 (a) and sepiolite Sp2 after 16 min of microwave-assisted acid treatment (b).
Minerals 08 00376 g011aMinerals 08 00376 g011b
Figure 12. SSA evolution of the 2:1 clay samples studied vs. treatment time: Bm (black triangle), Bs (black square), K1 (red square), K1 (red triangle), Sp1 (blue square), Sp2 (blue triangle).
Minerals 08 00376 g012
Table 1. Chemical analysis of starting samples and obtained materials after 16 min of MAT.
Sample% SiO2% Al2O3% MgO% Fe2O3% Na2O% K2O% CaO% MnO% P2O5% TiO2
Bs53.734.8230.081.032.760.555.340.030.110.53
Bs-16 min77.112.5116.490.980.000.715.590.020.030.83
Bm65.7522.613.213.961.670.601.650.020.090.15
Bm-16 min68.5223.302.853.970.300.470.200.010.040.15
K153.942.6625.260.770.090.590.320.010.050.15
K1-16 min67.752.2216.240.880.070.640.120.020.040.19
K255.000.7027.700.200.030.150.200.010.040.10
K2-16 min66.490.4517.840.230.030.130.230.010.030.09
Sp156.890.6923.970.020.010.200.590.050.040.03
Sp1-16 min81.770.592.400.030.020.230.600.040.040.08
Sp256.411.5622.390.440.030.220.820.050.040.22
Sp2-16 min70.481.1811.570.360.040.210.060.050.040.07
Table 2. Specific surface areas obtained after outgassing at 200 °C or 120 °C of starting 2:1 clay minerals and obtained materials after acid treatment.
SBETStextStmicro SBETStextStmicro
Sample(m2·g−1)(m2·g−1)(m2·g−1)Sample(m2·g−1)(m2·g−1)(m2·g−1)
Degasification Temperature200 °CDegasification Temperature200 °C
M492524K1265101163
M-4 min492227K1-4 min337139198
M-8 min562828K1-8 min363155209
M12 min613229K1-12 min393159234
M-16 min623329K1-16 min426195230
S1287652K2279167112
S-4 min257128129K2-4 min339236104
S-8 min324138186K2-8 min367241126
S-12 min331114217K2-12 min369248121
S-16 min326106221K2-16 min435266170
SBETStextStmicroSBETStextStmicroBest SBET (m2·g−1)
Sample(m2·g−1)(m2·g−1)(m2·g−1)(m2·g−1)(m2·g−1)(m2·g−1)
Degasification Temperature200 °C120 °C
Sp111710215288117171288
Sp1-2 min17513243327161166327
Sp1-4 min24415094358173185358
Sp1-8 min378191187406222184406
Sp1-16 min5194378243734889519
Sp213311122320127193320
Sp2-2 min15413321328170158328
Sp2-4 min323187136280174106323
Sp2-8 min371174197371176141371
Sp2-16 min438197241396205191438
Table 3. Principal modifications obtained after 16 min of microwave-assisted acid treatment (MAT).
Type of ClaySampleMain CharacteristicXRD ModificationFTIR Amorphous Si–O Bands% Octahedral Cations LossΔSBET (m2/g)%ΔSBET
BentoniteBstrioctahedral smectite020 and 060 reflections disappearsYES71198155
Bmdioctahedral smectite020 and 060 reflections appears to be unaffectedNO31327
Kerolitic clayK1stevensite > kerolite020 and 060 reflections strongly decreasedYES4916161
K2stevensite < kerolite020 and 060 reflections slightly decreasedYES4715656
SepioliteSp1fibres: thinner, longerreflections between 18 and 32° 2θ disappear and replaced with a broad bandYES9323180
Sp2fibres: wider, shorterreflections between 18 and 32° 2θ slightly decreaseYES6011837

