Article

Late Triassic Tectonic Setting in Northeastern Margin of North China Craton: Insight into Sedimentary and Apatite Fission Tracks

1
College of Earth Sciences, Jilin University, Changchun 130061, China
2
Key Laboratory of Mineral Resources Evaluation in Northeast Asia, Ministry of Natural Resources, Changchun 130061, China
3
Survey of Regional Geological and Mineral Resource of Jilin Province, Changchun 130022, China
*
Author to whom correspondence should be addressed.
Minerals 2023, 13(7), 975; https://doi.org/10.3390/min13070975
Submission received: 16 May 2023 / Revised: 3 July 2023 / Accepted: 19 July 2023 / Published: 22 July 2023

Abstract

:
The closure timing of the Paleo-Asian Ocean and the terminal stage of the Central Asian Orogenic Belt have been widely debated in the geological community. It’s known that the gradual scissor-like closure of the Paleo-Asian Ocean occurred from west to east during the Paleozoic period. However, it was not until the Triassic period that the complete closure of the ocean occurred at the northeastern margin of the North China Craton. Nevertheless, there is still much uncertainty regarding the Late Triassic tectonic setting in Northeast China. In this study, we focused on the Upper Triassic Dajianggang Formation, located in the Shuangyang area of central Jilin Province, which is situated on the northeastern margin of the North China Plate. Our aim was to determine the formation age of the Dajianggang Formation by analyzing the detrital particle composition, petrogeochemistry, detrital zircon U-Pb isotope dating, and apatite fission track thermochronology. Our results indicated that the primary sandstone provenance area of the Dajianggang Formation in the Shuangyang area is the island arc orogenic belt. The tectonic background of the sandstone provenance area is mainly a continental island arc environment. The provenance area is mostly composed of felsic rocks with sedimentary tendencies, and some of its material may have originated from the northern margin of the North China Craton or the eroded recycle orogenic belt. LA-ICP-MS U-Pb dating of detrital zircons shows that the Dajianggang Formation formed after 226.8 ± 5 Ma. Moreover, analysis of the thermal evolution history modelling shows that the Dajianggang Formation in the Shuangyang area continued to be deposited and heated in the early stage, and then experienced rapid exhumation around 30 Ma. This suggests that the study area underwent an orogenic process during the early stage of formation, but then transitioned into a post-orogenic extension period, which constrained the final closure of the Paleo-Asian Ocean prior to the Late Triassic period. In addition, our study indicates that the remote effect of the Pacific subduction did not reach the study area until 30 Ma. The central age of the detrital apatite fission track of sample 19DJ-1 is 94.2 ± 8.3 Ma, which is younger than its corresponding stratigraphic age. The two peak ages of the fission track analysis are 62.9 ± 5.4 Ma and 126 ± 11 Ma. These findings provide new evidence for the tectonic evolution of Northeast China and shed light on the Late Triassic tectonic setting, as well as the influence time of subsequent tectonic domains in the southern part of Northeast China.

1. Introduction

Northeast China is situated at the convergence of the Siberian Plate and the North China Plate, characterized by the superposition of the tectonic domains of the Paleo-Asian, Mongolia–Okhotsk, and Pacific Oceans [1,2]. Its complex tectonic evolution is marked by the early subduction of the Paleo-Asian Ocean, the intercontinental accretion of the Siberian and North China plates, and the final collage in the Middle Triassic period [3,4,5,6]. Furthermore, the geological history of Northeast China has been shaped by the convergence and subduction of two major tectonic plates, the Mongolia–Okhotsk plate and the Paleo-Pacific plate, towards the Eurasian continent since the Late Jurassic period. These geological events have played a crucial role in the formation and evolution of the region, leading to the development of complex geological structures and the sediment of diverse rock types [7,8,9,10,11,12,13,14]. Northeast China has a long and complex tectonic evolution, and thus plays a key role in studying the history of the three tectonic domains present in the region. However, the Late Triassic tectonic setting connecting the two periods has been debatable. This period is particularly significant, as it marks the final closure of the Paleo-Asian Ocean. The precise timing of the Paleo-Asian and Pacific tectonic domain influences on Northeast China remains unclear. Therefore, further geological investigations are necessary in order to shed light on this issue. There is still ongoing debate among geologists regarding the tectonic setting of Northeast China during the Late Triassic period. Some scholars argue that the subduction of the Paleo-Pacific plate to the eastern margin of the northeast Asian continent began during this time, due to the presence of a high-pressure metamorphic belt in the region [15,16,17]. On the other hand, other researchers propose that the northeastern region experienced an extensional tectonic background in the Late Triassic period, which was related to the extension of the lithosphere after the closure of the Paleo-Asian Ocean, rather than to the subduction of the Paleo-Pacific plate. This view is supported by the presence of alkaline rocks and bimodal volcanic rocks in the area [9,18,19]. Despite the ongoing debate, it is widely acknowledged that the Late Triassic is a crucial period for understanding the tectonic evolution of Northeast China. This period witnesses the final closure of the Paleo-Asian Ocean and marks an important transition in the region’s tectonic history. However, while much research has focused on Late Triassic magmatic activity, there is a scarcity of information regarding the tectonic setting reflected by sedimentary events during this time.
Considering the ongoing debate surrounding the Late Triassic tectonic setting in Northeast China, this study focuses on the Upper Triassic Dajianggang Formation, located in the northeastern margin of the North China Craton. Through the utilization of detrital zircon U-Pb isotope dating, major and trace element analysis, detrital particle composition analysis, apatite fission track thermochronology, and other techniques, the goal of this research is to elucidate the Late Triassic tectonic setting and the timing of subsequent tectonic domains in the southern part of Northeast China. By doing so, this paper aims to provide new insights into the overall tectonic evolution of this region.

2. Geological Setting and Sample Description
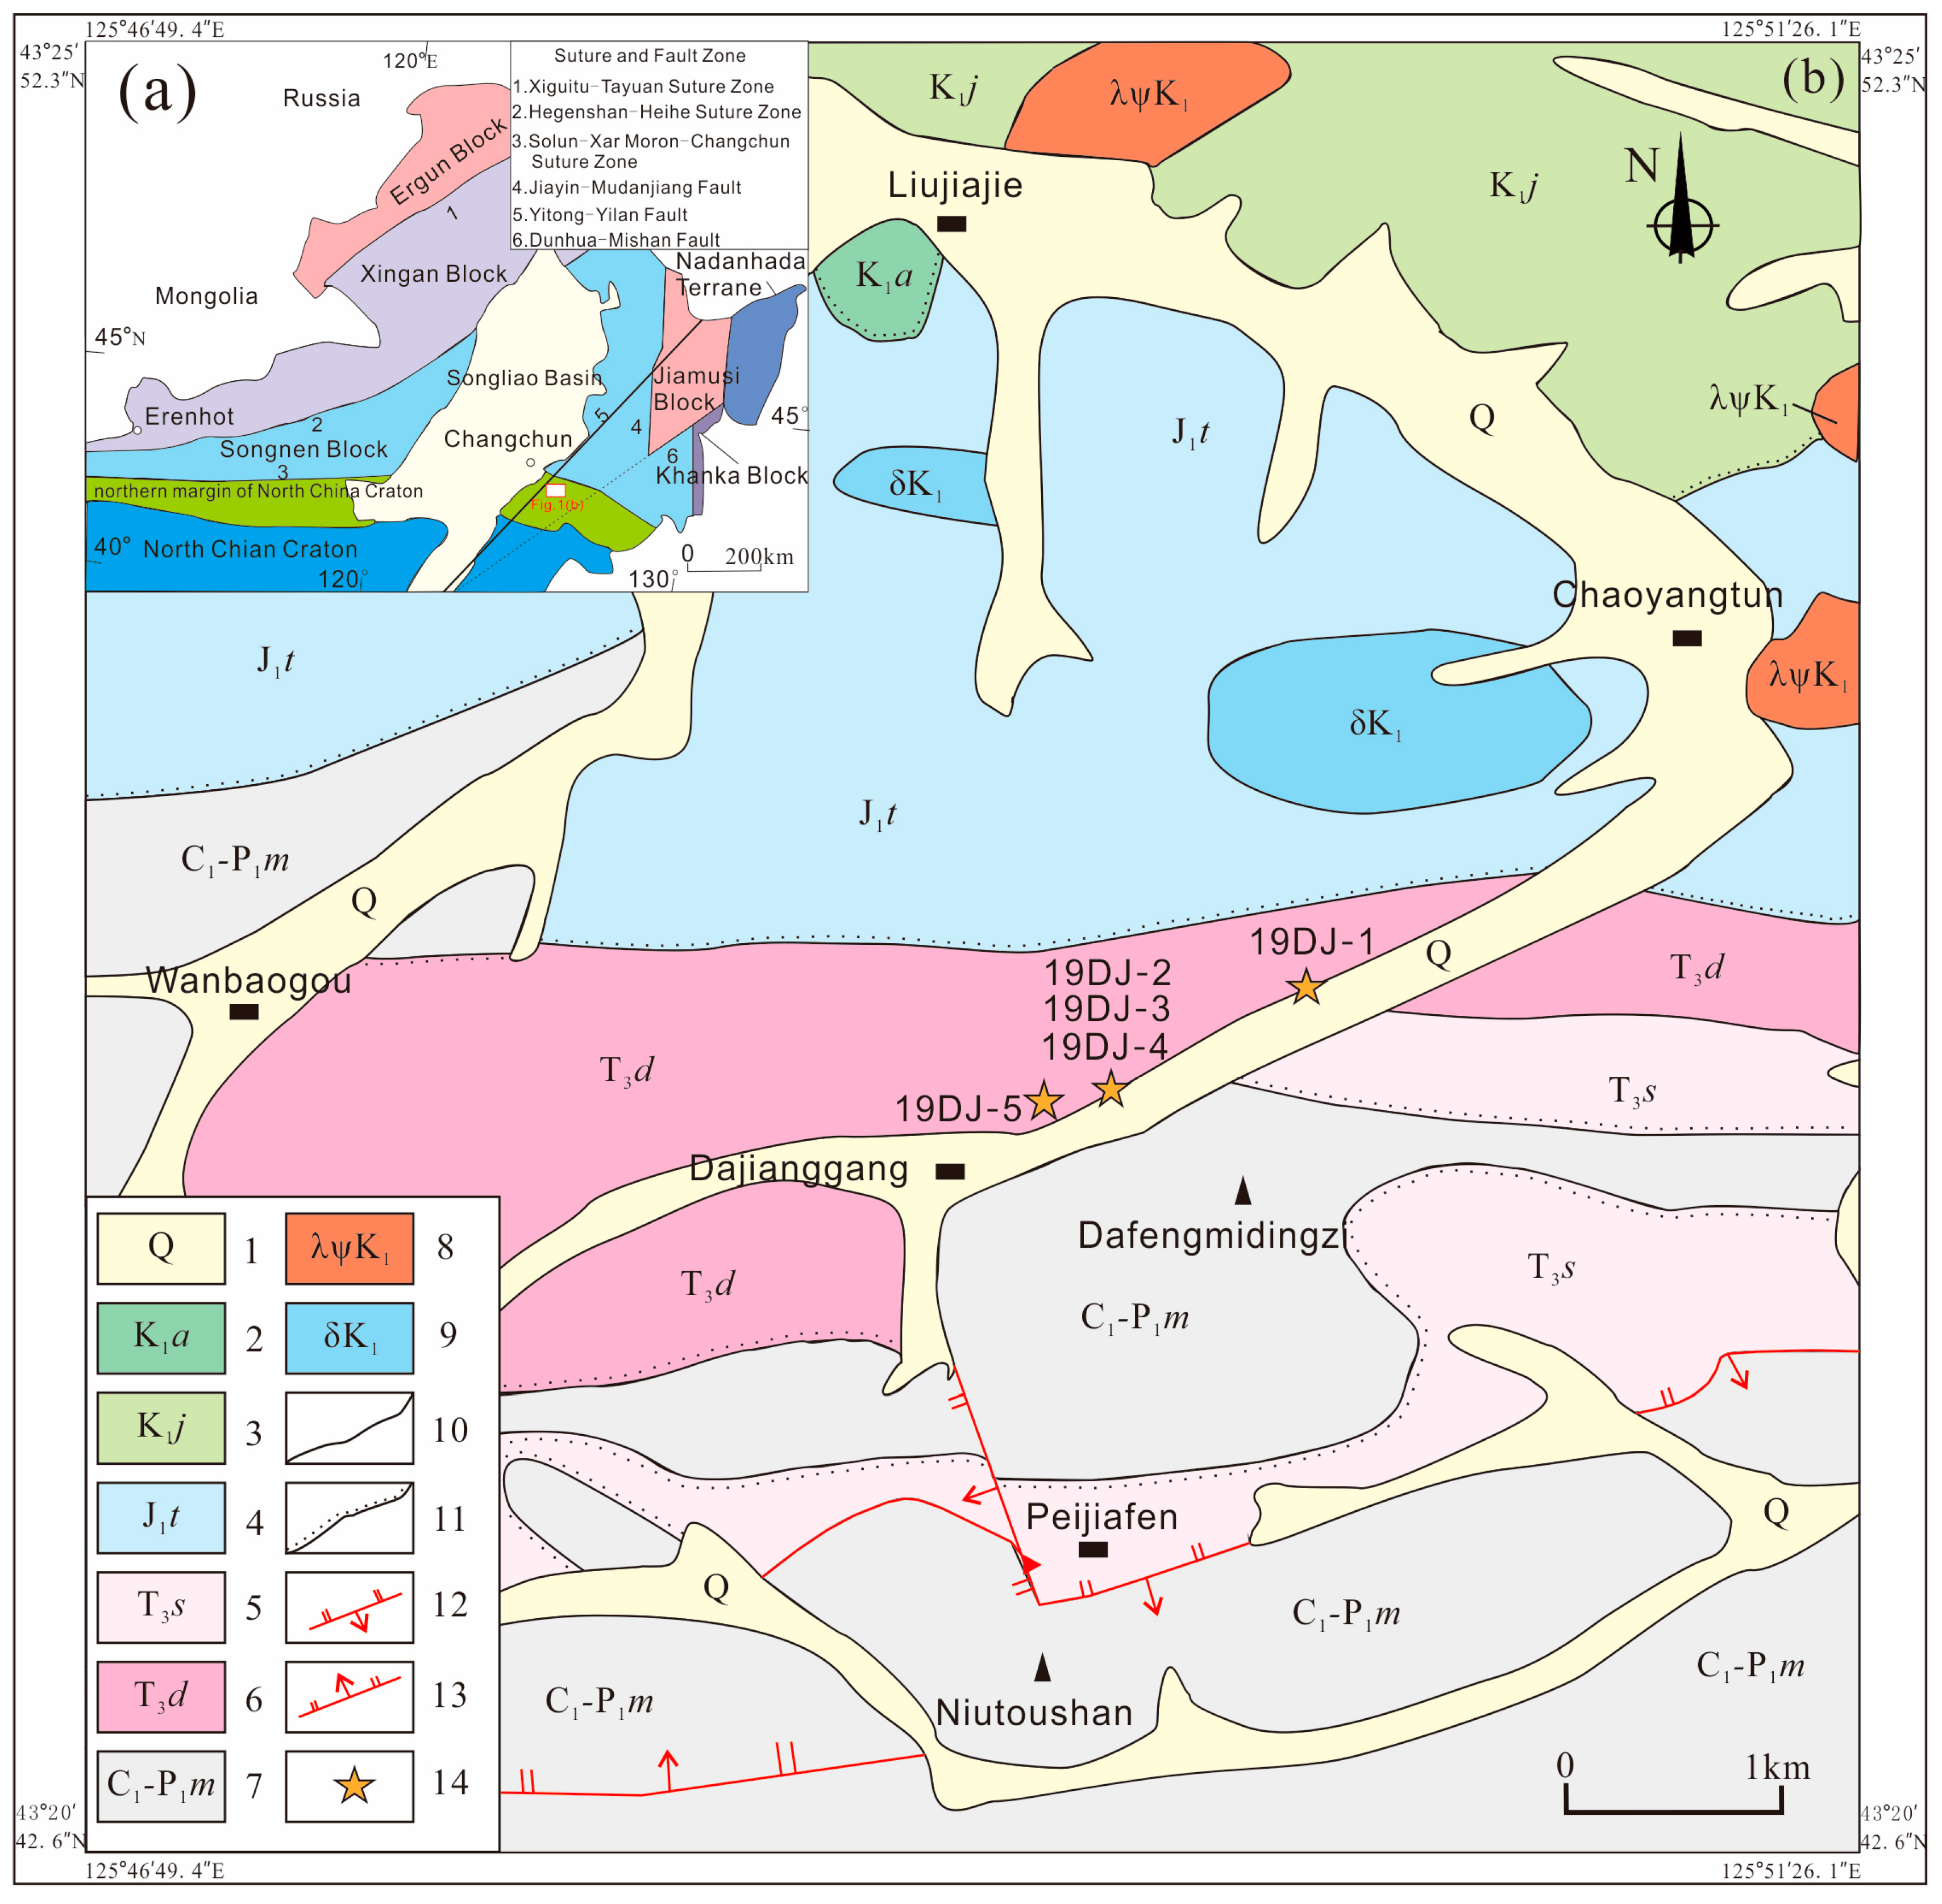
The study area is situated in the central part of Jilin Province, which is geotectonically located in the eastern portion of the accretionary belt on the northern margin of the North China Craton (as depicted in Figure 1a). It is bounded by the Songnen Block and Jiamusi-Xingkai block to the north, the Songliao Basin to the west, and the North China Plate to the south. In the north of the study area lies the Solon–Xar Moron–Changchun–Yanji suture zone, while the Yitong–Yilan fault can be found to the west. Furthermore, the Dunhua–Mishan fault, trending in the northeast direction, cuts through the area to the south.
The geological characteristics of the study area are dominated by Carboniferous, Triassic, Jurassic, and Quaternary strata (Figure 1b). The Dajianggang Formation, which is the focus of this study, is mainly distributed along the northeast fault basin in the syncline axis of Jiangjunling-Dajianggang village, on the southern margin of the Mesozoic basin in the Shuangyang area of central Jilin Province [20]. The Dajianggang Formation is unconformably overlain by the basal conglomerate of the Lower Jurassic Taiyangling Formation, and it unconformably overlies the Permian–Carboniferous Mopanshan Formation and the Upper Triassic Sihetun Formation (Figure 1b) [21]. The Dajianggang Formation is a set of clastic rocks with a positive sequence of fluvial, lake, and marsh sedimentary facies. The lithological assemblage consists of yellow-green conglomerate, yellow-green sandstone, siltstone, clayslate, and coal-bearing strata, with a total thickness of approximately 1439 m [21,22]. The study area is characterized by the presence of coarse terrigenous clastic rocks with molasse characteristics, which are located at the base of the Changchun–Yanji suture zone complex [16,23,24]. The accumulated thickness of these rocks is over 400 m, with the upper part consisting of coal-bearing sedimentary strata. Fossil evidence suggests that the Late Triassic Drepanzamites–Glocsophtllum assemblage of terrestrial plants existed within these strata [21,24], including species such as Drepanozamites, Neocalamites carrerei, N. hoerensis, Todites williamsoni, Taeniopteris sp., cf. Glossophyllum florin, and Pityophyllum sp. [21,22,25]. A strata column section is shown in Supplementary Figure S1.
For the purpose of laboratory research, five representative samples were collected (19DJ-1, 19DJ-2, 19DJ-3, 19DJ-4, and 19DJ-5; sample location shown as Figure 1b). Petrographic observations were carried out on all five samples, while three samples (19DJ-1, 19DJ-4, and 19DJ-5) were subjected to bulk rock geochemical analysis. Additionally, sample 19DJ-1 was chosen for detrital zircon U-Pb dating and apatite fission track testing.
Figure 1. (a) Geological sketch map (modified after [23]). (b) Sampling location of study area. 1. Quaternary flood plain: alluvial sand and gravel; 2. Lower Cretaceous Anmin Formation: basalt, andesite, rhyolite, rhyolite containing agglomerate breccia, tuff breccia; 3. Lower Cretaceous Jiuda Formation: grayish yellow pebbled coarse sandstone and fine sandstone; 4. Lower Jurassic Taiyangling Formation: grayish yellow conglomerate, medium fine and grained sandstone with coarse sandstone, thin conglomerate, upper black-gray siltstone, fine sandstone, mudstone, and coal seam; 5. Upper Triassic Sihetun Formation: Andesite, Andesitic litho-crystalline tuff, dacite, rhyolite litho-crystalline tuff, Dacitic breccia-bearing litho-crystalline tuff; 6. Upper Triassic Dajianggang Formation: black slate, sandstone, conglomerate mixed with acid, volcanic rock, and recoverable coal seam; 7. Permian–Carboniferous Mopanshan Formation: micrite limestone, micrite bioclastic limestone, chert-nodule and chert-banded limestone, dolomitic limestone, dolomite, off-white marble, siliceous rock; 8. Early Cretaceous quartz albite porphyry; 9. Early Cretaceous diorite; 10. Geological boundary; 11. Angular unconformity boundary; 12. Thrust fault; 13. Normal fault; 14. Sampling location.
Minerals 13 00975 g001

3. Methodology

3.1. Analysis of Geochemical Characteristics

After observation under a microscope, the weathered and altered samples were removed, and three samples from the Dajianggang group were selected for research and analysis. Geochemical analysis of the major, minor, and rare earth elements of the samples was carried out at the Key Laboratory of Mineral Resources Evaluation in Northeast Asia, Jilin University. The fresh sample was pulverized to a particle size of <200 mesh (0.174 mm) using an agate ball mill. The major elements were determined using XRF spectroscopy, and the firing loss (LOI) was determined after the sample powder was ignited at 1000 °C for 1 h. The calcined sample (0.9 g) was added to 9.0 g lithium borate reagent (Li2B4O7-LiBO2), thoroughly mixed, and fused in a fusion machine between 1050 and 1100 °C. Glass melt samples were prepared from the obtained melt and measured using an X-ray fluorescence spectrometer (XRF). The determination of trace elements, including rare earth elements, was conducted using the inductively coupled plasma mass spectrometry (ICP-MS) method after the melting sample bomb mixed with high purity HF and HNO3 was baked in a closed oven for 2 days. The detection limits of some key elements (integration time, 3 s) are as follows (×10−6): Th (0.05), Nb (0.2), Hf (0.2), Zr (2), La (0.5), and Ce (0.5). Repeated analyses based on the analysis results and international standard reference materials (SRMS) show that the precision and accuracy of the data are better than 5% for major elements and better than 10% for trace elements.

3.2. Zircon U-Pb Isotope Dating

In this paper, sandstone sample 19DJ-1, from the Dajianggang Formation in the Shuangyang area, was chosen for LA-ICP-MS zircon analysis. The zircon dating was carried out at the Key Laboratory of Mineral Resources Evaluation in Northeast Asia, Ministry of Land and Resources, Jilin University, Changchun, China. The use of helium as a carrier gas provided efficient aerosol transport to the ICP and minimized aerosol deposition around the ablation site and within the transport tube [26,27]. Argon was used as the make-up gas and was mixed with the carrier gas via a T-connector before entering the ICP. The analysis spots were 32 μm in diameter, and U, Th, and Pb concentrations were calibrated using 29Si as an internal standard. The standard zircon 91500 was used as an external standard in order to normalize isotopic fractionation during analysis. The analytical procedures used follow those described by Yuan, Gao [28]. The raw data were processed using the GLITTER program, and uncertainties of individual analyses were reported with 1σ error. Weighted mean ages were calculated at 1σ, and the data were processed using the IsoplotR program [29]. The zircon Plešovice was dated as an unknown sample and yielded a weighted mean 206Pb/238U age of 337.5 ± 2.4 Ma (n = 8, 2σ), which is in good agreement with the suggested age of 337.13 ± 0.37 Ma [30]. These methods and procedures ensured the accuracy and reliability of the zircon dating results.

3.3. Apatite Fission Track

Apatite fission track thermochronology is a method that utilizes the damage caused by the spontaneous fission of radioactive 238U in a mineral lattice [31]. Many previous studies have been conducted on the annealing of apatite and the characteristics of partial annealing zones. The fission tracks in apatite provide information on the exhumation time, amplitude, rate, and mode of orogenic belts, as well as on the low-temperature domain of the thermal history of mountain exhumation [32,33]. The partial annealing zone of apatite is situated at a temperature range of 60–120 °C, which means that apatite fission track (AFT) data can indicate paleotemperature information of up to 120 °C, and fission tracks above 120 °C cannot be preserved on geological time scales. The accumulation of apatite tracks occurs with time at the temperature of the partial annealing zone or lower, and the age of a fission track can be determined by measuring its density and uranium content [34,35].
This study employed apatite fission track thermochronology in order to investigate the thermal history of the Dajianggang Formation in the Shuangyang area. The first step in the analysis was the collection of pure apatite grains in sandstone sample 19DJ-1. The sample was subjected to various preparatory procedures, including fragmentation, screening, magnetic separation, and heavy liquid separation in order to obtain pure apatite grains. Following this, apatite mounts in epoxy resin were ground and polished to expose maximum grain internal surfaces, which were then etched with 5.5 N HNO3 at 20 °C for 20 s to reveal the spontaneous tracks. Low-uranium muscovite was then used as the external detector, while standard uranium glass IRRM540 was used as the dosimeter with which to detect irradiation neutron fluence. Subsequently, the pure apatite grains were irradiated with thermal neutrons at the Radiation Center in Oregon State University, USA. The fission track age of detrital apatite was then measured and analyzed in order to infer the thermal history of the Dajianggang Formation.
Fission track analysis was performed at the Fission Track Dating Laboratory, Northwest Institute of Eco-Environment and Resources, Chinese Academy of Sciences, using an automatic fission track counting system, consisting of a Zeiss AxioIMager Z2m microscope, ES16 platform, and Fission Track Studio software. Generally, about 80 particles per sample are analyzed to produce reliable statistical results. The fission track’s age was determined by the ξ calibration method [36], and the personal ξ value was 257.56 ± 17.67. The χ2 test was used to quantify age homogeneity. The value of P(χ2) > 5% represents a homogeneous age population [37]. The ability to retain fission tracks depends on the mineral and its composition, with apatite being a well-investigated mineral in this regard [34,38,39,40,41]. There was no obvious failure in the analyses. Moreover, the variation in Dpar is small and less likely to cause dispersion of the grain ages. For samples with a P(χ2) value less than 5%, reflecting a wide distribution of individual grain ages, the distribution of the observed grain age should be decomposed to correspond to different grain age components of different clastic sources [42]. Track length distributions, combined with track density for a known uranium content, offer valuable insights into the thermal history of geological processes.

4. Petrographic Characteristics and Analysis of Detrital Particle Composition

In this study, the Dajianggang Formation in the Shuangyang area of central Jilin Province was systematically sampled to investigate the petrographic characteristics of the rock. In order to achieve this, five representative samples, namely 19DJ-1, 19DJ-2, 19DJ-3, 19DJ-4, and 19DJ-5, were selected for thin-section analysis. The Dajianggang Formation sandstones exhibit a medium–fine clastic texture and massive structure. They primarily consist of heterogenous matrix support, basement cement, and floating contacts between particles. The detrital particles are predominantly angular to subangular, with a wide range of particle sizes, varying from 0.1 to 2 mm, and the average content of heterogenous matrix is about 46%. Iron cement is the primary cementing agent in the sandstones. The clastic composition is dominated by feldspar, quartz, and lithic fragments, with an average content of feldspar at 29%, quartz at 30%, and lithic fragments at 41%. The rock type can be classified as feldspar lithic sandstone. The feldspar type includes plagioclase and alkaline feldspar, with plagioclase showing obvious polysynthetic twinning (Figure 2c). The alkaline feldspar type comprises potassium feldspar and microcline, with potassium feldspar showing Carlsbad twinning and microcline exhibiting grid twinning. The content of both types of alkaline feldspar is minimal. Monocrystalline quartz grains are small, irregular, and granular, with wavy extinction and no secondary enlarging. Polycrystalline quartz grains are large and often appear as aggregates or even gravel (Figure 2e,f). The lithic fragments vary in size, shape, and distribution and are dominated by volcanic and sedimentary lithic fragments, with rare metamorphic lithic fragments. Some volcanic lithic fragments show an obvious lattice made up of plagioclase (Figure 2d,g). Euhedral limonite is also observed (Figure 2e). The detritus exhibits poor sorting and roundness, uneven particle size, and a low component maturity, indicating that it originates from a nearby provenance area and has not been transported for a long distance or time.
The Gazzi–Dickinson point method was used to perform microscopic thin section analysis and Dickinson sandstone model analysis. The compositional analysis of the samples revealed the presence of monocrystalline quartz, polycrystalline quartz, total quartz, plagioclase, potassium feldspar, sedimentary rock debris, volcanic rock debris, total debris, muscovite, biotite, cement, or matrix. Such detailed petrographic analysis of the rock can provide valuable insights into the sedimentary environment and provenance of the rock [43,44]. The Gazzi–Dickinson point-counting method was used to conduct microscopic analysis of thin sections of five samples (19DJ-1, 19DJ-2, 19DJ-3, 19DJ-4, and 19DJ-5) selected from the Dajianggang Formation in the Shuangyang area of central Jilin Province. Each component’s node count, obtained from pattern analysis, was converted into a percentage in order to determine its content in the sample. The statistical results of both the point-counting method and pattern analysis are presented in Table 1 and Figure 3, respectively. It should be noted that the section of sandstone sample 19DJ-5 contains gravels with diameters ranging from 3 to 12 mm and a content of 40%–50%; therefore, fewer than 300 particles met the statistical requirements.
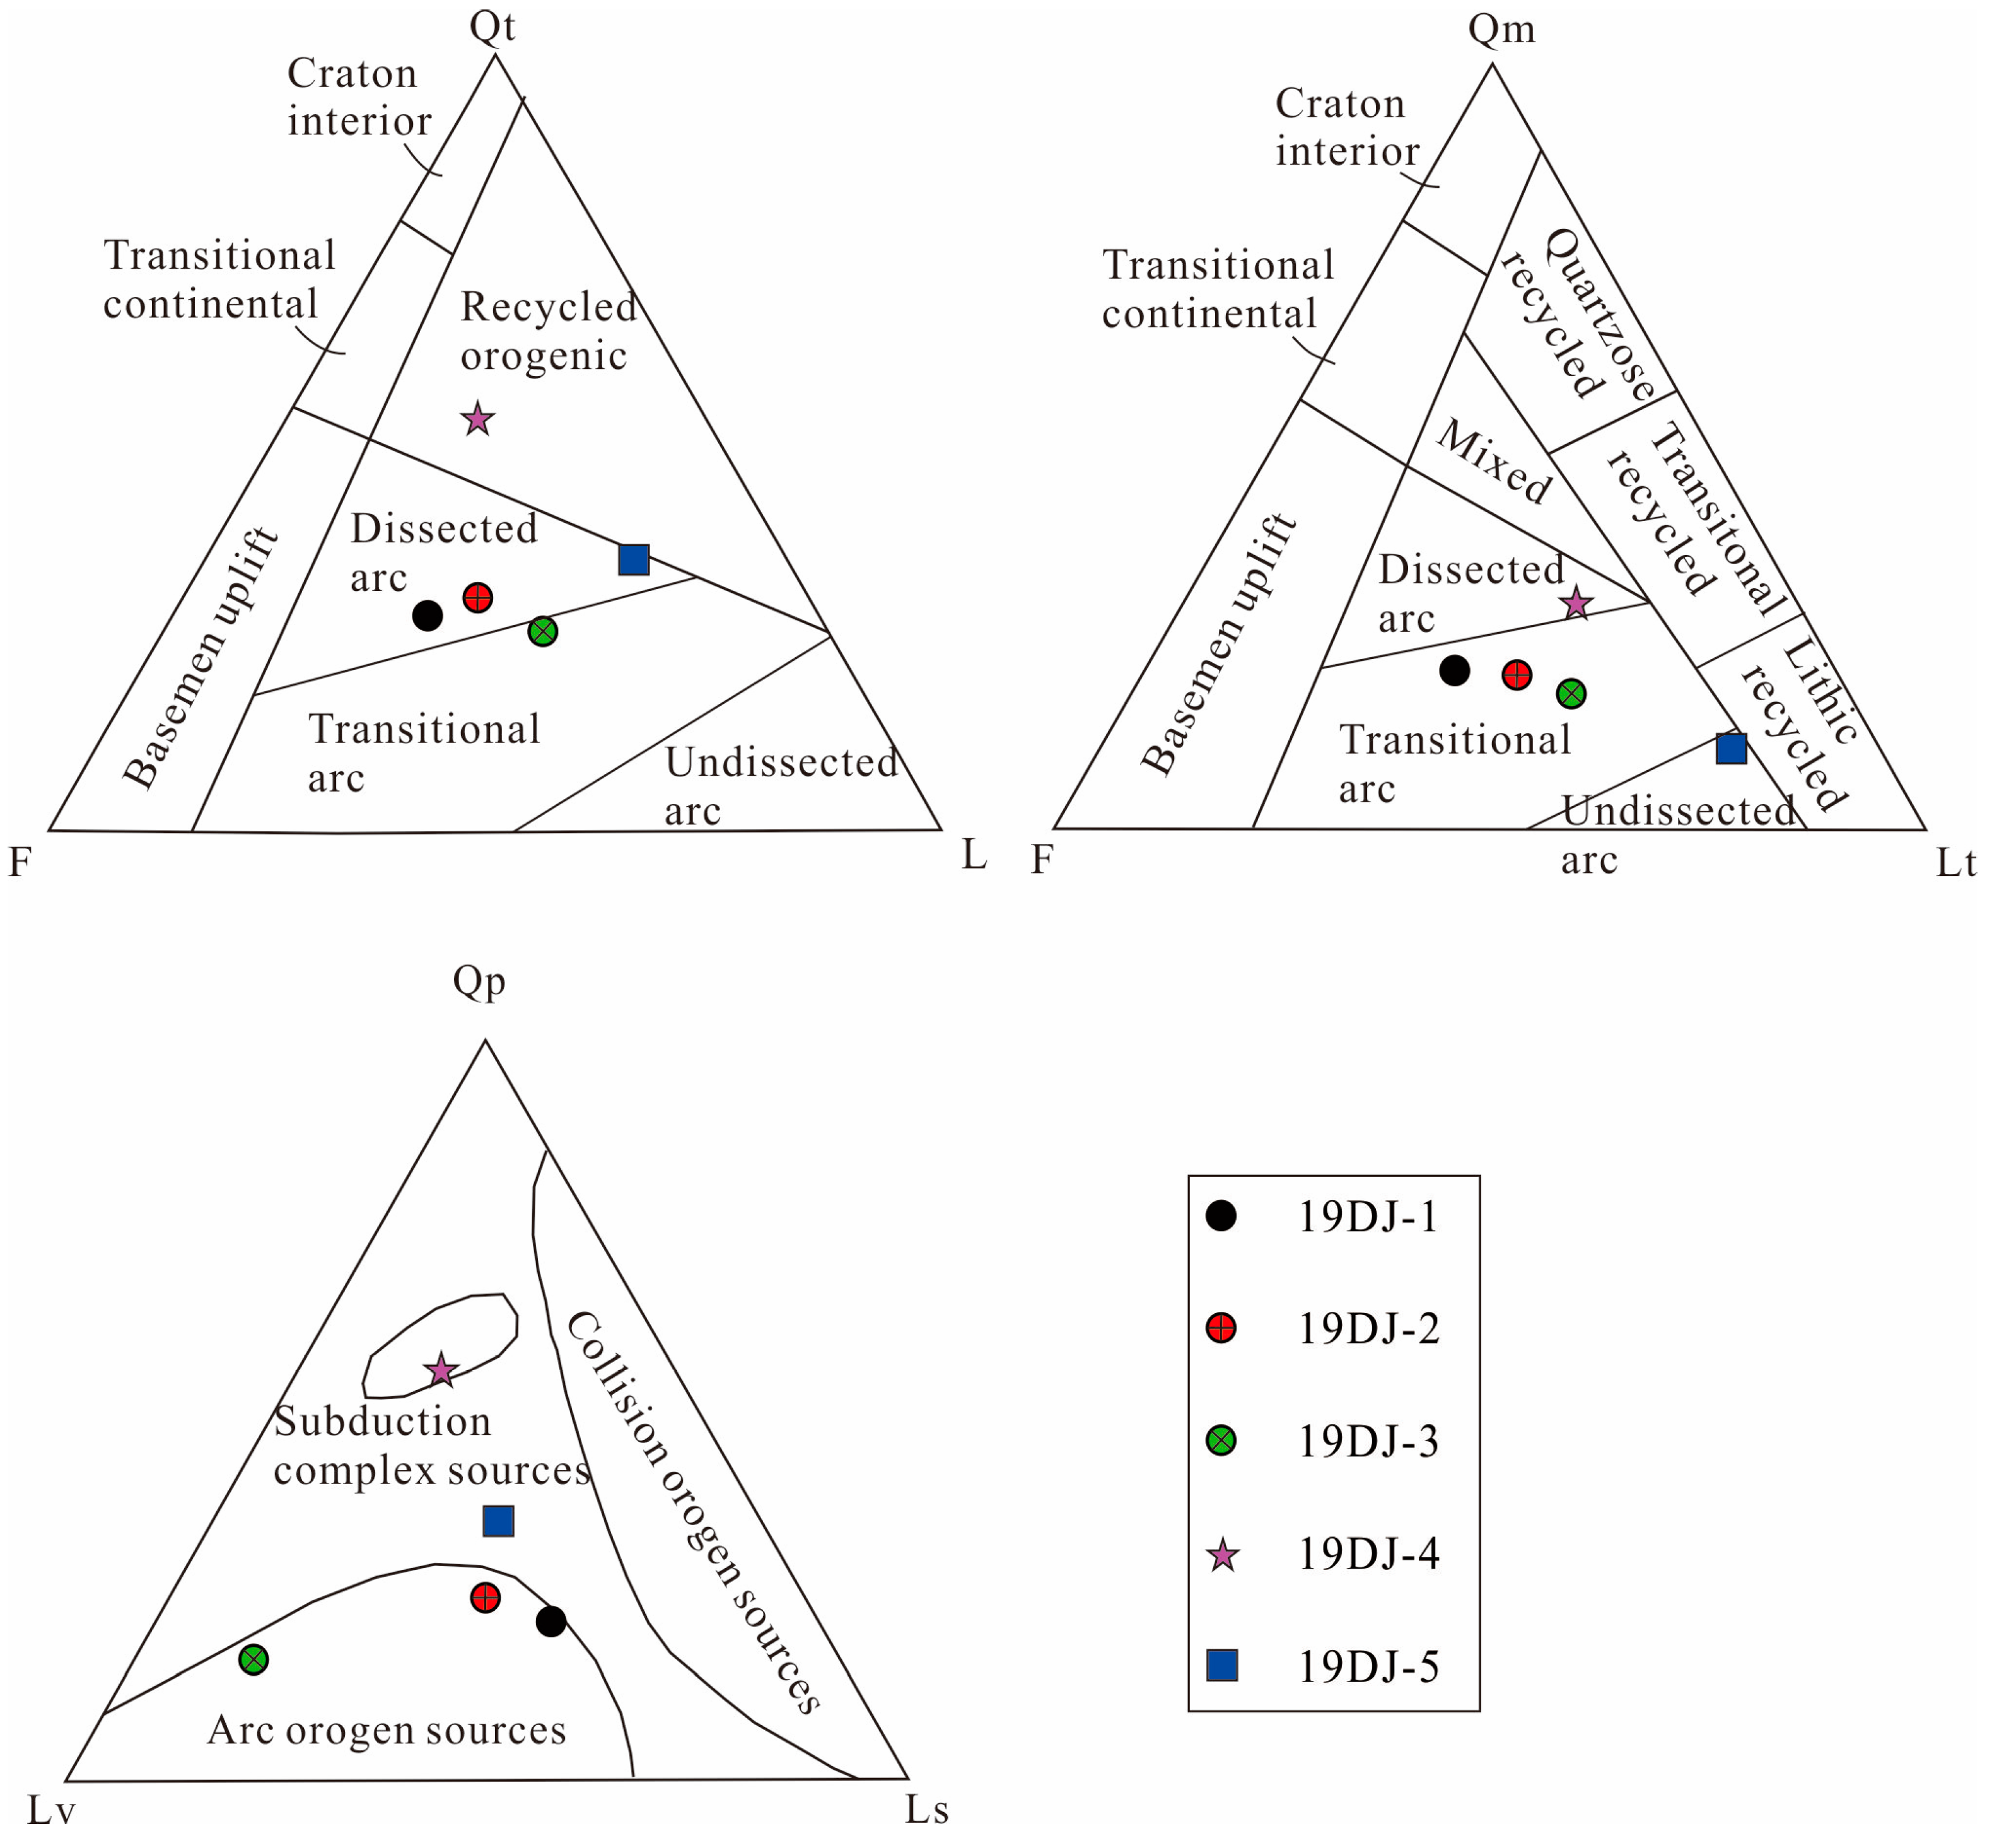
According to the statistical results of the detrital composition of sandstone and the Dickinson sandstone model analysis theory, Qt-F-L, Qm-F-Lt and Qp-Lv-Ls triangular diagrams were illustrated (Figure 3).
As shown in Figure 3, the diagrams reveal that some of the samples of the Dajianggang Formation belong to the side close to the dissected arc region within the recycled orogenic belt in the Qt-F-L diagram, while others fall on the dissected arc region, and the rest fall on the side close to the dissected arc region within the transitional arc region. In the Qm-F-Lt diagram, some samples are situated in the dissected arc area close to the transitional arc region, while most of them fall in the transitional arc area, and the remaining samples are located in the undissected arc area close to the transitional arc side. Regarding the Qp-Lv-Ls diagram, most of the Dajianggang Formation samples are distributed in and around the provenance area of the island arc orogenic belt, and some of them are found in the subduction complex belt. Based on the above analysis, it can be inferred that the sandstone provenance area of the Dajianggang Formation in the Shuangyang area is complex, mainly consisting of the provenance of the island arc orogenic belt.

5. Analysis of Geochemical Characteristics

The geochemical characteristics of clastic sedimentary rocks play a crucial role in understanding their origins, tectonic settings, and evolutionary processes. The composition of sedimentary rocks is closely linked to their provenance, tectonic environment, and depositional history. Studies have demonstrated that the texture of sandstones and their major element geochemistry can provide valuable information for evaluating provenance and tectonic settings. However, inactive trace elements and rare earth elements are even more effective in providing information on provenance. Hence, this study aims to examine the provenance of sandstones through the analysis of major elements and trace elements.

5.1. Geochemical Characteristics of Major Elements

The geochemical analysis results of the major elements of three sandstone samples from the Dajianggang Formation are shown in Table 2. The SiO2 content of the sandstone is high, ranging from 63.01% to 72.92%, with an average of 66.97%. Meanwhile, the Al2O3 content is between 13.67% and 16.79%, with a mean of 15.69%, and the TFe2O3 content is between 3.82% and 8.37%, with a mean of 6.14%. The contents of CaO and MgO, which are indicators of carbonate rocks, are relatively low, ranging from 0.36% to 0.63% and 0.92% to 2.26%, respectively (the average contents are 0.49% and 1.38%, respectively). These results suggest that the proportion of carbonate rocks in the sample is minimal. The K2O and Na2O contents are average, ranging from 1.69% to 1.75% and 2.68% to 4.30% (average contents are 1.75% and 2.68%, respectively). The TiO2 content ranges from 0.67 to 0.89, with an average content of 0.78%. The sample contains small amounts of P2O5 and MnO (ranging from 0.13% to 0.26% and 0.07% to 0.11%, with average contents of 0.20% and 0.09%, respectively), suggesting the presence of accessory minerals, such as apatite and epidote.
In order to evaluate the intensity and nature of weathering of the source rock in the provenance area, the difference in stability of major element oxides can be utilized. The chemical index of alteration (CIA) and chemical index of weathering (CIW) have been proposed for this purpose, allowing for the quantitative analysis of weathering intensity.
The chemical index of alteration (CIA), first introduced by Nesbitt and Young [45], is calculated based on the mole number of oxides CaO, Na2O, K2O, and Al2O3. Its formula is widely used in geochemical studies and can provide insight into the degree of chemical alteration of the source rock. The specific formula is as follows:
CIA = [(Al2O3)/(CaO* + Na2O + K2O + Al2O3)] × 100
Under natural conditions, the CIA value of rocks is usually greater than 50. The mole number of CaO, Na2O, and K2O in rocks decreases gradually with increasing weathering intensity, while the proportion of stable oxide Al2O3 increases accordingly, resulting in an increase in the CIA value. A range of 50–60 in the CIA value indicates initial weathering, a range of 60–80 indicates moderate weathering, and a CIA value greater than 80 indicates intense weathering [46]. The formula for the CIA calculation involves the mole number of each oxide, with CaO* representing the mole number of CaO in silicate minerals, excluding phosphate and carbonate minerals. Nesbitt and Young [45] first introduced the CIA as a quantitative parameter for evaluating the intensity of weathering of source rocks in the provenance area, allowing for the determination of the intensity and nature of weathering.
In evaluating weathering intensity using the chemical index of alteration (CIA), it is important to consider the potential influence of potassium metasomatism, which can cause the illitization of kaolinite and result in a lower calculated CIA value than the actual weathering intensity. In order to address this issue, Harnois [47] introduced the chemical index of weathering (CIW) by removing K2O from the CIA formula. The CIW formula is as follows:
CIW = [(Al2O3)/(CaO* + Na2O + Al2O3)] × 100
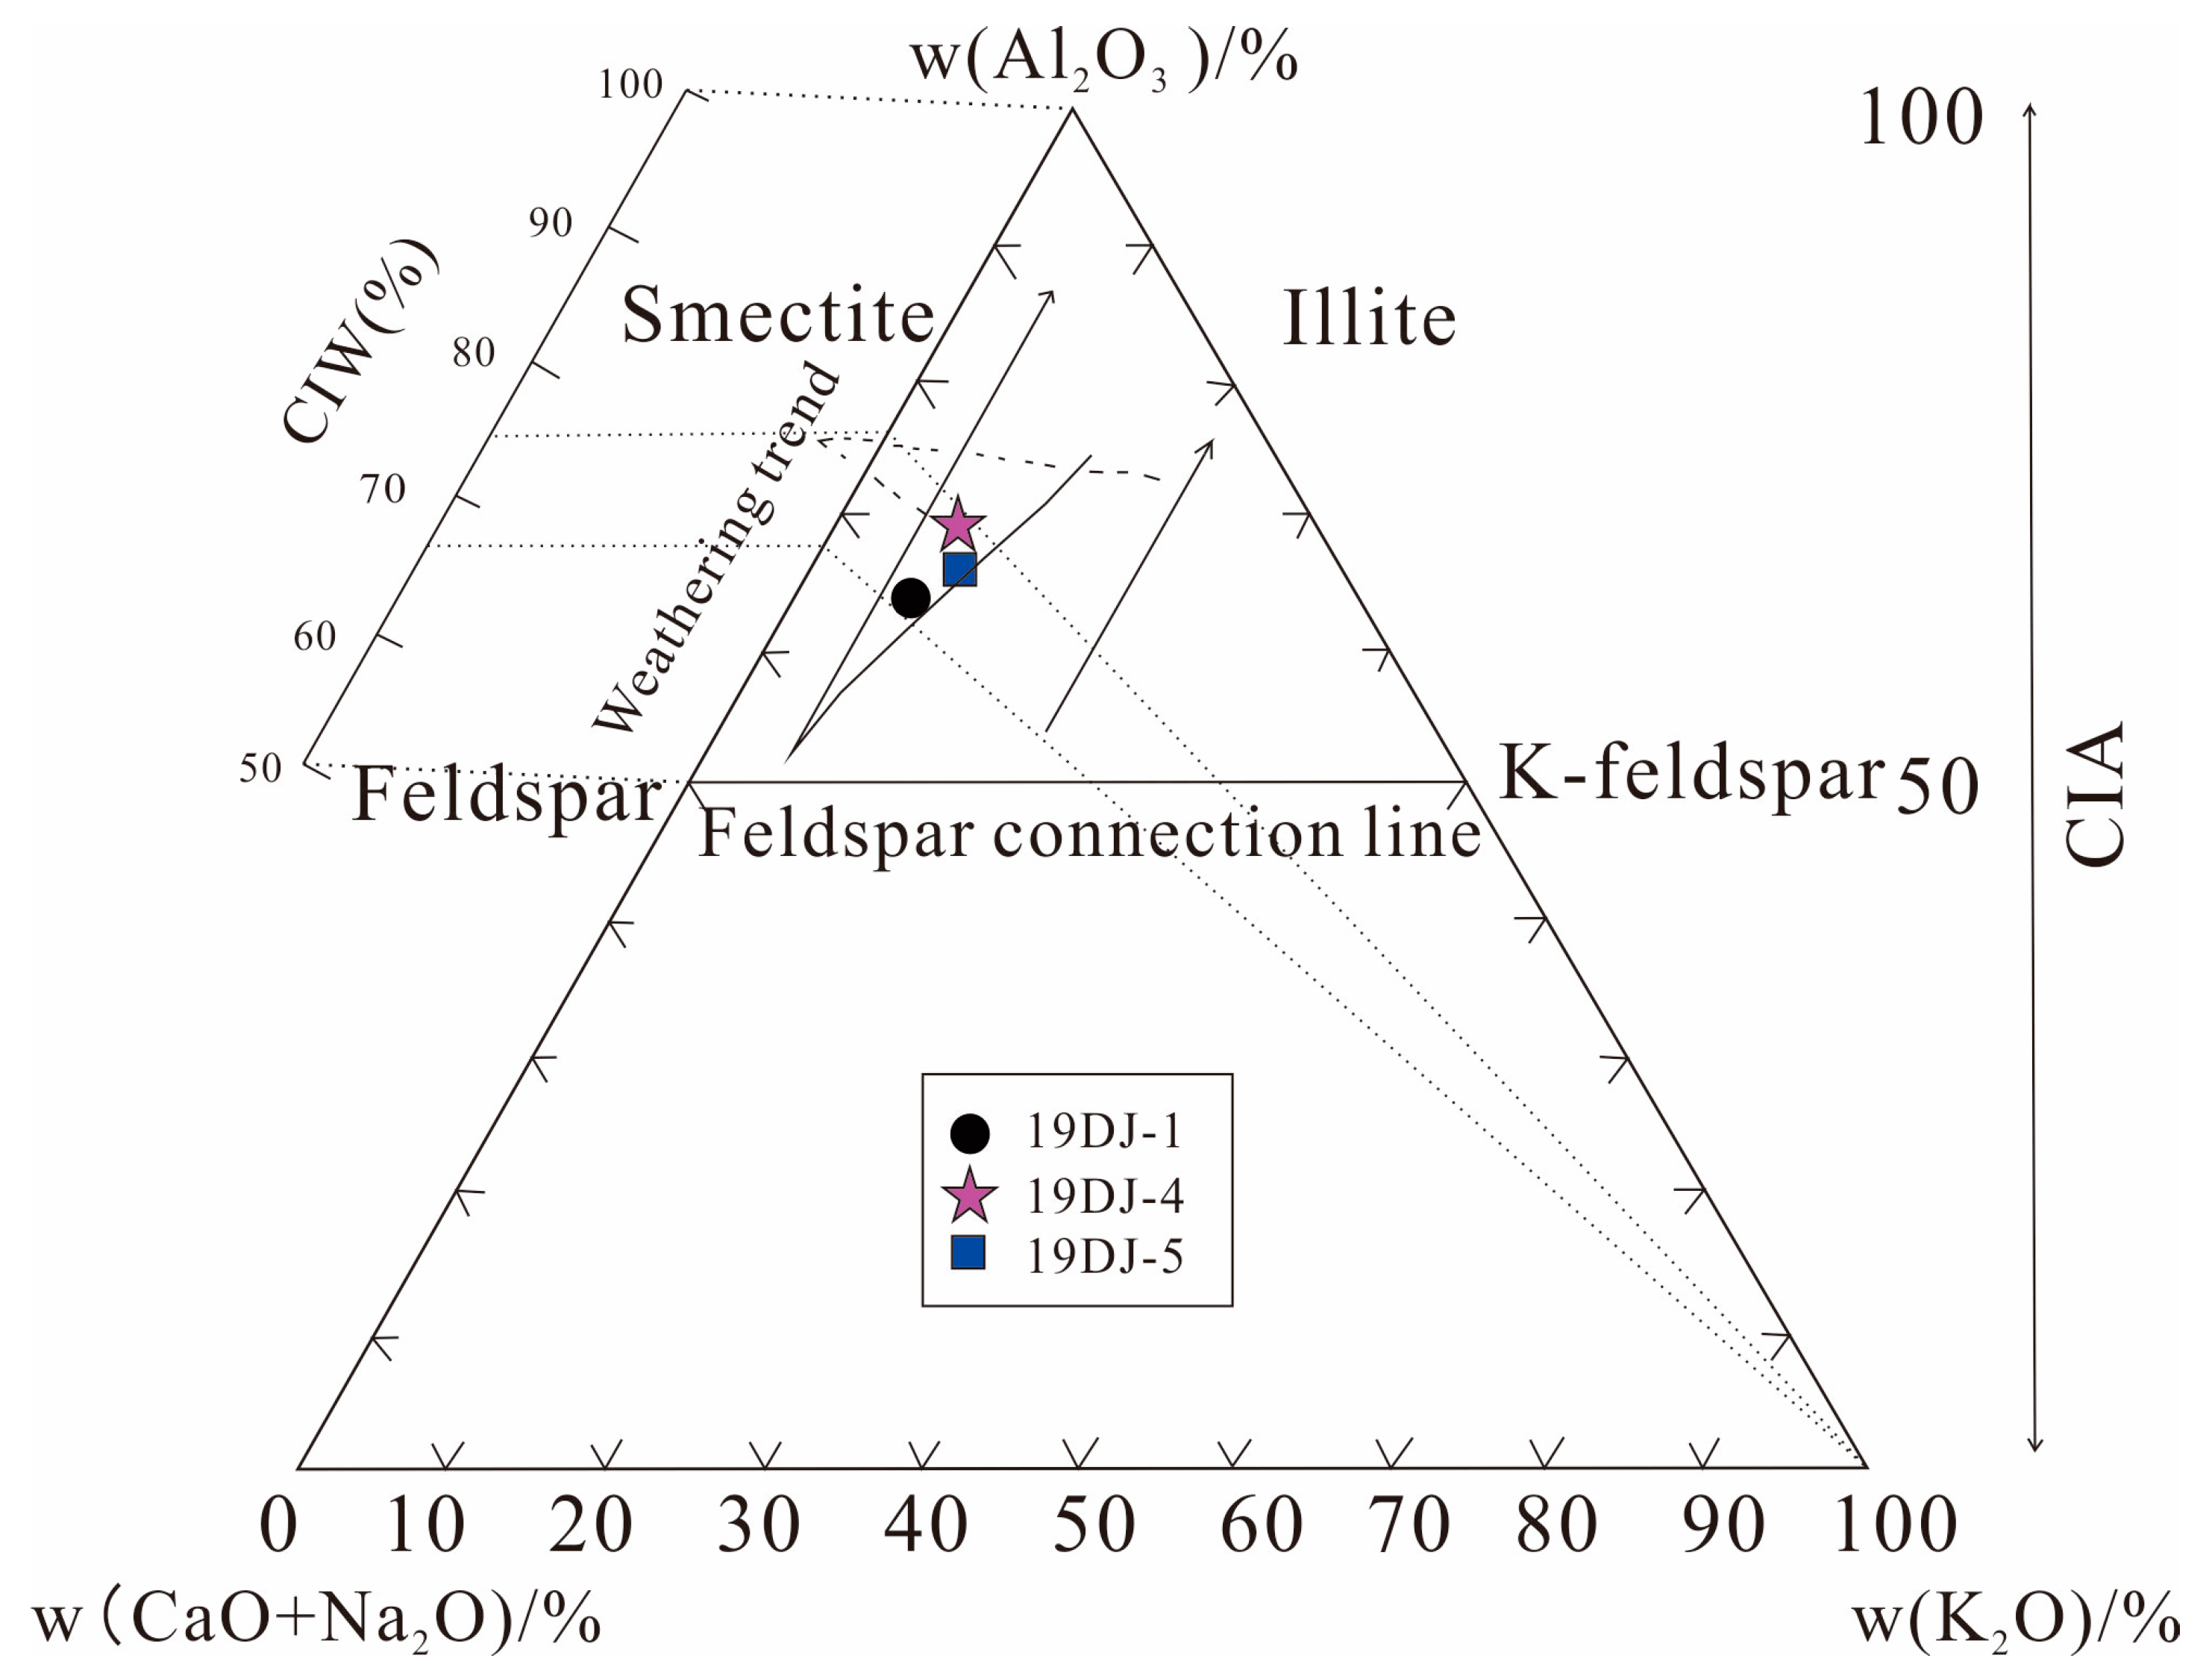
On the A-CN-K weathering triangle diagram, the CIW value of a rock can be determined by projecting the line connecting the K endpoint and the sample point onto the edge of A-CN. This diagram is widely used in the field of geochemistry to assess the degree of weathering and chemical alteration of rocks, particularly in the study of soils and sediments. The A-CN-K diagram plots the percentage of Al2O3 (A), CaO + Na2O (CN), and K2O(K) on a ternary plot, which enables geochemists to assess the extent of weathering and alteration based on the position of a given sample in the plot. The CIW value calculated from the A-CN-K diagram provides a more accurate estimate of weathering intensity than does the CIA, as it eliminates the potential bias introduced by potassium metasomatism.
The above methods for evaluating weathering intensity were applied to the sandstone of the Dajianggang Formation in the Shuangyang area, yielding an average CIA value of 65.65, which indicates a moderate level of weathering intensity (as shown in Table 2). In the A-CN-K diagram (Figure 4), in order to correct for potassium metasomatism, the average CIW was obtained by projecting a line connecting the K endpoint and the sample point, resulting in a value of 71.27, which is approximately 6 higher than the CIA value. Taken together, both the CIA and CIW values suggest that the sandstone of the Dajianggang Formation underwent moderate weathering during diagenesis. Additionally, the ICV, which is the indicator of compositional variation introduced by Cox, Lowe [48], can also be utilized to estimate the composition of clastic sandstone, with the following calculation formula:
ICV = (Fe2O3 + Na2O + CaO + K2O + MgO + MnO + TiO2)/Al2O3
The ICV value is a useful indicator for estimating the composition of clastic sandstone, and it varies depending on the mineralogical composition. Clastic source rocks composed mainly of non-clay minerals typically have higher ICV values than those composed mainly of clay minerals. Sandstones composed primarily of biotite, amphibolite, or pyroxene, with low clay mineral content, usually have ICV values greater than 1 and are often associated with sediments from the first cycle in tectonically active areas [48]. In contrast, first-cycle terrigenous sediments that have undergone intense weathering and have been in the clay for a long time may have ICV values less than 1 due to further weathering. The ICV value of the sandstone from the Dajianggang Formation ranges from 0.76 to 0.99, with an average value of 0.88, which is less than 1, indicating that it may be the result of recycled sediments or sediments that have undergone intense weathering. Therefore, it can be concluded that the sandstone debris of the Dajianggang Formation has undergone the process of terrigenous recycling.
The geochemical characteristics of clastic sedimentary rocks are influenced by the composition of their source rocks. These characteristics not only reflect the type of source rock from a geochemical perspective, but also provide information about the tectonic setting of the formation. This is because plate tectonic activities are crucial in controlling the composition of source rocks, the sedimentary topography of provenance areas, the diagenesis of sedimentary rocks, the deposition rate, and the weathering intensity. The changes in geochemical characteristics can thus reflect the different tectonic settings of the sedimentary rocks. While it can be challenging to determine the relationship between geochemical characteristics and the tectonic setting of detrital sedimentary rocks throughout their long sedimentary history, researchers have established the relationship between them by analyzing the geochemical characteristics of sedimentary rocks with similar tectonic settings and studying their mechanisms from the perspective of diagenesis. Therefore, based on previous studies, we can discuss the tectonic background of the sandstone formation in the Dajianggang Formation in the Shuangyang area.
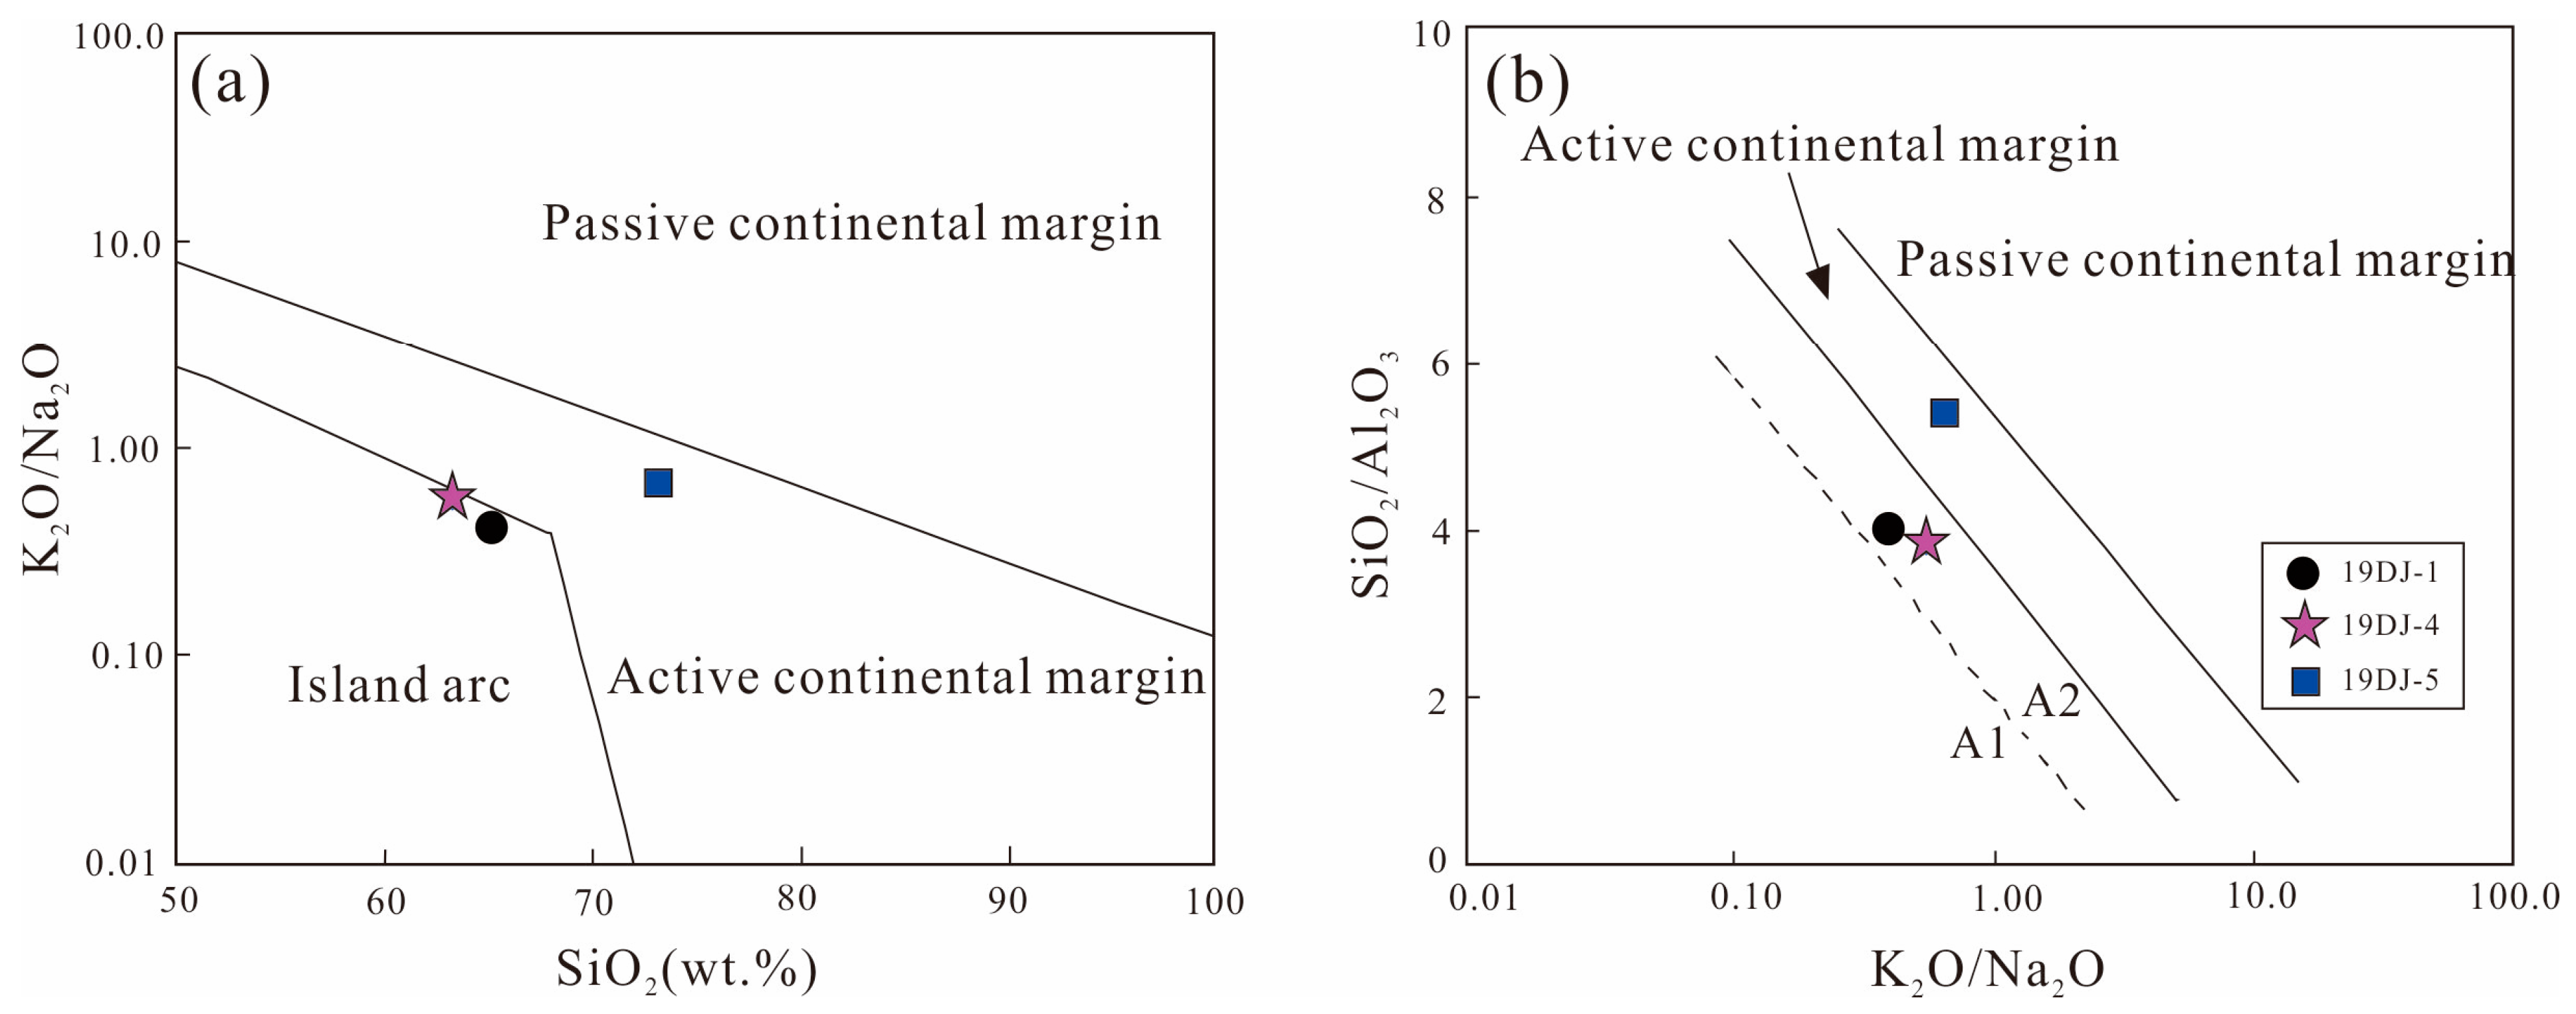
Roser and Korsch [49] developed a bivariate diagram based on the geochemical characteristics of sandstones and mudstones from modern tectonic settings to determine the tectonic background of sedimentary provenance. The diagram is based on the SiO2-K2O/Na2O and K2O/Na2O-SiO2/Al2O3 ratios, containing three categories of tectonic settings: active continental margin, passive continental margin, and island arc provenance. By projecting the geochemical data of sandstones from the Dajianggang Formation in the Shuangyang area onto this diagram (Figure 5), except for the graywacke sample 19DJ-5, the other two samples form in the island arc tectonic background. These results suggest that the provenance area of the Dajianggang Formation in the Shuangyang area was an island arc provenance area undergoing feldspar intrusive rock evolution. These findings are consistent with previous studies on the tectonic setting of the study area and provide further support for the geological evolution of the region.

5.2. Geochemical Characteristics of Trace Elements

The results of trace and REE geochemical analysis of sandstone samples from the Dajianggang Formation are shown in Table 3. The large ion lithophile elements Rb, Sr, Ba, and Cs have concentrations ranging from 17.06 to 43.76 × 10⁻⁶, 126.60 to 185.60 × 10⁻⁶, 279.40 to 377.40 × 10⁻⁶, and 2.90 to 3.83 × 10⁻⁶, respectively. Notably, Rb, Sr, and Ba are found to be deficient relative to the upper continental crust component. Similarly, the high field intensity elements Nb, Ta, Th, and Ce exhibit deficits, with concentrations ranging from 11.61 to 14.49 × 10⁻⁶ (average of 12.51 × 10⁻⁶) for Nb, 0.88 to 1.02 × 10⁻⁶ (average of 0.95 × 10⁻⁶) for Ta, 5.06 to 8.69 × 10⁻⁶ (average of 7.40 × 10⁻⁶) for Th, and 30.99 to 58.42 × 10⁻⁶ for Ce. On the other hand, the sandstone samples from the Dajianggang Formation in the study area exhibit slight enrichment of Ti and Zr, with Ti content ranging from 4016 to 5335 × 10−6, with an average of 4655.33 × 10−6, and Zr content ranging from 241.70 to 284.70 × 10⁻⁶, with an average of 258.00 × 10⁻⁶. Meanwhile, other elements, such as U and Hf, show comparable contents to the average values of the upper continental crust. The U content ranges from 2.56 to 2.85 × 10⁻⁶, with an average of 2.74 × 10⁻⁶, while the Hf content ranges from 5.60 to 6.44 × 10⁻⁶, with an average of 6.00 × 10⁻⁶. The trace element distribution pattern of the sandstone samples in the study area is similar to the average component distribution of the upper crust, with a gentle curve on the spider diagram (Figure 6a). Floyd and Leveridge [50] introduced the Hf-La/Th discrimination diagram (Figure 7a) in order to investigate the relationship between different provenance components. The diagram suggests that the content of Hf elements in sandstones would increase due to the decomposition of zircons, as a result of the gradual erosion of island arcs or continental basement. Based on this diagram, the sandstone samples from the Dajianggang Formation in the study area are mainly characterized by a felsic provenance. In addition, the Ni-TiO2 discrimination diagram (Figure 7b) shows that the samples are mainly distributed in the sandstone area with a sedimentary tendency. This result is consistent with the two-dimensional bivariate diagram of SiO2-K2O/Na2O and K2O/Na2O-SiO2/Al2O3, which further validates the conclusion. In summary, the provenance of the sandstones from the Dajianggang Formation in the study area can be attributed to felsic rocks with sedimentary tendency, and there might be a small amount of mixed source.
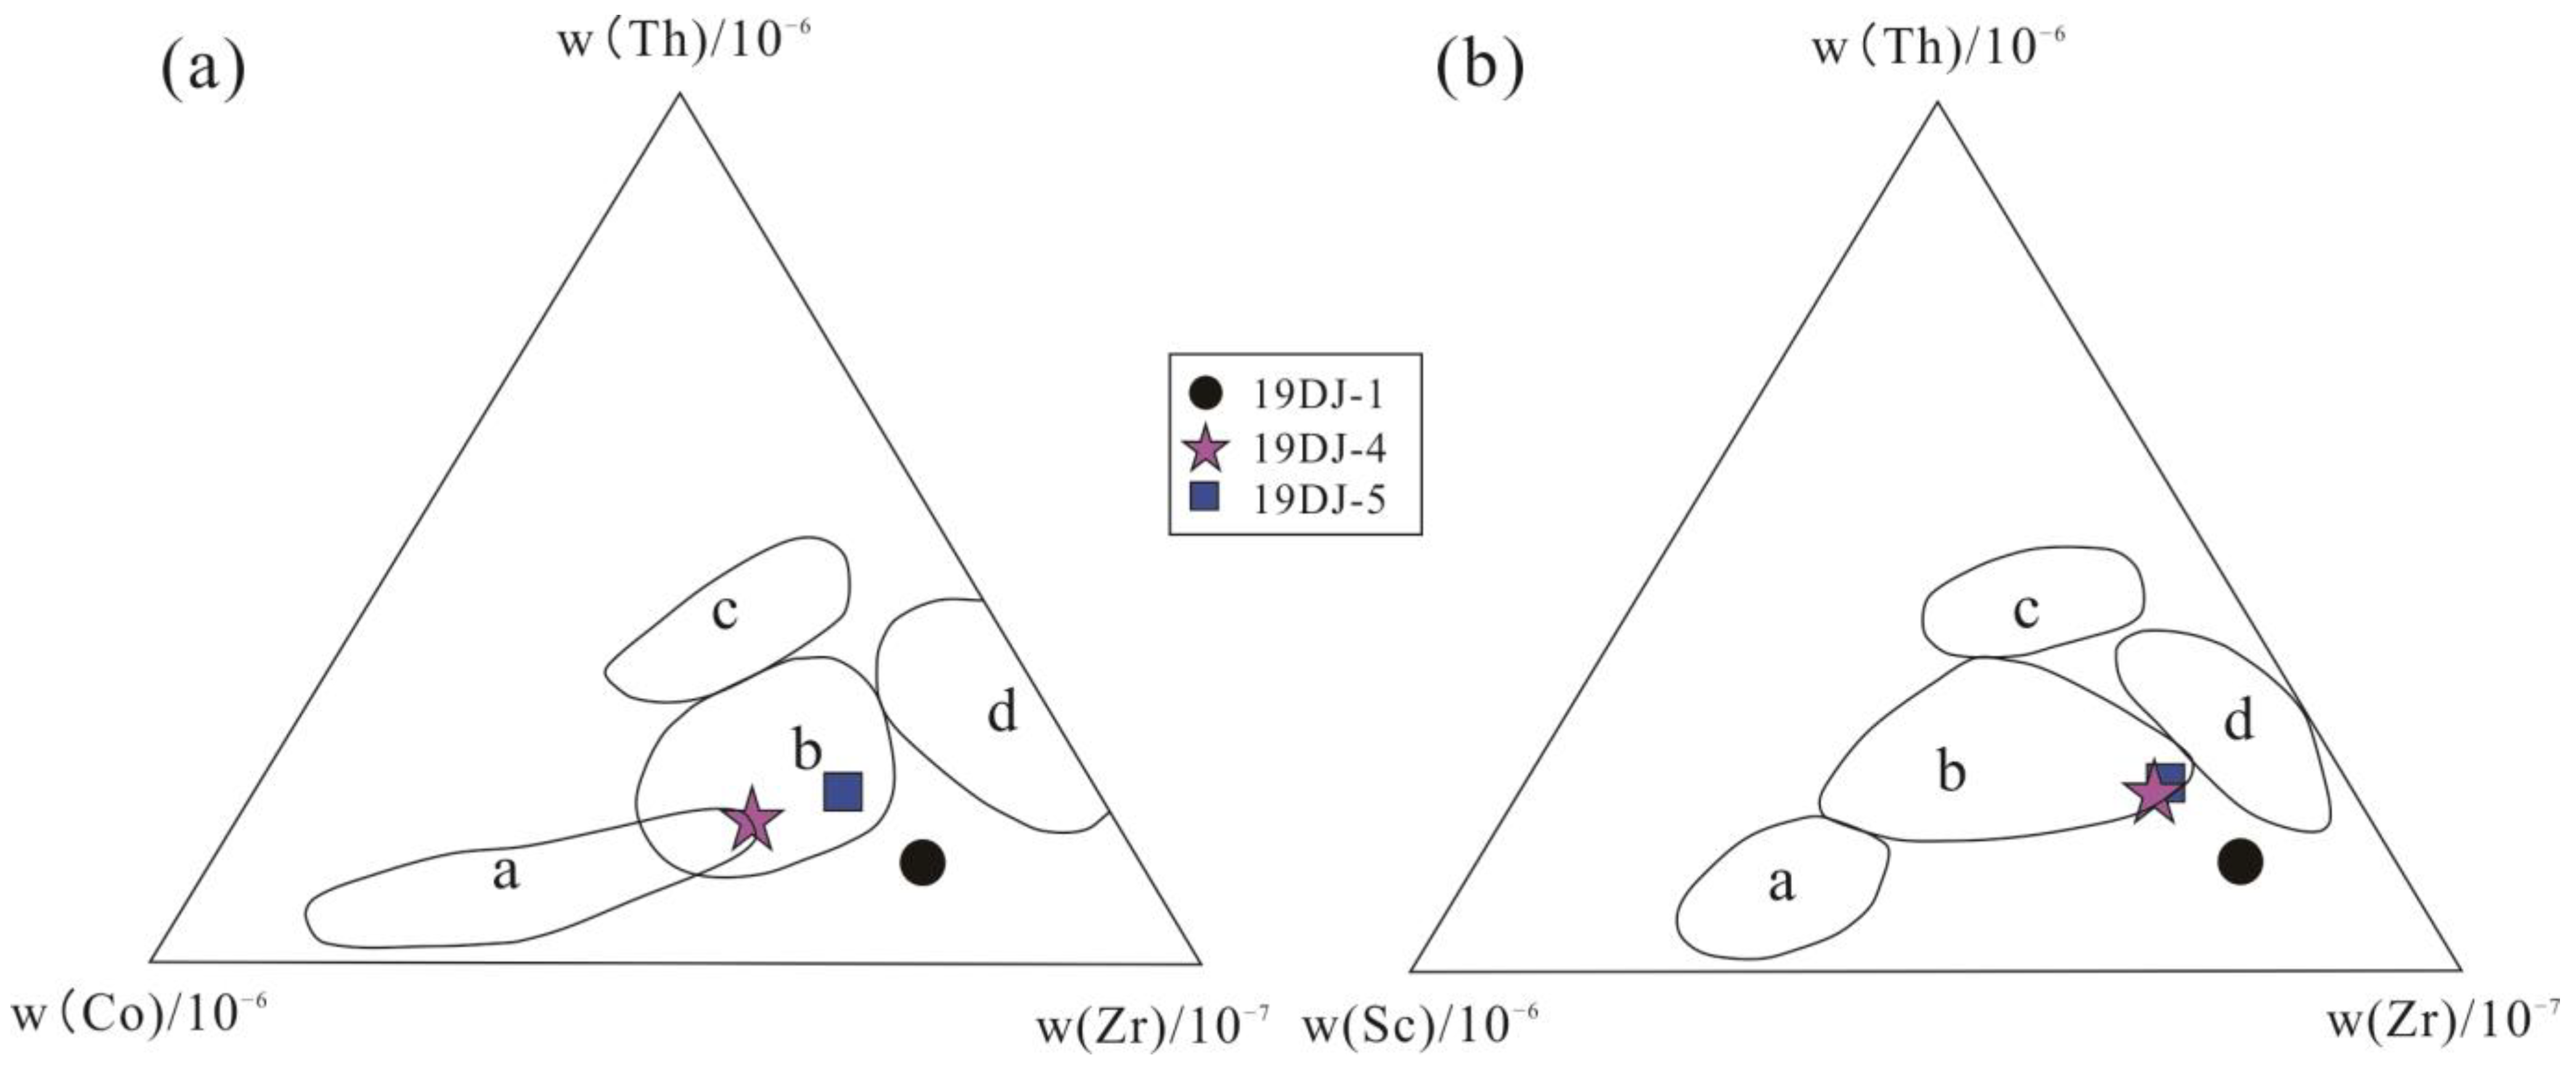
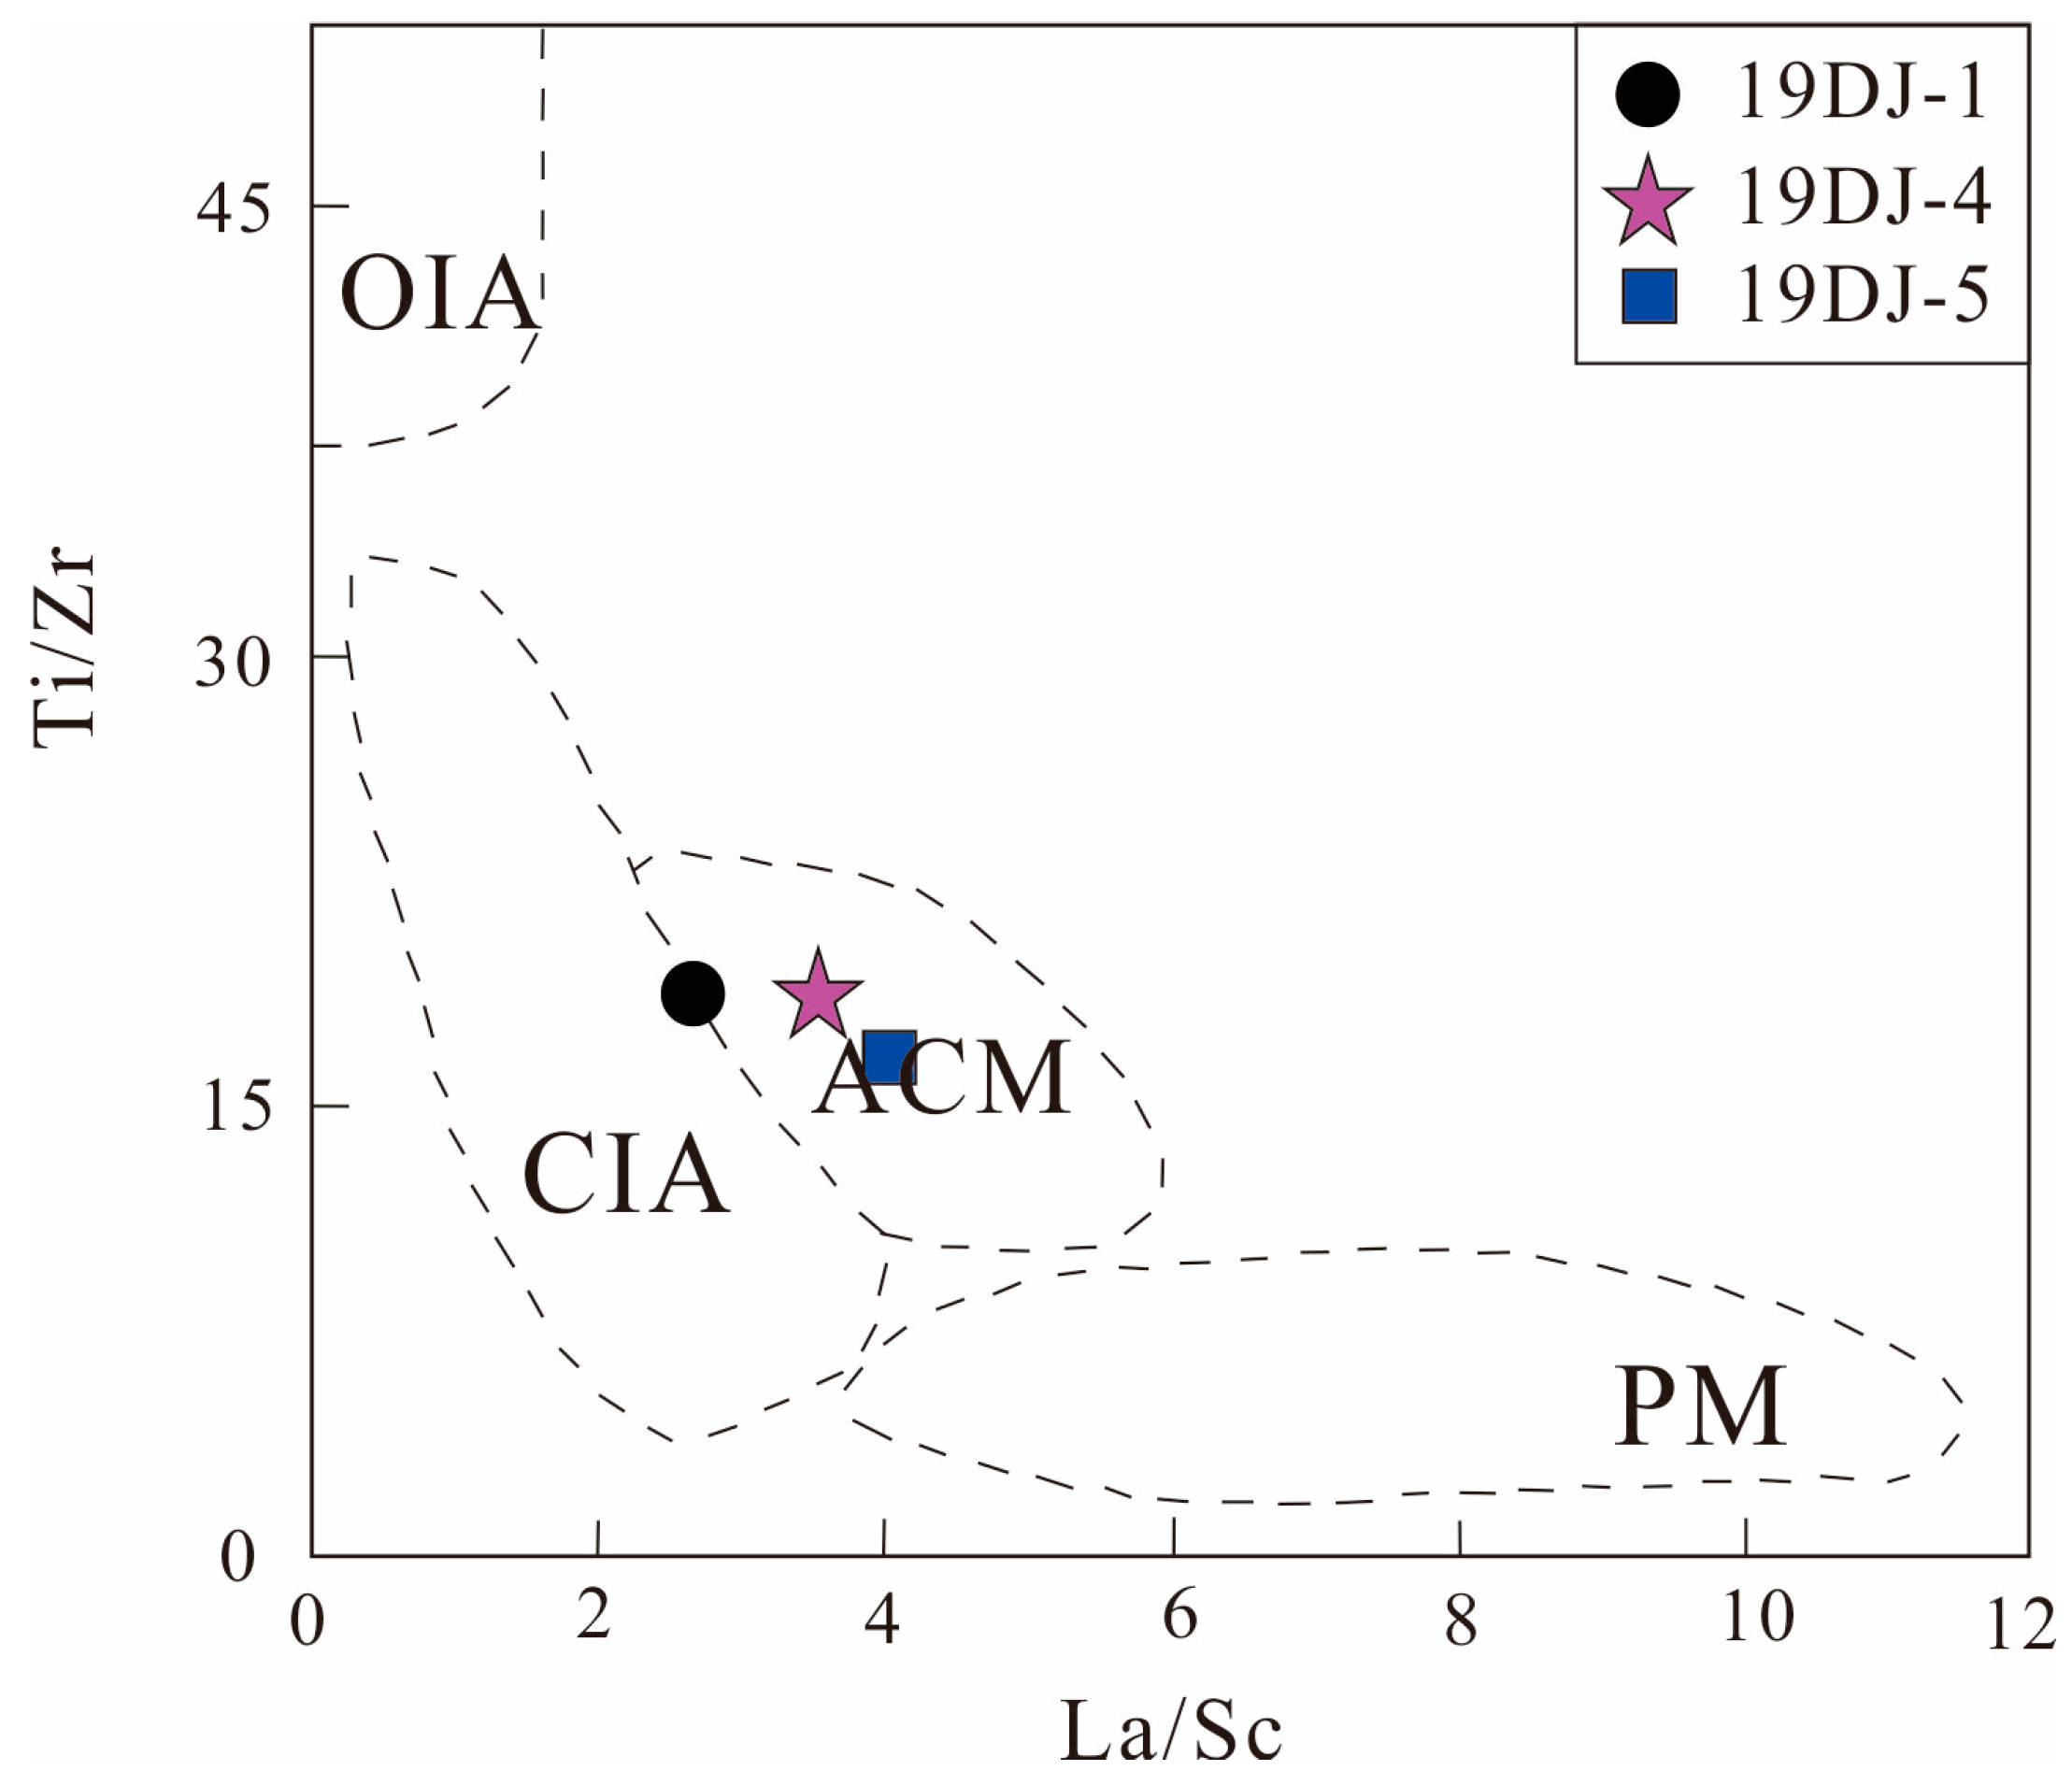
Trace elements, such as La, Ce, Y, Th, Zr, Nd, Hf, and Sc, are highly useful in identifying the provenance tectonic background of sedimentary rocks, due to their low mobility during the sedimentary process and high stability in seawater. These elements are abundant in clastic sedimentary rocks and are not prone to weathering and erosion, making them an ideal tool for understanding the characteristics of source rocks. Based on this premise, Bhatia and Crook [54] conducted a study on the tectonic significance of trace elements in provenance analysis, and categorized active continental margins (ACM), passive continental margins (PCM), oceanic island arcs (OIA), and continental island arcs (CIA) as the four major geotectonic source locations. In order to further understand the tectonic setting and provenance of the sandstones in the study area, several structure diagrams have been used. The Th-Co-Zr and Th-Sc-Zr triangle diagrams (Figure 8) were employed in order to analyze the compositional characteristics of the sandstones. The majority of the samples were found to fall within the continental island arc region. However, in the La/Sc-Ti/Zr diagram (Figure 9), they were mainly classified as active continental margin in source, with only one sample (19DJ-1) located at the boundary between the continental island arc and active continental margin, indicating that the tectonic setting of the Dajianggang Formation in the Shuangyang area is relatively complex. These findings provide valuable insights into the provenance and tectonic history of the study area. The sandstones of the Dajianggang Formation in the Shuangyang area were found to have a slightly scattered distribution of total rare earth elements (ΣREE), with values ranging from 81.07 to 141.58 × 10⁻⁶, and an average value of 116.60 × 10⁻⁶. The content of light rare earth elements (ΣLREE) ranges from 71.48 to 127.30 × 10⁻⁶, with an average value of 103.86 × 10⁻⁶. The ratio of (La/Sm)N is between 0.68 and 0.83. The content of heavy rare earth elements (ΣHREE) ranges from 9.60 to 14.34 × 10⁻⁶, with a mean value of 12.74 × 10⁻⁶. The (Eu/Yb)N ratio is between 1.56 and 1.61. The ratio of light rare earth to heavy rare earth elements (ΣLREE/ΣHREE) ranges from 7.45 to 8.91, with an average of 8.08. The (La/Yb)N ratio ranges from 0.77 to 1.05, with an average value of 0.93. Overall, the standard distribution pattern of rare earth elements in the sandstone samples of the Dajianggang Formation is very similar to that of post-Archaean Australia sedimentary rocks (Figure 6b), indicating a gentle trend.
To summarize, the application of various structural background discrimination diagrams indicates that the sandstone of the Dajianggang Formation has been derived from the continental island arc environment, although there may be some contributions from mixed sources. By considering the geological time scale, this suggests that the tectonic activity in the source area was relatively unstable during the Late Triassic period, characterized by a geological setting with active tectonic movement.

6. Analysis of LA-ICP-MS Zircon Dating Results

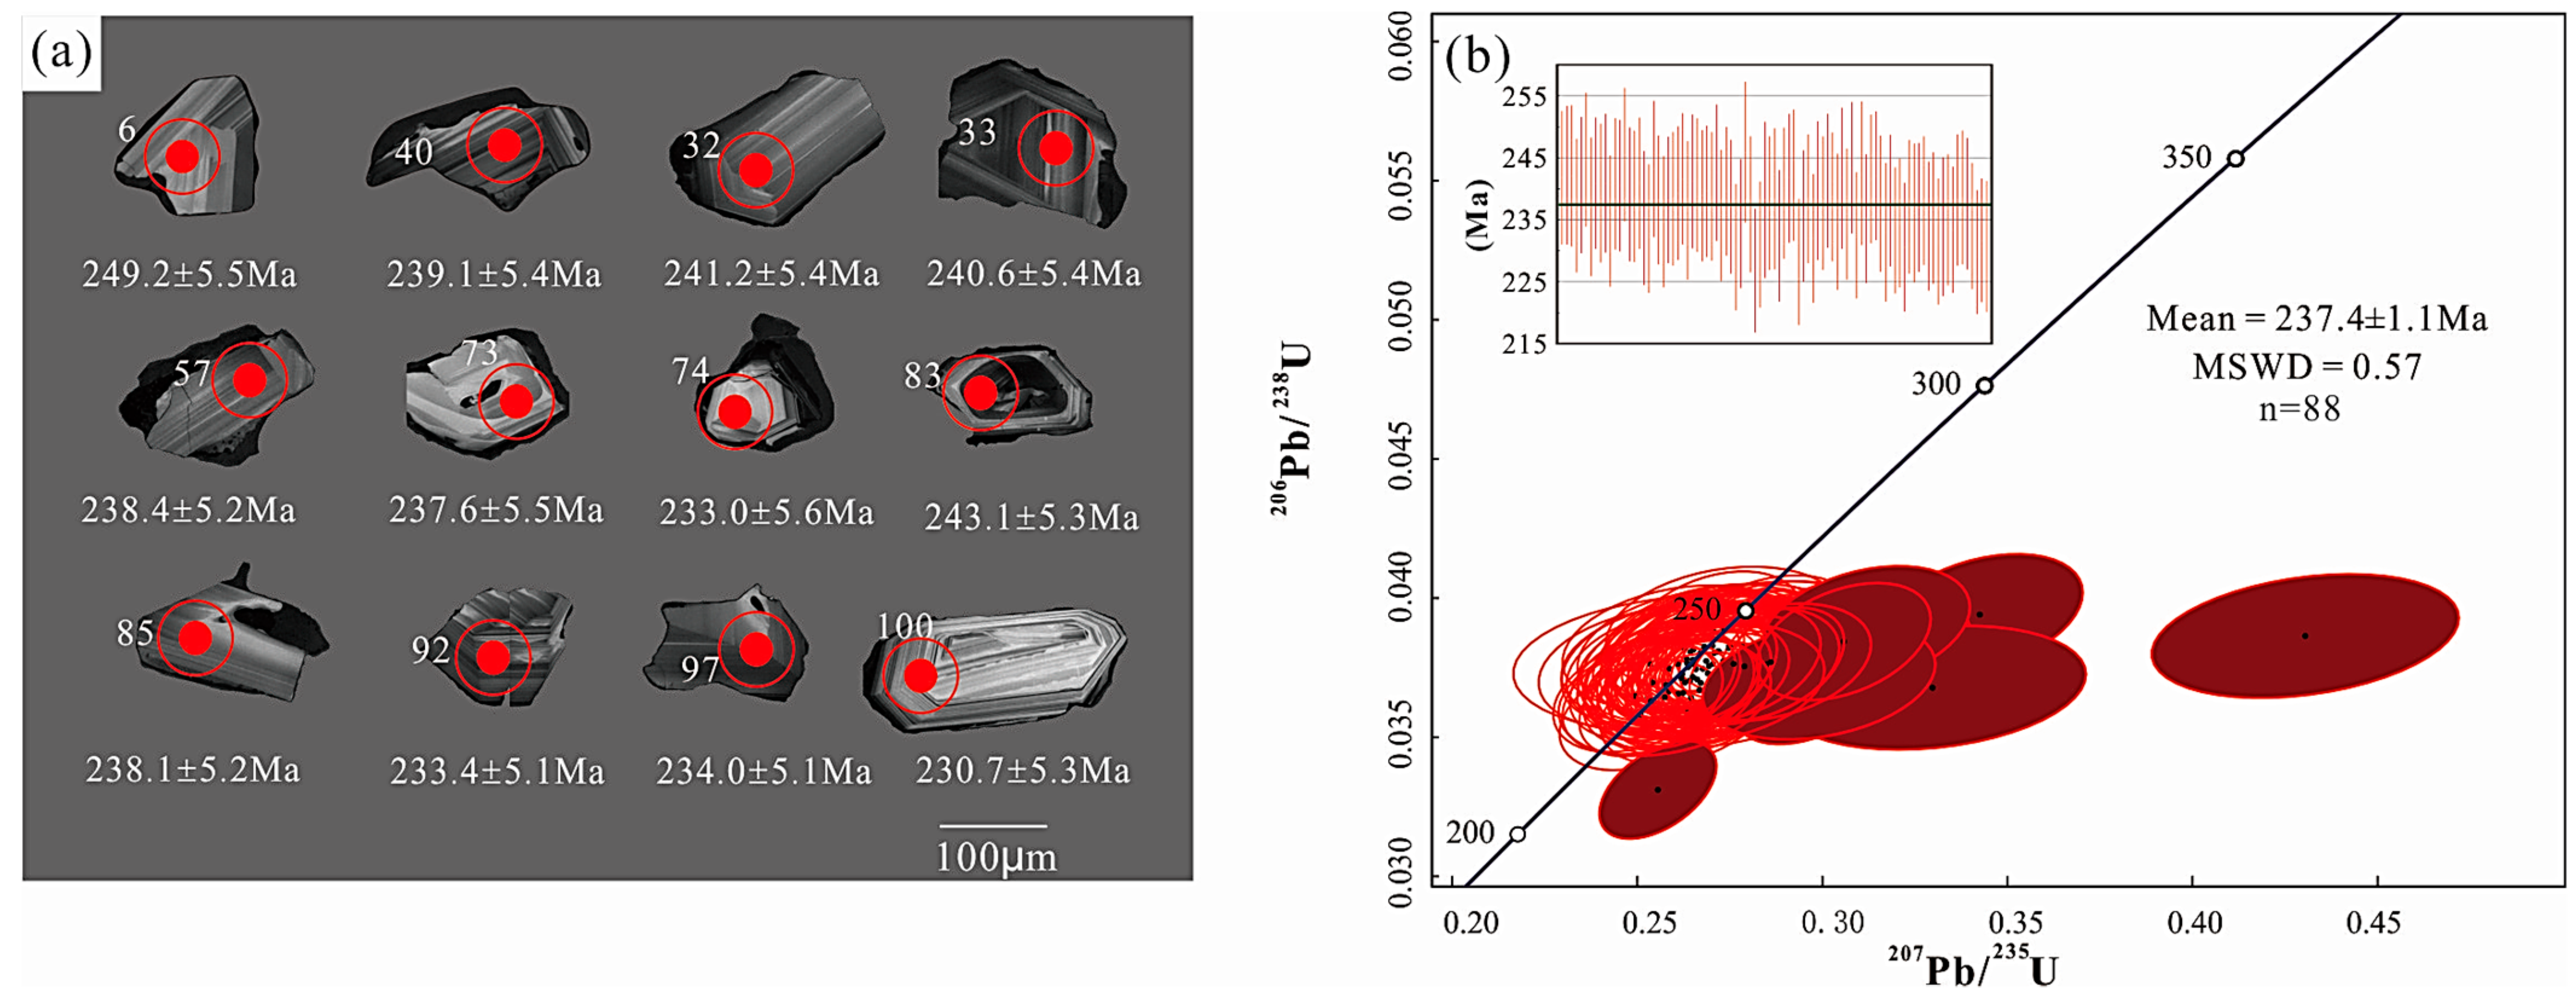
In this study, LA-ICP-MS detrital zircon U-Pb dating was utilized in order to determine the age of sandstone sample 19DJ-1 from the Late Triassic Dajianggang Formation in the Shuangyang area, located in central Jilin Province. Detailed observations of the crystal morphology using CL images revealed that the majority of the detrital zircons are semi-euhedral and heteromorphic crystals with typical magmatic oscillating growth zones (Figure 10a). The presence of high Th/U values (0.31–1.61) further indicates their magmatic origin, which is in accordance with the geological context [55]. The age distribution of detrital zircons and the U-Pb Concordia diagram, as shown in the Figure 10, were used to analyze the provenance and geological history of the Dajianggang Formation in the Shuangyang area.
The 206Pb/238U age range of the 100 analyzed zircons ranges from 210 to 363 Ma (Table 4), the majority of the 88 concordant zircons falling within the range of 226.8 to 246.5 Ma. The weighted mean 206Pb/238U age of these zircons is 237.4 ± 1.1 Ma (MSWD = 0.57), indicating that they were likely crystalized around the Middle to Late Triassic boundary (Figure 10b). The CL images of the detrital zircons show that most zircons are semi-euhedral and heteromorphic crystals, further supporting their magmatic origin.
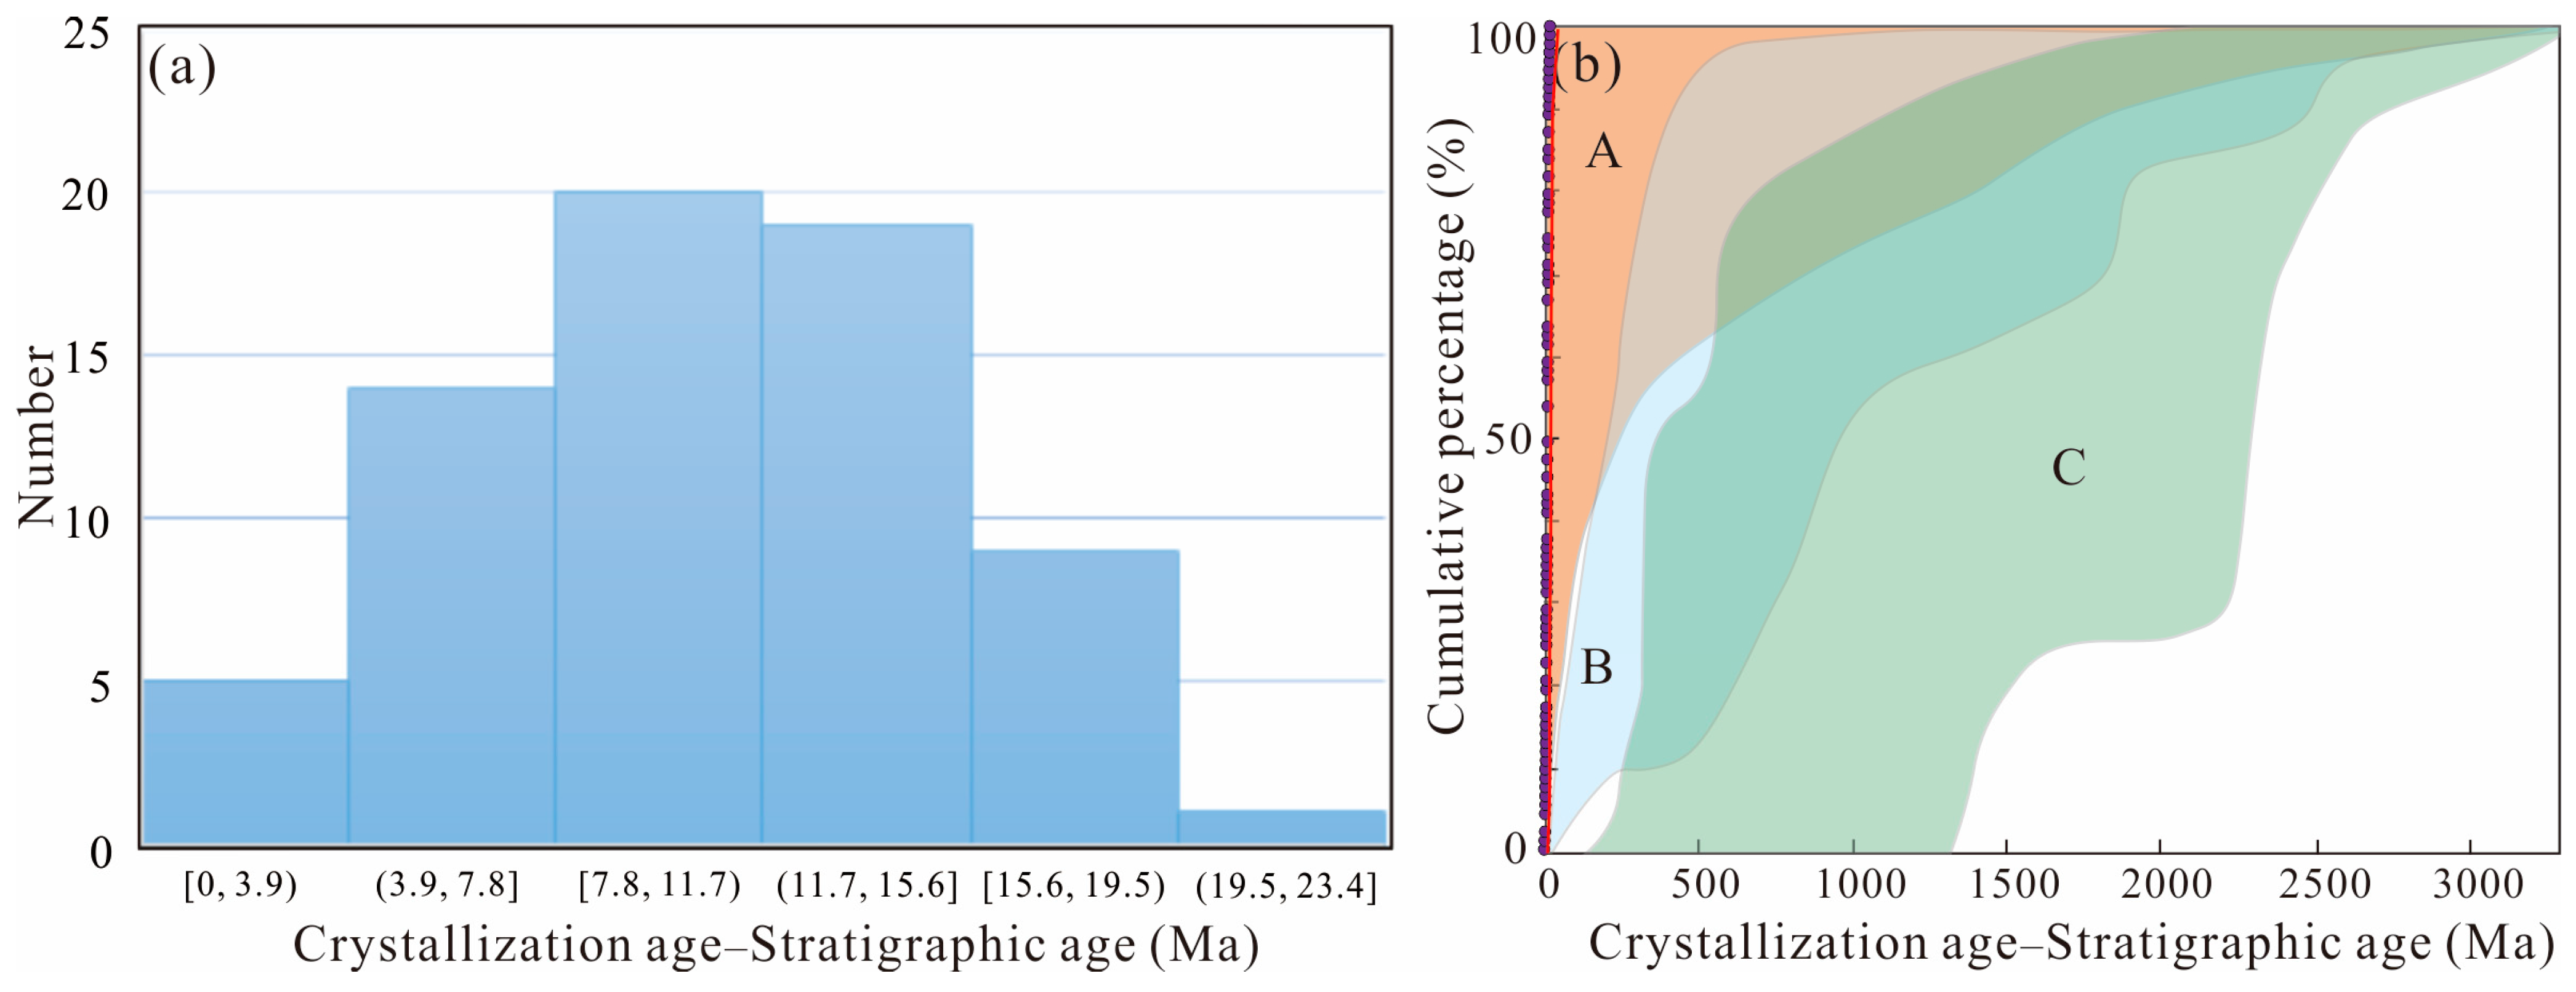
The conglomeratic sandstone samples from the Dajianggang Formation were subjected to statistical analysis of their ages, and a frequency distribution histogram of crystallization age–stratigraphic age was constructed in order to visualize the zircon age data (Figure 11a). The results show that the zircon ages are highly concentrated within a narrow range of 220–250 Ma, indicating a uniform provenance. The youngest single grain age of 226.8 ± 5 Ma in 88 concordant zircons is interpreted as the maximum depositional age of the strata. The cumulative probability graph demonstrates a steep line almost perpendicular to the horizontal line, indicating a sharp increase in the sedimentation rate during the period of zircon crystallization. Based on the empirical curve proposed by Cawood, Hawkesworth [56] for the relationship between detrital zircon ages and tectonic settings, and the cumulative probability distribution diagram of the difference between zircon crystallization age and the maximum deposition age (Figure 11b), it can be inferred that the zircon ages in the conglomeratic sandstone samples are closely linked to the maximum depositional age (227 Ma) and indicative of a convergent tectonic setting.

7. Analysis of Apatite Fission Track Results

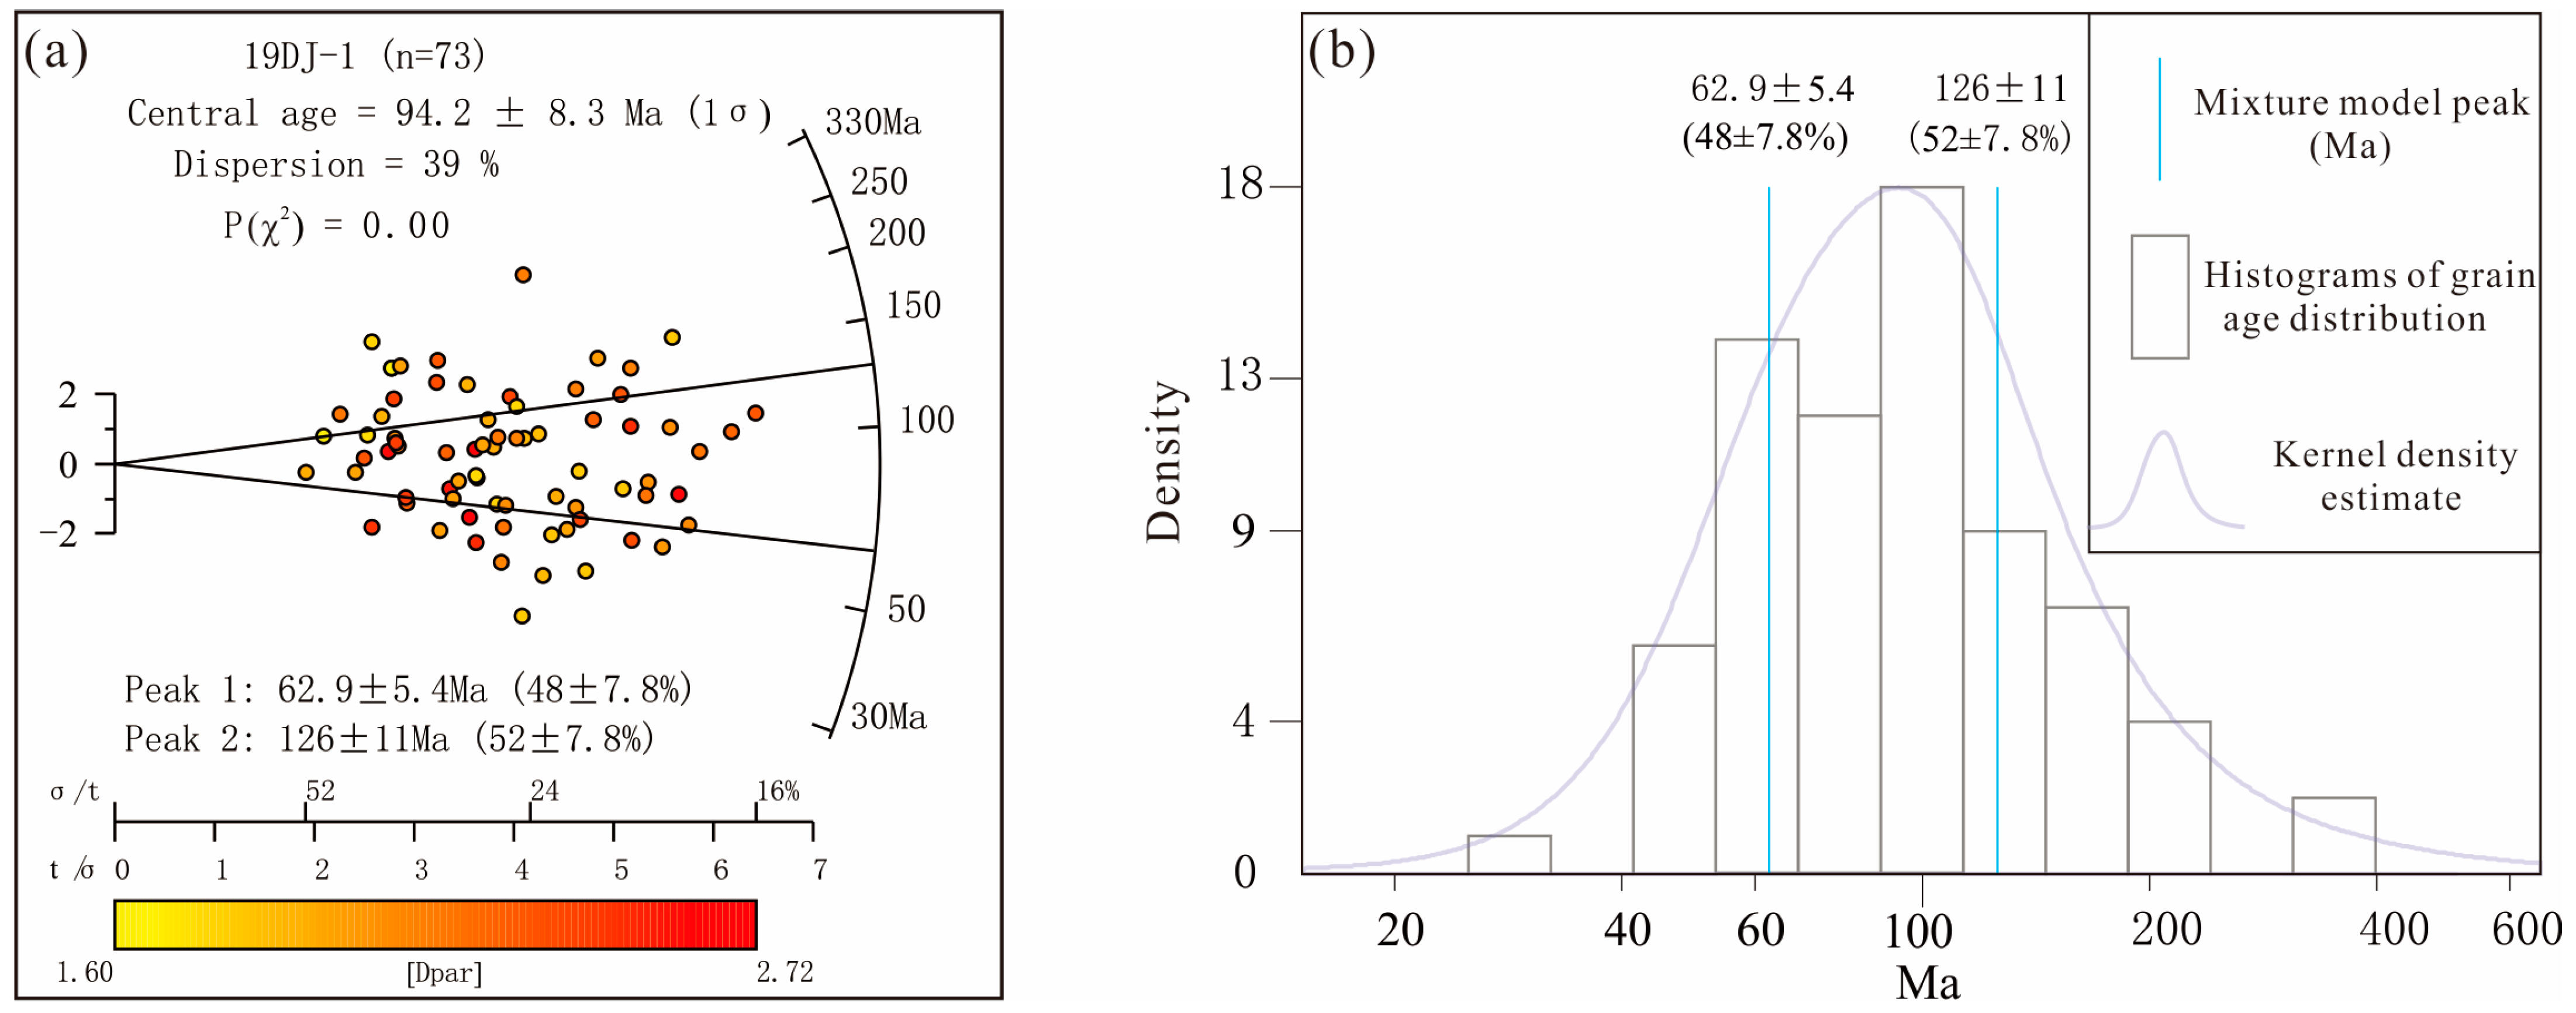
This study employed apatite fission track analysis in order to investigate the thermal history of sandstone sample 19DJ-1 from the Late Triassic Dajianggang Formation. A total of 73 apatite grains were analyzed, and the results are presented in Table 5. In order to further interpret the data, the results were processed using RadialPlotter [57], which produced a radar radiogram and age histogram with which to visualize the age components of the apatite grains in the sample. The results are presented in Figure 12.
The sample did not pass the Chi-square test, as P(χ2) < 5%, indicating that the age of sample particles was dispersed. This may be attributed to several factors, including changes in the chemical composition of apatite grains in a single sample [37,58], and difficulties in accurately identifying fission tracks and lengths due to a large number of fission tracks being shortened by the annealing process [34,59,60].
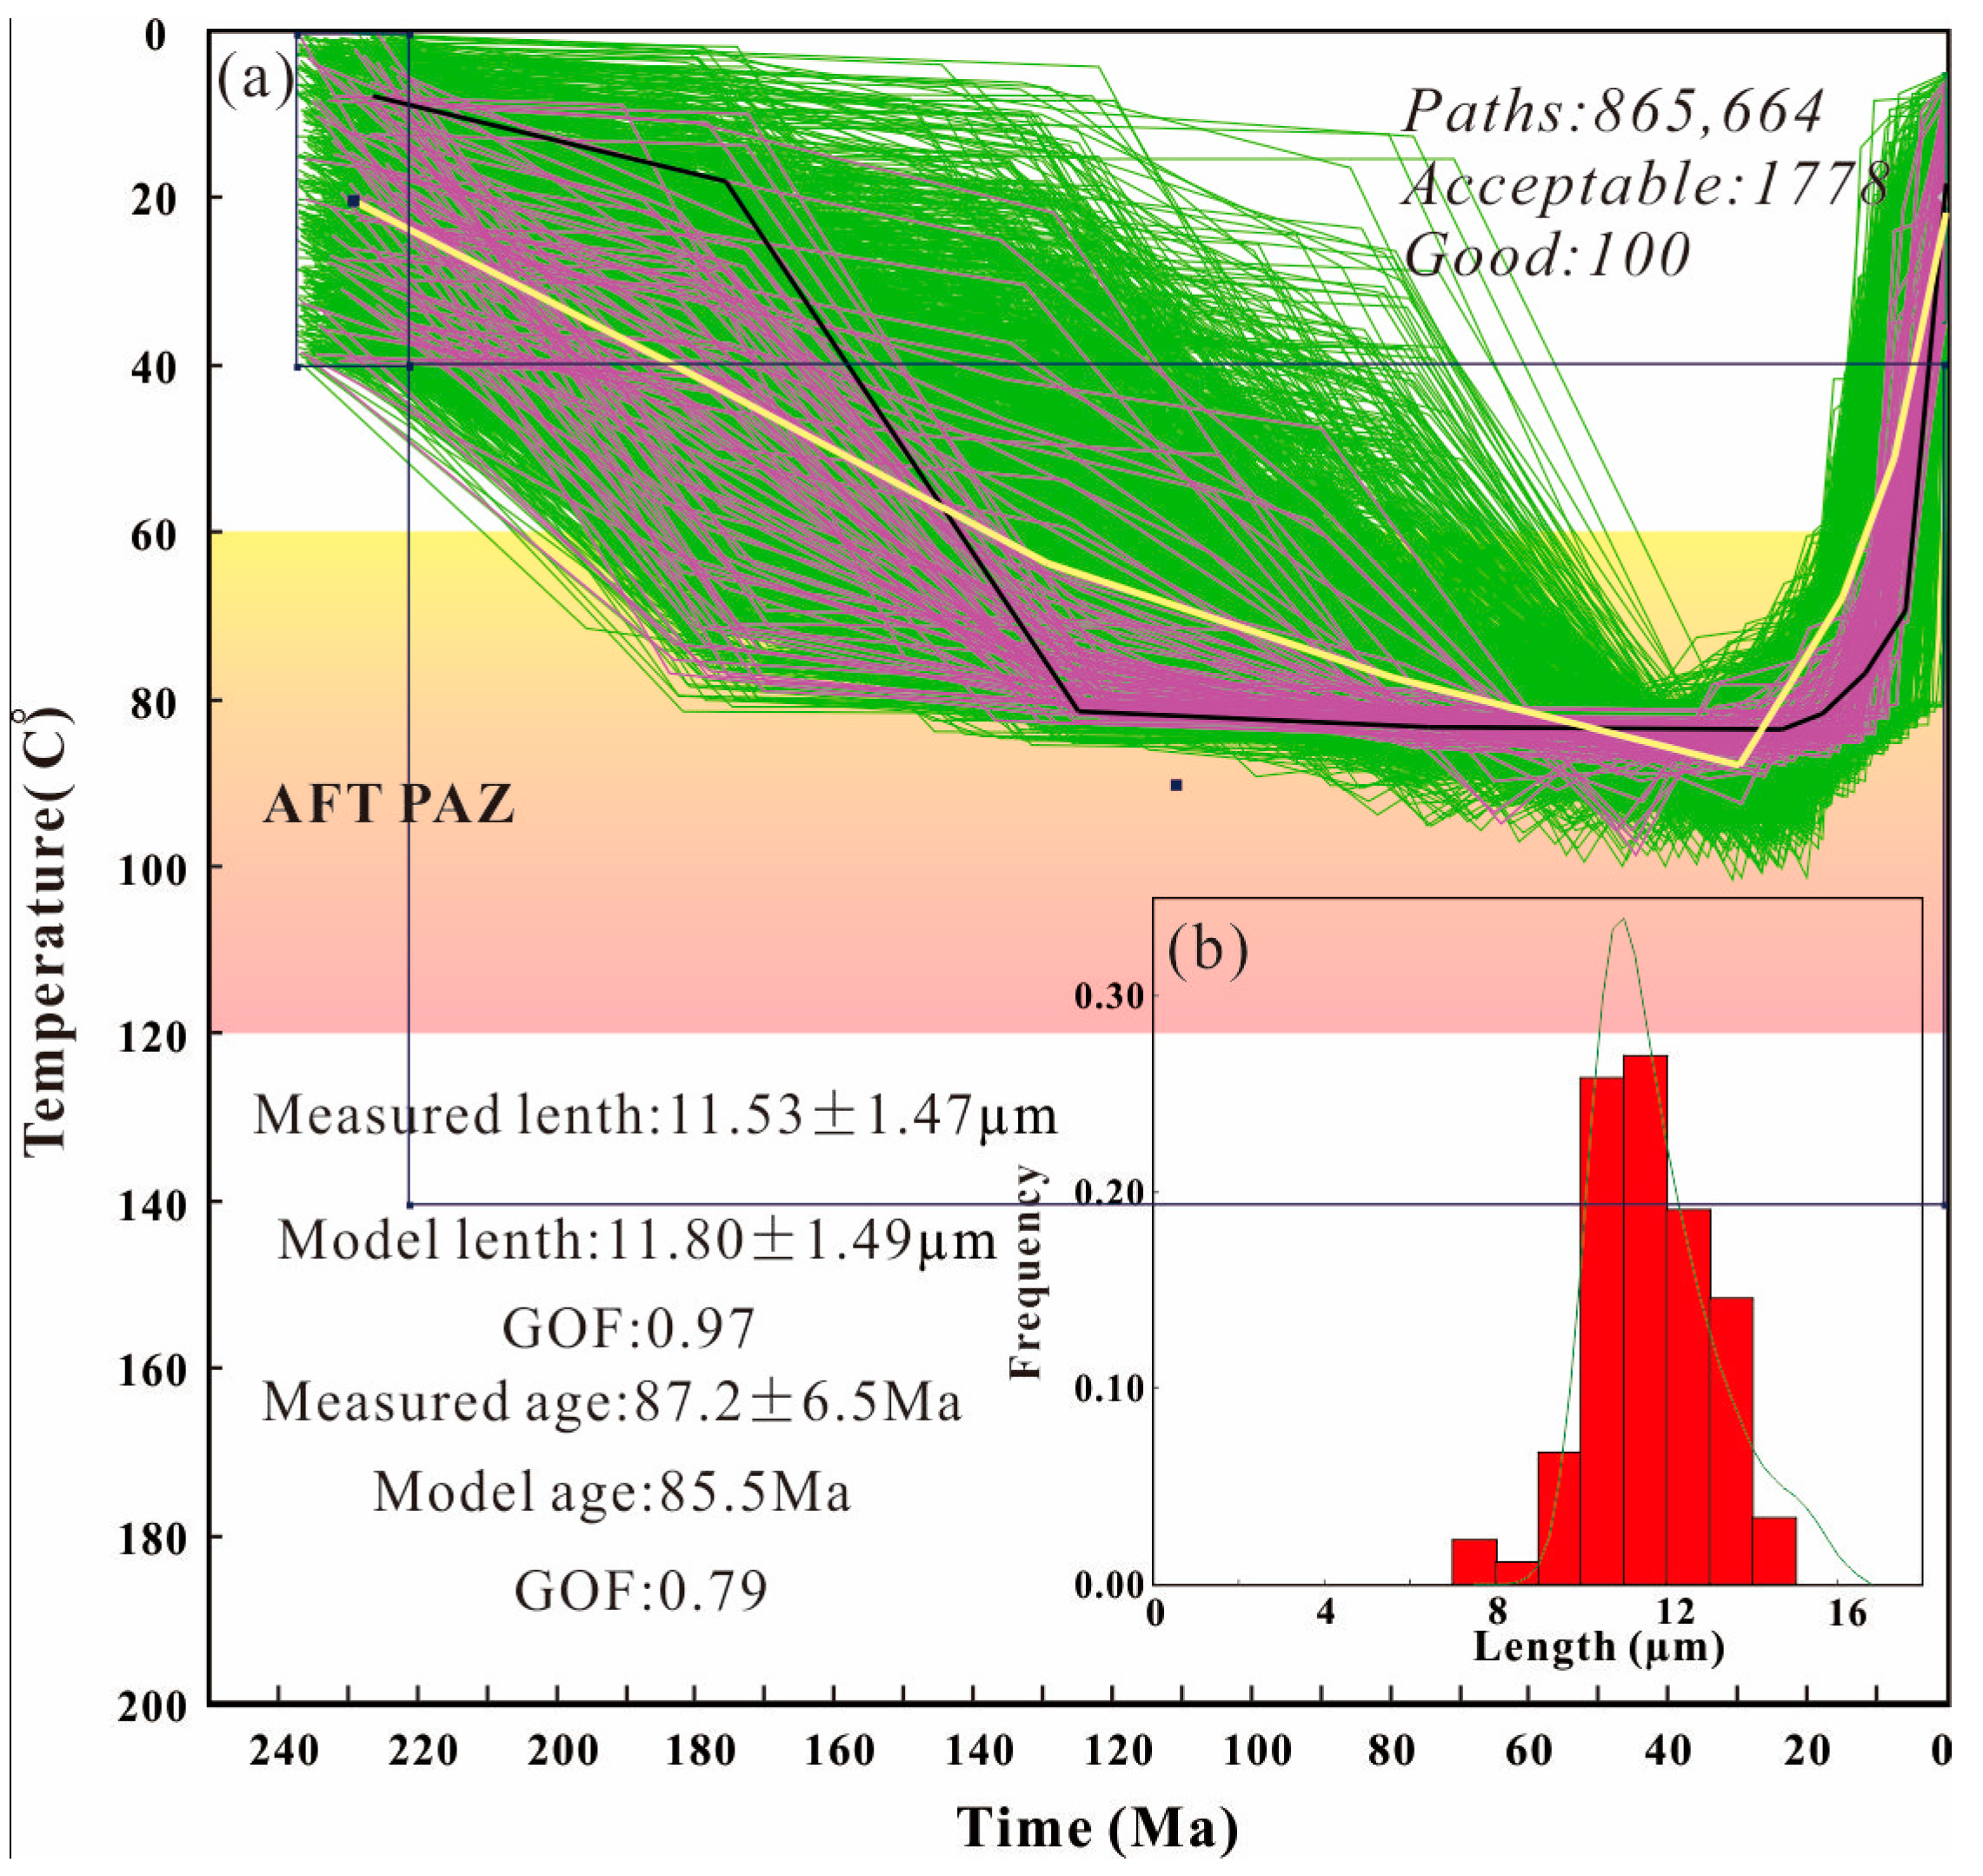
Using the age of apatite grains and the length of confined fission track obtained in this study, we carried out thermal history inversion modelling in order to infer the time–temperature evolution history of the sample [61,62]. We used HeFTy v1.9.1 thermal history simulation software in order to conduct thermal history inversion modelling [42,61,63], considering apatite fission track data such as grain age, confined fission track length, Dpar value, and C-axis Angle. The modelling results are shown in Figure 13 using two criteria, including (1) the first box constrained the deposition time of the strata, indicating that the surface temperature of the strata was 0–40 °C during the diagenesis; (2) the second box is the search box that allows the model to search for potential paths of the sample when it was deposited to the present time between the temperatures of 40 and 140 °C. We set the model to continuously run until it generated 100 good paths. The thermal history for the sample indicates the subsequent to deposition between ~230 and 30 Ma. After deposition, the sample showed rapid continuous cooling of 0.67–7.29 °C/Ma since 30 Ma.

8. Discussion

8.1. Provenance and Tectonic Setting Reflected by Clastic Components of Sandstone

The petrographic analysis of sandstone from the Dajianggang Formation in the study area reveals that it predominantly consists of feldspar lithic sandstone with low structural and compositional maturity. This indicates intense tectonic activity in the provenance area, where detrital material was rapidly eroded and deposited after being transported for a short distance. The Dickinson diagram analysis of the sandstone detrital components suggests that the primary provenance of the Dajianggang Formation sandstone in the Shuangyang area is an island arc orogenic belt. It is possible that the clastic material from the volcanic island arc mixed with the subduction complex material in the forearc basin, resulting in some sandstone samples showing the characteristics of recycled orogenic and subduction complex belts.

8.2. Provenance and Tectonic Setting Reflected by Geochemical Characteristics of Sandstone

Based on a comprehensive analysis of the geochemical characteristics of the sandstone samples, it has been determined that the tectonic setting and provenance of the Dajianggang Formation in the Shuangyang area is predominantly from a continental island arc environment, with a provenance type of feldspar island arc. In some samples, the structural diagram of La/Sc-Ti/Zr suggests an active continental margin provenance, indicating that materials from the active continental margin may have been mixed in the provenance. Along with receiving materials from the Late Triassic Changchun–Yanji suture zone island arc, the Dajianggang Formation in the Shuangyang area may also have received materials from the northern margin of the North China Craton or exhumed recycled orogenic belt, suggesting a complex provenance history for the formation.

8.3. Provenance and Tectonic Setting Reflected by LA-ICP-MS Analysis of Detrital Zircons from Sandstone

LA-ICP-MS analysis of detrital zircons from sandstone samples of the Dajianggang Formation in the study area provides valuable information about the age and origin of the formation. The peak 206Pb/238U age range of 226.8–246.5 Ma and the weighted average 206Pb/238U age of 237.4 ± 1.1 Ma suggest that the formation of the Dajianggang Formation occurred later than 226.8 ± 5 Ma, corresponding to the Carnian in the early Late Triassic period, based on the revised International Geological time scale of 2023. The high Th/U values of all detrital zircons (>0.3) indicate that most of the zircons are magmatic in origin, which is supported by the characteristics of the CL image. This suggests that the provenance area experienced magmatic events that resulted in the crystallization of zircons. These findings provide significant insights into the geological history of the study area and contribute to our understanding of Late Triassic sedimentation and tectonic evolution in this region.
Through statistical analysis of the age distribution of conglomeratic sandstone samples from the Dajianggang Formation, it is evident that the detrital zircon ages are predominantly clustered within a narrow range of 200–300 Ma. This high degree of concentration is further supported by the steep slope of the cumulative probability curve, which suggests a relatively uniform and consistent provenance for the sedimentary material. The nearly vertical trend of the curve near the age of the sedimentary strata indicates that the tectonic setting of the provenance area was likely convergent in nature.
Wang, Zhou [64] identified a zircon with an age of 2516 ± 18 Ma from the 238 zircons they dated from the Dajianggang Formation, indicating that the North China Craton was also a source of detrital materials. Consistent with previous studies, the Changchun–Yanji suture zone in central Jilin was believed to be the main source of the Dajianggang Formation, which is a subduction complex [7,16,23,65], while the Changchun–Yanji suture belt is not only an eastward extension of the Soloker–Xilamulon–Changchun suture belt [1,2,66,67,68,69] towards the east, but also the southern margin of the Jihei high pressure belt, which formed via the subduction of the Jiamusi–Xingkai Block to the northern margin of the North China Craton during the Late Triassic and Early Jurassic periods [16,65]. Based on the LA-ICP-MS results of detrital zircons from sandstone samples, it can be concluded that the provenance of the Dajianggang Formation may be mainly from the Late Triassic magmatic arc of the Changchun–Yanji suture zone, with possible contributions from the northern margin of the North China Craton, indicating a convergent tectonic setting during that time. Combining the previous report in the vicinity of the study area, the Paleo-Asian Ocean finished its closure before the Late Triassic period [70,71].

8.4. Tectonic Setting and Evolution History Reflected by Apatite Fission Track Results in Sandstone

The detritus apatite fission track (AFT) age analysis of sample 19DJ-1 shows a relatively dispersed age distribution, as indicated by a low P (χ2) value of less than 5%. The central age of the detrital AFT in sample 19DJ-1 is 94.2 ± 8.3 Ma (Figure 12), which is younger than the corresponding stratigraphic age. The thermal evolution history of sample 19DJ-1 indicates that the early thermal events (240–30 Ma) may have been caused by burial, while the rapid cooling in the late stage reflects regional exhumation events (since 30 Ma). This indicates that the orogenic process of the Central Asian Orogenic Belt had ceased, and the study area had not been uplifted since the Late Triassic period. The rapid uplift of 30 Ma may correspond to the temporary squeezing of the northeast Asian continental margin and a series of inversion structures in basins caused by the subduction of the Pacific plate during the Middle Himalayan movement, reflecting a regional uplift event [72,73,74]. These findings suggest that the study area has experienced complex tectonic activities, including burial, subduction, and uplift events, and their effects on the region have been felt at different times throughout geological history [73,74].

9. Conclusions

(1)
The Dajianggang Formation sandstone in the Shuangyang area is mainly feldspar lithic sandstone, and the lithic type is mainly volcanic lithic. Petrographic studies suggest that the clastic grains are angular, indicating near-source sedimentary characteristics. Dickinson diagram analysis reveals that the sandstone’s main provenance is from island arcs, with some samples showing mixed characteristics from recycled orogenic belts and subduction complex belts.
(2)
The geochemical analysis of sandstone samples from the Shuangyang area suggests a continental island arc environment, with felsic rocks dominating the provenance, mixed with active continental margin materials.
(3)
The U-Pb chronology of detrital zircon LA-ICP-MS shows that the Dajianggang Formation has a maximum depositional age of 226.8 ± 5 Ma, indicating that it formed in the Carnian of the middle Late Triassic period, at the earliest. The distribution of zircon ages suggests that the main source of the Dajianggang Formation was the Late Triassic magmatic arc of the Changchun–Yanji suture zone, possibly mixed with materials from the northern margin of the North China Craton, in a convergent tectonic setting.
(4)
The apatite fission track analysis reveals that the Dajianggang Formation underwent a thermal history that started around 240 Ma and experienced rapid exhumation to the surface since 30 Ma. This implies that the orogenic process in the study area ceased during the Late Triassic period, and the remote effect of Pacific subduction did not impact the study area until 30 Ma.

Supplementary Materials

The following supporting information can be downloaded at: https://www.mdpi.com/article/10.3390/min13070975/s1. Figure S1: The strata column section of Dajianggang Formation in Dajianggang area.

Author Contributions

Conceptualization, S.L.; methodology, S.L.; software, S.T. and H.W.; validation, X.Z. (Xinmei Zhang) and D.Z.; formal analysis, S.L. and H.W.; investigation, L.N. and X.Z. (Xiaodong Zhou); resources, S.L.; data curation, S.T., X.Z. (Xinmei Zhang), D.Z. and M.L.; writing—original draft preparation, S.T.; writing—review and editing, S.L.; visualization, S.T.; supervision, S.L.; project administration, S.T.; funding acquisition, S.L. All authors have read and agreed to the published version of the manuscript.

Funding

This research was funded by the National Natural Science Foundation of China (Grant No. 41872234). And the APC was funded by S.L.

Data Availability Statement

Not applicable.

Acknowledgments

We thank L.Y. Zhang and Z.R. Zhao for their assistance in the fieldwork and processing of U-Pb data, and H.T. Zhang for her technical support with the software. We also thank three reviewers for detailed reviews, as well as the editor.

Conflicts of Interest

The authors declare no conflict of interest.

References

  1. Şengör, A.M.C.; Natal’in, B.A. Paleotectonics of Asia: Fragments of a synthesis. Tecton. Evol. Asia 1996, 1, 486–640. [Google Scholar]
  2. Li, J.-Y. Permian geodynamic setting of Northeast China and adjacent regions: Closure of the Paleo-Asian Ocean and subduction of the Paleo-Pacific Plate. J. Asian Earth Sci. 2006, 26, 207–224. [Google Scholar] [CrossRef]
  3. Eizenhöfer, P.R.; Zhao, G.; Zhang, J.; Sun, M. Final closure of the Paleo-Asian Ocean along the Solonker Suture Zone: Constraints from geochronological and geochemical data of Permian volcanic and sedimentary rocks. Tectonics 2014, 33, 441–463. [Google Scholar] [CrossRef] [Green Version]
  4. Li, S.; Zhang, L.; Liu, Z.; Xu, Z. New Discovery of the Late Triassic Terrigenous Sediments in the Great Xing’an Range Region, NE China and its Geological Significance. Acta Geol. Sin. 2017, 91, 1928–1929. [Google Scholar] [CrossRef]
  5. Wilde, S.A. Final amalgamation of the Central Asian Orogenic Belt in NE China: Paleo-Asian Ocean closure versus Paleo-Pacific plate subduction—A review of the evidence. Tectonophysics 2015, 662, 345–362. [Google Scholar] [CrossRef]
  6. Zhou, J.-B.; Wilde, S.A.; Zhao, G.-C.; Han, J. Nature and assembly of microcontinental blocks within the Paleo-Asian Ocean. Earth-Sci. Rev. 2018, 186, 76–93. [Google Scholar] [CrossRef]
  7. Wu, F.Y.; Sun, D.Y.; Ge, W.C.; Zhang, Y.B.; Grant, M.L.; Wilde, S.A.; Jahn, B.M. Geochronology of the Phanerozoic granitoids in northeastern China. J. Asian Earth Sci. 2011, 41, 1–30. [Google Scholar] [CrossRef] [Green Version]
  8. Donskaya, T.; Gladkochub, D.; Mazukabzov, A.; Ivanov, A. Late Paleozoic—Mesozoic subduction-related magmatism at the southern margin of the Siberian continent and the 150 million-year history of the Mongol-Okhotsk Ocean. J. Asian Earth Sci. 2012, 62, 79–97. [Google Scholar] [CrossRef]
  9. Xu, W.-L.; Pei, F.-P.; Wang, F.; Meng, E.; Ji, W.-Q.; Yang, D.-B.; Wang, W. Spatial–temporal relationships of Mesozoic volcanic rocks in NE China: Constraints on tectonic overprinting and trans-formations between multiple tectonic regimes. J. Asian Earth Sci. 2013, 74, 167–193. [Google Scholar] [CrossRef]
  10. Safonova, I.; Santosh, M. Accretionary complexes in the Asia-Pacific region: Tracing archives of ocean plate stratigraphy and tracking mantle plumes. Gondwana Res. 2012, 25, 126–158. [Google Scholar] [CrossRef]
  11. Tang, J.; Xu, W.-L.; Wang, F.; Zhao, S.; Wang, W. Early Mesozoic southward subduction history of the Mongol–Okhotsk oceanic plate: Evidence from geochronology and geochemistry of Early Mesozoic intrusive rocks in the Erguna Massif, NE China. Gondwana Res. 2016, 31, 218–240. [Google Scholar] [CrossRef]
  12. Chen, Y.-J.; Zhang, C.; Wang, P.; Pirajno, F.; Li, N. The Mo deposits of Northeast China: A powerful indicator of tectonic settings and associated evolutionary trends. Ore Geol. Rev. 2017, 81, 602–640. [Google Scholar] [CrossRef]
  13. Liu, Y.; Li, W.; Feng, Z.; Wen, Q.; Neubauer, F.; Liang, C. A review of the Paleozoic tectonics in the eastern part of Central Asian Orogenic Belt. Gondwana Res. 2017, 43, 123–148. [Google Scholar] [CrossRef]
  14. Zhang, L.; Li, S.; Chu, X.; Shang, Y. Early Cretaceous Adakitic Rocks in the Northern Great Xing’an Range, NE China: Implications for the Final Closure of Mongol-Okhotsk Ocean and Regional Extensional Setting. Acta Geol. Sin. 2019, 93, 1544–1558. [Google Scholar] [CrossRef]
  15. Wu, F.-Y.; Yang, J.-H.; Lo, C.-H.; Wilde, S.A.; Sun, D.-Y.; Jahn, B.-M. The Heilongjiang Group: A Jurassic accretionary complex in the Jiamusi Massif at the western Pacific margin of north-eastern China. Isl. Arc 2007, 16, 156–172. [Google Scholar] [CrossRef]
  16. Zhou, J.-B.; Wilde, S.A. The crustal accretion history and tectonic evolution of the NE China segment of the Central Asian Orogenic Belt. Gondwana Res. 2013, 23, 1365–1377. [Google Scholar] [CrossRef]
  17. Yang, H.; Ge, W.; Zhao, G.; Yu, J.; Zhang, Y. Early Permian–Late Triassic granitic magmatism in the Jiamusi–Khanka Massif, eastern segment of the Central Asian Orogenic Belt and its implications. Gondwana Res. 2015, 27, 1509–1533. [Google Scholar] [CrossRef]
  18. Zhang, X.Z.; Guo, Y.; Zhou, J.B.; Zeng, Z.; Bin Pu, J.; Fu, Q.L. Late Paleozoic-Early Mesozoic tectonic evolution in the east margin of the Jiamusi massif, eastern northeastern China. Russ. J. Pac. Geol. 2015, 9, 103908. [Google Scholar] [CrossRef]
  19. Tang, J.; Xu, W.; Wang, F.; Ge, W. Subduction history of the Paleo-Pacific slab beneath Eurasian continent: Mesozoic-Paleogene magmatic records in North-east Asia. Sci. China Earth Sci. 2018, 61, 527–559. [Google Scholar] [CrossRef]
  20. RGSB; Wang, Z.Z. Discovery and Geological Significance of Late Triassic Dajianggang Formation in Shuangyang area, Jilin Province. Jilin Geol. 1979, 3, 22–27. [Google Scholar]
  21. JBGMR. Stratigraphy (Lithostatic) of Jilin Province; China University of Geosciences Press: Wuhan, China, 1997. [Google Scholar]
  22. Sun, G.; Zhao, Y.H.; Li, C.T. Late Triassic plants from Dajianggang of Shuangyang County, Jilin Province. Acta Palaeontol. Sin. 1983, 22, 447–459. [Google Scholar]
  23. Wu, F.-Y.; Zhao, G.-C.; Sun, D.-Y.; Wilde, S.A.; Yang, J.-H. The Hulan Group: Its role in the evolution of the Central Asian Orogenic Belt of NE China. J. Asian Earth Sci. 2007, 30, 542–556. [Google Scholar] [CrossRef]
  24. Xin, Y.L.; Ren, J.L.; Peng, Y.J.; Sun, X.Q. Ending of the mountain-building movement of Xing’an-Mongolian-Ji-Hei orogenic belt in northeast China: Evidence from Late Triassic molasse (geotectonic phase). Geol. Resour. 2011, 20, 413–419. [Google Scholar]
  25. Li, D.J.; Zhao, Y.H.; Li, C.T. The finding of Late Triassic plant fossils and its significance in prospecting of Bamianshi in Shuanguang county, Jilin province. Jilin Geol. 1985, 2, 43–46. [Google Scholar]
  26. Eggins, S.M.; Kinsley, L.P.J.; Shelley, J.M.M. Deposition elemental fractionation processes during atmospheric pressure laser sam-pling for analysis by ICP–MS. Appl. Surf. Sci. 1998, 127–129, 278–286. [Google Scholar] [CrossRef]
  27. Jackson, S.E.; Pearson, N.J.; Griffin, W.L.; Belousova, E.A. The application of laser ablation–inductively coupled plasma–mass spectrometry to in situ U–Pb zircon geochronology. Chem. Geol. 2004, 211, 47–69. [Google Scholar] [CrossRef]
  28. Yuan, H.; Gao, S.; Liu, X.; Li, H.; Günther, D.; Wu, F. Accurate U-Pb Age and Trace Element Determinations of Zircon by Laser Ablation-Inductively Coupled Plasma-Mass Spectrometry. Geostand. Geoanalytical Res. 2004, 28, 353–370. [Google Scholar] [CrossRef]
  29. Vermeesch, P. IsoplotR: A free and open toolbox for geochronology. Geosci. Front. 2018, 9, 1479–1493. [Google Scholar] [CrossRef]
  30. Sláma, J.; Košler, J.; Condon, D.J.; Crowley, J.L.; Gerdes, A.; Hanchar, J.M.; Horstwood, M.S.A.; Morris, G.A.; Nasdala, L.; Norberg, N.; et al. Plešovice zircon—A new natural reference material for U–Pb and Hf isotopic microanalysis. Chem. Geol. 2008, 249, 1–35. [Google Scholar] [CrossRef]
  31. Gleadow, A.J.; Belton, D.X.; Kohn, B.P.; Brown, R.W. Fission Track Dating of Phosphate Minerals and the Thermochronology of Apatite. Rev. Miner. Geochem. 2002, 48, 579–630. [Google Scholar] [CrossRef]
  32. Green, P.; Duddy, I.; Gleadow, A.; Tingate, P.; Laslett, G. Thermal annealing of fission tracks in apatite: 1. A qualitative description. Chem. Geol. Isot. Geosci. Sect. 1986, 59, 237–253. [Google Scholar] [CrossRef]
  33. Hurford, A.J. Cooling and uplift patterns in the Lepontine Alps South Central Switzerland and an age of vertical movement on the In-subric fault line. Contrib. Mineral. Petrol. 1986, 92, 413–427. [Google Scholar] [CrossRef]
  34. Gleadow, A.J.W.; Duddy, I.R.; Green, P.F.; Lovering, J.F. Confined fission track lengths in apatite: A diagnostic tool for thermal history analysis. Contrib. Miner. Pet. 1986, 94, 405–415. [Google Scholar] [CrossRef]
  35. Zhou, Z.Y. Low Temperature Thermochronology: Principles & Applications; Science Press: Beijing, China, 2014. [Google Scholar]
  36. Hurford, A.J.; Green, P.F. The zeta age calibration of fission-track dating. Chem. Geol. 1983, 41, 285–317. [Google Scholar] [CrossRef]
  37. Galbraith, R.; Laslett, G. Statistical models for mixed fission track ages. Nucl. Tracks Radiat. Meas. 1993, 21, 459–470. [Google Scholar] [CrossRef]
  38. Carlson, W.D.; Donelick, R.A.; Ketcham, R. Variability of apatite fission-track annealing kinetics; I, Experimental results. Am. Miner. 1999, 84, 1213–1223. [Google Scholar] [CrossRef]
  39. Crowley, K.; Cameron, M.; Schaefer, R. Experimental studies of annealing of etched fission tracks in fluorapatite. Geochim. Cosmochim. Acta 1991, 55, 1449–1465. [Google Scholar] [CrossRef]
  40. Donelick, R.A.; Ketcham, R.; Carlson, W.D. Variability of apatite fission-track annealing kinetics; II, Crystallographic orientation effects. Am. Miner. 1999, 84, 1224–1234. [Google Scholar] [CrossRef]
  41. Duddy, I.; Green, P.; Laslett, G. Thermal annealing of fission tracks in apatite 3. Variable temperature behaviour. Chem. Geol. Isot. Geosci. Sect. 1988, 73, 25–38. [Google Scholar] [CrossRef]
  42. Stewart, R.J.; Brandon, M.T. Detrital-zircon fission-track ages for the “Hoh Formation”: Implications for late Cenozoic evolution of the Cascadia subduction wedge. GSA Bull. 2004, 116, 60–75. [Google Scholar] [CrossRef] [Green Version]
  43. Dickinson, W.R.; Suczek, C.A. Plate Tectonics and Sandstone Compositions. AAPG Bull. 1979, 63, 2164–2182. [Google Scholar]
  44. Dickinson, W.R.; Sue beard, L.; Brakenridge, G.R.; Erjavec, J.L.; Ferguson, R.C.; Inman, K.F.; Knepp, R.A.; Lindberg, F.A.; Ryberg, P.T. Provenance of North American Phanerozoic sandstones in relation to tectonic setting. Geol. Soc. Am. Bull. 1983, 94, 222. [Google Scholar] [CrossRef]
  45. Nesbitt, H.W.; Young, G.M. Early Proterozoic climates and plate motions inferred from major element chemistry of lutites. Nature 1982, 299, 715–717. [Google Scholar] [CrossRef]
  46. Fedo, C.M.; Nesbitt, H.W.; Young, G.M. Unravelling the effects of potassium metasomatism in sedimentary rocks and paleosols, with implications for paleoweathering conditions and provenance. Geology 1995, 23, 921–924. [Google Scholar] [CrossRef]
  47. Harnois, L. The CIW index: A new chemical index of weathering. Sediment. Geol. 1988, 55, 319–322. [Google Scholar] [CrossRef]
  48. Cox, R.; Lowe, D.R.; Cullers, R. The influence of sediment recycling and basement composition on evolution of mudrock chemistry in the southwestern United States. Geochim. Cosmochim. Acta 1995, 59, 2919–2940. [Google Scholar] [CrossRef]
  49. Roser, B.P.; Korsch, R.J. Determination of Tectonic Setting of Sandstone-Mudstone Suites Using SiO2 Content and K2O/Na2O Ratio. J. Geol. 1986, 94, 635–650. [Google Scholar] [CrossRef]
  50. Floyd, P.A.; Leveridge, B.E. Tectonic environment of the Devonian Gramscatho basin, south Cornwall: Framework mode and geo-chemical evidence from turbiditic sandstones. J. Geol. Soc. 1987, 144, 531–542. [Google Scholar] [CrossRef]
  51. Taylor, S.R.; Mclennan, S.M. The continental crust: Its composition and evolution. The Journal of Geology. 1985, 57–72. [Google Scholar]
  52. Mclennan, S.M. Rare earth elements in sedimentary rocks: Influence of provenance and sedimentary processes. Mineral. Geochem. 1989, 21, 169–200. [Google Scholar]
  53. Floyd, P.A.; Winchester, J.A.; Park, R.G. Geochemistry and tectonic setting of Lewisian clastic metasediments from the Early Proterozoic Loch Maree Group of Gairloch, NW Scotland. Precambrian Res. 1989, 45, 203–214. [Google Scholar] [CrossRef]
  54. Bhatia, M.R.; Crook, K.A.W. Trace element characteristics of graywackes and tectonic setting discrimination of sedimentary basins. Contrib. Miner. Pet. 1986, 92, 181–193. [Google Scholar] [CrossRef]
  55. Koschek, G. Origin and significance of the SEM cathodoluminescence from zircon. J. Microsc. 1993, 171, 223–232. [Google Scholar] [CrossRef]
  56. Cawood, P.; Hawkesworth, C.; Dhuime, B. Detrital zircon record and tectonic setting. Geology 2012, 40, 875–878. [Google Scholar] [CrossRef] [Green Version]
  57. Vermeesch, P. RadialPlotter: A Java application for fission track, luminescence and other radial plots. Radiat. Meas. 2009, 44, 409–410. [Google Scholar] [CrossRef]
  58. O’Sullivan, P.B.; Parrish, R.R. The importance of apatite composition and single-grain ages when interpreting fission track data from plutonic rocks: A case study from the Coast Ranges, British Columbia. Earth Planet. Sci. Lett. 1995, 132, 213–224. [Google Scholar] [CrossRef]
  59. Green, P.F. The relationship between track shortening and fission track age reduction in apatite: Combined influences of inherent instability, annealing anisotropy, length bias and system calibration. Earth Planet. Sci. Lett. 1988, 89, 335–352. [Google Scholar] [CrossRef]
  60. Lin, X.; Chen, H.; Wyrwoll, K.-H.; Batt, G.E.; Liao, L.; Xiao, J. The Uplift History of the Haiyuan-Liupan Shan Region Northeast of the Present Tibetan Plateau: Integrated Constraint from Stratigraphy and Thermochronology. J. Geol. 2011, 119, 372–393. [Google Scholar] [CrossRef]
  61. Ketcham, R.A. Forward and Inverse Modeling of Low-Temperature Thermochronometry Data. Rev. Miner. Geochem. 2005, 58, 275–314. [Google Scholar] [CrossRef]
  62. Gallagher, K. Transdimensional inverse thermal history modeling for quantitative thermochronology. J. Geophys. Res. Solid Earth 2012, 117, B02408. [Google Scholar] [CrossRef] [Green Version]
  63. Ketcham, R.A.; Donelick, R.A.; Balestrieri, M.L.; Zattin, M. Reproducibility of apatite fission-track length data and thermal history reconstruction. Earth Planet. Sci. Lett. 2009, 284, 504–515. [Google Scholar] [CrossRef]
  64. Wang, B.; Zhou, J.-B.; Wilde, S.A.; Zhang, X.-Z.; Ren, S.-M. The timing of final closure along the Changchun–Yanji suture zone: Constraints from detrital zircon U–Pb dating of the Triassic Dajianggang Formation, NE China. Lithos 2016, 261, 216–231. [Google Scholar] [CrossRef]
  65. Zhou, J.B.; Han, J.; Wilde, S.; Guo, X.; Zeng, W.; Cao, J. A primary study of the Jilin-Heilongjiang high-pressure metamorphic belt: Evidence and tectonic implications. Acta Petrol. Sin. 2013, 29, 386–398. [Google Scholar]
  66. Shao, J.A. Crustal Evolution in the Middle Part of the Northern Margin of Sino–Korean Plate; Beijing University Publication House: Beijing, China, 1991; p. 136. [Google Scholar]
  67. Tang, K.D. Tectonic development of Paleozoic foldbelts at the north margin of the Sino-Korean Craton. Tectonics 1990, 9, 249–260. [Google Scholar] [CrossRef] [Green Version]
  68. Xiao, W.; Windley, B.F.; Hao, J.; Zhai, M. Accretion leading to collision and the Permian Solonker suture, Inner Mongolia, China: Termination of the central Asian orogenic belt. Tectonics 2003, 22, 1069. [Google Scholar] [CrossRef] [Green Version]
  69. Xu, G.Y. Some basic geological problems of Jilin Province. Reg. Geol. China 1995, 1, 6–14. [Google Scholar]
  70. Han, Z.; Li, J.; Zhu, C.; Zhong, W.; Song, Z. The Late Triassic Molasse Deposits in Central Jilin Province, NE China: Constraints on the Paleo-Asian Ocean Closure. Minerals 2021, 11, 223. [Google Scholar] [CrossRef]
  71. Yang, X.; Li, S.; Luo, W.; Wang, X.; Wang, H.; Wei, H. Final closure of the Paleo-Asian Ocean and initiation of the Paleo-Pacific subduction: Geophysical evidence from the Nadanhada Terrane. Tectonophysics 2023, 859, 229915. [Google Scholar] [CrossRef]
  72. Yu, F.; Koyi, H. Cenozoic tectonic model of the Bohai Bay Basin in China. Geol. Mag. 2016, 153, 866–886. [Google Scholar] [CrossRef] [Green Version]
  73. Li, S.Z.; Suo, Y.; Li, X.; Wang, Y.; Cao, X.; Wang, P.; Guo, L.; Yu, S.; Lan, H.; Li, S.; et al. Mesozoic plate subduction in West Pacific and tectono-magmatic response in the East Asian ocean-continent connection zone. Chin. Sci. Bull. 2018, 63, 1550–1593. [Google Scholar] [CrossRef] [Green Version]
  74. Suo, Y.; Li, S.; Cao, X.; Li, X.; Liu, X.; Cao, H. Mesozoic-Cenozoic inversion tecvtonics of East China and its implications for the subduction process of the oceanic plate. Earth Sci. Front. 2017, 24, 249–267. [Google Scholar]
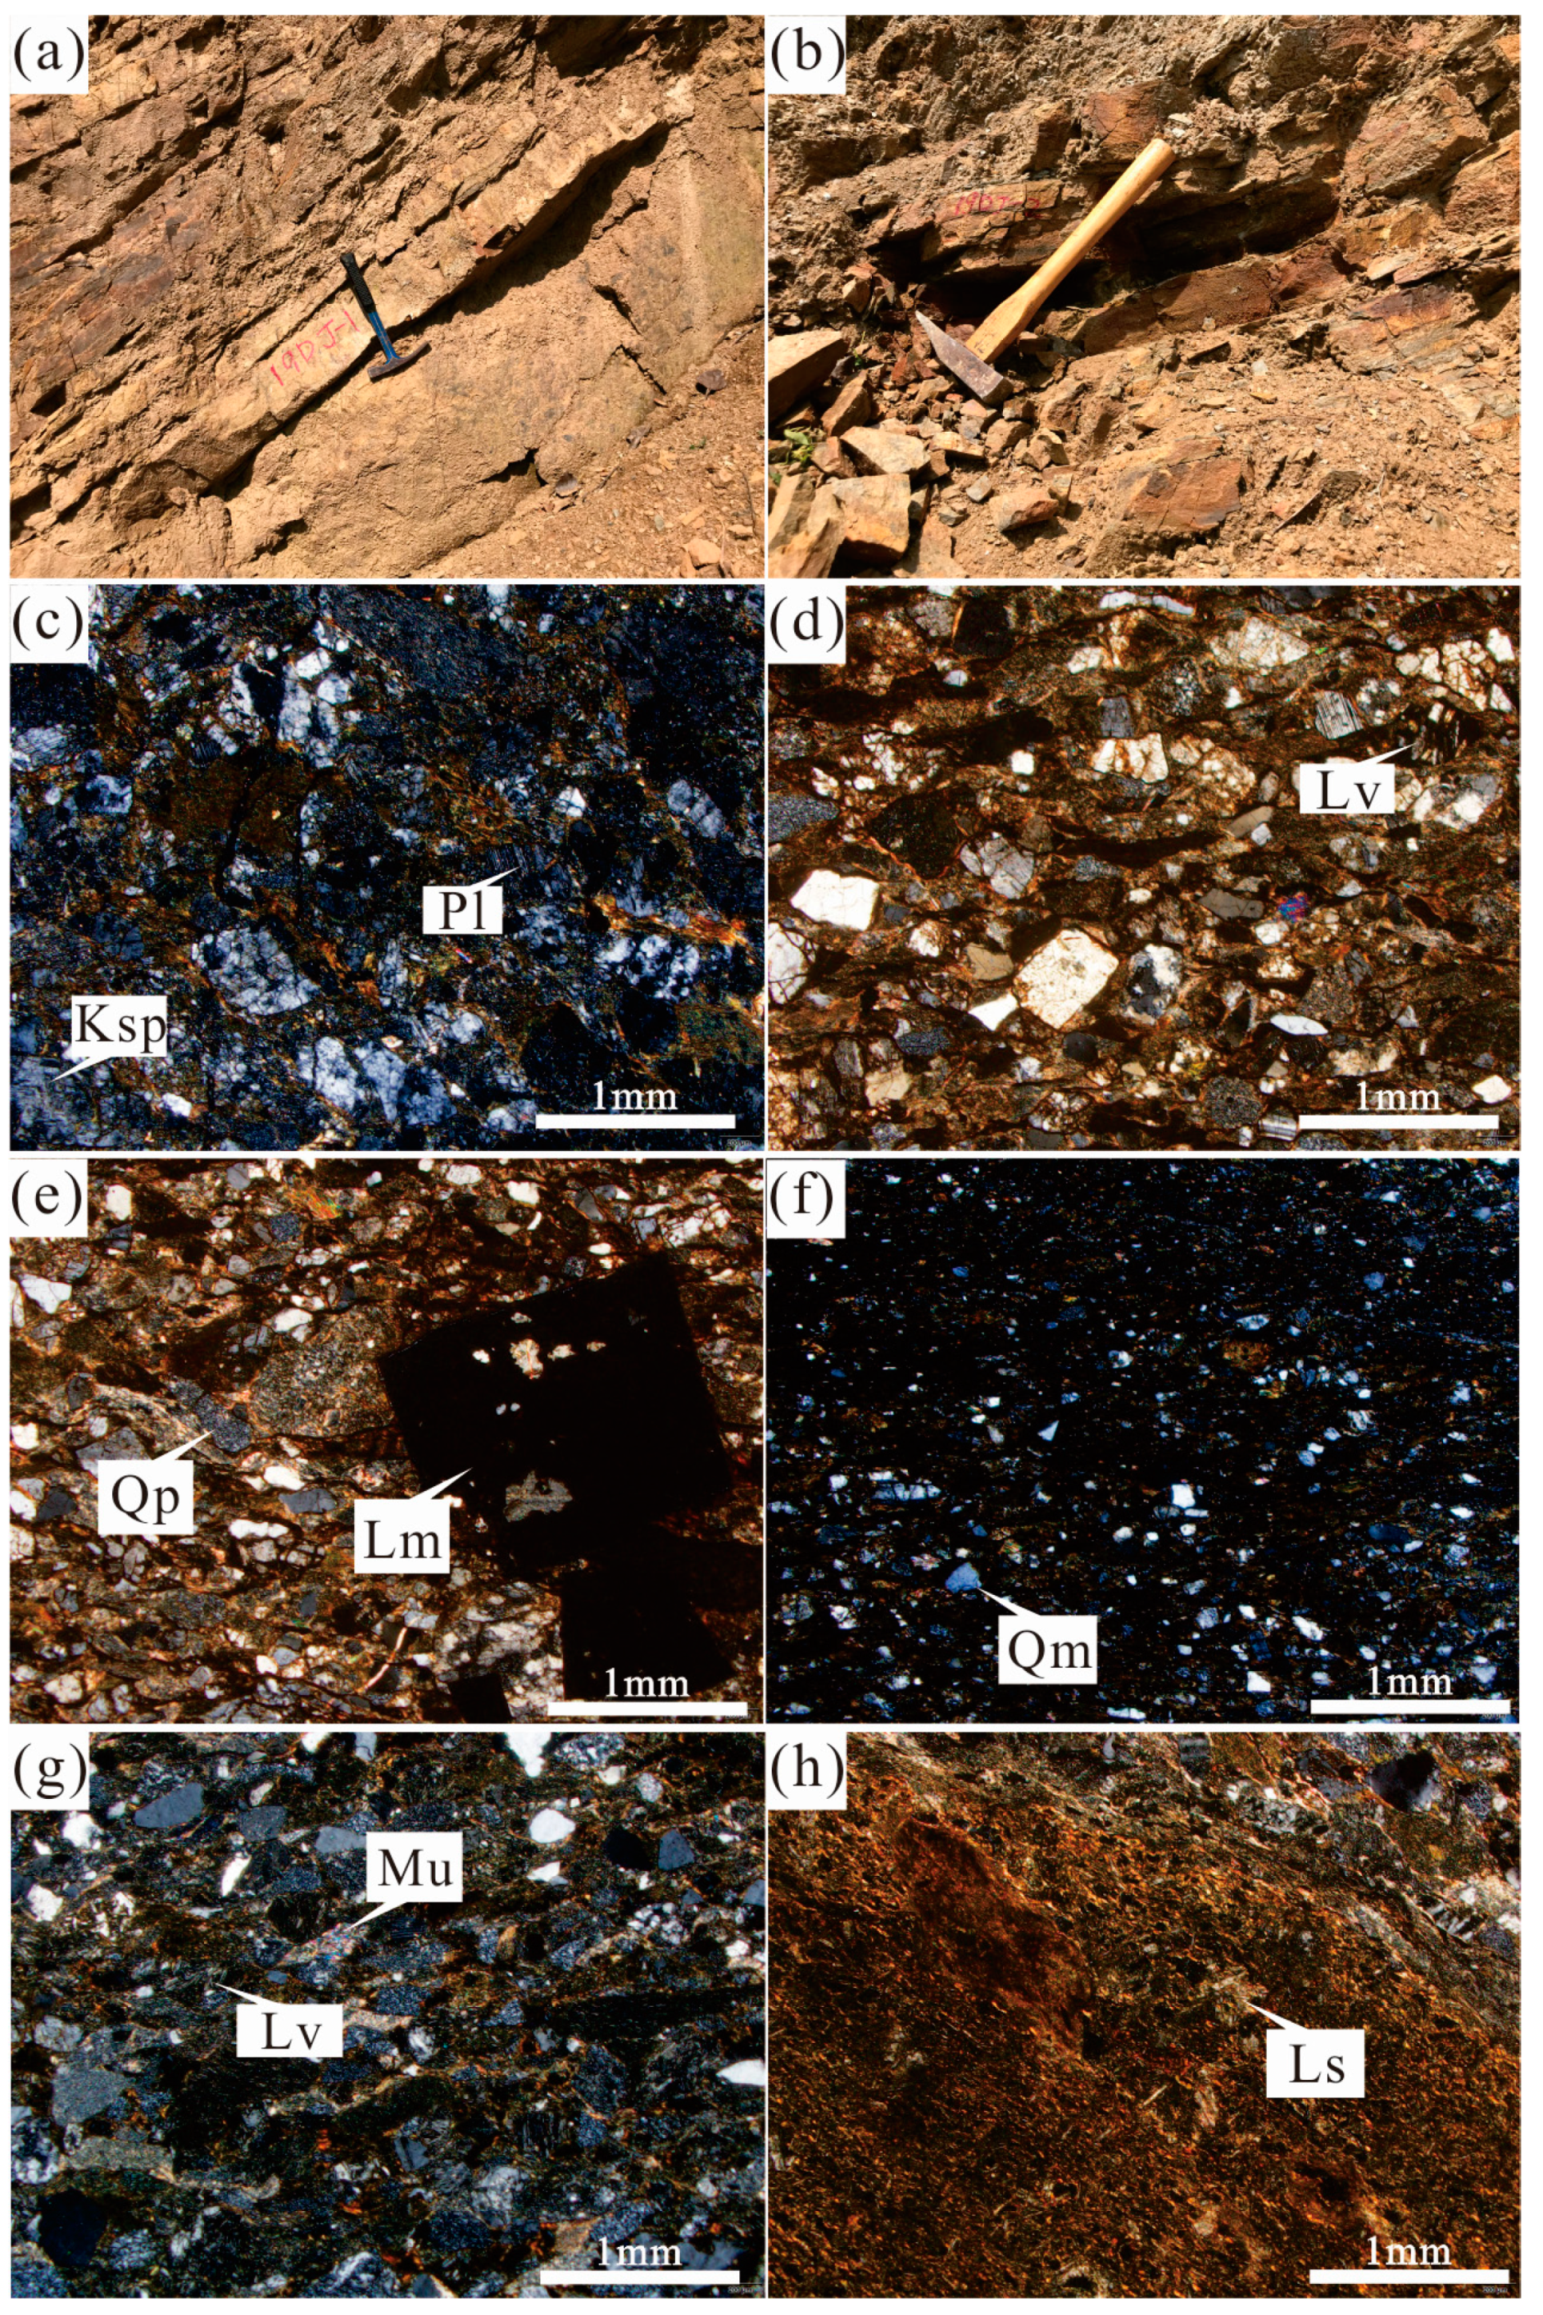
Figure 2. (a,b) Field photos of sandstone in the Dajianggang Formation; (c) microscopic photos of 19DJ-1; (d,e) microscopic photos of 19DJ-2; (f) microscopic photos of 19DJ-3; (g) microscopic photos of 19DJ-4; and (h) microscopic photos of 19DJ-5. Pl—Plagioclase; Ksp—K-feldspar; Qp—Polycrystalline quartz; Qm—Monocrystalline quartz; Ls—Lithic fragment of sedimentary rock; Lv—Lithic fragment of volcanic rock; Mu—Muscovite; Lm—Limonite.
Minerals 13 00975 g002
Figure 3. Structural diagram of sandstone skeleton triangle of the Dajianggang Formation (modified after [43]).
Minerals 13 00975 g003
Figure 4. Weathering diagram of the major element A-CN-K of Dajianggang Formation sandstone in the Shuangyang area (Modified after [45]).
Minerals 13 00975 g004
Figure 5. (a) SiO2-K2O/Na2O and (b) K2O/Na2O-SiO2/Al2O3 (Cited in [49]). A1—basaltic and andesitic island arc sources; A2—felsic intrusive rock evolution island arc source.
Minerals 13 00975 g005
Figure 6. (a) A standardized spider diagram of trace elements in the upper crust of sandstone in the Dajianggang Formation (Modified after [51]) and (b) standard distribution model of rare earth elements in sandstone of the Dajianggang Formation (Modified after [52]).
Minerals 13 00975 g006
Figure 7. (a) Hf-La/Th source discrimination diagram (Modified after [50]); (b) Ni-TiO2 diagram (Modified after [53]).
Minerals 13 00975 g007
Figure 8. (a) Th-Co-Zr diagram of sandstone triangle structure of the Dajianggang Formation in the Shuangyang area and (b) Th-Sc-Zr diagram of sandstone triangle structure of the Dajianggang Formation in the Shuangyang area (Modified after [53]). a—oceanic island arc; b—continental island arc; c—active continental margin; d—passive continental margin.
Minerals 13 00975 g008
Figure 9. La/Sc-Ti/Zr tectonic diagram. PM—passive continental margin; ACM—active continental margin; CIA—continental island arc; OIA—oceanic island arc.
Minerals 13 00975 g009
Figure 10. (a) Cathodoluminescence (CL) images of selected zircons from samples 19DJ-1. Solid circles show positions of LA-ICP-MS analytical sites with their ages in Ma. (b) Concordia diagram of conglomeratic sandstone in the Dajianggang Formation. Filled ellipses are discordant data.
Minerals 13 00975 g010
Figure 11. (a) Histogram of crystallization age–stratigraphic age frequency distribution of sandstone in the Dajianggang Formation and (b) cumulative probability graph. Summative drop point region: A—convergence plate edge background; B—syncollisional tectonic setting; C—Extensional basin setting. Purple dot—plot of the difference between the measured crystallization age and the depositional age of the succession in this study. Red line—variation of the difference between the measured crystallization age and the depositional age of the succession in which it occurs in this study.
Minerals 13 00975 g011
Figure 12. (a) Age distribution radar map of AFT particles from 19DJ-1 clastic rock of the Triassic Dajianggang Formation. (b) Age distribution density map of AFT particles from 19DJ-1 clastic rock of the Triassic Dajianggang Formation.
Minerals 13 00975 g012
Figure 13. (a) Modelling result of AFT thermal history of clastic rock 19DJ-1 of Triassic Dajianggang Formation and (b) length distribution of fission tracks. (a) shows the results of the thermal history simulation based on grain age and track length. (b) shows the length distribution of the confined fission track and the comparison with the simulation results in (a); the purple lines represent simulated paths with good fit (GOF > 0.5), and the green lines represent simulated paths with acceptable fit (0.5 > GOF > 0.05). The blue boxes are used to constrain the Time–Temperature paths. The black solid line represents the optimal solution in the simulation result. The yellow solid line represents the weighted mean path. Abbreviation: AFT PAZ—partial annealing zone of apatite fission track.
Minerals 13 00975 g013
Table 1. Analysis results of sandstone clastic particles in the Dajianggang Formation.
GroupSampleQmQpPlKspFLsLvLmMuBtMTotalQtLLt
Dajianggang Formation19DJ-1391470158533210011192395535468
19DJ-25428822010245440701414218289117
19DJ-32311321143947000235368345667
19DJ-46554431558182906018341311947101
19DJ-5112711819272500059168385279
The values in the table are the numbers of various mineral particles counted using the Dickinson point method, the number of skeleton mineral components counted using Total, and the percentage of cement or matrix calculated using percentage. Qm—monocrystalline quartz; Qp—polycrystalline quartz; Qt—total quartz (Qt = Qm + Qp); F—feldspar (F = Pl + Ksp; Pl—plagioclase; Ksp—potassium feldspar); Ls—lithic fragment of sedimentary rock; Lv—lithic fragment of volcanic rock; Lm—lithic fragment of metamorphic rock; L—lithic fragments (L = Ls + Lv + Lm); Lt—total lithic fragments (Lt = L + Qp); Mu—Muscovite; Bt—biotite; M—cement or matrix.
Table 2. Major elements of the Dajianggang Formation sandstone in the Shuangyang area (wt%).
SampleLithologySiO2Al2O3TFe2O3CaOMgOK2ONa2OTiO2P2O5MnOLOITotalCIACIWICV
19DJ-1conglomeratic sandstone64.9816.66.230.630.961.714.30.890.260.073.1999.8262.2366.880.89
19DJ-4sandstone63.0116.798.370.362.261.693.040.770.130.113.1299.6669.1574.80.99
19DJ-5greywacke72.9213.673.820.480.921.752.680.670.220.082.5399.7365.5672.120.76
Table 3. Trace elements of the Dajianggang Formation sandstone in the Shuangyang area (×10−6).
Sample19DJ-119DJ-419DJ-5
LithologyConglomeratic SandstoneSandstoneGreywacke
trace elements (×10−6)
Li26.6636.3714.15
Be1.741.791.75
B14.9413.5316.66
Sc5.767.776.85
V104.3104.477.27
Cr74.4227157.9
Co8.7517.4510.46
Ni53.73105.262.63
Cu20.4922.1619.58
Zn83.64113.460.55
Ga19.9521.0218.22
Ge6.949.547.83
As22.857.637.42
Se1.371.981.35
Rb17.0625.8243.76
Sr142.7185.6126.6
Y9.8317.7319.22
Zr284.7247.6241.7
Nb14.4911.4211.61
Mo10.8910.5711.74
Ag0.420.420.36
Cd2.52.172.23
Sn1.632.051.95
Sb3.122.793.18
Cs2.952.93.83
Ba279.4310.1377.4
La15.1127.4927.51
Ce30.9958.4246.72
Pr4.4387.4126.91
Nd16.827.7725.57
Sm3.255.064.81
Eu0.891.161.28
Gd2.894.594.44
Tb0.440.670.67
Dy2.373.673.55
Ho0.50.740.75
Er1.472.062.16
Tm0.230.320.34
Yb1.451.932.09
Lu0.250.30.35
Hf6.445.965.6
Ta1.020.950.88
W1.952.482.1
Au0.090.080.09
Tl0.40.540.47
Pb18.9319.5914.69
Bi0.150.290.19
Th5.068.448.69
U2.562.822.85
ΣREE81.07141.58127.14
ΣLREE71.48127.3112.8
ΣHREE9.614.2814.34
(La/Yb)N0.771.050.97
(La/Sm)N0.680.790.83
(Eu/Yb)N1.611.561.6
Table 4. LA-ICP-MS Zircon U-Pb dating data of conglomeratic sandstone of the Dajianggang Formation.
Point NumberContent (×10−6)Th/U207Pb/235U206Pb/238U207Pb/235U206Pb/238UConcordance (%)
UThPbRatioRatioAge (Ma)Age (Ma)
1 *38699710,3792.58799.206520.63316.84680.17416787.726.2*****143*****
2 *564713311.260.31460.00980.03710.0008277.87.6234.95.283
3399421211.060.29790.01030.03820.0009264.88.1241.85.491
42009790.490.27020.01230.03830.0009242.89.8242.25.6100
5 *400350210.880.34240.01140.03940.00092998.6249.25.582
616210380.640.27460.01370.03830.0009246.411242.15.798
7272326151.20.27570.01110.03750.0009247.38.9237.35.496
8240125110.520.27060.01140.0380.0009243.29.1240.65.599
9378325200.860.28450.01010.03870.0009254.28244.75.496
1016214480.890.2550.0130.03750.0009230.610.5237.15.697
11594440290.740.27150.00860.03810.0009243.96.9240.95.399
1217414190.810.27980.01330.03780.0009250.510.5239.35.695
1318411490.620.26420.01250.03810.000923810240.95.699
14301254150.840.2790.01080.03710.0009249.98.5234.85.394
15489358240.730.28460.00960.03810.0009254.37.6240.85.395
16526518280.980.2670.00870.0380.0009240.37240.55.3100
17388475221.230.27040.00970.03880.00092437.8245.55.499
18309196150.630.26480.01030.03780.0009238.68.3239.15.4100
19469217210.460.26550.0090.03770.0009239.17.3238.85.3100
20539561291.040.27190.00880.03810.0009244.27.1240.95.399
21232154110.660.27610.01180.03720.0009247.69.4235.35.495
22332280170.840.27470.01040.03690.0008246.48.3233.65.295
23298164140.550.28420.01090.03850.00092548.6243.25.596
24 *138227946092.0211.49840.39940.12750.0042564.432.5773.822.6−7
25457409230.890.27030.00910.03760.0008242.97.3238.25.298
26319351171.10.27190.01020.03710.0008244.28.1234.75.396
271000864510.860.26080.00730.03760.0008235.35.9238.25.199
28273149130.550.26050.01050.03770.0009235.18.5238.45.499
29288275150.960.26320.01030.03780.0009237.28.3239.35.499
30667569340.850.27850.00850.03820.0009249.46.7241.65.397
3115011670.770.27570.01410.03740.0009247.311.2236.55.696
32310254160.820.26730.01030.03810.0009240.68.2241.25.4100
33314265160.850.26690.01010.0380.0009240.28.1240.65.4100
34416298200.720.28070.00970.03780.0009251.27.7238.95.395
35394558231.420.28060.00980.03790.0009251.27.8239.65.395
36531488270.920.26850.00870.03770.0008241.57238.85.299
37252196130.780.27570.01130.03840.0009247.39242.65.598
38368328190.890.28030.01020.03720.0008250.98.1235.75.394
391095960560.880.2750.00760.03790.0008246.76239.65.297
40276178130.650.26750.01080.03750.0009240.78.7237.15.498
41366380191.040.25270.00940.03640.0008228.87.6230.65.199
42339217160.640.27160.01020.0370.00082448.2234.45.296
4317010880.630.27340.01310.03890.0009245.410.5245.95.7100
44198157100.790.26370.01230.03750.0009237.69.9237.55.5100
45435444221.020.25070.0090.03580.0008227.27.3226.85100
46 *560262270.470.31620.00970.03790.00082797.5239.95.385
47408537221.320.24940.00910.03650.0008226.17.42315.198
48694730.690.2650.01990.03760.001238.716238.26.3100
49254153120.60.27870.01160.03760.0009249.69.2237.75.495
5014610270.70.26330.01390.03770.0009237.311.1238.45.7100
51245143110.580.26670.01130.03670.00092409232.45.397
52511557281.090.27680.0090.03780.0009248.17.2239.35.396
53757693400.920.27460.00810.03820.0008246.36.5241.75.298
547021133421.610.27830.00830.03830.0009249.36.6242.25.397
55466352220.760.26310.00950.0360.0008237.27.6228.25.196
562912911510.27450.01070.03720.0009246.38.5235.65.396
57652657341.010.27630.00850.03770.0008247.76.8238.45.296
58378406201.080.25840.00950.03670.0008233.47.62325.299
5916713990.830.29080.01380.03790.0009259.210.9239.75.692
60254197130.770.26920.01120.03760.0009242.19237.75.498
61 *12410260.820.32960.0170.03680.0009289.313232.95.678
62374319190.850.2650.00960.03820.0009238.77.7241.35.499
63546448280.820.2730.00880.03770.0008245.17238.75.297
6418314790.80.2660.01270.03710.0009239.510.2234.75.598
6515310170.660.26250.01340.03820.0009236.710.8241.75.798
662632641410.2620.01090.03730.0009236.28.8235.95.3100
67582489310.840.29780.00920.03850.0009264.77.2243.45.392
68*793749410.940.2970.00860.03670.00082646.7232.55.187
691348370.620.2840.01480.03830.0009253.911.7242.55.895
706923140.330.27370.00870.03720.0008245.76.9235.25.296
71960887510.920.29360.00820.03820.0008261.46.4241.65.292
72838675430.810.2680.00780.03830.0008241.16.2242.15.2100
73219137110.630.27960.01210.03760.0009250.39.6237.65.595
7414411170.770.270.0140.03680.0009242.711.22335.696
75313252160.80.25340.00990.03760.0009229.48238.15.396
765805803010.27030.00850.03690.00082436.8233.35.196
77 *301174150.580.31150.01150.0390.0009275.48.9246.55.589
78438417220.950.26410.00920.0370.0008237.97.4234.55.299
79297242150.820.26440.01040.03640.0008238.28.4230.65.297
80222160110.720.25860.01140.03750.0009233.69.2237.15.499
811589480.590.26890.01340.03730.0009241.810.7236.15.698
82 *206157100.760.29890.01290.03710.0009265.610.1234.55.488
83 *528278260.530.30560.00960.03840.0009270.87.5243.15.389
84476431240.910.26570.0090.03750.0008239.27.22375.299
85689676360.980.28480.00850.03760.0008254.56.8238.15.293
86409445221.090.25390.00920.0370.0008229.87.42345.298
87285334161.170.26490.01060.03720.0009238.68.5235.35.399
88460408230.890.26090.0090.03660.0008235.47.2231.55.198
891479970.670.2670.01370.0370.0009240.310.9233.95.697
90341368181.080.26170.00990.03710.0009236.182355.3100
91 *20112044961.020.25540.00650.03310.00072315.22104.590
92613531310.870.25760.00820.03690.0008232.86.6233.45.1100
93429239200.560.27590.00960.03760.0009247.47.6238.25.396
94296220150.740.28590.01110.03770.0009255.48.7238.65.493
95330222160.670.27880.01050.03760.0009249.78.3237.65.395
96 *190141110.740.43040.0170.03860.0009363.412.1244.45.761
97611500300.820.26280.00830.0370.0008236.96.72345.199
98666576330.870.25350.00790.03630.0008229.46.4229.85100
99786758400.960.26220.00790.03660.0008236.56.3231.7598
100211101100.480.25730.01170.03640.0009232.49.5230.75.399
Note: Data with * were discordant. Data with strikethrough were not shown in the figure due to huge discordance. ***** were the data with huge error that couldn’t be calculated.
Table 5. Apatite fission track analysis results of sample 19DJ-1 of the Dajianggang Formation.
SampleLongitude
(°E)
Latitude
(°N)
Elevation
(m)
Lithology/
Strata
NcρsρiρdUP(χ2)Central AgeDpar
(μm)
MTLN
(105/cm2)(105/cm2)(105/cm2)(×10−6)(Ma)(μm)
(Ns)(Ni)(Nd) /%
19DJ-1125°49′25″43°22′53″309pebbly sandstone/T3d737.922
(1777)
19.7591715.77094.2 ± 8.32.1511.53 ± 1.4789
(4432)(15,655)
Abbreviations: Nc—number of grains; ρs and Ns—spontaneous track density of the sample (×106 tracks cm−2) and number of spontaneous tracks counted; ρi and Ni—induced track density in external detector (muscovite) (×106 tracks cm−2) and number of induced tracks counted; ρd and Nd—induced track density of dosimeter glass (×106 tracks cm−2) and number of tracks counted; MTL and N—mean confined fission track length and number of lengths measured.
Disclaimer/Publisher’s Note: The statements, opinions and data contained in all publications are solely those of the individual author(s) and contributor(s) and not of MDPI and/or the editor(s). MDPI and/or the editor(s) disclaim responsibility for any injury to people or property resulting from any ideas, methods, instructions or products referred to in the content.