Abstract
In the context of long-term safety assessments of deep geological repositories for radio-active wastes, a rigorous understanding of the retention of radionuclides such as 226Ra due to co-precipitation with carbonate and sulphate minerals is important for a realistic prediction of radionuclide migration behaviour in the repository near and far field. The co-precipitation of 226Ra in sulphate minerals, in particular barite, has been studied experimentally and numerically in detail throughout the last decade to establish the thermodynamic properties and mixing behaviour of its solid solutions over a wide range of temperatures. However, so far, few studies have been dedicated to the incorporation of 226Ra into carbonates, and little is known about the mixing behaviour of 226Ra and calcium carbonate phases such as calcite, aragonite, or vaterite. The aim of the work presented here was to develop and explore innovative microfluidic experiments in combination with in situ Raman spectroscopy that can be used to investigate co-precipitation processes of radionuclides in carbonate minerals, using stable Ba as a chemical analogue for 226Ra in the first step, due to their similar ionic radii. Different microfluidic set-ups were developed to address co-precipitation in bulk solution as well as in confinement or under diffusive flow regimes. It could be shown by XRD and SEM-EDX analyses that high amounts of Ba can be incorporated into the lattice of calcite when formed via an amorphous precursor phase, suggesting that the formation of calcium carbonates can contribute to the retention of 226Ra in the repository environment, which will be verified in future studies using the presented microfluidic platforms.
1. Introduction
In various industrial applications, co-precipitation is considered as the holy grail for the removal of metal contaminants from industrial wastewater and groundwater. For example, the co-precipitation of phosphate is induced for the remediation of soil and groundwater contaminated with lead, cadmium, or zinc, while the co-precipitation of Ra-bearing sulphate minerals has proven to be an effective remediation method for the treatment of water from hydraulic fracturing in gas-bearing shales (Refs. [1,2] and references therein). In the context of radioactive waste disposal, a rigorous understanding of the retention mechanisms of safety relevant radionuclides, in particular for radium, is important for a more realistic prediction of radionuclide mobility in the repository near and far field [3]. Besides sorption processes on clay minerals [4], Ra can be immobilized or retained in the repository environment through co-precipitation processes as (i) (Ba,Ra)SO4 formed from barium and radium released from the wastes and the intruding sulphate-bearing pore water [3,5] and (ii) as radium-bearing carbonates (in particular CaCO3) formed at clay-cement interfaces during carbonation of cementitious materials introduced as construction or backfill material in the repository [6] or in carbonate-bearing clay rock [7].
The co-precipitation of radium in sulphates has been studied experimentally and numerically to establish the thermodynamic properties and mixing behaviour of its solid solutions over a wide range of temperatures [8,9,10,11,12,13,14]. To date, there have been limited experimental investigations focused on the incorporation of radium into carbonates, resulting in a lack of understanding regarding the mixing behaviour of 226Ra and calcium carbonate [15,16]. In most experiments, radium is usually used at tracer concentrations (<10−8 M), or barium is employed as a surrogate. Indeed, experiments involving radium are difficult because of its radioactivity; 226Ra (half-life 1600 years) decays to form gaseous 222Rn and a series of other short-lived α emitting isotopes. In recent safety assessments for deep geological repositories for radioactive wastes, potential upper limits for the 226Ra concentration in the repository environment are expected to be in the range of 10−5 to 10−4 M, depending on the composition of the pore water and the assumed solubility-limiting solids, with best estimates often distinctly lower (i.e., between 10−11 and 10−9 M; cf. [17,18]). In contrast, in the sulphate-poor pore water in the Boom Clay at Mol, Belgium, the expected Ra concentration is about 7 × 10⁻⁵ M (best estimate) with a proposed upper level of 1.2 × 10⁻⁴ M [19].
With the ongoing technological transfer from biotechnology to geosciences [20], microfluidics is emerging as a versatile tool to investigate mineral crystallization processes [21,22]. Whittaker et al. [23,24,25], as well as Meldrum et al. [26,27], have successfully employed droplet microfluidics to generate hundreds of droplets in an immiscible phase in which each droplet is an independent batch experiment, allowing for the investigation of nucleation of carbonates or iron hydroxides in confinement. Poonoosamy et al. [28] combined microfluidic experiments with fluid dynamics modelling to derive the crystal growth kinetics of sulphates in confinement. Further investigations including in situ Raman spectroscopy were used to investigate whether oscillatory zoning of (Ba,Sr)SO4 is driven by kinetics or diffusion [29]. The advantage of this technology is that only small volumes of fluid are required to run hundreds of experiments in parallel, providing good statistics. This technology, when harnessed, could result in a breakthrough in the field of radio-geochemistry as it will offer the opportunity to work with high concentrations of radium or other radionuclides in solution while the radionuclide inventory in the experimental setup is low, keeping the radiation doses minimal as in classical batch experiments or below.
The goal of this work is to explore and develop microfluidic experiments that can be used to investigate metal co-precipitation processes in carbonate minerals that can be later transferred for the investigation of radium incorporation into carbonates. We propose two experimental set-ups: one enabling a quick mixing of reactive solutes (droplet microfluidics) and another that enables the slow diffusion of reactive solutes (passive microfluidic setup), analogous to fluid flow in fractured crystalline rocks and clay rocks, respectively. We combine Raman spectroscopy, scanning electron microscopy (SEM) combined with energy-dispersive X-ray spectroscopy (EDX), and powder X-ray diffraction (P-XRD) analysis for the investigation of the polymorphism of carbonates, and the incorporation of Ba into the carbonate lattice, using Ba as chemical analogue for 226Ra, due to their similar ionic radii (Ra2+: 164 pm, Ba2+: 160 pm; for coordination number 12 [30,31]).
2. Materials and Methods
2.1. Chemical System and Geochemical Modelling
Calcium carbonate exhibits several anhydrous polymorphs: (i) calcite (hexagonal structure, space group Rch), the thermodynamically stable phase at ambient conditions, (ii) aragonite (orthorhombic structure, space group Pmcn), a high-pressure phase unlikely to form at room temperature in abiotic systems or unless other additives, e.g., magnesium, are added [32,33], and (iii) vaterite (hexagonal structure, space group P63/mmc) a meta-stable phase readily transforming into calcite or aragonite (depending on temperature) [34]. Moreover, there are three hydrated CaCO3 phases known to exist, namely (with increasing solubility) monohydrocalcite (CaCO3 × H2O, trigonal, space group P3112), ikaite (CaCO3 × 6H2O, monoclinic, space group C2/c), which is stable only at low temperature (<8 °C [35]) and rapidly decomposes into vaterite and/or calcite and water at higher temperatures, and amorphous (hydrous) calcium carbonate (ACC). The ACC phase is unstable and a precursor for the formation of crystalline phases and usually has the short-range ordering of calcite or aragonite. The stable polymorphs can incorporate divalent metal cations, depending on their size: cations of a smaller ionic radius than calcium are incorporated into calcite, while larger cations, such as strontium or barium, will be incorporated preferably into the aragonite structure (e.g., [36]). However, recent work has shown that even cations larger than calcium (e.g., barium) can also be incorporated in the calcite lattice up to a maximum concentration corresponding to the chemical formula Ba0.7Ca0.3CO3, if a synthesis route through the formation of ACC is involved [37]. Indeed, these results were even more surprising as witherite (BaCO3) crystallizes in an orthorhombic (aragonite) structure.
The chemical system used in this work is the (Ca1−xBax)CO3 system. Two reactions were investigated:
The mixing of calcite with witherite involves a non-isostructural mixing which can be described using Darken’s Quadratic Formulation DQF model as was done for calcite and strontianite [38]. However, the implementation of such a model was beyond the scope of this work which focused on the development of experimental methods. For simplicity, the results will be interpreted with respect to the supersaturation of the end member phases. Gibbs energy minimization (GEM) approaches implemented in the GEMS3K solver [39] were used to calculate the solution chemistry for the evaluation of the saturation indices (SI) of the solution with respect to the various Ca-carbonates and witherite (BaCO3), using the solubility products given in Table 1. The SI is defined as log10 (Ω), where Ω is the ratio of the ion activity product (IAP) divided by the solubility product of the respective solid (Ksp):

Table 1.
Solubility products of various carbonate minerals.
2.2. Batch Experiments
Micronized “batch” experiments were carried out to establish Raman measurements of CaCO3 phases in the presence of Ba as a reference for subsequent analysis and for comparison with the results of conventional bulk experiments. The batch experiments comprised the mixing of two reacting solutions and the collection of the precipitates for analysis.
A solution of 10 mM of calcium chloride (CaCl2) and a solution of 10 mM of sodium carbonate (Na2CO3) was prepared and filtered using MF 187MilliporeTM Membrane Filters (Merck KGaA, Darmstadt, Germany) of 0.22 μm pore size. Then, 10 µL of the Na2CO3 solution followed by 10 µL of the CaCl2 solutions was pipetted in a Petri dish with 0.17 µm glass bottom (ref 150,680 from Thermo Scientific, Waltham, MA, USA), and 300 µL of oil was added to cover the aqueous solution and thus prevent evaporation (cf. Figure 1). This experiment was labelled A1. The mixed solution in the Petri dish was monitored using time-lapse microscopy between 5 and 90 min using an inverted Microscope Eclipse Ti2 (NIKON, Tokyo, Japan) with a CFI Plan Fluor DL 10× objective (numerical aperture 0.3; working distance 0.16, Nikon, Tokyo). Raman spectroscopy was performed within the first hour after mixing using a Witec alpha300 Ri inverted confocal microscope with a Nikon CF plan 100× objective of numerical aperture 0.95. The instrument is equipped with a Nd:YAG laser (λ = 532 nm), a thermoelectrically cooled CCD Camera, and a Ultra-High-Throughput Spectrometer UHTS300. Raman measurements were collected using a grating of 1800 grooves per mm at a laser power of 20 mW collecting 100 measurements each lasting 0.5 s for amorphous phases and 50 measurements each lasting 0.5 s for the crystalline phases. A second experiment (A2) was conducted with 10 µL of a mixed solution of 9 mM CalCl2 and 1 mM barium chloride (BaCl2) and 10 µL of 10 mM Na2CO3 solution. The Petri dishes were closed and sealed with parafilm and kept for 48 h for further analysis.
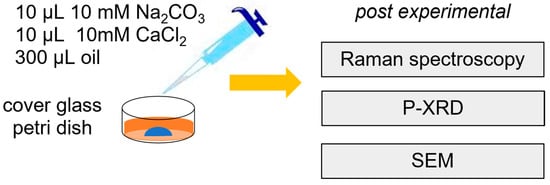
Figure 1.
Schematics of the batch experiment.
The crystals recovered were collected using glass fibres and allowed to dry before being measured using P-XRD. For these measurements, considering the small amount of material, a Supernova Single Crystal Diffractometer (Rigaku Oxford Diffraction) equipped with a microfocus Cu Ka (k = 1.54060 Å) radiation source and an Eos™ CCD detector was used to measure samples from experiments A1 and A2. Obtained patterns were analysed using the Rietveld method using the program GSAS-II [44]. The background was estimated using a 6 to 12 term shifted Chebyschev function, and peak shapes were modelled using a pseudo-Voigt function. The scale factor, detector zero-point, and lattice parameters, as well as peak profile parameters, were refined together with phase amounts quantitatively. Additionally, SEM-EDX investigations of the precipitates were performed with a FEI Quanta 200F SEM with a field emission cathode and an Apollo X Silicon Drift Detector (SDD, EDAX).
2.3. Microfluidic Droplet Experiment
Experimental setups consisted of a droplet generator chip made out of TOPAS® COC (cyclic olefin copolymer) and connected to a storage chip made out of PMMA (polymethyl methacrylate), where the droplets were monitored after fabrication (Figure 2). Two inlets were dedicated to the injection of the oil phase (Novec™ 7500 fluorinated oil, Fluigent Le Kremlin-Bicetre, France) (indicated by yellow circles in Figure 2b), and two for the injection of the dispersed (aqueous) phase (indicated by red and green circles in Figure 2b), which was a mixture of 10 mM of calcium chloride (CaCl2) and a solution of 10 mM of Na2CO3, hereafter referred to as experiment B1. The flow rates used for the experiment were 1 µL min−1 for both CaCl2 and Na2CO3 and 5 µL min−1 for the oil phase. The storage chips had cylindrical pillars (Figure 2c) to trap the droplets. When the storage chip was filled with droplets, it was disconnected from the droplet generator chip, closed at both ends with microfluidic plugs, and the mineralogical transformations were monitored using time-lapse microscopy. Raman spectra were collected to determine the polymorphism of the newly formed precipitates. A second experiment (experiment B2) was conducted, replacing the solution of 10 mM CaCl2 with a mixed solution of 1 mM BaCl2 and 9 mM CaCl2. To determine whether the barium was incorporated into the carbonate lattice, droplets were additionally collected in an Eppendorf tube for further analysis using SEM-EDX.
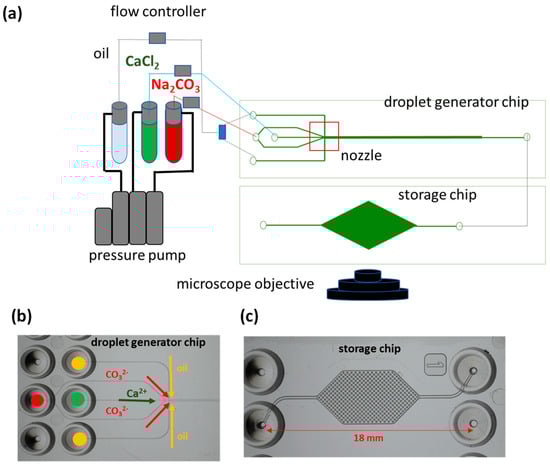
Figure 2.
(a) Experimental setup and chip design of droplet experiment, (b) inlets of the droplets generator chip, and (c) storage chip.
2.4. Micronized Counter-Diffusion Experiments
The classical U-tube counter diffusion experiment, which has been extensively used to investigate the crystallization of solid solutions [45,46,47,48,49,50], was micronized as shown in Figure 3. This constitutes a passive microfluidic setup (no pumps required) to investigate diffusion-induced crystallization of carbonates. The chip made out of TOPAS® consisted of a microfluidic channel of 1.8 cm in length and a cross-sectional area of 100 × 100 µm2 with Luer locks at each end, to which mini tanks each of 500 µL volume were connected. An agarose solution (1 wt.% agarose in deionized water) was prepared and injected into the channel using a syringe. The solution was allowed to set for 1 h at room temperature to solidify into a gel. The tanks were filled with a 10 mM solution of CaCl2 and 10 mM Na2CO3, respectively, and fixed to the channel. The gel ensures the diffusive flux of reacting solutes through the gel and no advective mixing. The effective diffusivity of the agarose gel is ~1 × 10⁻¹⁰ m2s−1 ([51]). The reactions in the channel were monitored using time-lapse microscopy. A second experiment (experiment C2) was conducted with a mixed solution of 9 mM CaCl2 and 1 mM BaCl2 and a solution of 10 mM Na2CO3. Both experiments C1 and C2 were triplicated to verify reproducibility.
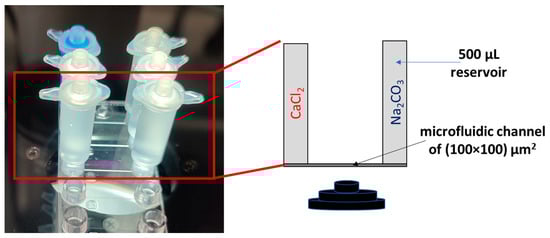
Figure 3.
Passive microfluidic setup (left) and schematics (right).
3. Results
3.1. Solution Chemistry
The speciation of the aqueous solution was calculated using GEM to determine the SI with respect to carbonate minerals given in Table 2, indicating that the solutions in all experiments were strongly supersaturated with respect to the carbonates, and calcite being the most supersaturated phase. N.B., with microfluidics, it is difficult to sample the aqueous solution for chemical analysis of the reactants. Thus, the data provided on the aqueous composition hereafter are based on theoretical calculations, though it can be assumed that fast mixing of reactants occurred in the small volumes of solutions in the batch experiments and the droplet microfluidics. Moreover, the solute concentrations in the microchannel in the diffusion experiment vary with space and time (before a steady state is reached) and are thus accessible only via transport modelling.
Table 2.
Saturation indices (SI) of reacting solutions with respect to carbonate minerals in a solution of pH 10.3 in equilibrium with atmospheric CO2.
3.2. Batch Experiments
The precipitation processes in experiments A1 and A2 were monitored using optical time-lapse microscopy. In experiment A1 (Figure 4a), a fine precipitate of amorphous calcium carbonate (ACC) was observed, which dissolved in favour of more thermodynamically stable crystalline phases within 20 min. Crystals of two distinct morphologies, i.e., cuboidal-shaped and rounded-shaped crystals, were observed. The polymorphs of calcium carbonate can be distinguished using Raman spectroscopy. According to literature (cf. Table 1 in Wehrmeister et al. [52]), calcite is characterized by a ν4 in-plane bending of CO32− at 712 cm−1, a ν1 symmetric stretching of CO32− at 1085 cm−1, and the ν3 antisymmetric stretching of CO32− at 1436 cm−1. Vaterite can be easily distinguished from calcite by the doubling of the ν1 band, giving bands at 1074 and 1090 cm−1. The distinction between calcite and aragonite is made by the ν4 and ν3 bands, which are positioned at 703 and 1464 cm−1, respectively, for the latter.
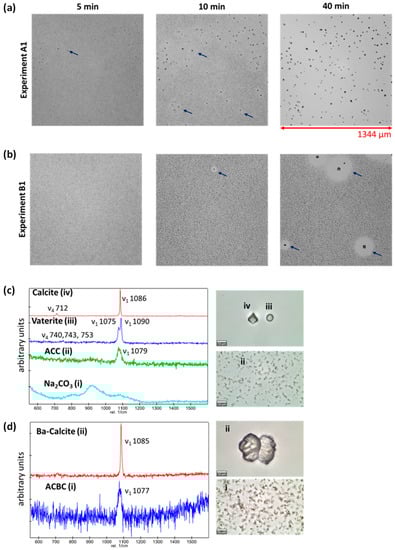
Figure 4.
(a,b) Micrographs of experiments A1 and A2 with time, respectively; (c) Raman spectra of (i) aqueous Na2CO3 solution before reaction, (ii) amorphous calcium carbonate (ACC), (iii) vaterite, and (iv) calcite (pictures with scale bar of 10 µm on the right) collected from experiment A1 and (d) Raman spectra of (i) amorphous calcium barium carbonate (ACBC) and Ba-calcite from experiment A2.
The Raman spectrum of aqueous Na2CO3 prior to reaction is reported in Figure 4c(i) and the formation of ACC is characterized by the Raman spectrum 4c (ii). The cuboidal-shaped crystals in experiment A1 were calcite, while the rounded-shaped crystals were vaterite, characterized by the doubling of the ν1 band (1075 and 1090 cm−1). After 48 h, only euhedral calcite crystals were observed, as shown by SEM images in Figure 5a, and confirmed by P-XRD analysis (Appendix A; Figure A1), suggesting a complete conversion of vaterite to calcite.
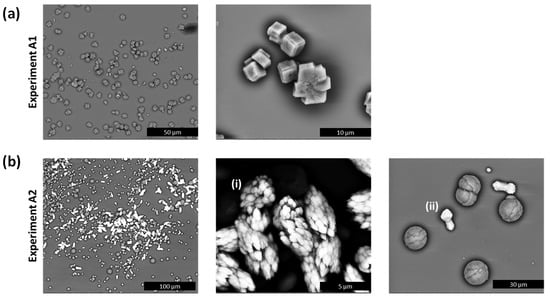
Figure 5.
(a) SEM micrographs of experiment A1 indicating the presence of calcite only after 48 h and (b) SEM micrographs of experiment A2 after 48 h showing the presence of vaterite (spherical-shaped crystals) and two distinguishable morphologies of Ba-calcite (brighter crystals) with (i) high Ba content and (ii) low Ba content.
In the case of experiment A2, a fine precipitate of an amorphous calcium barium carbonate (ACBC) was observed, which dissolved completely in favour of a crystalline phase after 90 min. In experiment A2, no cuboidal-shaped crystals were observed, but rather bow tie-shaped crystals (Figure 4d(ii)). In experiment A2, the Raman spectra of the bow tie-shaped crystals were like those of pure calcite, except for the broadening of the ν1 band at 1085 cm−1 (instead of 1091 cm−1), which suggests the incorporation of barium into the calcite lattice. SEM images obtained 48 h after reaction (Figure 5a) also showed the presence of vaterite (spherical-shaped crystals) and two distinguishable types of barium containing calcite with different morphologies (Figure 5b(i),(ii)). SEM-EDX measurements showed average compositions of Ca0.31Ba0.69CO3 and Ca0.84Ba0.16CO3 (10 measurements each, relative standard deviation about 5%) in (i) and (ii), respectively, while barium incorporation into vaterite crystals can be excluded based on the SEM-EDX measurements.
P-XRD analysis via the Rietveld method for crystal samples recovered from experiment A2 indicated the occurrence of 3 separate phases that could be modelled against hexagonal (space group (SG) = Rch), cubic (SG = Fmm) and hexagonal (SG = P63/mmc) structures, respectively, consistent with calcite, halite (NaCl; a residual salt resulting from the drying of the reacting aqueous solutions), and vaterite, which agrees with SEM measurements. Quantitative phase analysis indicated their phase assemblage to be 66.2 (2), 26.3 (1) and 7.45 (3) wt.% for calcite, halite, and vaterite, respectively. Similar P-XRD analysis was performed for crystal samples recovered from experiment A1 which identified calcite and halite with 41.4 (4) and 58.6 (4) wt.% proportions, respectively, again consistent with SEM measurements. Interestingly, it was found that the calcite phase from experiment A2 had a larger lattice volume than that of experiment A1 (372.42 (5) vs. 368.65 (10) Å3, respectively), where the latter has a unit cell volume consistent with previously measured calcite [53]. This unit cell expansion is consistent with the observations from SEM measurements, namely that Ba has been incorporated into the calcite lattice, as the larger Ba+2 cation substituting for the smaller Ca+2 cation, leading to unit cell expansion [54]. The vaterite identified in experiment A2 was found to have a unit cell volume of 124.99 (22) Å3, which is relatively typical for pure vaterite [55] and does not support inclusion of Ba into the crystal lattice, again consistent with SEM measurements.
3.3. Droplet Experiments
In experiment B1 (Figure 6), the reaction pathway was similar to that of experiment A1 with the formation of an ACC phase, which was found to transform into vaterite or calcite within an hour, revealing the same shapes as in experiment A1. In the 200 µm diameter droplets, mainly calcite crystals were formed; in droplets with 70 µm diameter, predominantly vaterite precipitated.
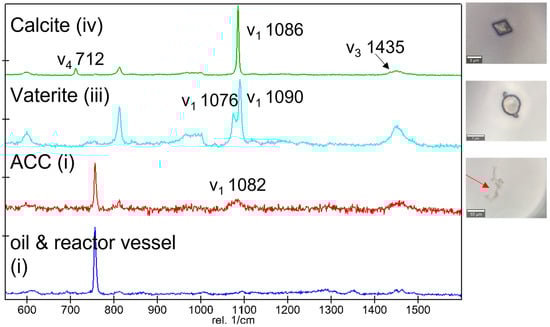
Figure 6.
Raman spectra and associated optical micrographs of precipitates (with red arrows indicating ACC) collected in experiment B1 16 h after the start of the reaction.
In experiment B2, an amorphous ACBC was formed which was found to transform also into crystalline phases. The stability of the ACBC phase is significantly increased in confinement, with a complete transformation of ACBC to crystalline phases observed after 10 h compared to ninety minutes in the bulk experiment. The crystals in the droplets were observed to be very similar in size (~10 µm) and were either vaterite or calcite after 16 h. Further SEM analyses conducted 30 h after the reaction, as shown in Figure 7c, revealed signs of dissolution and recrystallization processes. SEM-EDX measurements conducted on the crystals indicated the incorporation of Ba in the calcite as (Ca1−xBax)CO3 with x = 0.055 ± 0.005. Additional sampling with Raman spot measurements after 30 h revealed only Ba-calcite (Figure 7b(iv)), indicating that all the precipitates transformed into a Ba-bearing calcite in the longer term, thus suggesting a dynamic dissolution and precipitation process to achieve equilibrium.

Figure 7.
(a) Micrographs of experiment B2 and temporal changes of the precipitates; the red and yellow circles indicate a phase transformation from amorphous calcium barium carbonate (ACBC) to a crystalline phase (scale bar 200 µm). (b) Raman spectra and associated optical micrographs of precipitates collected 10 h after the start of the reaction, suggesting the presence of amorphous calcium carbonate (indicated by red arrows). N.B. the larger bands at 770 and 1450 cm−1 are characteristic bands of the storage chip made of TOPAS®. (c) SEM images of Ba-calcite formed in experiment B2 collected 30 h after reaction.
From the Raman analysis, it is difficult to discern whether the formed vaterite had any barium in its lattice but based on the SEM and P-XRD analysis of the bulk experiment, barium incorporation into the vaterite can be excluded. This suggests that calcite formed from vaterite incorporates Ba during the phase transformation/recrystallization to calcite.
3.4. Counter Diffusion Experiments
Figure 8a,b depict the precipitates in the microfluidic channels in experiments C1 and C2, respectively, after one week of reaction. The concentration of solutes in the microfluidic channel, i.e., total aqueous Ca and total aqueous carbonate, with time can be estimated using an analytical solution of Fick’s second law (Equation (A1) in Appendix C), assuming constant concentrations at the reservoirs, similar diffusion coefficients of the solutes in the gel, and diffusion without chemical reactions through the microfluidic channel of 0.018 m length [56]. In experiment C1, the concentration builds up gradually across the channel as indicated by the dashed lines and the solid lines, respectively, in Figure 7c. After 40 h, the theoretical pore solution (cf. Appendix C) in the centre of the microfluidic channel at x = 0.009 m (Figure 7c(i)) is slightly supersaturated w.r.t calcite (SI~1.02) and vaterite (SI~0.45). In the case of experiment C2, the diffusion of aqueous metal and carbonate ions, from their respective inlet reservoirs, is slightly asymmetric. After 40 h, the simulated pore solution was supersaturated with respect to the carbonate phases, i.e., SI~1.45 for witherite at x = 0.006 m and SI~0.98 for calcite at x = 0.009 m.

Figure 8.
Micrographs of the mid sections of the microfluidic channels of the counter diffusion experiments collected for (a) experiment C1 and (b) experiment C2 after 1 week with red arrows indicating fine precipitates; (c) calculated solute concentrations across the microfluidic channel for experiment C1 after 3 and 40 h assuming no chemical reactions with the green arrow at x = 0.009 m indicating the region where the SI w.r.t to calcite and vaterite is the highest; (d) modelled solute concentrations across the microfluidic channel for experiment C2 after 40 h assuming no chemical reactions with the green arrows at x = 0.006 m and x = 0.009 m indicating locations where the SI are highest w.r.t witherite and calcite, respectively.
As expected, the onset of precipitation was significantly delayed in the counter-diffusion experiments. Precipitation of solids was observed after 40 h only. In the case of experiment C1, only single crystals were formed in the middle of the diffusion channels, while in the case of experiment C2, many smaller crystals (<5 µm) were formed. After 7 days, fine precipitates were also observed in experiment C1 (Figure 7a). The crystals in experiment C2 exhibit very fine needle shapes. Thus, the slow diffusive solute transport process seems to significantly influence the morphology of the precipitating carbonates. Raman analysis conducted on the minerals in experiment C1 indicated calcite (see Appendix B), while in experiment C2, the quality of the measurements was hampered by the relatively high fluorescence of the agarose gel, thus not allowing for an unequivocal identification of the solids. Experiments C1 and C2 were repeated three times and leading to consistent results.
4. Discussion
This work aimed to evaluate the feasibility of using microfluidic platforms for the investigation of the coprecipitation of radioactive metals in carbonate minerals. For this purpose, we tested the use of droplet microfluidics combined with in situ Raman spectroscopy and ex situ SEM investigations. In situ Raman spectroscopy can be used to monitor the transformation of the calcium carbonate polymorphs as the system achieves equilibrium, while ex situ analysis, for example, using SEM-EDX or P-XRD analyses, should be used to quantify the incorporation of metal ions in the carbonates.
Despite the solutions being highly supersaturated with respect to calcite (SI = 3.0), the crystalline carbonate minerals were observed to form via the amorphous precursor ACC and ACBC, respectively. The maximum barium incorporation into calcite formed via an amorphous precursor in the bulk experiment A2 is in the same order of magnitude as the one found by Saito et al. [25]. In experiment B1, the formation of both calcite and vaterite was observed, which is consistent with the droplet experiments conducted by Yashina et al. [26]. It was observed that the stability of ACC is strongly influenced by the size of the droplets. Specifically, when the droplet size was decreased from 200 µm to 70 µm in diameter, ACC was found to be present in 70% of the droplets even after 24 h, and a transformation primarily to vaterite was observed. These observations are not discussed in detail here, as they require the development of automated tools for complete quantitative assessment. However, these findings are consistent with previous research by Cavanaugh et al. [25] which suggested an increase in the stability of ACC in confinement.
In the droplet experiments, the formation of (Ca,Ba)CO3 occurred through the formation of precursors of ACBC, and Ba was incorporated into the calcite lattice. The presence of barium increased the (temporal) stability of the amorphous calcium carbonate phase. Despite the solution being supersaturated with respect to witherite and calcite (see Table 2), no pure end-member phases were formed. The relatively smaller amounts of Ba that incorporated the crystals in the droplet experiments may be attributed to a confinement effect, where slower kinetics of crystallization are expected to occur [57].
The counter diffusion experiments revealed the distinct consequences of the transport regime on the precipitation process. In experiment C1, the crystals are observed where the saturation indices w.r.t calcite is highest, i.e., in the middle of the reactor. For experiment C2, in contrast to the batch and droplet experiments, where fast mixing of reactants occurs, under diffusive conditions, due to the stabilization of the amorphous phase in presence barium, the newly formed aggregates are instantaneously immobilized in the porous medium, leading to a fine heterogeneous spatial distribution of (Ba,Ca)CO3 precipitates. The formation of the calcium carbonate precipitates does not correlate with the thermodynamics of the pore water chemistry where precipitation would occur at regions with the highest SI. Instead, the precipitation patterns in C2 are influenced by the limited diffusion of solutes and the kinetic crystallization pathway. These findings also suggest that in porous media where solute transport is controlled by diffusion, the presence of metal ions, or other additives that are known to stabilize amorphous calcium carbonate, can lead to an unexpected precipitation pattern in contrast to the absence of additives where precipitation will occur within regions with the highest SI, ultimately clogging the main solute transport pathway.
5. Conclusions
Based on the experimental observations in experiments A2 and B2, it can be inferred that cations larger than calcium, such as barium, can be incorporated into the calcite structure either through the formation of an amorphous precursor phase (ACBC) followed by recrystallization into Ba-calcite, or from the dissolution of vaterite in an aqueous, barium-bearing solution, followed by recrystallization into Ba-calcite. It is thus expected that 226Ra, which has a similar ionic radius than barium, can also be incorporated into calcite via similar crystallization pathways. Future studies utilizing the presented microfluidic set-ups will be conducted to verify this hypothesis. This could reveal calcium carbonates, present in the multi-barrier system of nuclear waste repositories (e.g., in bentonite buffers and clay host rocks or as newly formed phase during waste canister corrosion or due to cement-clay interactions), as relevant phases for the retention of 226Ra in the repository environment. The distinctively lower Ra concentration to be expected in the repository environment compared to the Ba concentration used in our experiment does not compromise the findings of this paper, since if it is possible to coprecipitate large amounts of an alkaline earth metal such as Ba within the structurally incompatible calcite structure, then the uptake of much smaller amounts of the similar sized Ra2+ ion by calcite should also be achievable via the same pathway (analogous to the well-known coprecipitation of Ra present in trace concentrations within radio-baryte).
The advantage of droplet microfluidics lies in its ability to synthesize crystals of consistent sizes and generate robust statistics from a large number of parallel experiments, via the concomitant use of only small radionuclide inventories in the experiments. Combining droplet microfluidics with atomistic simulation can be used to determine the thermodynamic properties of solid solutions, which are important parameters for geochemical models used to estimate the concentration of mobile radionuclides (e.g., Ra (aq)) under various geological or engineered conditions [9,10]. On the other hand, miniaturized u-tube experiments provide valuable insights into the diffusion-induced precipitation processes in porous media. When combined with reactive transport modelling [58], this approach can be used to develop conceptual frameworks for describing radionuclide immobilization through co-precipitation processes in porous media [21,29].
Author Contributions
J.P. conceived the experiments. J.P. and A.K. conducted the experiments and Raman analysis. S.R. conducted the SEM analysis, while G.L.M. conducted the P-XRD analysis. J.P. wrote the first draft of the manuscript. G.D. wrote, reviewed, and edited the manuscript. J.P., G.D. and D.B. applied for funding. All authors have read and agreed to the published version of the manuscript.
Funding
The research leading to these results has received funding from the German Federal Ministry for the Environment, Nature Conservation, Nuclear Safety and Consumer Protection within the frame of the VESPA II project (grant 02E11607D).
Data Availability Statement
The data obtained and analysed within the frame of this study will be made available by the corresponding author upon reasonable request.
Acknowledgments
The authors thank Norman Lieck and Murat Güngor (both IEK-6) as well as master student Hassan Mehedy (Aachen University of Applied Sciences) for their technical support.
Conflicts of Interest
The authors declare no conflict of interest.
Appendix A. P-XRD Data from Bulk Experiments A1 and A2

Figure A1.
Rietveld refinement profiles for crystals collected and measured from experiments A1 (top) and A2 (bottom) using P-XRD data from a Supernova Single Crystal Diffractometer (Rigaku Oxford Diffraction). The diffractogram for sample A1 was analysed using the Rietveld method, where phases consistent with hexagonal calcite (SG = Rch) and cubic halite (SG = Fmm) were determined with respective unit cell volumes of 368.65 (10) and 179.72 (3) Å3 with wRmin = 2.16% and R = 6.87%. The diffractogram for sample A2 was analysed using the Rietveld method, where phases consistent with hexagonal calcite (SG = Rch), cubic halite (SG = Fmm) and hexagonal vaterite (SG = P63/mmc) were determined with respective unit cell volumes of 372.42 (5), 179.23 (3) and 124.99 (22) Å3 with wRmin = 0.06% and R = 4.21%. The black crosses, upper red lines, lower grey lines and vertical blue, aqua and red markers, respectively, represent observed data, calculated profiles, difference profiles and allowed reflections for calcite, halite, and vaterite for their respective space groups.
Appendix B. Raman Measurements from Experiments C1 and C2

Figure A2.
(a) Raman spectrum collected for crystals in experiment C1 showing the characteristic ν1 band at 1085 cm−1 of calcite, (b) Raman spectrum collected for fine grained particles in experiment C2, and (c) the Raman spectrum of the reactor vessel.
Appendix C. Analytical Solution for the Diffusion of Solutes from a Constant Source
The concentration of a solute C(x,t) across a length x and for time t is given as:
where C0 is the constant concentration at x = 0 and D the diffusion coefficient of solutes in the agarose gel, set to 10−10 m2s−1 here (cf. [56]).
References
- Hunter, H.A.; Ling, F.T.; Peters, C.A. Metals Coprecipitation with Barite: Nano-XRF Observation of Enhanced Strontium Incorporation. Environ. Eng. Sci. 2020, 37, 235–245. [Google Scholar] [CrossRef] [PubMed]
- Poonoosamy, J.; Haber-Pohlmeier, S.; Deng, H.; Deissmann, G.; Klinkenberg, M.; Gizatullin, B.; Stapf, S.; Brandt, F.; Bosbach, D.; Pohlmeier, A. Combination of MRI and SEM to Assess Changes in the Chemical Properties and Permeability of Porous Media due to Barite Precipitation. Minerals 2020, 10, 226. [Google Scholar] [CrossRef]
- Curti, E.; Fujiwara, K.; Iijima, K.; Tits, J.; Cuesta, C.; Kitamura, A.; Glaus, M.A.; Müller, W. Radium uptake during barite recrystallization at 23 ± 2 °C as a function of solution composition: An experimental 133Ba and 226Ra tracer study. Geochim. Cosmochim. Acta 2010, 74, 3553–3570. [Google Scholar] [CrossRef]
- Klinkenberg, M.; Brandt, F.; Baeyens, B.; Bosbach, D.; Fernandes, M.M. Adsorption of barium and radium on montmorillonite: A comparative experimental and modelling study. Appl. Geochem. 2021, 135, 105117. [Google Scholar] [CrossRef]
- Curti, E.; Xto, J.; Borca, C.; Henzler, K.; Huthwelker, T.; Prasianakis, N. Modelling Ra-bearing baryte nucleation/precipitation kinetics at the pore scale: Application to radioactive waste disposal. Eur. J. Mineral. 2019, 31, 247–262. [Google Scholar] [CrossRef]
- Lange, S.; Kowalski, P.M.; Pšenička, M.; Klinkenberg, M.; Rohmen, S.; Bosbach, D.; Deissmann, G. Uptake of 226Ra in cementitious systems: A complementary solution chemistry and atomistic simulation study. Appl. Geochem. 2018, 96, 204–216. [Google Scholar] [CrossRef]
- Ait-Mouheb, N.; Van Loon, L.; Glaus, M.; Yang, Y.; Deismann, G.; Bosbach, D. Reactive transport of Ra-226 in the sandy facies of Opalinus Clay. In AGU Fall Meeting Abstracts; Harvard University: Cambridge, MA, USA, 2020; p. MR012-09. [Google Scholar]
- Klinkenberg, M.; Weber, J.; Barthel, J.; Vinograd, V.; Poonoosamy, J.; Kruth, M.; Bosbach, D.; Brandt, F. The solid solution–aqueous solution system (Sr,Ba,Ra)SO4 + H2O: A combined experimental and theoretical study of phase equilibria at Sr-rich compositions. Chem. Geol. 2018, 497, 1–17. [Google Scholar] [CrossRef]
- Brandt, F.; Klinkenberg, M.; Poonoosamy, J.; Bosbach, D. Recrystallization and Uptake of 226Ra into Ba-Rich (Ba,Sr)SO4 Solid Solutions. Minerals 2020, 10, 812. [Google Scholar] [CrossRef]
- Brandt, F.; Klinkenberg, M.; Poonoosamy, J.; Weber, J.; Bosbach, D. The Effect of Ionic Strength and Sraq upon the Uptake of Ra during the Recrystallization of Barite. Minerals 2018, 8, 502. [Google Scholar] [CrossRef]
- Lestini, L.; Beaucaire, C.; Vercouter, T.; Ballini, M.; Descostes, M. Role of Trace Elements in the 226-Radium Incorporation in Sulfate Minerals (Gypsum and Celestite). ACS Earth Space Chem. 2019, 3, 295–304. [Google Scholar] [CrossRef]
- Heberling, F.; Metz, V.; Böttle, M.; Curti, E.; Geckeis, H. Barite recrystallization in the presence of 226Ra and 133Ba. Geochim. Cosmochim. Acta 2018, 232, 124–139. [Google Scholar] [CrossRef]
- Rollog, M.; Cook, N.J.; Ehrig, K.; Gilbert, S.E. Rapid, competitive radium uptake in strontium, barium, and lead sulfates during sulfuric acid leaching. Appl. Geochem. 2020, 115, 104549. [Google Scholar] [CrossRef]
- Vinograd, V.L.; Kulik, D.A.; Brandt, F.; Klinkenberg, M.; Weber, J.; Winkler, B.; Bosbach, D. Thermodynamics of the solid solution—Aqueous solution system (Ba,Sr,Ra)SO4 + H2O: I. The effect of strontium content on radium uptake by barite. Appl. Geochem. 2018, 89, 59–74. [Google Scholar] [CrossRef]
- Brown, P.L.; Ekberg, C.; Matyskin, A.V. On the solubility of radium and other alkaline earth sulfate and carbonate phases at elevated temperature. Geochim. Cosmochim. Acta 2019, 255, 88–104. [Google Scholar] [CrossRef]
- Jones, M.J.; Butchins, L.J.; Charnock, J.M.; Pattrick, R.A.D.; Small, J.S.; Vaughan, D.J.; Wincott, P.L.; Livens, F.R. Reactions of radium and barium with the surfaces of carbonate minerals. Appl. Geochem. 2011, 26, 1231–1238. [Google Scholar] [CrossRef]
- Berner, U. Solubility of Radionuclides in a Bentonite Environment for Provisional Safety Analyses for SGT-E2; Paul Scherrer Institute (PSI): Villigen, Switzerland, 2014; 65p. [Google Scholar]
- Wersin, P.; Kiczka, M.; Rosch, D. Safety Case for the Disposal of Spent Nuclear Fuel at Olkiluoto—Radionuclide Solubility Limits and Migration Parameters for the Canister and Buffer; Posiva Oy: Eurajoki, Finland, 2014; 226p. [Google Scholar]
- Salah, S.; Wang, L. Speciation and Solubility Calculations for Waste Relevant Radionuclides in Boom Clay: Topical Report—Status 2014; SCK CEN: Mol, Belgium, 2017. [Google Scholar]
- Nunes, J.K.; Stone, H.A. Introduction: Microfluidics. Chem. Rev. 2022, 122, 6919–6920. [Google Scholar] [CrossRef]
- Poonoosamy, J.; Lu, R.; Lönartz, M.I.; Deissmann, G.; Bosbach, D.; Yang, Y. A Lab on a Chip Experiment for Upscaling Diffusivity of Evolving Porous Media. Energies 2022, 15, 2160. [Google Scholar] [CrossRef]
- Poonoosamy, J.; Soulaine, C.; Burmeister, A.; Deissmann, G.; Bosbach, D.; Roman, S. Microfluidic flow-through reactor and 3D Raman imaging for in situ assessment of mineral reactivity in porous and fractured porous media. Lab. A Chip. 2020, 20, 2562–2571. [Google Scholar] [CrossRef]
- Whittaker, M.L.; Sun, W.; DeRocher, K.A.; Jayaraman, S.; Ceder, G.; Joester, D. Structural Basis for Metastability in Amorphous Calcium Barium Carbonate (ACBC). Adv. Funct. Mater. 2018, 28, 1704202. [Google Scholar] [CrossRef]
- Whittaker, M.L.; Sun, W.; Duggins, D.O.; Ceder, G.; Joester, D. Dynamic Barriers to Crystallization of Calcium Barium Carbonates. Cryst. Growth Des. 2021, 21, 4556–4563. [Google Scholar] [CrossRef]
- Cavanaugh, J.; Whittaker, M.L.; Joester, D. Crystallization kinetics of amorphous calcium carbonate in confinement. Chem. Sci. 2019, 10, 5039–5043. [Google Scholar] [CrossRef] [PubMed]
- Yashina, A.; Meldrum, F.; Demello, A. Calcium carbonate polymorph control using droplet-based microfluidics. Biomicrofluidics 2012, 6, 22001–2200110. [Google Scholar] [CrossRef] [PubMed]
- Radajewski, D.; Hunter, L.; He, X.; Nahi, O.; Galloway, J.; Meldrum, F. An Innovative Data Processing Method for Studying Nanoparticle Formation in Droplet Microfluidics using X-rays Scattering. Lab. A Chip. 2021, 21, 4498–4506. [Google Scholar] [CrossRef]
- Poonoosamy, J.; Westerwalbesloh, C.; Deissmann, G.; Mahrous, M.; Curti, E.; Churakov, S.V.; Klinkenberg, M.; Kohlheyer, D.; von Lieres, E.; Bosbach, D.; et al. A microfluidic experiment and pore scale modelling diagnostics for assessing mineral precipitation and dissolution in confined spaces. Chem. Geol. 2019, 528, 119264. [Google Scholar] [CrossRef]
- Poonoosamy, J.; Mahrous, M.; Curti, E.; Bosbach, D.; Deissmann, G.; Churakov, S.V.; Geisler, T.; Prasianakis, N. A lab-on-a-chip approach integrating in-situ characterization and reactive transport modelling diagnostics to unravel (Ba,Sr)SO4 oscillatory zoning. Sci. Rep. 2021, 11, 23678. [Google Scholar] [CrossRef]
- Shannon, R.D.; Prewitt, C.T. Revised values of effective ionic radii. Acta Crystallogr. Sect. B 1970, 26, 1046–1048. [Google Scholar] [CrossRef]
- Shannon, R.D.; Prewitt, C.T. Effective ionic radii in oxides and fluorides. Acta Crystallogr. Sect. B 1969, 25, 925–946. [Google Scholar] [CrossRef]
- Sun, W.; Jayaraman, S.; Chen, W.; Persson, K.A.; Ceder, G. Nucleation of metastable aragonite CaCO3 in seawater. Proc. Natl. Acad. Sci. USA 2015, 112, 3199–3204. [Google Scholar] [CrossRef]
- Zhang, Z.; Gao, Y.; Meldrum, F.C.; Shui, L.; Wang, Z.; Li, S.; Li, G. Investigating the Nucleation Kinetics of Calcium Carbonate Using a Zero-Water-Loss Microfluidic Chip. Cryst. Growth Des. 2020, 20, 2787–2795. [Google Scholar] [CrossRef]
- Ogino, T.; Suzuki, T.; Sawada, K. The formation and transformation mechanism of calcium carbonate in water. Geochim. Cosmochim. Acta 1987, 51, 2757–2767. [Google Scholar] [CrossRef]
- Marland, G. The stability of CaCO3·6H2O (ikaite). Geochim. Cosmochim. Acta 1975, 39, 83–91. [Google Scholar] [CrossRef]
- Plummer, L.N.; Busenberg, E. The solubilities of calcite, aragonite and vaterite in CO2-H2O solutions between 0 and 90 °C, and an evaluation of the aqueous model for the system CaCO3-CO2-H2O. Geochim. Cosmochim. Acta 1982, 46, 1011–1040. [Google Scholar] [CrossRef]
- Saito, A.; Kagi, H.; Marugata, S.; Komatsu, K.; Enomoto, D.; Maruyama, K.; Kawano, J. Incorporation of Incompatible Strontium and Barium Ions into Calcite (CaCO3) through Amorphous Calcium Carbonate. Minerals 2020, 10, 270. [Google Scholar] [CrossRef]
- Kulik, D.A.; Vinograd, V.L.; Paulsen, N.; Winkler, B. (Ca,Sr)CO3 aqueous–solid solution systems: From atomistic simulations to thermodynamic modelling. Phys. Chem. Earth Parts A/B/C 2010, 35, 217–232. [Google Scholar] [CrossRef]
- Kulik, D.A.; Wagner, T.; Dmytrieva, S.V.; Kosakowski, G.; Hingerl, F.F.; Chudnenko, K.V.; Berner, U.R. GEM-Selektor geochemical modeling package: Revised algorithm and GEMS3K numerical kernel for coupled simulation codes. Comput. Geosci. 2013, 17, 1–24. [Google Scholar] [CrossRef]
- Hull, H.; Turnbull, A.G. A thermochemical study of monohydrocalcite. Geochim. Cosmochim. Acta 1973, 37, 685–694. [Google Scholar] [CrossRef]
- Bischoff, J.L.; Fitzpatrick, J.A.; Rosenbauer, R.J. The Solubility and Stabilization of Ikaite (CaCO3·6H2O) from 0° to 25 °C: Environmental and Paleoclimatic Implications for Thinolite Tufa. J. Geol. 1993, 101, 21–33. [Google Scholar] [CrossRef]
- Brečević, L.; Nielsen, A.E. Solubility of amorphous calcium carbonate. J. Cryst. Growth 1989, 98, 504–510. [Google Scholar] [CrossRef]
- Busenberg, E.; Plummer, L.N. The solubility of BaCO3(cr) (witherite) in CO2-H2O solutions between 0 and 90 °C, evaluation of the association constants of BaHCO3+(aq) and BaCO30(aq) between 5 and 80 °C, and a preliminary evaluation of the thermodynamic properties of Ba2+(aq). Geochim. Cosmochim. Acta 1986, 50, 2225–2233. [Google Scholar] [CrossRef]
- Toby, B.; Dreele, R. GSAS-II: The Genesis of a Modern Open-Source All-Purpose Crystallography Software Package. J. Appl. Crystallogr. 2013, 46, 544–549. [Google Scholar] [CrossRef]
- Prieto, M. Nucleation and supersaturation in porous media (revisited). Mineral. Mag. 2014, 78, 1437–1447. [Google Scholar] [CrossRef]
- Prieto, M.; Fernandez-Diaz, L. Factors controlling the kinetics of crystallization: Supersaturation evolution in a porous medium. Application to barite crystallization. Geol. Mag. 1990, 127, 485–495. [Google Scholar] [CrossRef]
- Prieto, M.; Fernández-Diaz, L.; López-Andrés, S. Spatial and evolutionary aspects of nucleation in diffusing-reacting systems. J. Cryst. Growth 1991, 108, 770–778. [Google Scholar] [CrossRef]
- Prieto, M.; Fernández-González, A.; Putnis, A.; Fernández-Díaz, L. Nucleation, growth, and zoning phenomena in crystallizing (Ba,Sr)CO3, Ba(SO4,CrO4), (Ba,Sr)SO4, and (Cd,Ca)CO3 solid solutions from aqueous solutions. Geochim. Cosmochim. Acta 1997, 61, 3383–3397. [Google Scholar] [CrossRef]
- Prieto, M.; Putnis, A.; Fernandez-Diaz, L. Crystallization of solid solutions from aqueous solutions in a porous medium: Zoning in (Ba, Sr)SO4. Geol. Mag. 1993, 130, 289–299. [Google Scholar] [CrossRef]
- Putnis, A.; Prieto, M.; Fernandez-Diaz, L. Fluid supersaturation and crystallization in porous media. Geol. Mag. 1995, 132, 1–13. [Google Scholar] [CrossRef]
- Lead, J.R.; Starchev, K.; Wilkinson, K.J. Diffusion Coefficients of Humic Substances in Agarose Gel and in Water. Environ. Sci. Technol. 2003, 37, 482–487. [Google Scholar] [CrossRef]
- Wehrmeister, U.; Jacob, D.; Soldati, A.; Hofmeister, W. Vaterite in freshwater cultured pearls from China and Japan. J. Gemmol. 2007, 31, 399–416. [Google Scholar] [CrossRef]
- Chessin, H.; Hamilton, W.C.; Post, B. Position and thermal parameters of oxygen atoms in calcite. Acta Crystallogr. 1965, 18, 689–693. [Google Scholar] [CrossRef]
- Shannon, R. Revised effective ionic radii and systematic studies of interatomic distances in halides and chalcogenides. Acta Crystallogr. Sect. A 1976, 32, 751–767. [Google Scholar] [CrossRef]
- Christy, A.G. A Review of the Structures of Vaterite: The Impossible, the Possible, and the Likely. Cryst. Growth Des. 2017, 17, 3567–3578. [Google Scholar] [CrossRef]
- Frank, P.; Incropera, D.P.D.; Theodore, L.B.; Adrienne, S.L. Incropera’s Principles of Heat and Mass Transfer, 8th ed.; Global Edition; Wiley: Hoboken, NJ, USA, 2017. [Google Scholar]
- Meldrum, F.C.; O’Shaughnessy, C. Crystallization in Confinement. Adv. Mater. 2020, 32, 2001068. [Google Scholar] [CrossRef] [PubMed]
- Prasianakis, N.I.; Haller, R.; Mahrous, M.; Poonoosamy, J.; Pfingsten, W.; Churakov, S.V. Neural network based process coupling and parameter upscaling in reactive transport simulations. Geochim. Cosmochim. Acta 2020, 291, 126–143. [Google Scholar] [CrossRef]
Disclaimer/Publisher’s Note: The statements, opinions and data contained in all publications are solely those of the individual author(s) and contributor(s) and not of MDPI and/or the editor(s). MDPI and/or the editor(s) disclaim responsibility for any injury to people or property resulting from any ideas, methods, instructions or products referred to in the content. |
© 2023 by the authors. Licensee MDPI, Basel, Switzerland. This article is an open access article distributed under the terms and conditions of the Creative Commons Attribution (CC BY) license (https://creativecommons.org/licenses/by/4.0/).