


Classification of Coal Bursting Liability Based on Support Vector Machine and Imbalanced Sample Set


Abstract
:1. Introduction
2. Methods
2.1. SVM
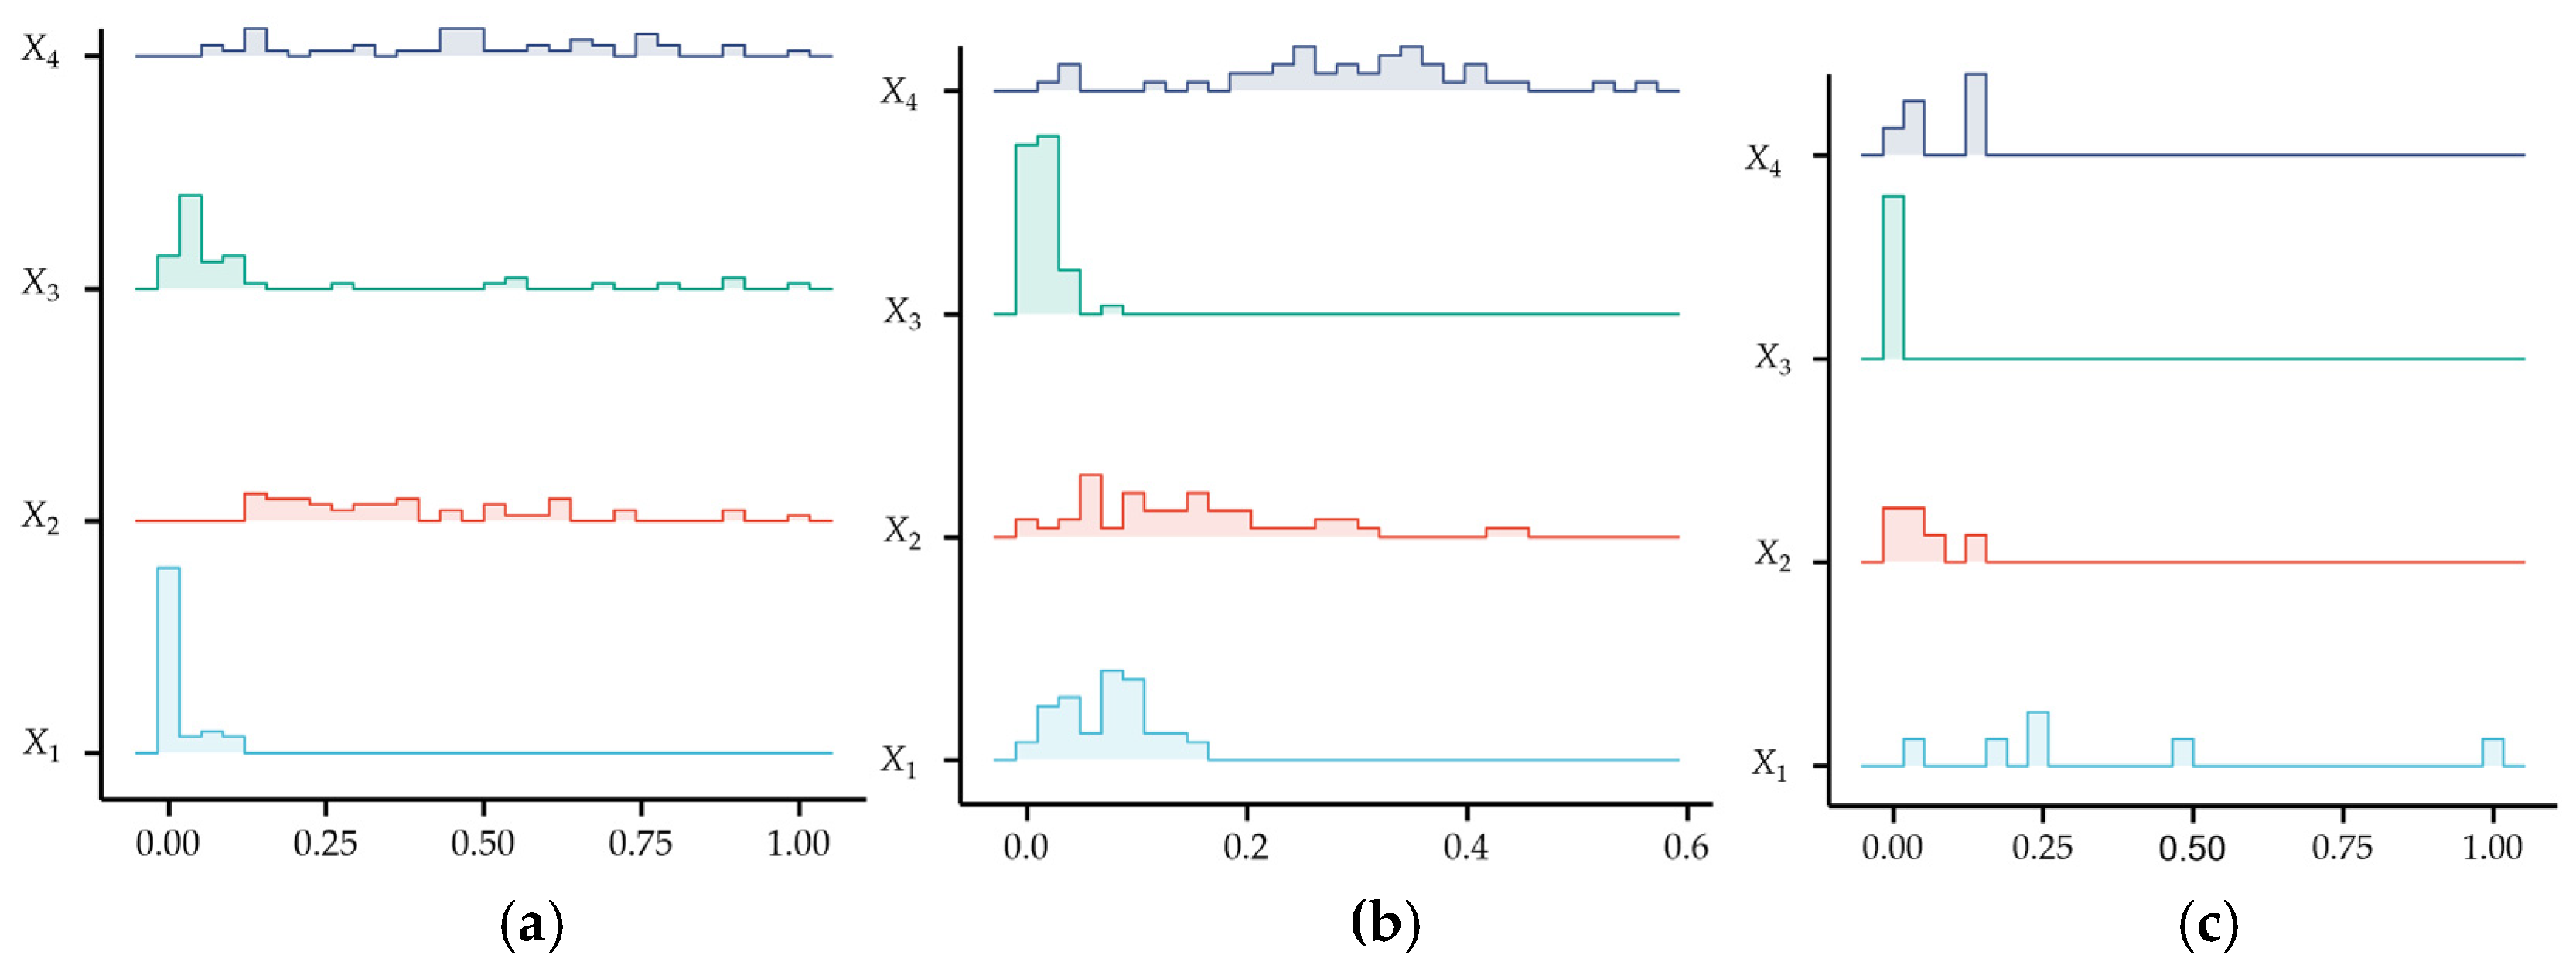
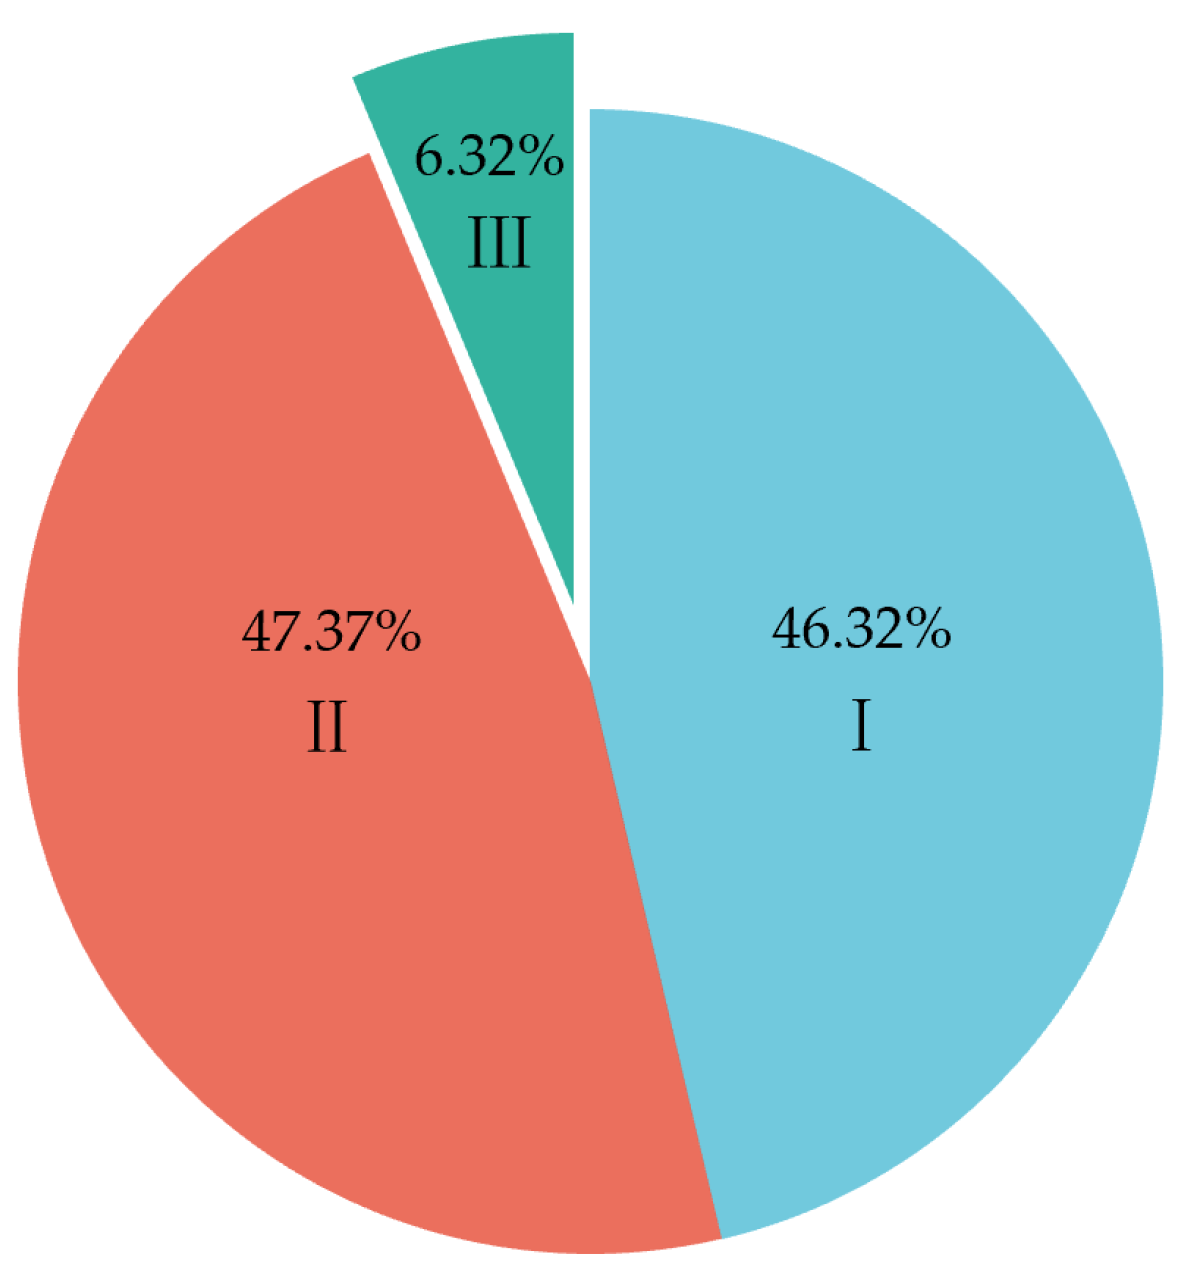
2.2. Data Processing
- (1)
- Sample Dataset
- (2)
- Data Standardization
- (3)
- Data Segmentation
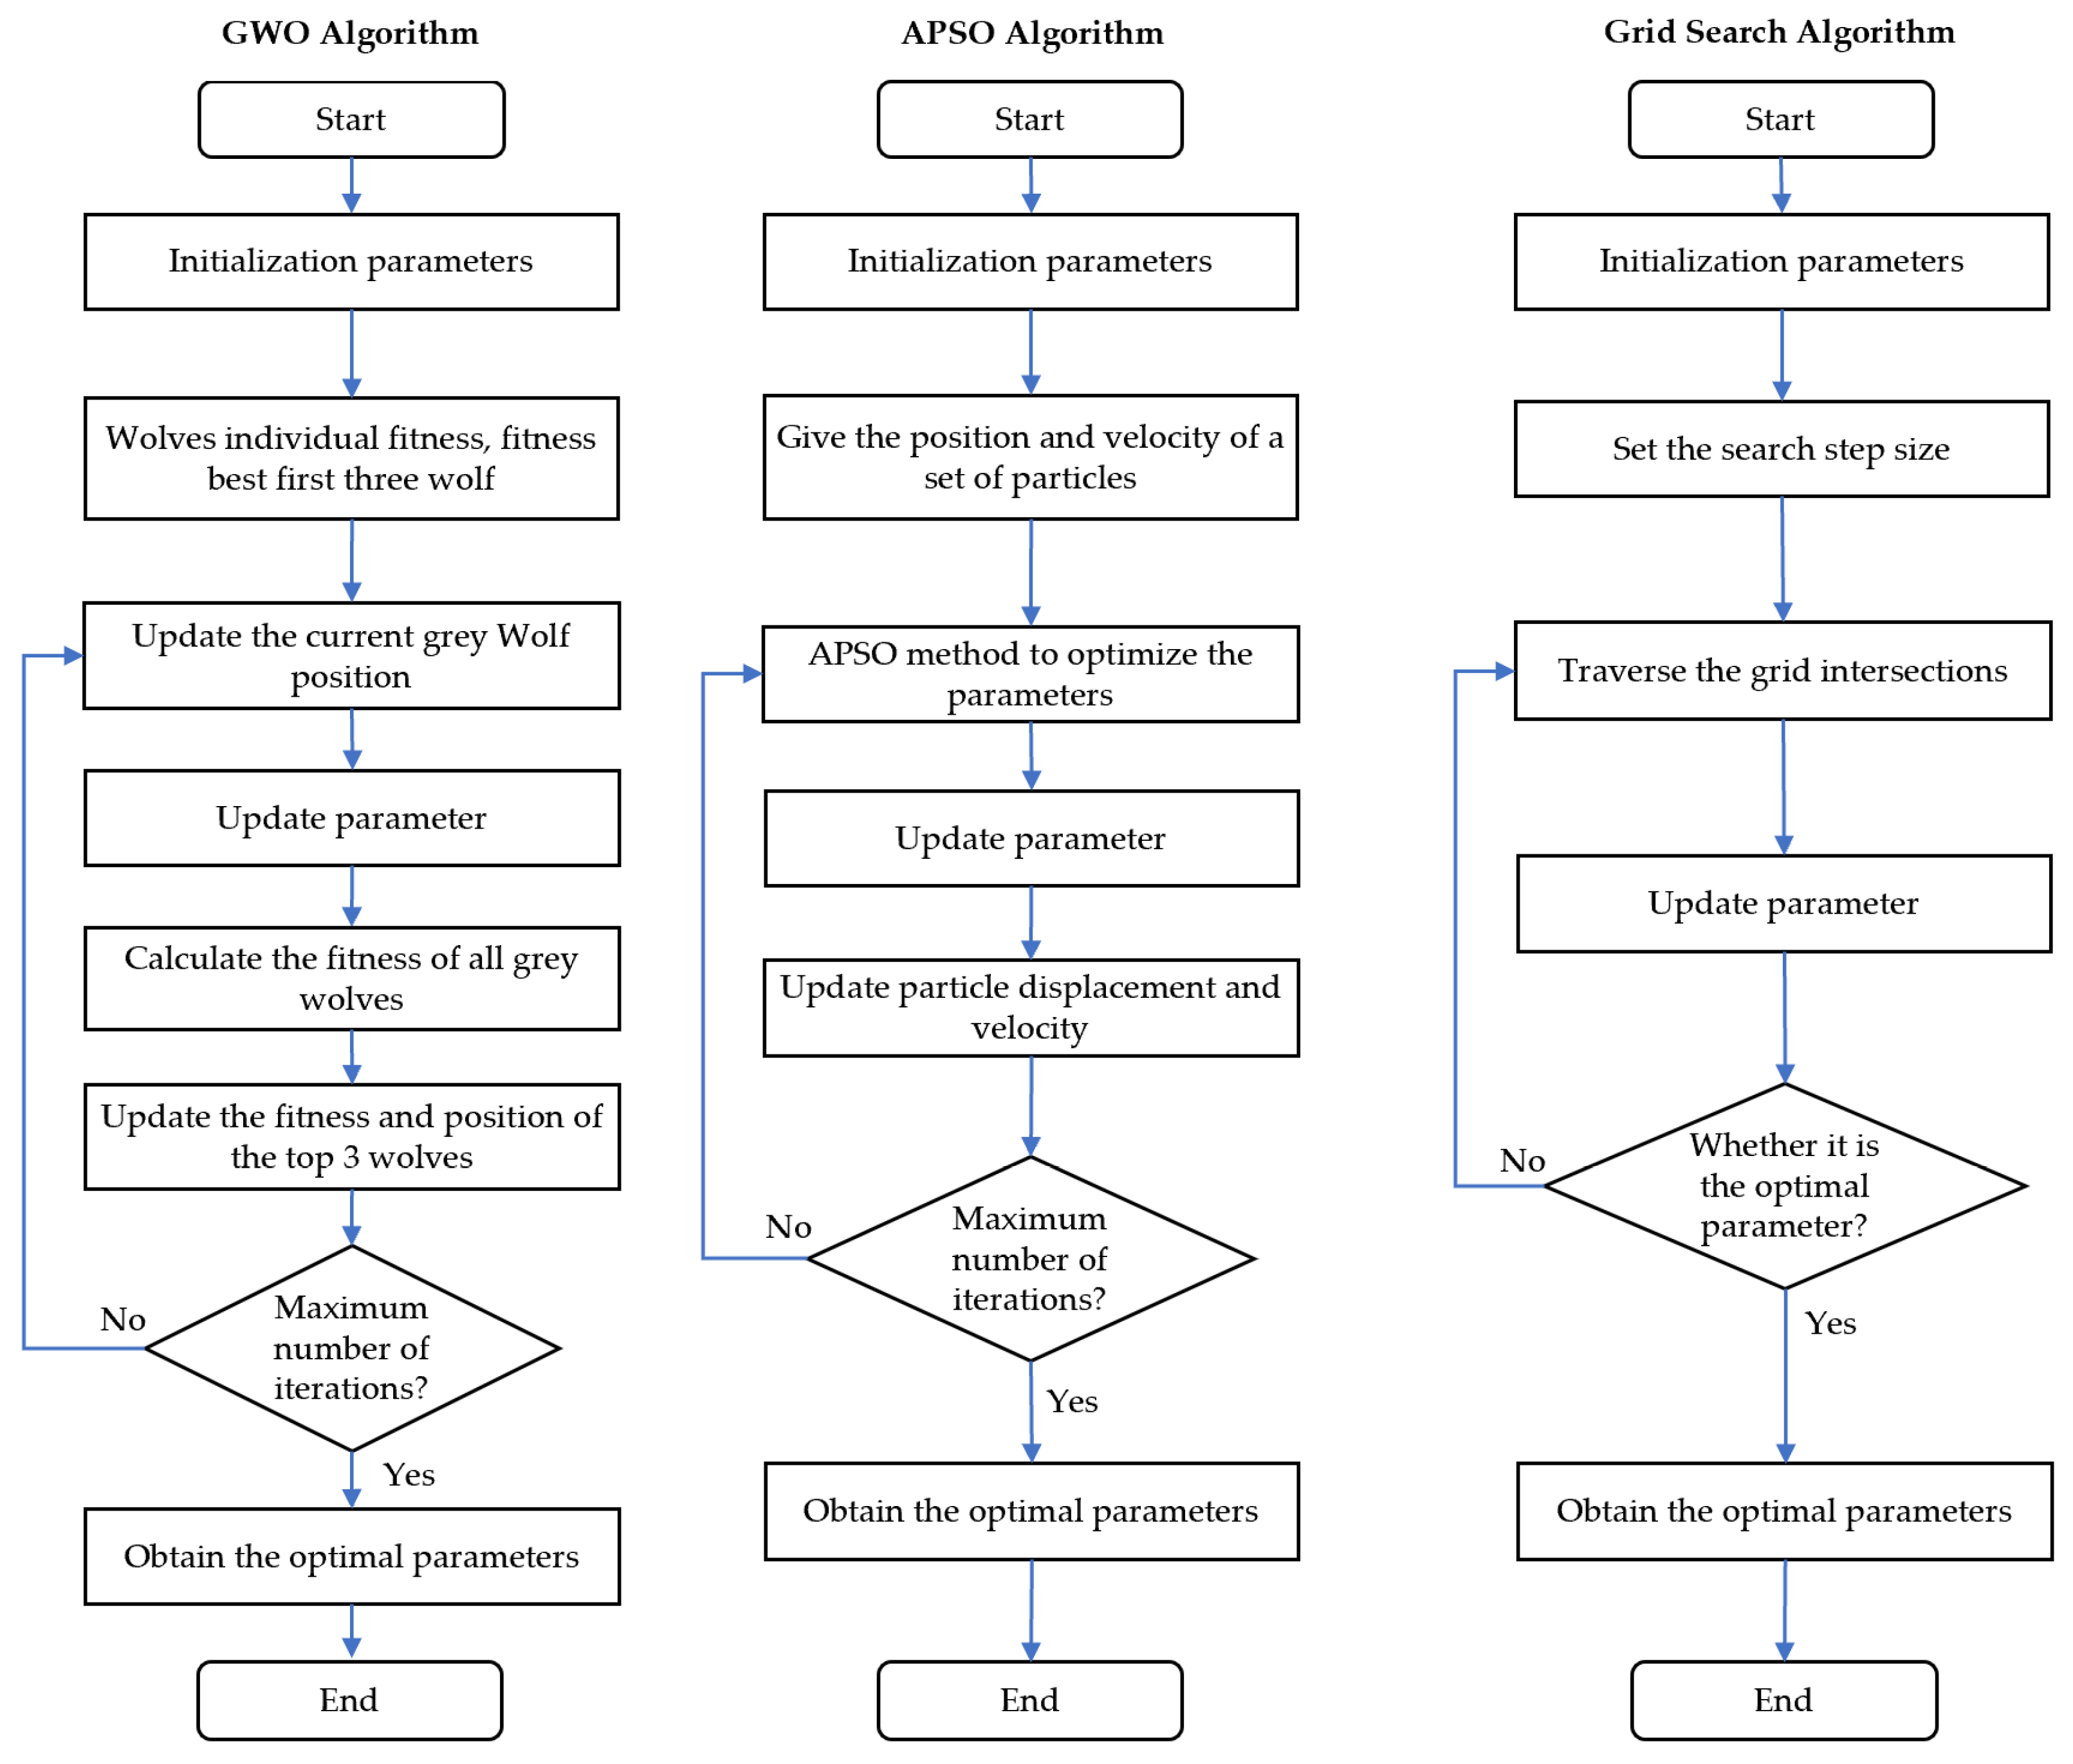
2.3. Parameters Optimization
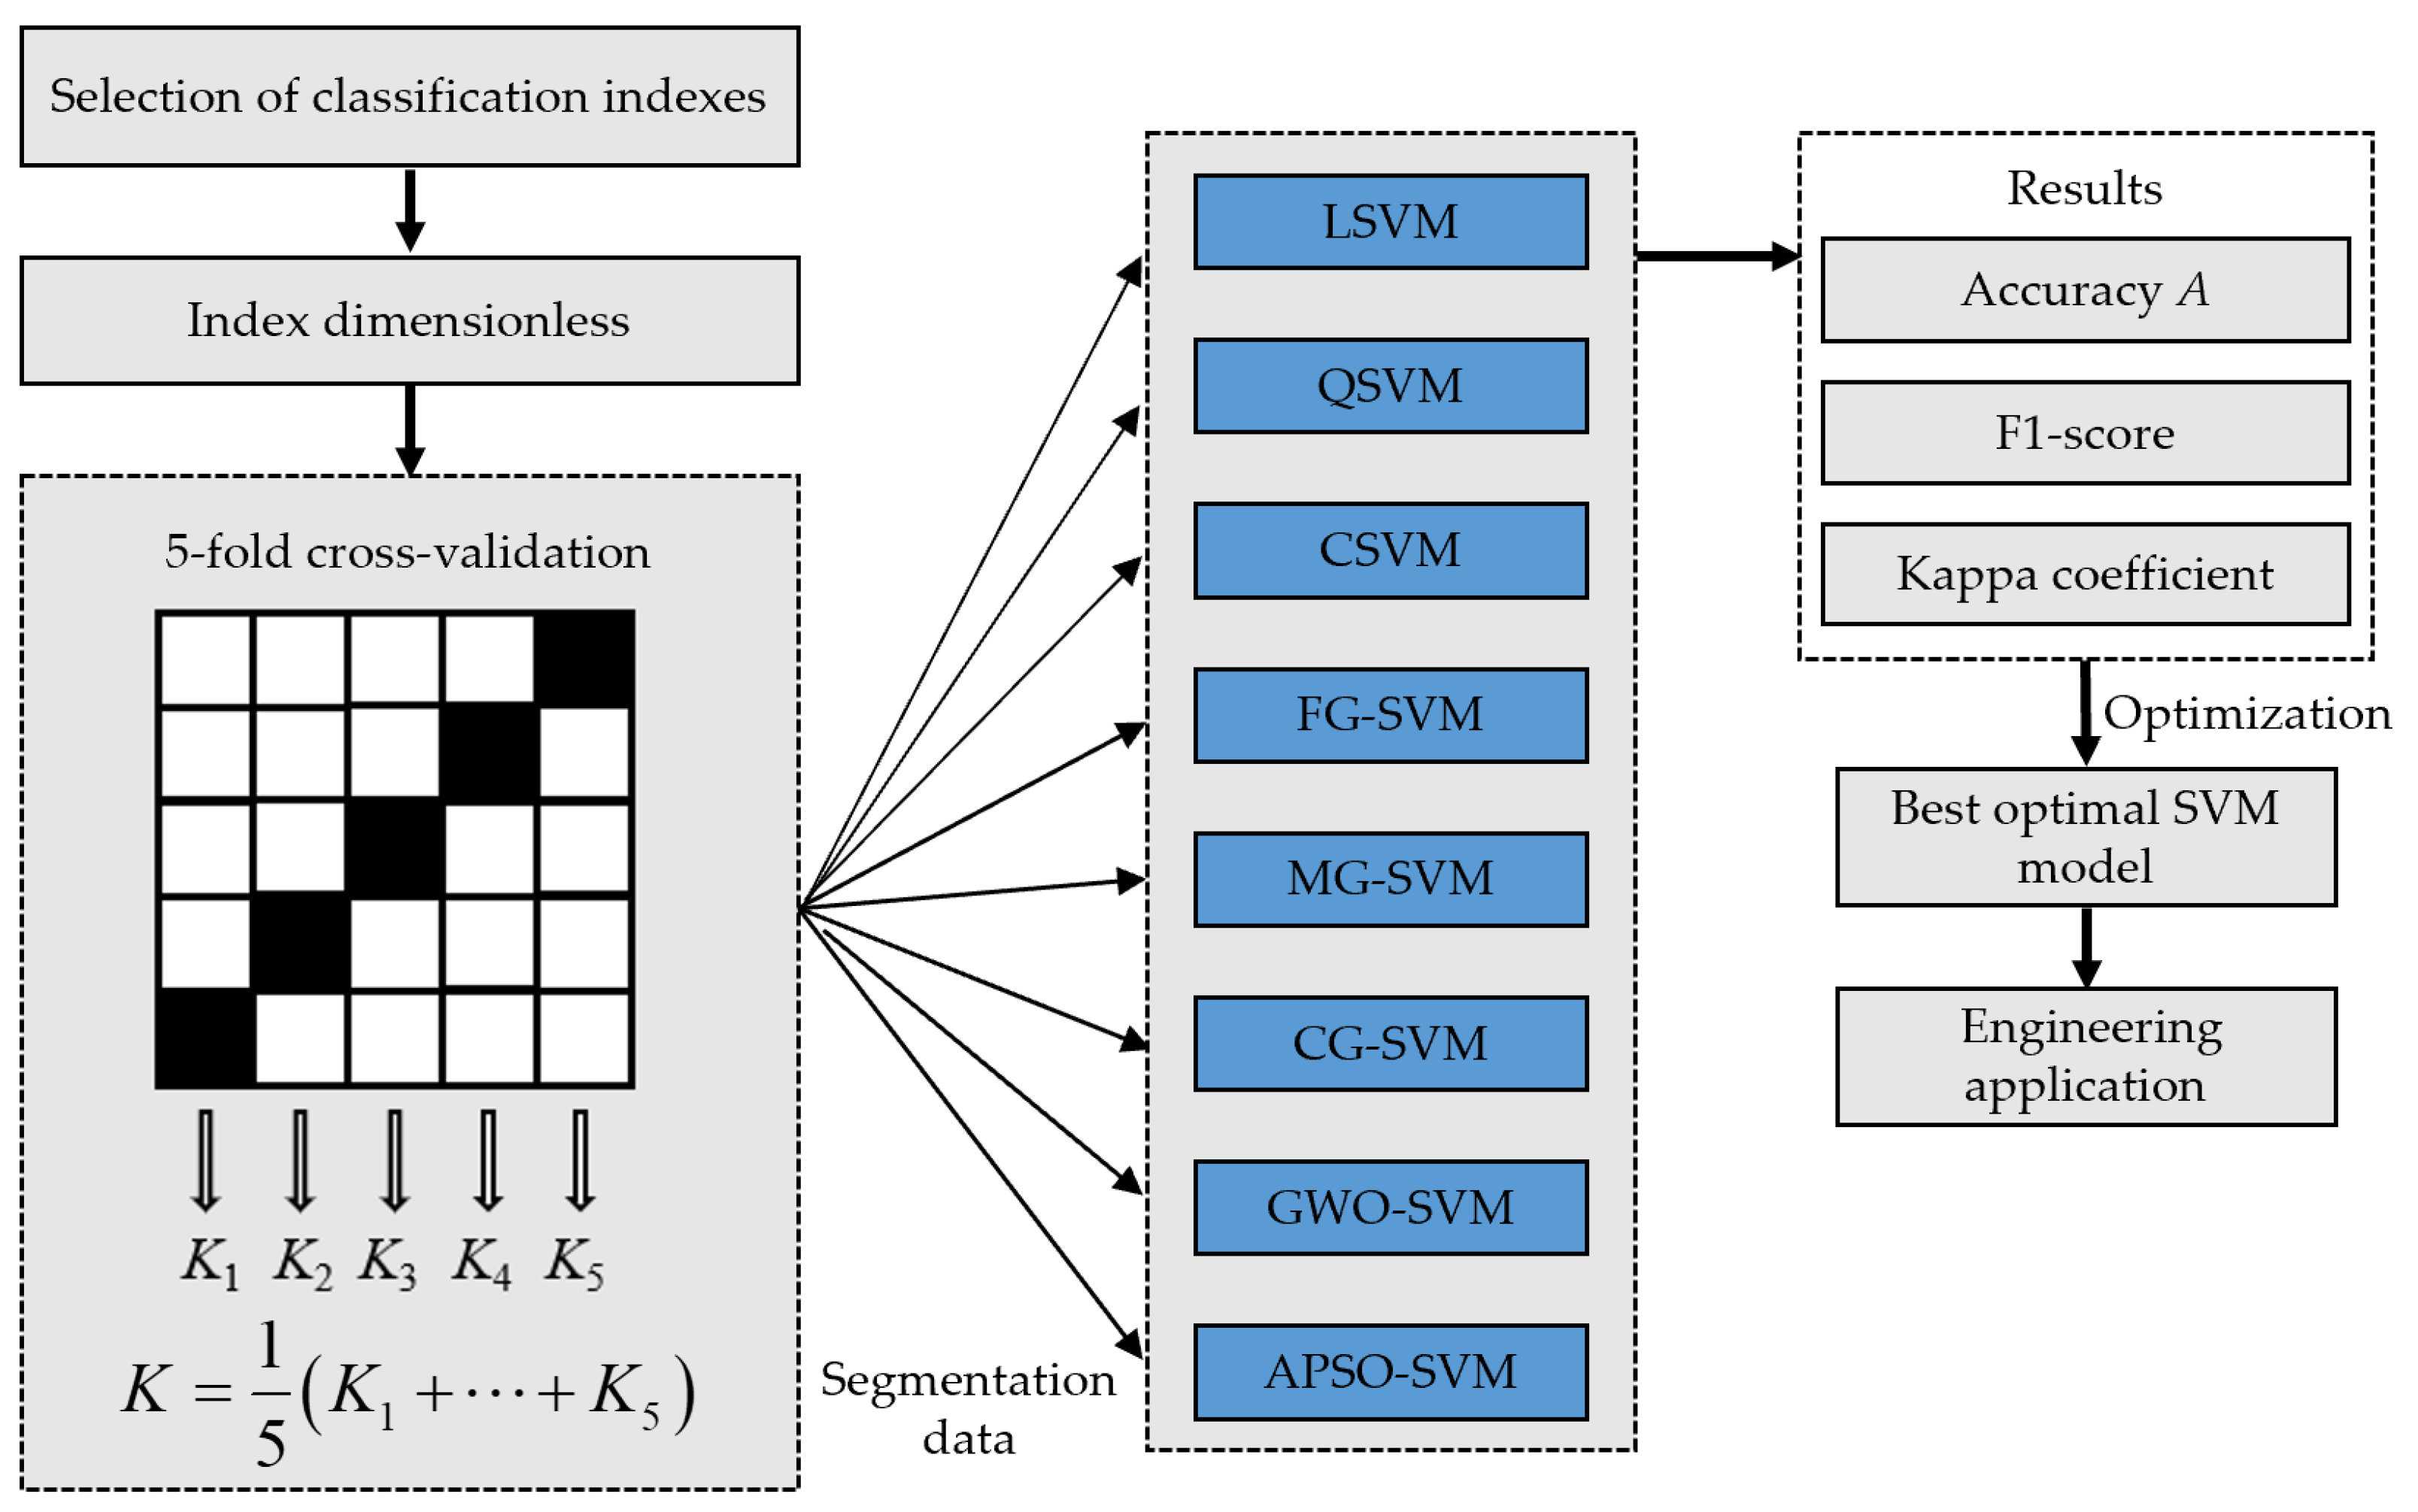
2.4. Research Route
3. Results and Discussion
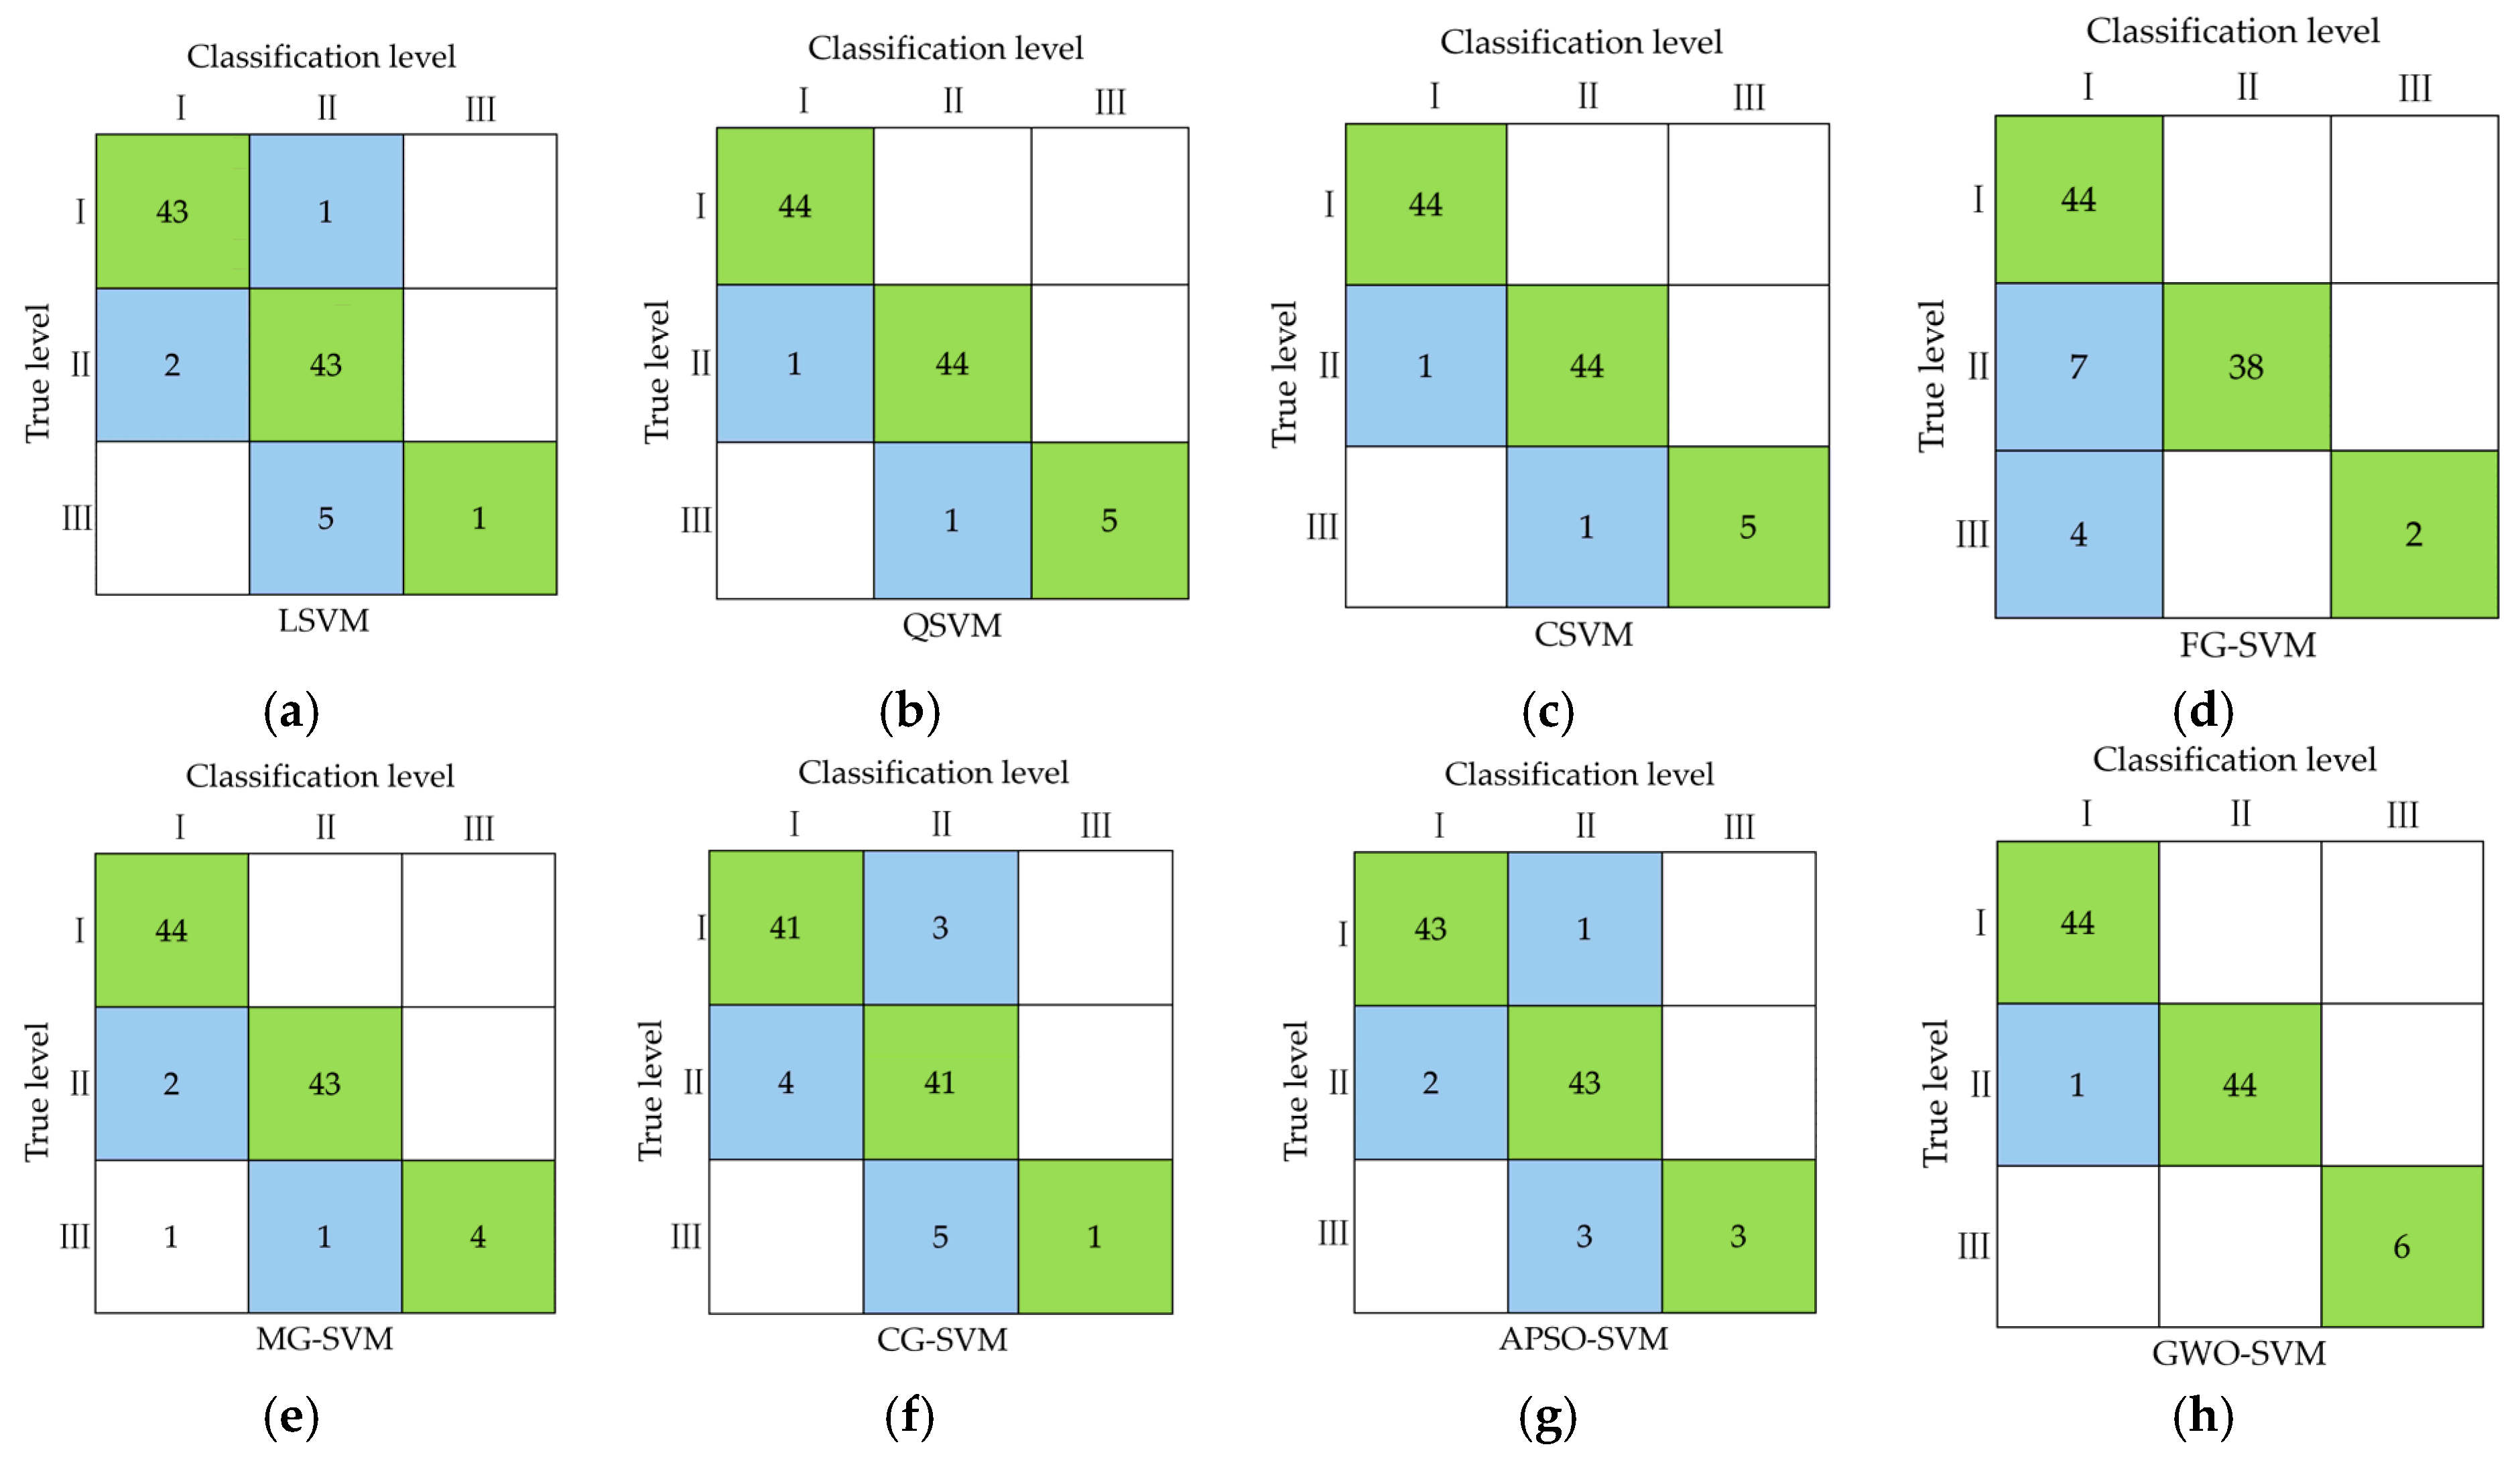
3.1. Classified Results
3.2. Performance Evaluation
3.2.1. Evaluation Index
- (1)
- Classification Accuracy A
- (2)
- F1-Score
- (3)
- Kappa Coefficient
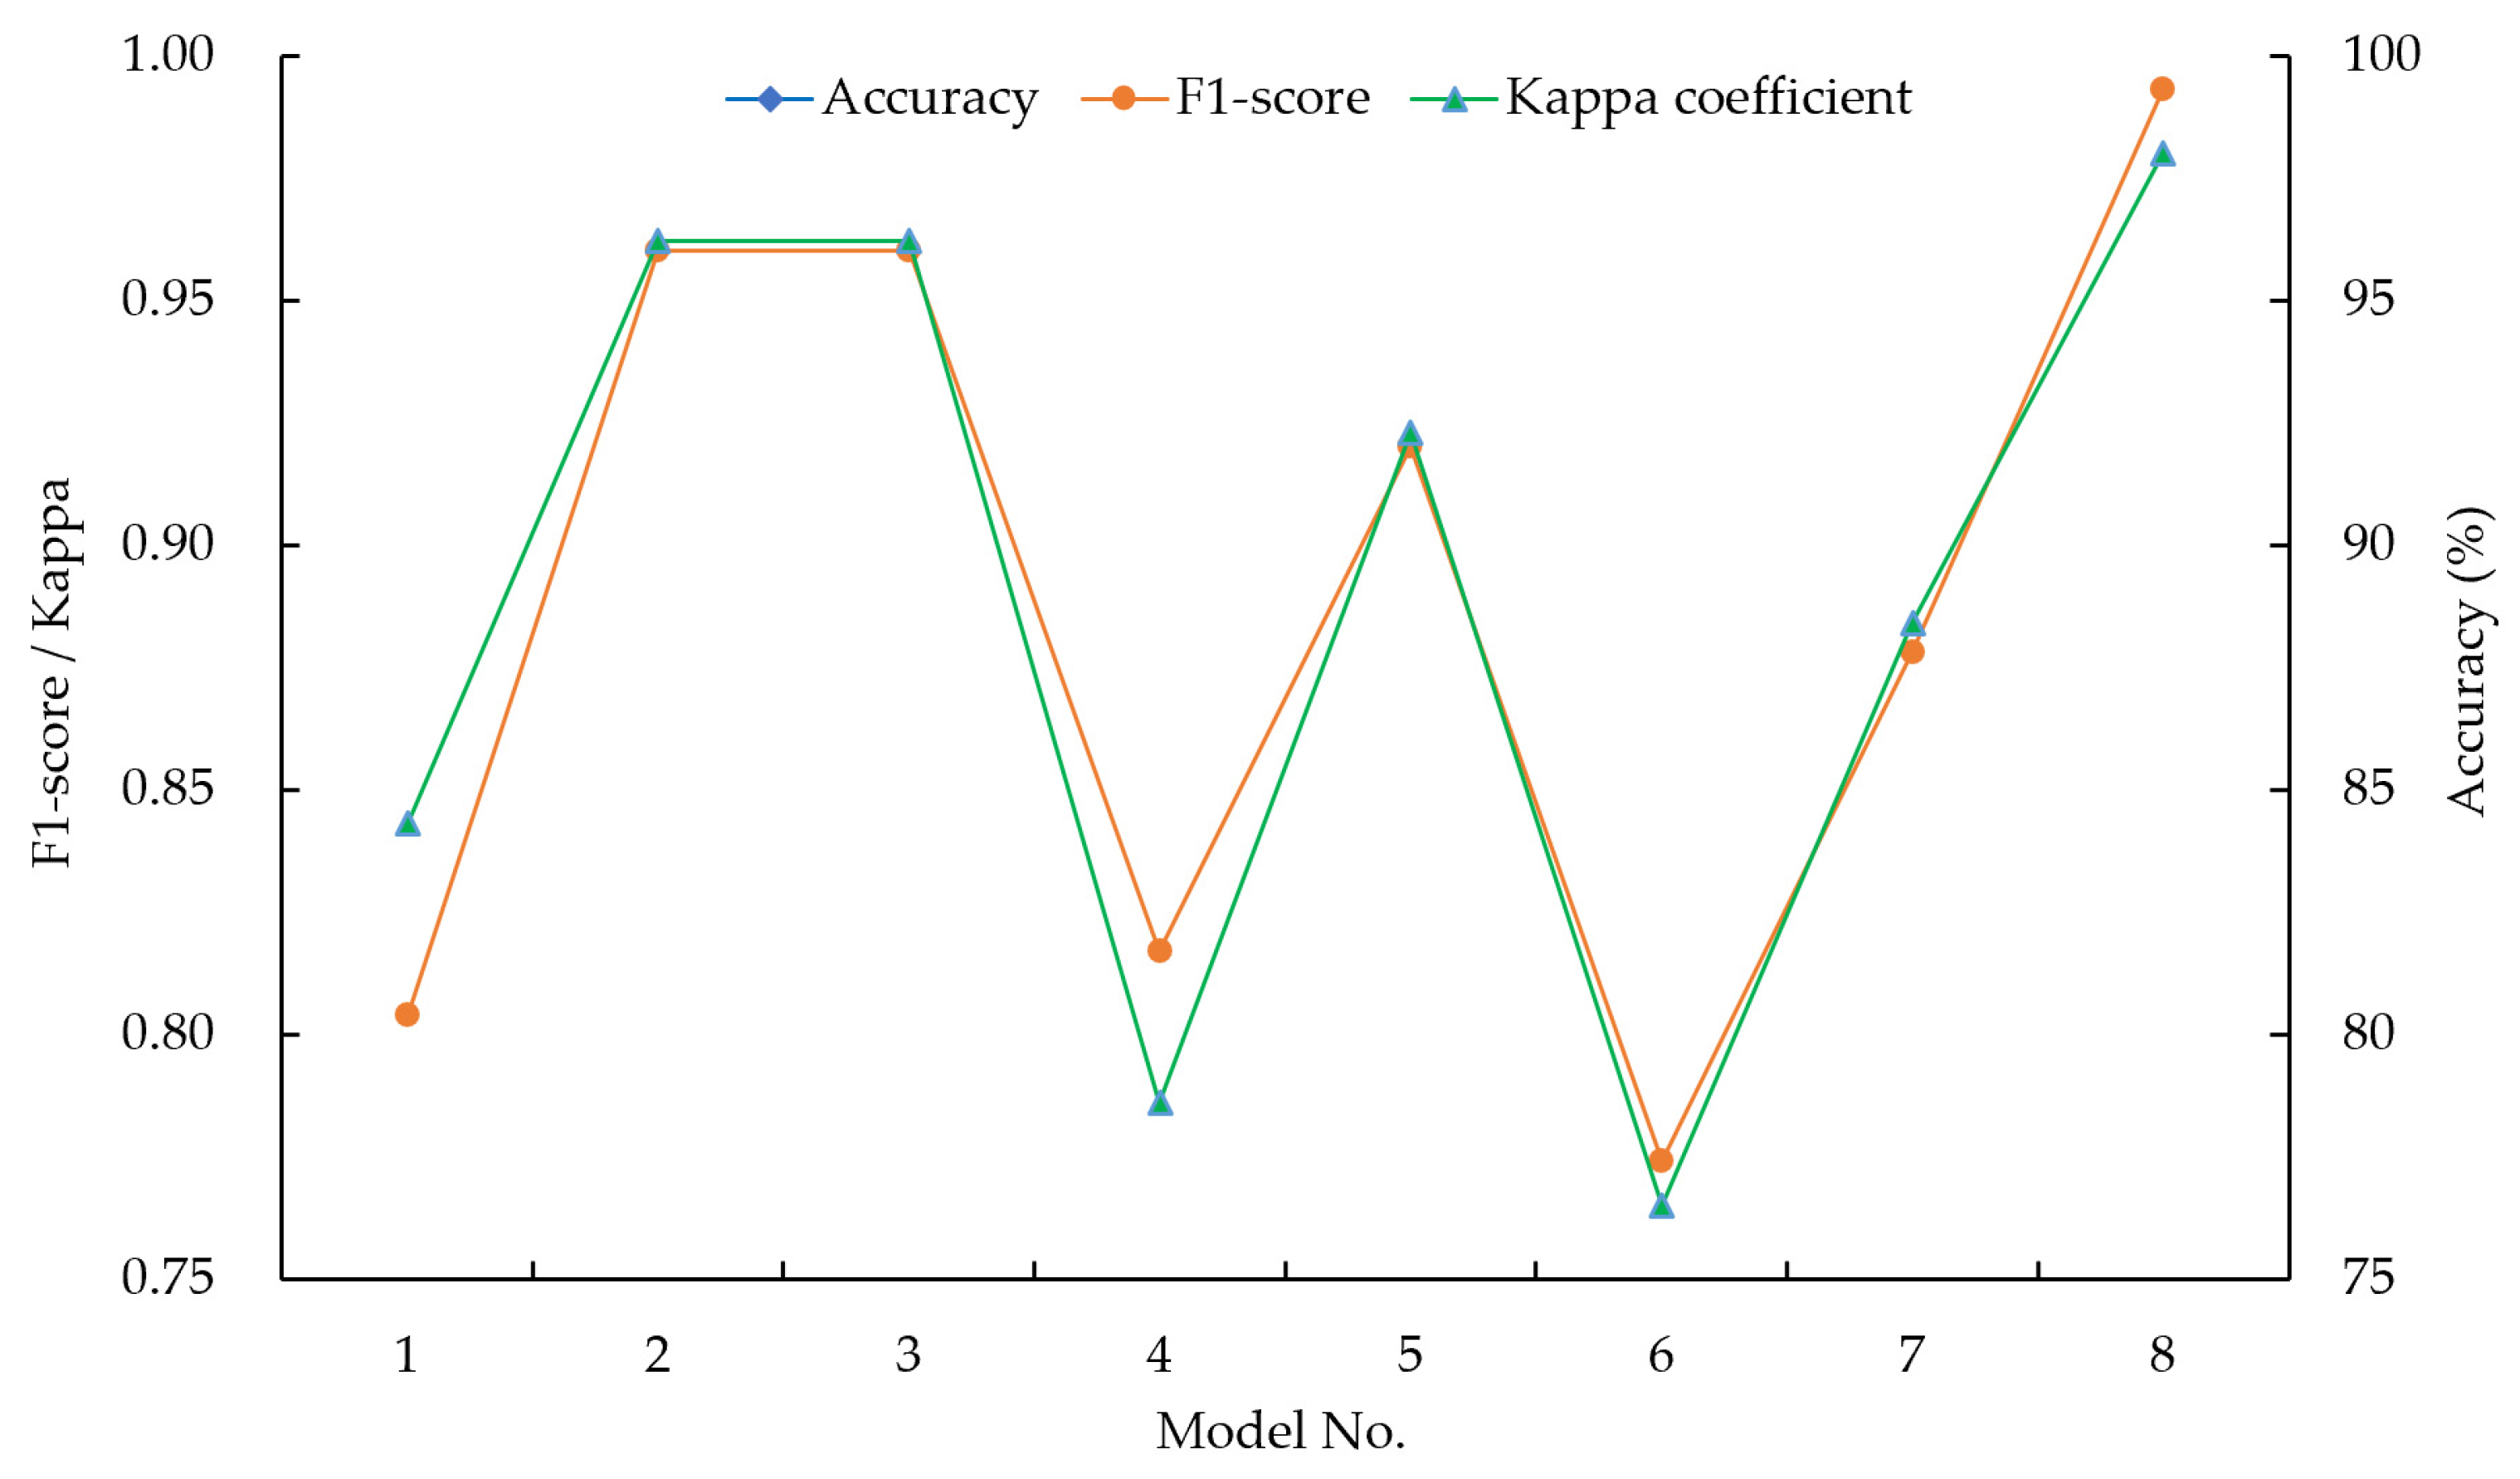
3.2.2. Evaluation Result
3.3. Model Analysis and Optimization
- (1)
- Model Analysis
- (2)
- Model Optimization
4. Engineering Application
- (1)
- 4# Coal Seam of Xiaozhuang Coal Mine
- (2)
- 1# Coal Seam of Wanfeng Coal Mine
5. Conclusions
Author Contributions
Funding
Data Availability Statement
Conflicts of Interest
References
- Cao, A.Y.; Liu, Y.Q.; Jiang, S.Q.; Hao, Q.; Peng, Y.J.; Bai, X.X.; Yang, X. Numerical investigation on influence of two combined faults and its structure features on rock burst mechanism. Minerals 2021, 11, 1438. [Google Scholar] [CrossRef]
- Mottahedi, A.; Ataei, M. Fuzzy fault tree analysis for coal burst occurrence probability in underground coal mining. Tunn. Undergr. Space Technol. 2019, 83, 165–174. [Google Scholar] [CrossRef]
- Vardar, O.; Zhang, C.G.; Canbulat, I.; Hebblewhite, B. A semi-quantitative coal burst risk classification system. Int. J. Min. Sci. Technol. 2018, 28, 721–727. [Google Scholar] [CrossRef]
- Zhang, C.G.; Canbulat, I.; Hebblewhite, B.; Ward, C.R. Assessing coal burst phenomena in mining and insights into directions for future research. Int. J. Coal Geol. 2017, 179, 28–44. [Google Scholar] [CrossRef]
- Mark, C. Coal bursts that occur during development: A rock mechanics enigma. Int. J. Min. Sci. Technol. 2018, 28, 35–42. [Google Scholar] [CrossRef]
- He, S.Q.; He, X.Q.; Song, D.Z.; Li, Z.L.; Chen, J.Q.; Xue, Y.R.; Li, Y. Multi-parameter integrated early warning model and an intelligent identification cloud platform of rockburst. J. China Univ. Min. Technol. 2022, 51, 850–862. [Google Scholar]
- Bieniawski, Z.T.; Denkhaus, H.G.; Vogler, U.W. Failure of fractured rock. Int. J. Min. Sci. Technol. 1969, 6, 323–330. [Google Scholar] [CrossRef]
- Bieniawsk, Z.T. Mechanism of brittle fracture of rocks (Part I, П and Ш). Int. J. Min. Sci. Technol. 1967, 4, 395–406, 425–426. [Google Scholar]
- Ju, W.J.; Lu, Z.G.; Gao, F.Q.; Zhao, Y.X.; Li, W.Z.; Sun, Z.Y.; Hao, X.J. Research progress and comprehensive quantitative evaluation index of coal rock bursting liability. Chin. J. Rock Mech. Eng. 2021, 40, 1839–1856. [Google Scholar]
- Li, Y.F. Comparison and Optimization of Multi-Index Evaluation Models for Coal Sample Bursting Liability Classification. Master’s Thesis, Kunming University of Science and Technology, Kunming, China, 2022. [Google Scholar]
- Su, C.D.; Yuan, R.F.; Zhai, X.X. Experimental research on bursting liability index of coal samples of Chengjiao coal mine. Chin. J. Rock Mech. Eng. 2013, 32, 3696–3704. [Google Scholar]
- Yang, D.S.; Chen, W.Z.; Yang, W.M.; Li, S.C.; Li, Y.C.; Zhun, W.S. Stability analysis of surrounding rock mass of Longtan underground caverns. Rock Soil Mech. 2004, 3, 391–395. [Google Scholar]
- Cook, N.G.W.; Hoek, E.; Pretorius, J.P.G.; Ortlepp, W.D.; Salamon, H.D.G. Rock mechanics applied to the study of rockbursts. J. S. Afr. Inst. Min. Metall. 1966, 66, 435–528. [Google Scholar]
- GT/T25217.2-2010; The Professional Standards Compilation Group of People’s Republic of China. Classification and Laboratory Test Method on Bursting Liability of Coal. Standards Press of China: Beijing, China, 2010.
- Wang, C. Research of Rockburst Risk Comprehensive Evaluation Method Based on Unascertained Measurement Model and Application. Ph.D. Thesis, China University of Mining and Technology, Xuzhou, China, 2011. [Google Scholar]
- Zhang, X.Y.; Kang, L.X.; Yang, S.S. Study on the distribution situation of REE in some tailing ore and its synthctic recovery. Saf. Coal Mines 2009, 40, 74–76. [Google Scholar]
- Zhou, X.J.; Xian, X.F. Relationship between rock burst tendency and residual energy release rate. West-China Explor. Eng. 1999, 1, 46–50. [Google Scholar]
- Wang, H.T.; Xu, J.; Wei, F.S.; Xian, X.F. Evalutaion of tendency indexes of coal or rock burst. J. Min. Saf. Eng. 1999, Z1, 204–207+210–239. [Google Scholar]
- Zhou, X.J. Study on the Rockburst Conditions and It’s Control Theory and Application. Ph.D. Thesis, Chongqing University, Chongqing, China, 1997. [Google Scholar]
- Wu, S.C.; Li, L.P.; Zhang, X.P. Rock Mechanics; Higher Education Press: Beijing, China, 2021. [Google Scholar]
- Wang, J.A.; Park, H.D. Comprehensive prediction of rock burst based on analysis of strain energy in rock. Tunn. Undergr. Space Technol. 2001, 16, 49–57. [Google Scholar] [CrossRef]
- Xu, J.K.; Wang, E.Y.; Wang, C. Study of rock burst tendency of coal based on uncertainty measurement theory. Saf. Coal Mines 2011, 42, 19–22. [Google Scholar]
- Wang, C.; Wang, E.Y.; Liu, X.F. Classification of rock burst tendency of coal seam based on entropy and ideal point method. J. Liaoning Tech. Univ. Nat. Sci. Ed. 2012, 31, 838–841. [Google Scholar]
- Jia, X.W.; Wang, E.Y. Coal burst tendency classification based on attribute mathematical model. Saf. Coal Mines 2014, 31, 838–841. [Google Scholar]
- Guo, J.D. Application of variable weight and grey classification recognition model in rock burst tendency evaluation of coal seam. J. North China Inst. Sci. Technol. 2017, 14, 44–49. [Google Scholar]
- Wang, C.; Song, D.Z.; Zhang, C.L.; Liu, L.; Zhou, Z.H.; Huang, X.C. Research on the classification model of coal’s bursting liability based on database with large samples. Arab. J. Geosci. 2019, 12, 411. [Google Scholar] [CrossRef]
- Brierley, S.D.; Chiasson, J.N.; Lee, E.B.; Zak, S. On stability independent of delay for linear systems. IEEE Trans. Autom. Control 1982, 27, 252–254. [Google Scholar] [CrossRef]
- Park, S.; Jung, D.; Nguyen, H.; Choi, Y. Diagnosis of problems in truck ore transport operations in underground mines using various machine learning models and data collected by internet of things systems. Minerals 2021, 11, 1128. [Google Scholar] [CrossRef]
- Li, Y.F.; Wang, C.; Xu, J.K.; Zhou, Z.H.; Xu, J.H.; Chen, J.W. Rockburst prediction based on the KPCA-APSO-SVM model and its engineering application. Shock Vib. 2021, 2021, 7968730. [Google Scholar] [CrossRef]
- Zhao, H. Research on rockburst risk assessment and prevention and control design in Xiaozhuang coal mine. Shaanxi Coal 2022, 41, 100–104+148. [Google Scholar]
- Du, X.J. Wanfeng coal mine 1# coal seam burst tendency determination and analysis of research. Energy Technol. Manag. 2022, 47, 108–110. [Google Scholar]


| No. | Index | Engineering Guidance Level | No. | Index | Engineering Guidance Level | ||||||
|---|---|---|---|---|---|---|---|---|---|---|---|
| DT/ms | WET | KE | RC/Mpa | DT/ms | WET | KE | RC/Mpa | ||||
| 1 | 161 | 7.1 | 7.08 | 25.6 | I | 49 | 193 | 1.14 | 5.74 | 12.5 | II |
| 2 | 33 | 5.2 | 69 | 2.84 | I | 50 | 6 | 9.1 | 1.14 | 2.1 | II |
| 3 | 4 | 4.85 | 112 | 6.3 | I | 51 | 5 | 6.3 | 1.9 | 2.01 | II |
| 4 | 7 | 4.8 | 96 | 5.8 | I | 52 | 66 | 4 | 1.7 | 1.8 | II |
| 5 | 7 | 5.9 | 67 | 5.4 | I | 53 | 77 | 5.8 | 4.6 | 1.4 | II |
| 6 | 13 | 6.5 | 123 | 5.1 | I | 54 | 300 | 2.76 | 2.74 | 11.8 | II |
| 7 | 14 | 3.4 | 66 | 5.67 | I | 55 | 351 | 2.63 | 1.64 | 13 | II |
| 8 | 14 | 4.1 | 112 | 3.23 | I | 56 | 255 | 3.4 | 3.7 | 11.2 | II |
| 9 | 22 | 8.2 | 87 | 4.3 | I | 57 | 212 | 4.34 | 0.88 | 7.31 | II |
| 10 | 224 | 6.44 | 6.32 | 18.6 | I | 58 | 363 | 6.02 | 1.34 | 8.61 | II |
| 11 | 34 | 5.15 | 6.5 | 17.4 | I | 59 | 140 | 3.19 | 3.34 | 13.3 | II |
| 12 | 267 | 12.4 | 0.87 | 24.8 | I | 60 | 249 | 2.15 | 1.84 | 12 | II |
| 13 | 42 | 14.4 | 3.63 | 29 | I | 61 | 53 | 6.62 | 4.32 | 9.52 | II |
| 14 | 13 | 3.67 | 5.67 | 29.2 | I | 62 | 138 | 0.968 | 3.54 | 10 | II |
| 15 | 45 | 4.34 | 5.99 | 22.6 | I | 63 | 82 | 4.78 | 10.2 | 13.9 | II |
| 16 | 316 | 8.1 | 1.4 | 16.7 | I | 64 | 340 | 4.58 | 1.26 | 15.8 | II |
| 17 | 68 | 12.7 | 6.73 | 14.6 | I | 65 | 275 | 3.53 | 3.56 | 13.1 | II |
| 18 | 346 | 11.3 | 6.45 | 15.2 | I | 66 | 306 | 1.63 | 2.06 | 9.93 | II |
| 19 | 45 | 12.3 | 12.6 | 18.8 | I | 67 | 55 | 4.67 | 4.93 | 16 | II |
| 20 | 33 | 10.3 | 9.84 | 12.1 | I | 68 | 301 | 3.84 | 2.47 | 10.2 | II |
| 21 | 20 | 9.43 | 8.72 | 16.5 | I | 69 | 92 | 4.3 | 4.53 | 14.7 | II |
| 22 | 54 | 19.6 | 1.29 | 17.3 | I | 70 | 252 | 3.11 | 1.93 | 6.51 | II |
| 23 | 12 | 3.6 | 2.3 | 37.7 | I | 71 | 216 | 2.62 | 1.81 | 13.1 | II |
| 24 | 41 | 11.9 | 11.8 | 5.49 | I | 72 | 316 | 3.47 | 2.27 | 4.93 | II |
| 25 | 47 | 9.2 | 4.13 | 17.4 | I | 73 | 284 | 3.96 | 1.84 | 10.5 | II |
| 26 | 31 | 17.5 | 5.42 | 11.9 | I | 74 | 256 | 3.96 | 2.31 | 17 | II |
| 27 | 66 | 10.4 | 6.3 | 28.6 | I | 75 | 391 | 6.29 | 1.48 | 9.4 | II |
| 28 | 24 | 4 | 2.85 | 23.9 | I | 76 | 288 | 1.63 | 2.34 | 15.4 | II |
| 29 | 42 | 7.39 | 5.67 | 20.5 | I | 77 | 239 | 1.4 | 2.03 | 11.1 | II |
| 30 | 45 | 5.13 | 4.96 | 18.5 | I | 78 | 119 | 4.55 | 2.95 | 15.3 | II |
| 31 | 46 | 8.12 | 10.6 | 25.9 | I | 79 | 58 | 3.77 | 2.13 | 19.8 | II |
| 32 | 40 | 6.49 | 7.73 | 24.3 | I | 80 | 156 | 4.19 | 3.67 | 14.4 | II |
| 33 | 34 | 4.45 | 12.6 | 24.4 | I | 81 | 375 | 2.1 | 1.93 | 11.4 | II |
| 34 | 19 | 7.42 | 13.7 | 9.72 | I | 82 | 137 | 5.28 | 4.15 | 13.8 | II |
| 35 | 43 | 14.6 | 11.8 | 34.1 | I | 83 | 258 | 2.01 | 2.05 | 12.5 | II |
| 36 | 167 | 17.6 | 15.7 | 22.6 | I | 84 | 185 | 2.78 | 3.26 | 13.2 | II |
| 37 | 69 | 12.5 | 35.7 | 33.9 | I | 85 | 464 | 3.16 | 1.5 | 8.9 | II |
| 38 | 30 | 10.9 | 14.8 | 29.3 | I | 86 | 213 | 2.06 | 2.68 | 21.4 | II |
| 39 | 32 | 5.35 | 5.25 | 19.2 | I | 87 | 287 | 9.18 | 4.99 | 9.53 | II |
| 40 | 44 | 5.03 | 5.96 | 18.4 | I | 88 | 90 | 2.5 | 2.6 | 9.51 | II |
| 41 | 33 | 3.63 | 2.25 | 29.4 | I | 89 | 260 | 1.88 | 1.67 | 12.9 | II |
| 42 | 15 | 3.37 | 5.25 | 30 | I | 90 | 2943 | 1.1 | 2.17 | 2.19 | III |
| 43 | 48 | 8.06 | 9.4 | 10.6 | I | 91 | 83 | 1.2 | 1.3 | 1.5 | III |
| 44 | 189 | 6.05 | 6.49 | 18.6 | I | 92 | 1414 | 3.29 | 2.38 | 5.26 | III |
| 45 | 461 | 2.23 | 1.45 | 7.3 | II | 93 | 760 | 2.13 | 1.17 | 5.92 | III |
| 46 | 409 | 2.16 | 1.39 | 8.16 | II | 94 | 520 | 1.6 | 1.9 | 0.4 | III |
| 47 | 306 | 5.91 | 2.48 | 8.86 | II | 95 | 725 | 1.58 | 1.4 | 5.36 | III |
| 48 | 102 | 2.67 | 2.26 | 13.3 | II | ||||||
| Index | CBL Level | Minimum | Maximum | Median | IQR | Lower Quartile | Upper Quartile | Mean | SD | SE |
|---|---|---|---|---|---|---|---|---|---|---|
| DT (ms) | I | 4 | 346 | 40.5 | 28 | 21.5 | 49.5 | 65.886 | 82.267 | 12.402 |
| II | 5 | 464 | 249 | 182 | 119 | 301 | 221.8 | 120.572 | 17.974 | |
| III | 83 | 2943 | 742.5 | 679.25 | 571.25 | 1250.5 | 1074.167 | 1011.746 | 413.044 | |
| WET | I | 3.37 | 19.6 | 7.245 | 6.015 | 4.985 | 11 | 8.247 | 4.21 | 0.635 |
| II | 0.968 | 9.18 | 3.47 | 2.35 | 2.23 | 4.58 | 3.747 | 1.889 | 0.282 | |
| III | 1.1 | 3.29 | 1.59 | 0.703 | 1.295 | 1.998 | 1.817 | 0.808 | 0.33 | |
| KE | I | 0.87 | 123 | 6.905 | 8.597 | 5.377 | 13.975 | 23.085 | 34.343 | 5.177 |
| II | 0.88 | 10.2 | 2.27 | 1.73 | 1.81 | 3.54 | 2.769 | 1.63 | 0.243 | |
| III | 1.17 | 2.38 | 1.65 | 0.777 | 1.325 | 2.103 | 1.72 | 0.5 | 0.204 | |
| RC (MPa) | I | 2.84 | 37.7 | 18.55 | 13.425 | 11.575 | 25 | 18.442 | 9.352 | 1.41 |
| II | 1.4 | 21.4 | 11.4 | 4.4 | 8.9 | 13.3 | 11.075 | 4.377 | 0.653 | |
| III | 0.4 | 5.92 | 3.725 | 3.663 | 1.672 | 5.335 | 3.438 | 2.354 | 0.961 |
| No. | Index | Engineering Guidance Level | No. | Index | Engineering Guidance Level | ||||||
|---|---|---|---|---|---|---|---|---|---|---|---|
| X1 | X2 | X3 | X4 | X1 | X2 | X3 | X4 | ||||
| 1 | 0.0534 | 0.3291 | 0.0508 | 0.6756 | I | 49 | 0.0643 | 0.0092 | 0.0399 | 0.3244 | II |
| 2 | 0.0099 | 0.2271 | 0.5578 | 0.0654 | I | 50 | 0.0007 | 0.4365 | 0.0022 | 0.0456 | II |
| 3 | 0.0000 | 0.2084 | 0.9099 | 0.1582 | I | 51 | 0.0003 | 0.2862 | 0.0084 | 0.0432 | II |
| 4 | 0.0010 | 0.2057 | 0.7789 | 0.1448 | I | 52 | 0.0211 | 0.1627 | 0.0068 | 0.0375 | II |
| 5 | 0.0010 | 0.2647 | 0.5415 | 0.1340 | I | 53 | 0.0248 | 0.2593 | 0.0305 | 0.0268 | II |
| 6 | 0.0031 | 0.2969 | 1.0000 | 0.1260 | I | 54 | 0.1007 | 0.0962 | 0.0153 | 0.3056 | II |
| 7 | 0.0034 | 0.1305 | 0.5333 | 0.1413 | I | 55 | 0.1181 | 0.0892 | 0.0063 | 0.3378 | II |
| 8 | 0.0034 | 0.1681 | 0.9099 | 0.0759 | I | 56 | 0.0854 | 0.1305 | 0.0232 | 0.2895 | II |
| 9 | 0.0061 | 0.3881 | 0.7052 | 0.1046 | I | 57 | 0.0708 | 0.1810 | 0.0001 | 0.1853 | II |
| 10 | 0.0749 | 0.2937 | 0.0446 | 0.4879 | I | 58 | 0.1222 | 0.2711 | 0.0038 | 0.2201 | II |
| 11 | 0.0102 | 0.2245 | 0.0461 | 0.4558 | I | 59 | 0.0463 | 0.1193 | 0.0202 | 0.3458 | II |
| 12 | 0.0895 | 0.6136 | 0.0000 | 0.6542 | I | 60 | 0.0834 | 0.0634 | 0.0079 | 0.3110 | II |
| 13 | 0.0129 | 0.7209 | 0.0226 | 0.7668 | I | 61 | 0.0167 | 0.3033 | 0.0282 | 0.2445 | II |
| 14 | 0.0031 | 0.1450 | 0.0393 | 0.7721 | I | 62 | 0.0456 | 0.0000 | 0.0219 | 0.2574 | II |
| 15 | 0.0140 | 0.1810 | 0.0419 | 0.5952 | I | 63 | 0.0265 | 0.2046 | 0.0764 | 0.3619 | II |
| 16 | 0.1062 | 0.3828 | 0.0043 | 0.4370 | I | 64 | 0.1143 | 0.1939 | 0.0032 | 0.4129 | II |
| 17 | 0.0218 | 0.6297 | 0.0480 | 0.3807 | I | 65 | 0.0922 | 0.1375 | 0.0220 | 0.3405 | II |
| 18 | 0.1164 | 0.5545 | 0.0457 | 0.3968 | I | 66 | 0.1028 | 0.0355 | 0.0097 | 0.2555 | II |
| 19 | 0.0140 | 0.6082 | 0.0960 | 0.4933 | I | 67 | 0.0174 | 0.1987 | 0.0332 | 0.4182 | II |
| 20 | 0.0099 | 0.5009 | 0.0734 | 0.3137 | I | 68 | 0.1011 | 0.1541 | 0.0131 | 0.2627 | II |
| 21 | 0.0054 | 0.4542 | 0.0643 | 0.4316 | I | 69 | 0.0299 | 0.1788 | 0.0300 | 0.3834 | II |
| 22 | 0.0170 | 1.0000 | 0.0034 | 0.4531 | I | 70 | 0.0844 | 0.1150 | 0.0087 | 0.1638 | II |
| 23 | 0.0027 | 0.1413 | 0.0117 | 1.0000 | I | 71 | 0.0721 | 0.0887 | 0.0077 | 0.3405 | II |
| 24 | 0.0126 | 0.5867 | 0.0895 | 0.1365 | I | 72 | 0.1062 | 0.1343 | 0.0115 | 0.1214 | II |
| 25 | 0.0146 | 0.4418 | 0.0267 | 0.4558 | I | 73 | 0.0953 | 0.1606 | 0.0079 | 0.2708 | II |
| 26 | 0.0092 | 0.8873 | 0.0373 | 0.3083 | I | 74 | 0.0857 | 0.1606 | 0.0118 | 0.4450 | II |
| 27 | 0.0211 | 0.5062 | 0.0445 | 0.7560 | I | 75 | 0.1317 | 0.2856 | 0.0050 | 0.2413 | II |
| 28 | 0.0068 | 0.1627 | 0.0162 | 0.6300 | I | 76 | 0.0966 | 0.0355 | 0.0120 | 0.4021 | II |
| 29 | 0.0129 | 0.3447 | 0.0393 | 0.5389 | I | 77 | 0.0800 | 0.0232 | 0.0095 | 0.2869 | II |
| 30 | 0.0140 | 0.2234 | 0.0335 | 0.4853 | I | 78 | 0.0391 | 0.1922 | 0.0170 | 0.3995 | II |
| 31 | 0.0143 | 0.3839 | 0.0797 | 0.6836 | I | 79 | 0.0184 | 0.1504 | 0.0103 | 0.5201 | II |
| 32 | 0.0122 | 0.2964 | 0.0562 | 0.6408 | I | 80 | 0.0517 | 0.1729 | 0.0229 | 0.3753 | II |
| 33 | 0.0102 | 0.1869 | 0.0960 | 0.6434 | I | 81 | 0.1262 | 0.0608 | 0.0087 | 0.2949 | II |
| 34 | 0.0051 | 0.3463 | 0.1051 | 0.2499 | I | 82 | 0.0453 | 0.2314 | 0.0269 | 0.3592 | II |
| 35 | 0.0133 | 0.7316 | 0.0895 | 0.9035 | I | 83 | 0.0864 | 0.0559 | 0.0097 | 0.3244 | II |
| 36 | 0.0555 | 0.8927 | 0.1214 | 0.5952 | I | 84 | 0.0616 | 0.0973 | 0.0196 | 0.3432 | II |
| 37 | 0.0221 | 0.6189 | 0.2852 | 0.8981 | I | 85 | 0.1565 | 0.1176 | 0.0052 | 0.2279 | II |
| 38 | 0.0088 | 0.5331 | 0.1141 | 0.7748 | I | 86 | 0.0711 | 0.0586 | 0.0148 | 0.5630 | II |
| 39 | 0.0095 | 0.2352 | 0.0359 | 0.5040 | I | 87 | 0.0963 | 0.4407 | 0.0337 | 0.2448 | II |
| 40 | 0.0136 | 0.2180 | 0.0417 | 0.4826 | I | 88 | 0.0293 | 0.0822 | 0.0142 | 0.2442 | II |
| 41 | 0.0099 | 0.1429 | 0.0113 | 0.7775 | I | 89 | 0.0871 | 0.0489 | 0.0066 | 0.3351 | II |
| 42 | 0.0037 | 0.1289 | 0.0359 | 0.7936 | I | 90 | 1.0000 | 0.0071 | 0.0106 | 0.0480 | III |
| 43 | 0.0150 | 0.3806 | 0.0698 | 0.2735 | I | 91 | 0.0269 | 0.0125 | 0.0035 | 0.0295 | III |
| 44 | 0.0629 | 0.2728 | 0.0460 | 0.4879 | I | 92 | 0.4798 | 0.1246 | 0.0124 | 0.1303 | III |
| 45 | 0.1555 | 0.0677 | 0.0047 | 0.1850 | II | 93 | 0.2572 | 0.0624 | 0.0025 | 0.1480 | III |
| 46 | 0.1378 | 0.0640 | 0.0043 | 0.2080 | II | 94 | 0.1756 | 0.0339 | 0.0084 | 0.0000 | III |
| 47 | 0.1028 | 0.2652 | 0.0132 | 0.2268 | II | 95 | 0.2453 | 0.0328 | 0.0043 | 0.1330 | III |
| 48 | 0.0333 | 0.0913 | 0.0114 | 0.3458 | II | ||||||
| No. | SVM Model | Accuracy (%) | F1-Score | Kappa Coefficient |
|---|---|---|---|---|
| 1 | LSVM | 91.6 | 0.804 | 0.843 |
| 2 | QSVM | 97.9 | 0.960 | 0.962 |
| 3 | CSVM | 97.9 | 0.960 | 0.962 |
| 4 | FG-SVM | 88.4 | 0.817 | 0.786 |
| 5 | MG-SVM | 95.8 | 0.920 | 0.923 |
| 6 | CG-SVM | 87.4 | 0.774 | 0.765 |
| 7 | APSO-SVM | 93.7 | 0.878 | 0.884 |
| 8 | GWO-SVM | 98.9 | 0.993 | 0.980 |
| No. | DT (ms) | Level (DT) | WET | Level (WET) | KE | Level (KE) | RC (MPa) | Level (RC) | Engineering Guidance Level | GWO-SVM |
|---|---|---|---|---|---|---|---|---|---|---|
| 1 | 208.8 | II | 7.316 | I | 1.526 | II | 13.232 | II | II | II |
| 2 | 172.8 | II | 14.948 | I | 1.561 | II | 18.105 | I | II | II |
| 3 | 201.6 | II | 6.529 | I | 1.724 | II | 20.615 | I | II | II |
| No. | DT (ms) | Level (DT) | WET | Level (WET) | KE | Level (KE) | RC (MPa) | Level (RC) | Engineering Guidance Level | GWO-SVM |
|---|---|---|---|---|---|---|---|---|---|---|
| 1 | 463 | II | 1.216 | III | 1.266 | III | 4.133 | III | II | III |
Disclaimer/Publisher’s Note: The statements, opinions and data contained in all publications are solely those of the individual author(s) and contributor(s) and not of MDPI and/or the editor(s). MDPI and/or the editor(s) disclaim responsibility for any injury to people or property resulting from any ideas, methods, instructions or products referred to in the content. |
© 2022 by the authors. Licensee MDPI, Basel, Switzerland. This article is an open access article distributed under the terms and conditions of the Creative Commons Attribution (CC BY) license (https://creativecommons.org/licenses/by/4.0/).
Share and Cite
Li, Y.; Wang, C.; Liu, Y. Classification of Coal Bursting Liability Based on Support Vector Machine and Imbalanced Sample Set. Minerals 2023, 13, 15. https://doi.org/10.3390/min13010015
Li Y, Wang C, Liu Y. Classification of Coal Bursting Liability Based on Support Vector Machine and Imbalanced Sample Set. Minerals. 2023; 13(1):15. https://doi.org/10.3390/min13010015
Chicago/Turabian StyleLi, Yuefeng, Chao Wang, and Yv Liu. 2023. "Classification of Coal Bursting Liability Based on Support Vector Machine and Imbalanced Sample Set" Minerals 13, no. 1: 15. https://doi.org/10.3390/min13010015
APA StyleLi, Y., Wang, C., & Liu, Y. (2023). Classification of Coal Bursting Liability Based on Support Vector Machine and Imbalanced Sample Set. Minerals, 13(1), 15. https://doi.org/10.3390/min13010015