Fluorluanshiweiite, KLiAl1.5□0.5(Si3.5Al0.5)O10F2, a New Mineral of the Mica Group from the Nanyangshan LCT Pegmatite Deposit, North Qinling Orogen, China

 ,
,
Abstract
1. Introduction
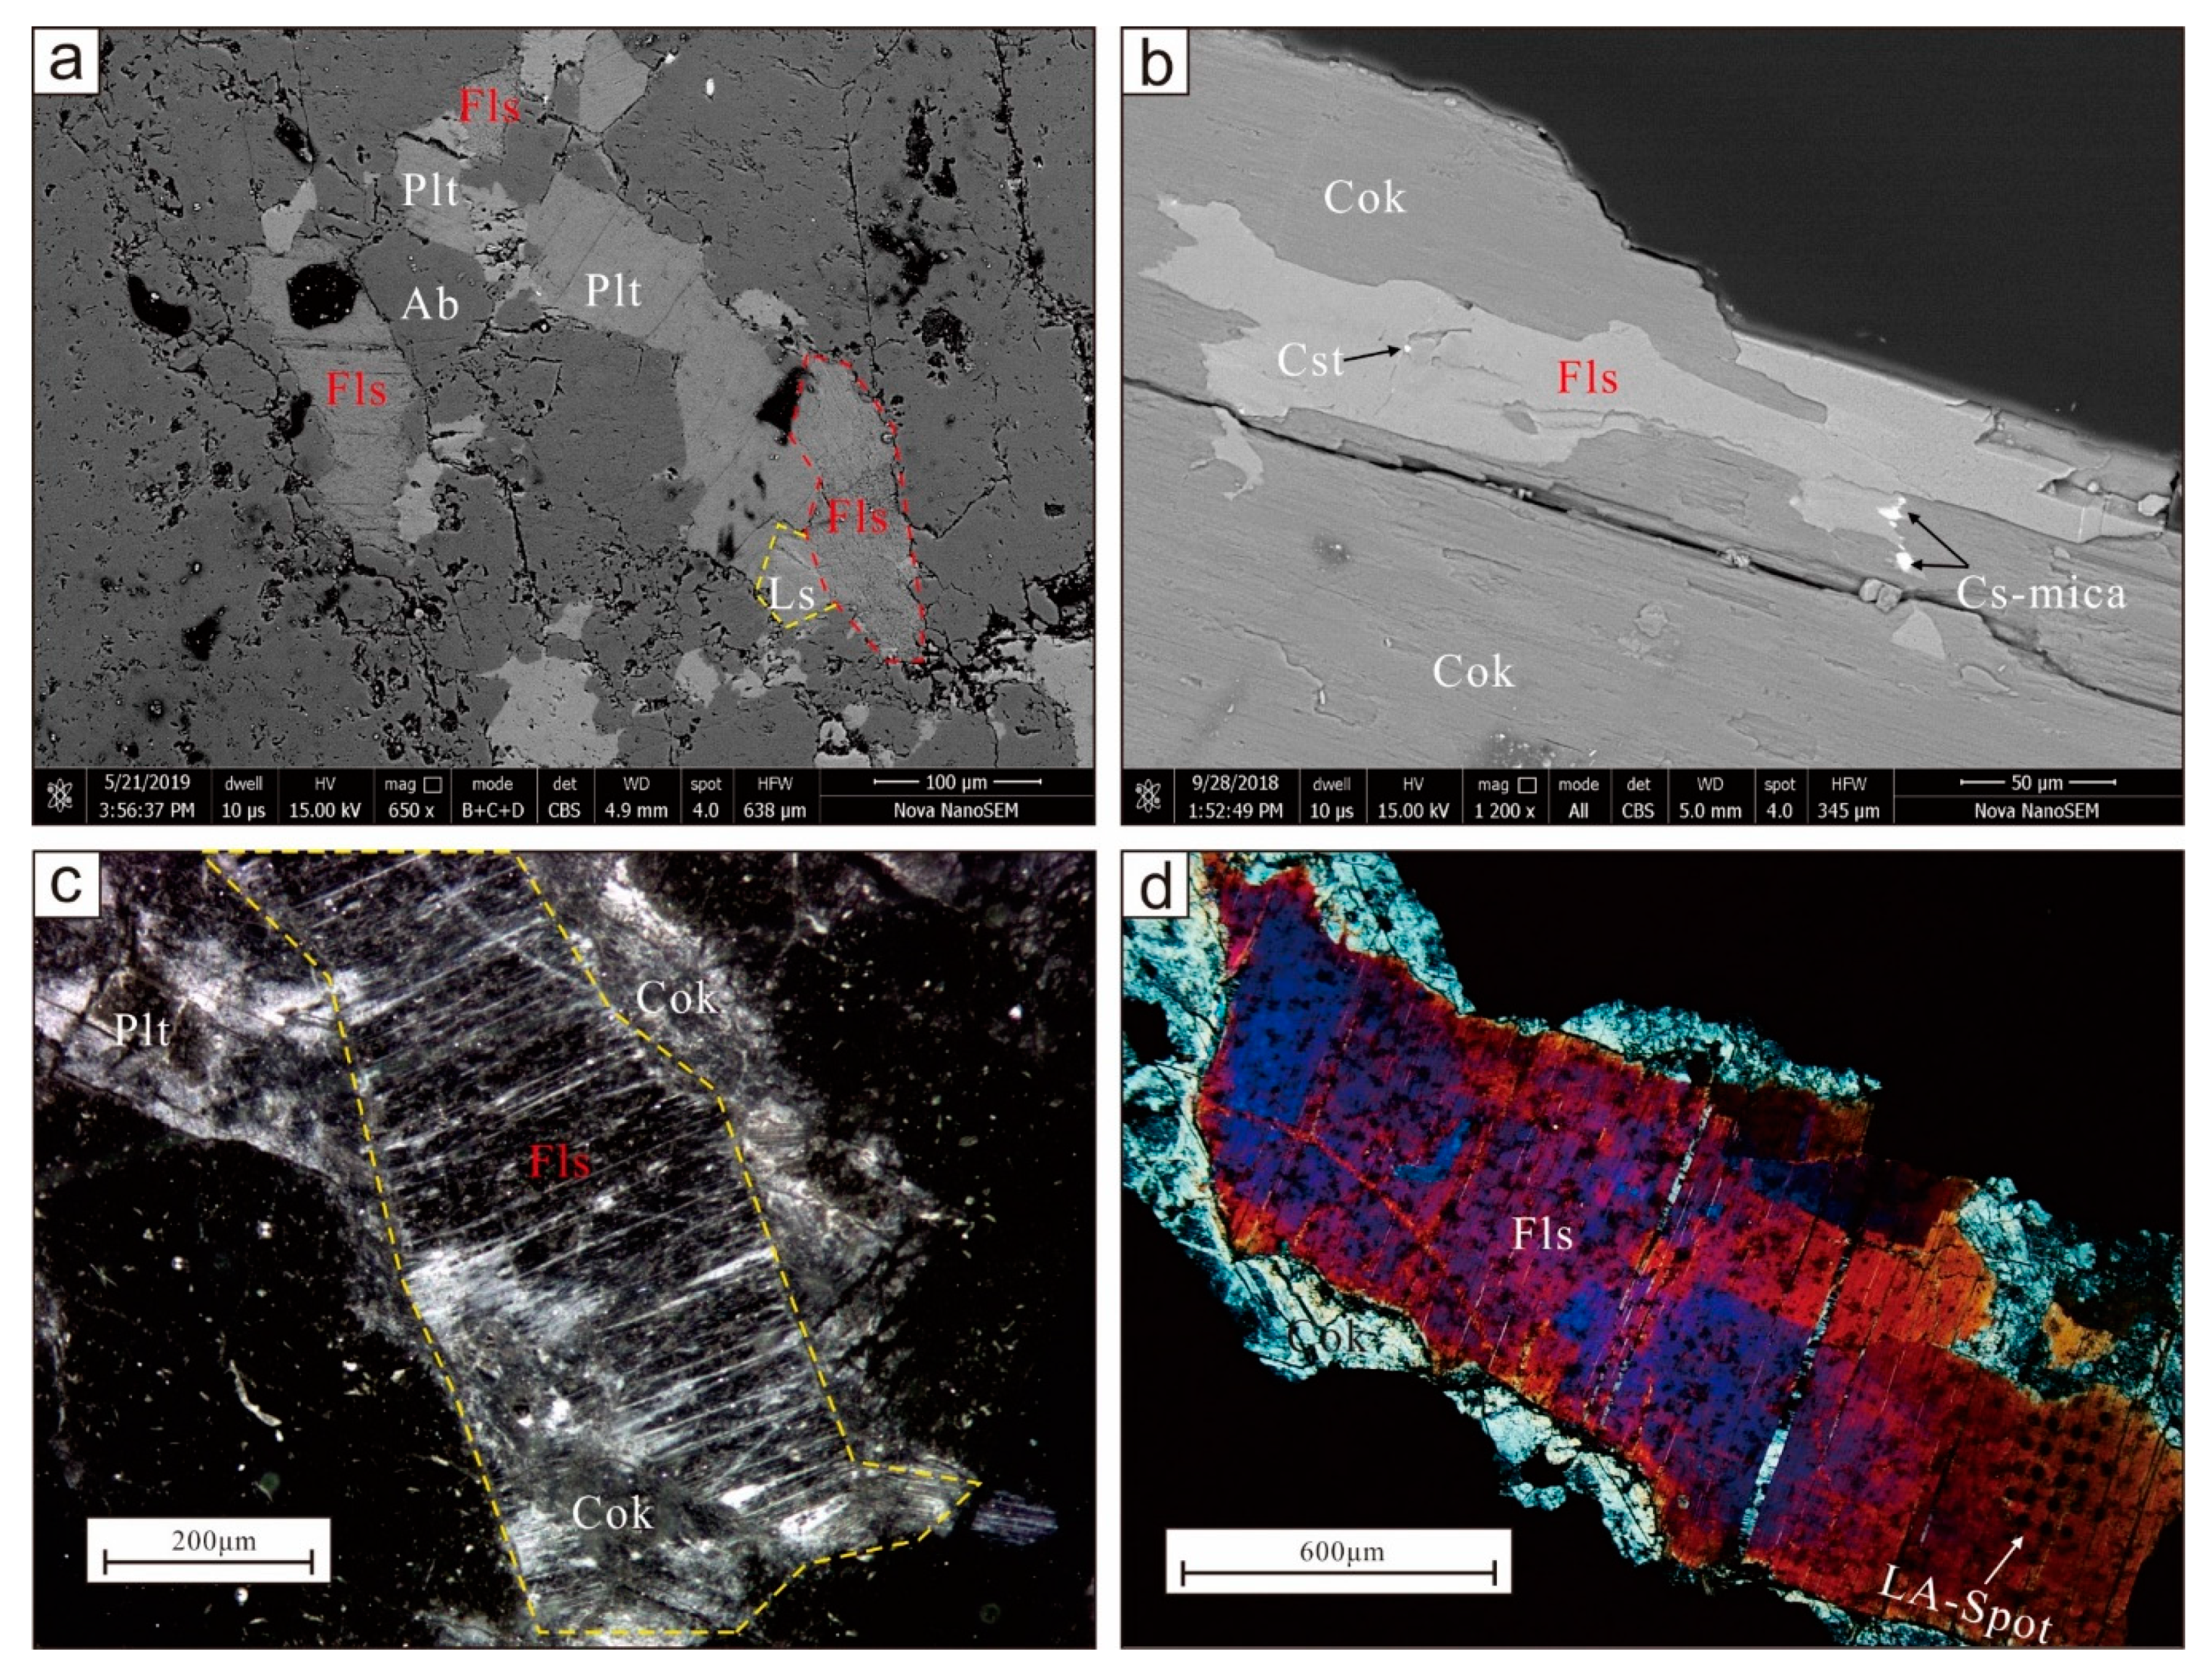
2. Occurrence and Physical Properties
3. Chemical Composition
4. Spectroscopic Features
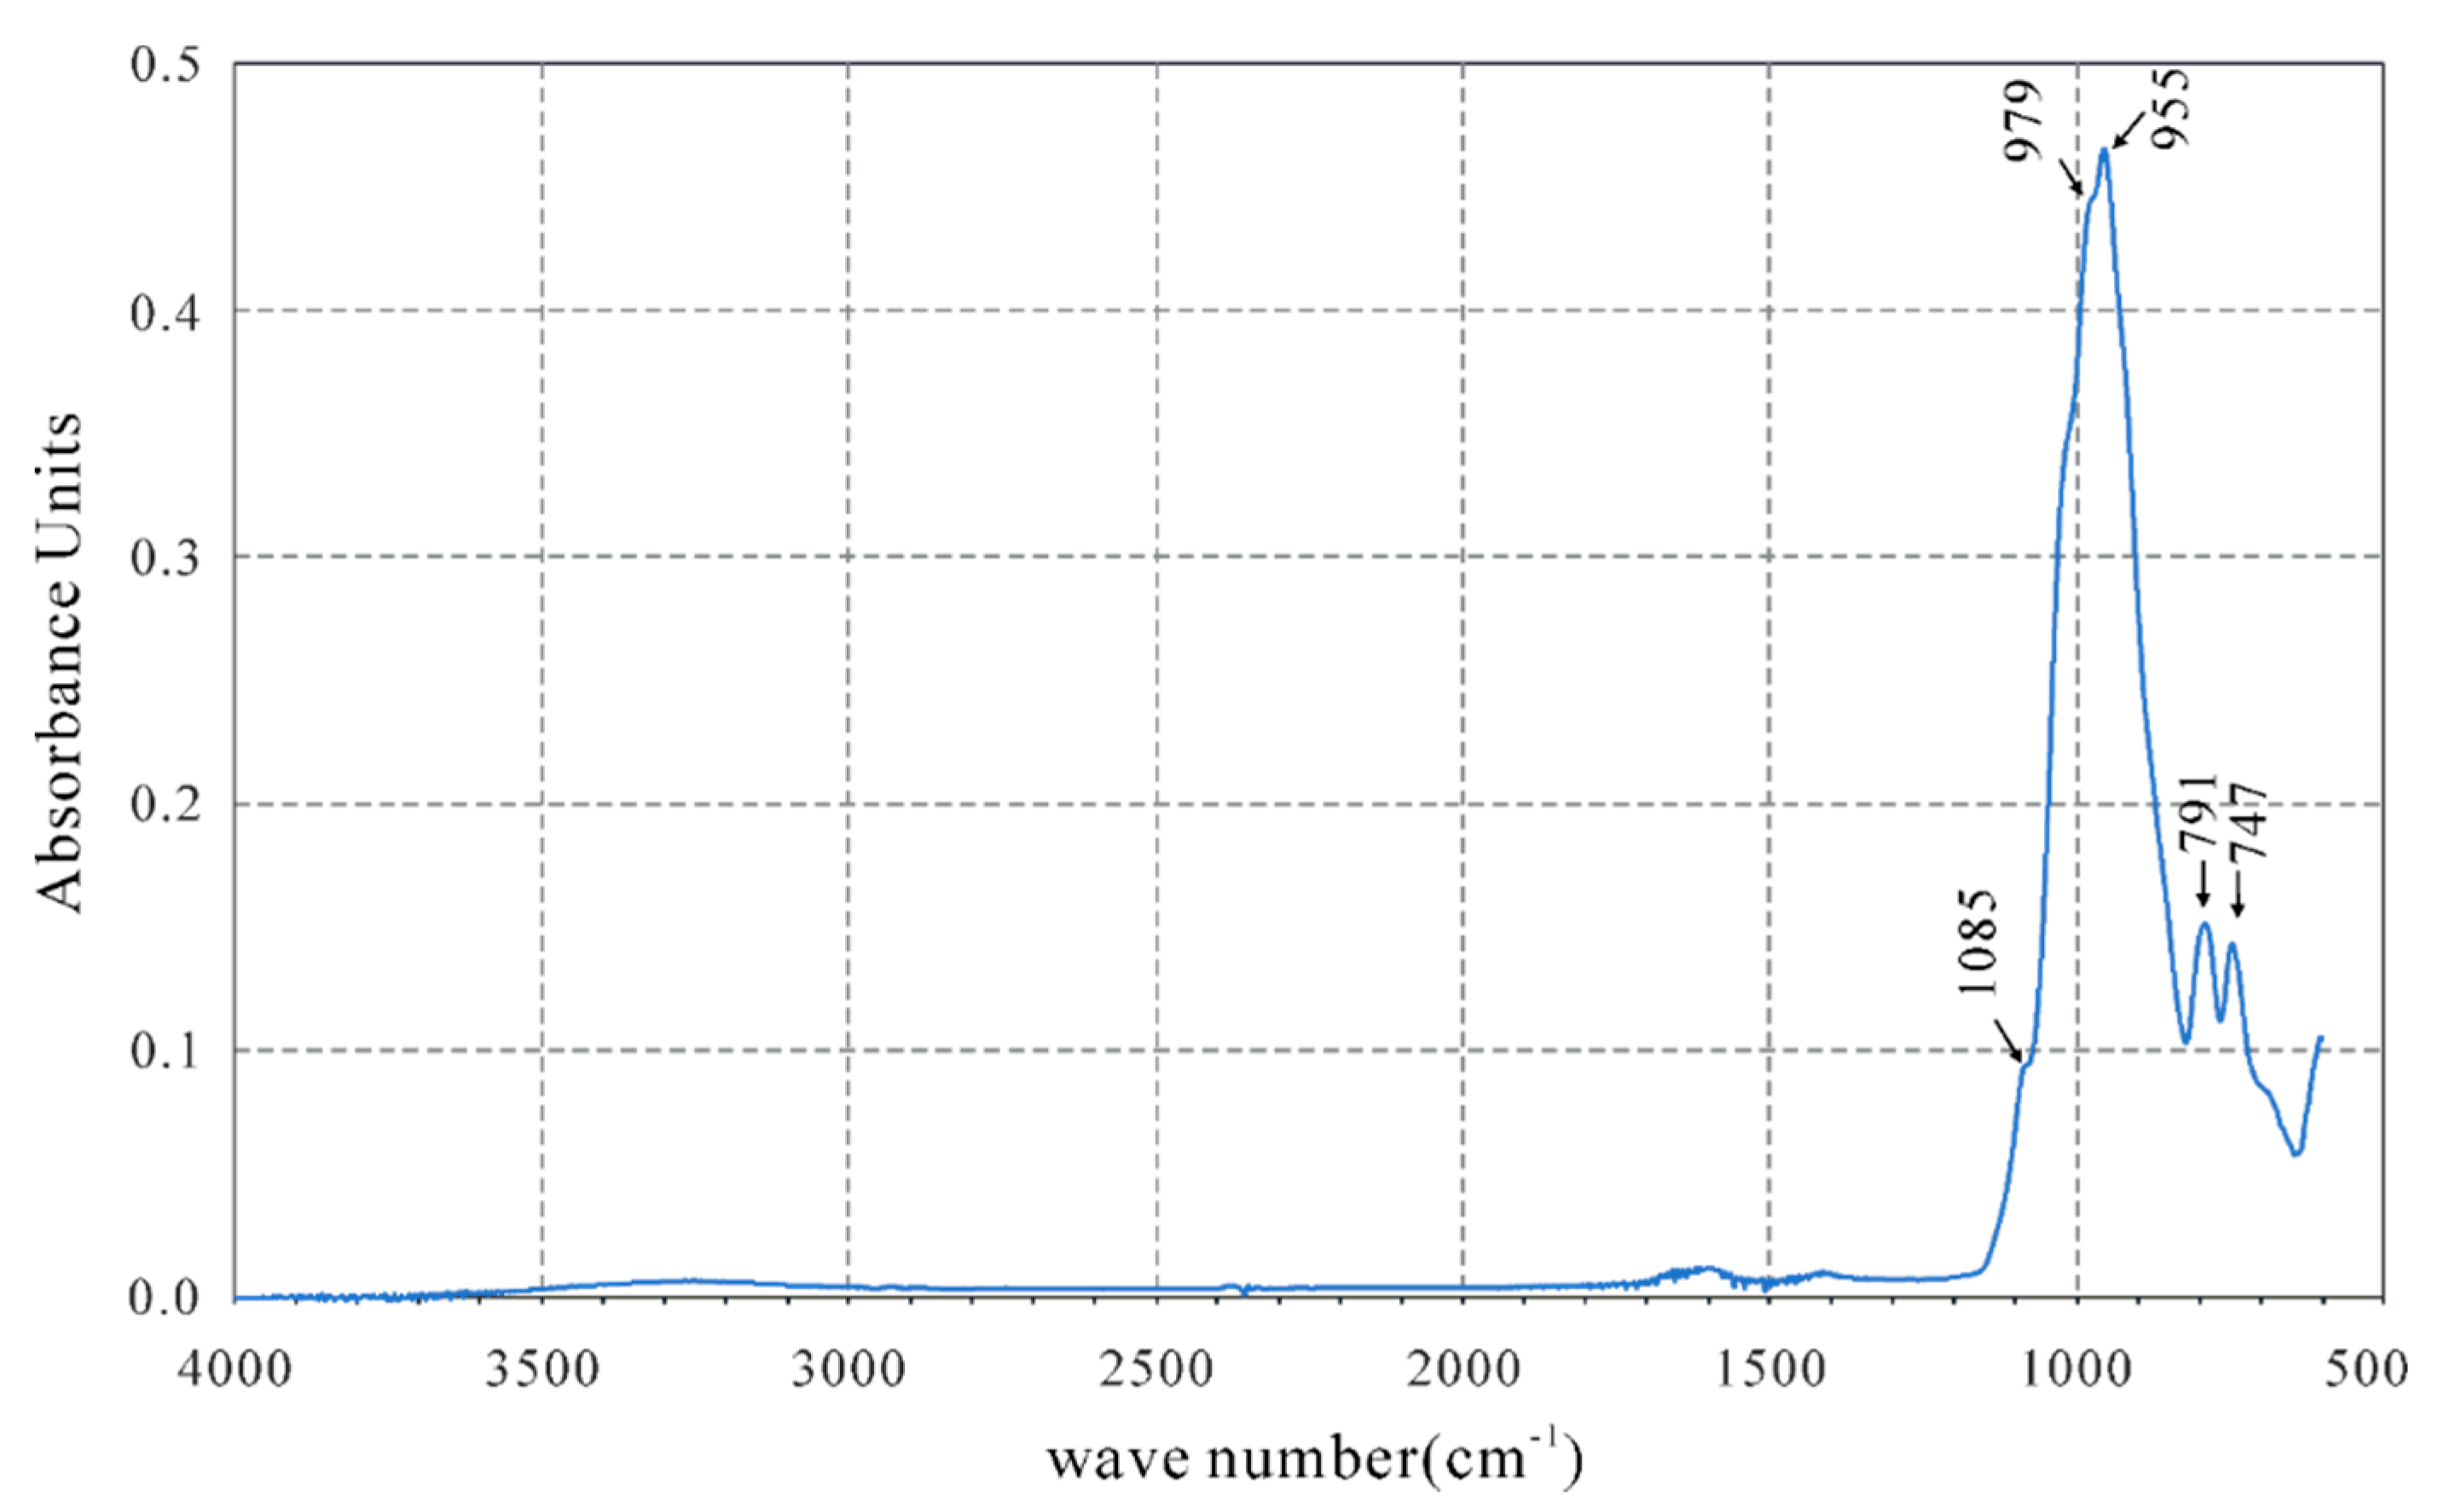
4.1. Infrared Spectroscopy
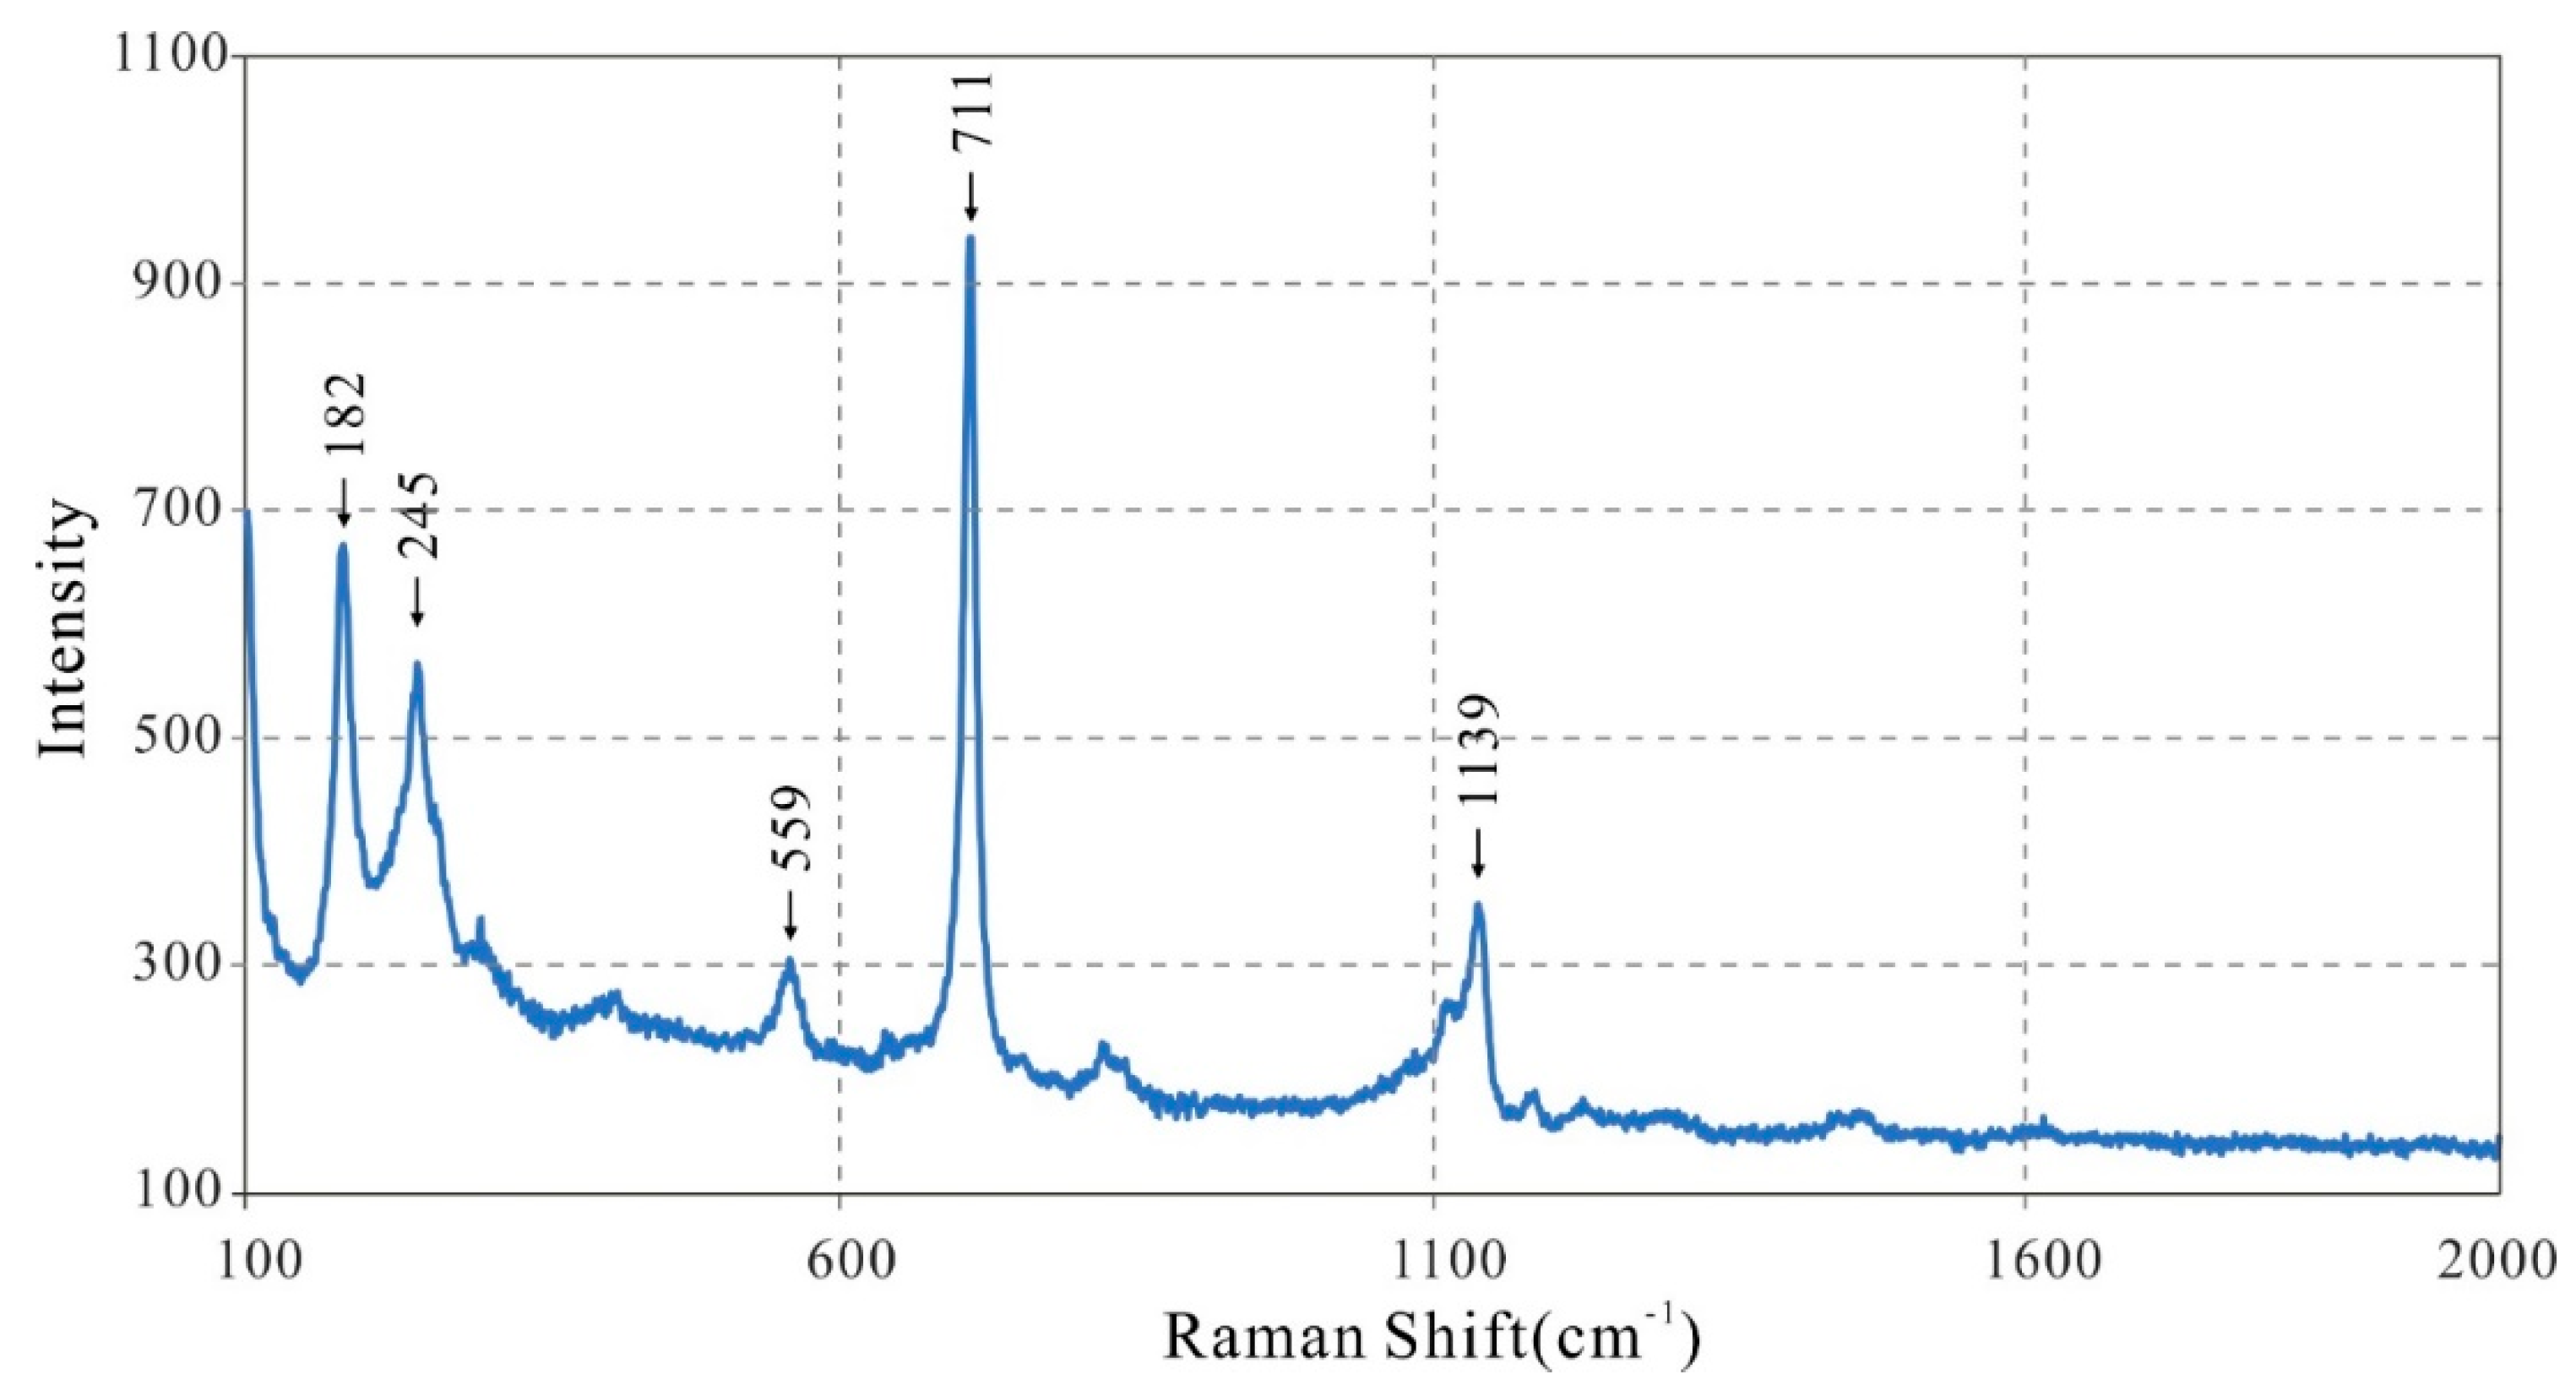
4.2. Raman Spectroscopy
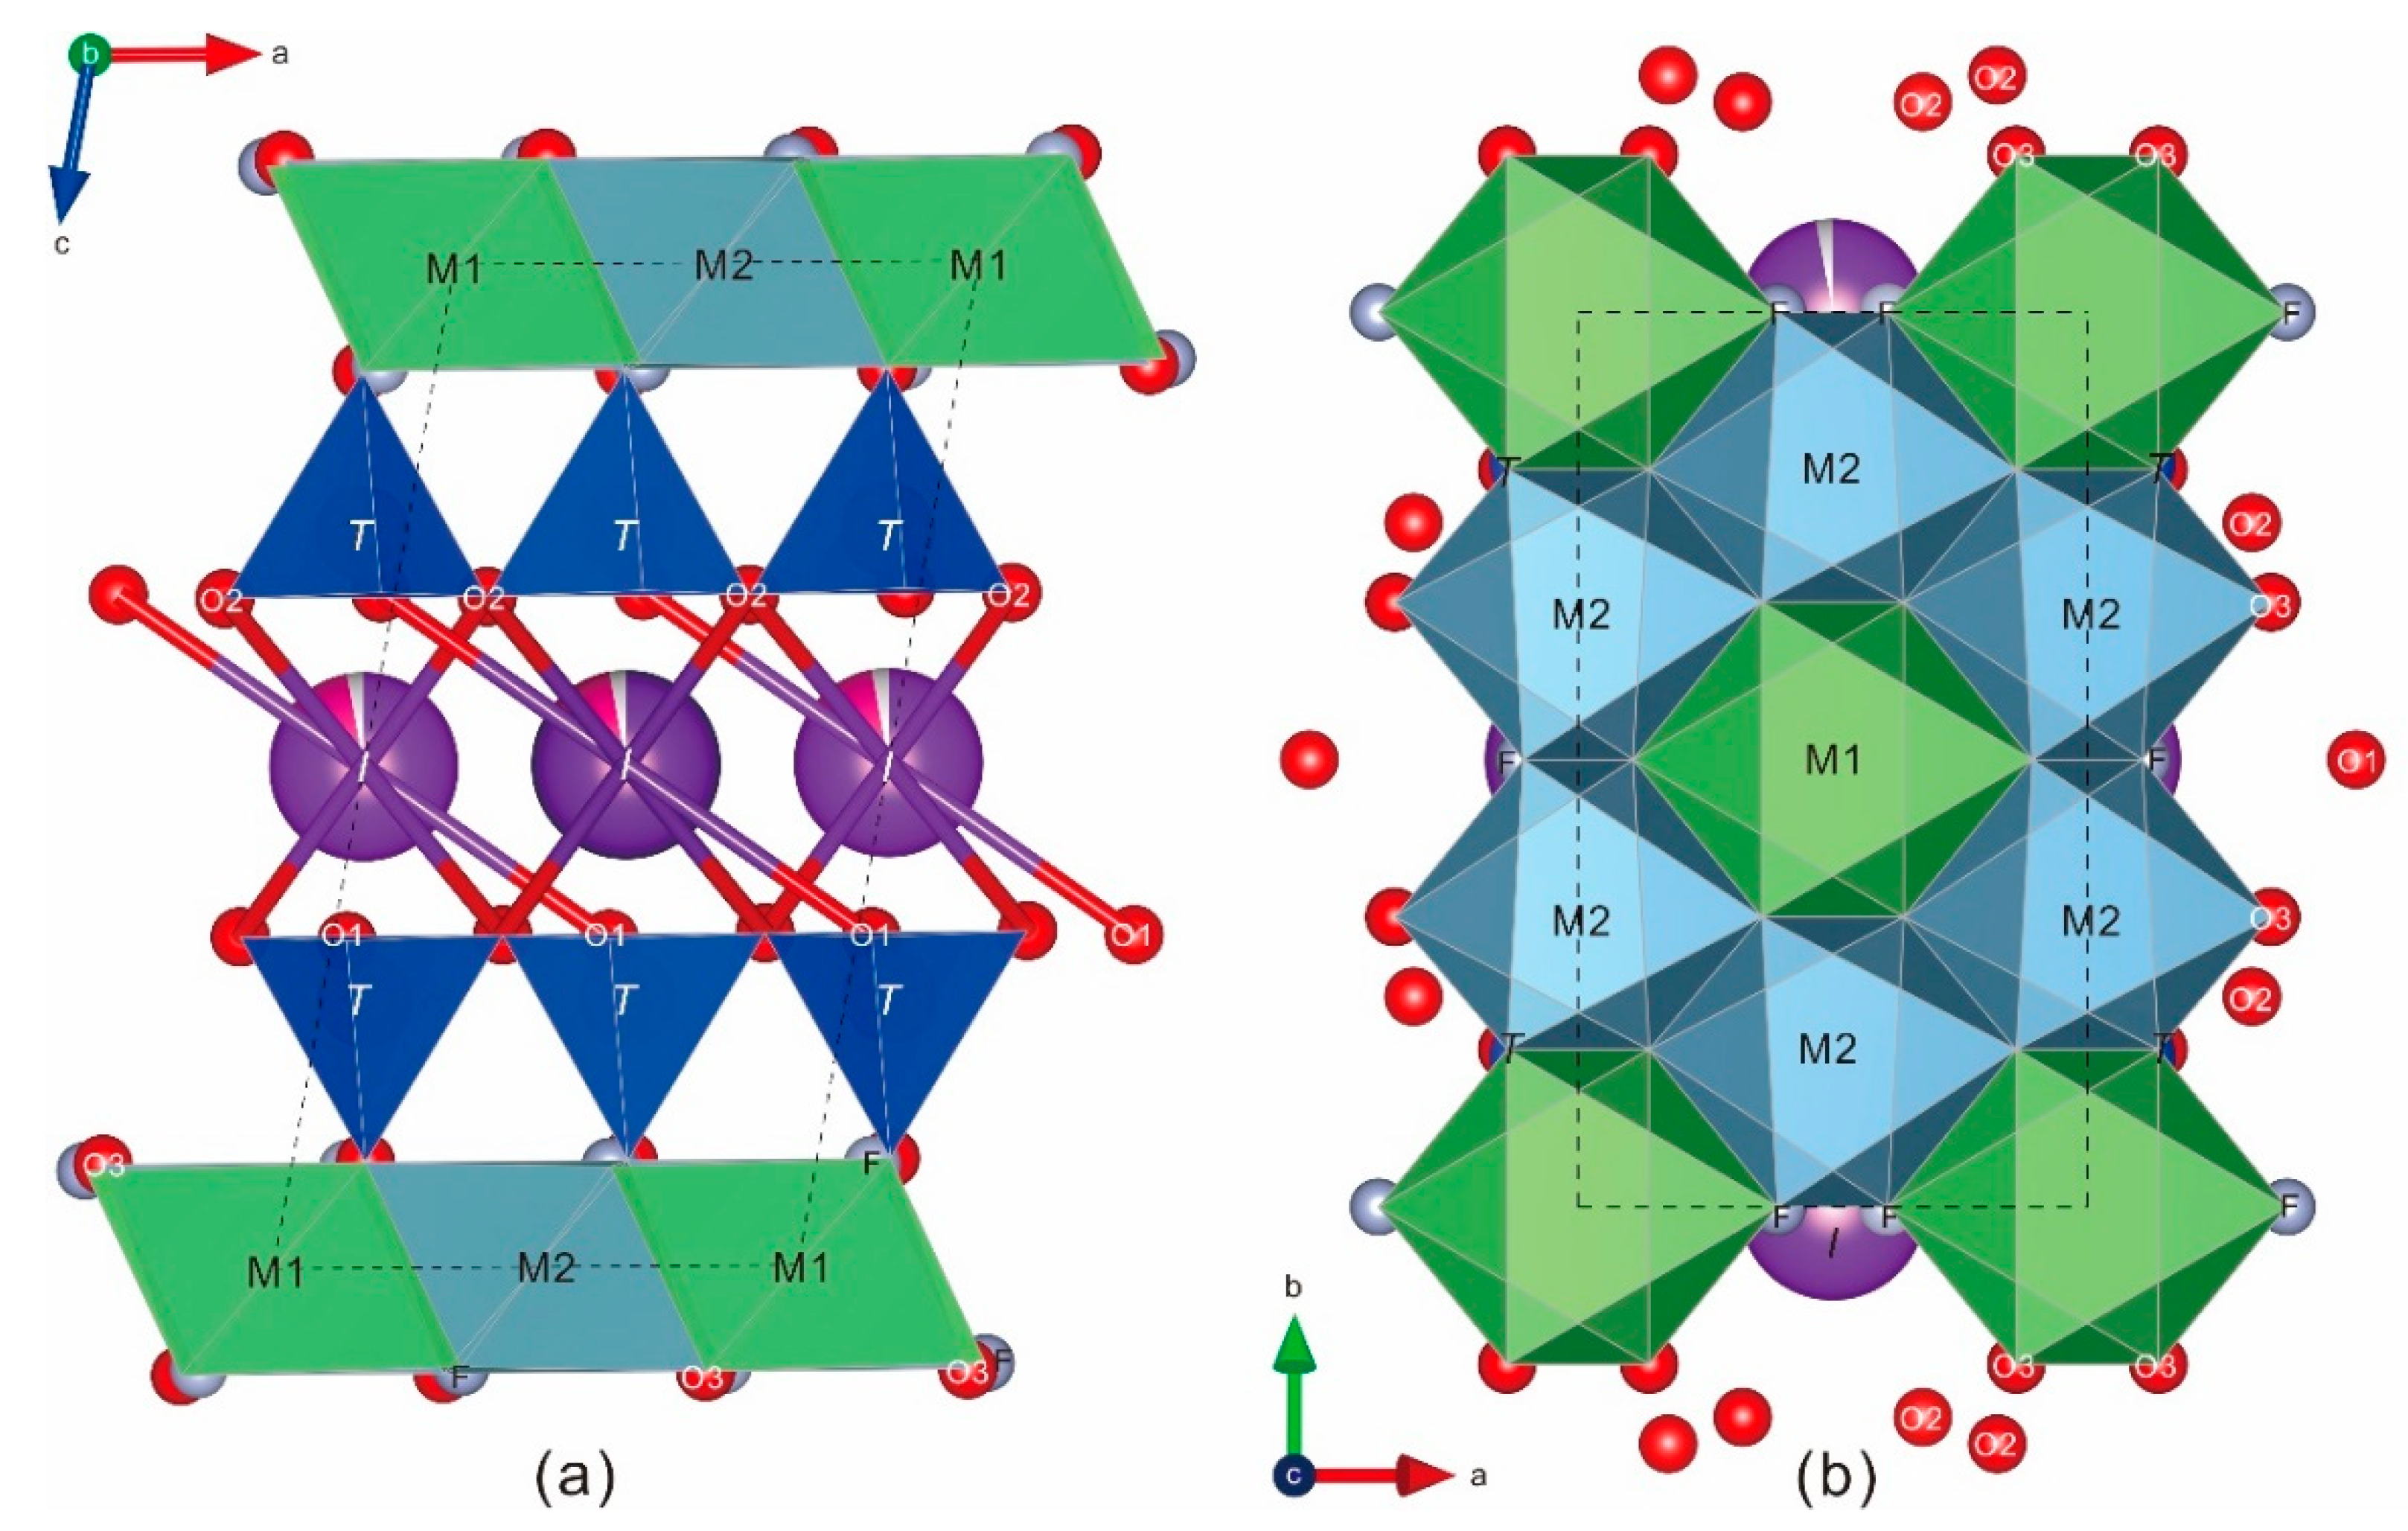
5. Crystal Structure
6. Discussion
Author Contributions
Funding
Acknowledgments
Conflicts of Interest
References
- Fan, G.; Li, G.; Shen, G.; Xu, J.; Dai, J. Luanshiweiite: A New Member of Lepidolite Series. Acta Mineral. Sin. 2013, 33, 713–721, (In Chinese with English abstract). [Google Scholar]
- Pekov, I.V.; Kononkova, N.N.; Agakhanov, A.A.; Belakovsky, D.I.; Kazantsev, S.S.; Zubkova, N.V. Voloshinite, a new rubidium mica from granitic pegmatite of Voron’i Tundras, Kola Peninsula, Russia. Geol. Ore Depos. 2010, 52, 591–598. [Google Scholar] [CrossRef]
- Qu, K.; Sima, X.; Li, G.; Fan, G.; Shen, G.; Liu, X.; Xiao, Z.; Hu, G.; Qiu, L.; Wang, Y. Fluorluanshiweiite, IMA 2019-053. CNMNC Newsletter No. 52. Mineral. Mag. 2019, 83, 887–893. [Google Scholar]
- Luan, S.; Mao, Y.; Fan, L.; Wu, X.; Lin, J. Mineralization and Prospection of Rare Earth Metals in the Koktogay Area; Chengdu University of Science and Technology Press: Chengdu, China, 1995; pp. 66–194. (In Chinese) [Google Scholar]
- Černý, P. Rare-element granitic pegmatites. I. Anatomy and internal evolution of pegmatite deposits. Geosci. Can. 1991, 18, 49–67. [Google Scholar]
- Černý, P.A.; Ercit, T.S. The classification of granitic pegmatites revisited. Can. Mineral. 2005, 43, 2005–2026. [Google Scholar] [CrossRef]
- 9th Laboratory of Chengdu Institute of Geology. The isotopic dating of geological ages of granites and pegmatites in the eastern part of the Eastern Tsinling. Geochimica 1973, 3, 166–172, (In Chinese with English abstract). [Google Scholar]
- Qu, K.; Sima, X.Z.; Zhou, H.Y.; Xiao, Z.B.; Tu, J.R.; Yin, Q.Q.; Liu, X.; Li, J.H. In situ LA-MC-ICP-MS and ID-TIMS U-Pb ages of bastnäsite-(Ce) and zircon from the Taipingzhen hydrothermal REE deposit: New constraints on the Later Palaeozoic granite-related U-REE mineralization in the North Qinling Orogen, Central China. J. Asian Earth Sci. 2019, 173, 352–363. [Google Scholar] [CrossRef]
- Guo, J.J.; Li, H.K.; Chen, Z.H. Brief Review of the Study of Qinling Complex, Qinling Orogenic Belt. Geol. Surv. Res. 2003, 26, 95–102, (In Chinese with English abstract). [Google Scholar]
- Geng, J.Z.; Huang, Y.Q.; Jian, G.P.; Wu, L.; Zhu, R.; Yu, H.C.; Qiu, K.F. Zircon U-Pb age and Lu-Hf isotopes of the dacite from Zaozigou Au-Sb deposit, west Qinling, China. Geol. Surv. Res. 2019, 42, 166–173, (In Chinese with English abstract). [Google Scholar]
- Fan, G.; Ge, X.; Li, G.; Yu, A.; Shen, G. Oxynatromicrolite, (Na,Ca,U)2Ta2O6(O,F), a new member of the pyrochlore supergroup from Guanpo, Henan Province, China. Mineral. Mag. 2017, 81, 743–751. [Google Scholar]
- Mandarino, J.A. The Gladstone-dale relationship: Part The compatibility concept and its application. Can. Mineral. 1981, 19, 441–450. [Google Scholar]
- Beran, A. Infrared spectroscopy of micas. Rev. Mineral. Geochem. 2002, 46, 351–369. [Google Scholar] [CrossRef]
- Chukanov, N.V. Infrared Spectra of Mineral Species: Extended Library; Springer Science & Business Media: Dordrecht, The Netherlands, 2013; p. 459. [Google Scholar]
- Wang, R.C.; Hu, H.; Zhang, A.C.; Huang, X.L.; Ni, P. Pollucite and the caesium-dominant analogue of polylithionite as expressions of extreme Cs enrichment in the Yichun topaz–lepidolite granite, southern China. Can. Mineral. 2004, 42, 883–896. [Google Scholar] [CrossRef]
- McKeown, D.A.; Bell, M.I.; Etz, E.S. Raman spectra and vibrational analysis of the trioctahedral mica phlogopite. Am. Mineral. 1999, 84, 970–976. [Google Scholar] [CrossRef]
- McKeown, D.A.; Bell, M.I.; Etz, E.S. Vibrational analysis of the dioctahedral mica: 2M1 muscovite. Am. Mineral. 1999, 84, 1041–1048. [Google Scholar] [CrossRef]
- Wang, A.L.; Freeman, J.; Kuebler, K.E. Raman Spectroscopic Characterization of Phyllosilicates. In Lunar and Planetary Science XXXIII; Document ID: 20020045549; NASA Goddard Space Flight Center: Greenbelt, MD, USA, 2002. [Google Scholar]
- Tlili, A.; Smith, D.C.; Beny, J.M.; Boyer, H. A Raman microprobe study of natural micas. Mineral. Mag. 1989, 53, 165–179. [Google Scholar] [CrossRef]
- Loh, E. Optical vibrations in sheet silicates. J. Phys. C Solid State Phys. 1973, 6, 1091. [Google Scholar] [CrossRef]
- Sheldrick, G.M. Crystal structure refinement with SHELXL. Acta Crystallogr. C 2015, 71, 3–8. [Google Scholar] [CrossRef]
- Nespolo, M.; Ferraris, G. Effects of the stacking faults on the calculated electron density of mica polytypes—The Durovic effect. Eur. J. Mineral. 2001, 13, 1035–1045. [Google Scholar] [CrossRef]
- Rieder, M.; Cavazzini, G.; D’yakonov, Y.D.; Frank-Kamenetskii, V.A.; Gottardi, G.; Guggenheim, S.; Müller, G.; Neiva, A.M.R.; Radoslovich, E.W.; Robert, J.L.; et al. Nomenclature of the micas. Can. Mineral. 1998, 36, 905–912. [Google Scholar] [CrossRef]
- Shannon, R.D. Revised effective ionic radii and systematic studies of interatomic distances in halides and chalcogenides. Acta Cryst. A 1976, 32, 751–767. [Google Scholar] [CrossRef]
- Shannon, R.T.; Prewitt, C.T. Effective ionic radii in oxides and fluorides. Acta Cryst. B 1969, 25, 925–946. [Google Scholar] [CrossRef]
- Toraya, H.; Iwai, S.; Makimo, F.; Kondo, R.; Daimon, M. The crystal structure of tetrasilicic potassium fluor mica, KMg2.5Si4O10F2. Z. Krist. 1976, 144, 42–52. [Google Scholar] [CrossRef]
- Robert, J.L.; Maury, R.C. Natural occurrence of a (Fe, Mn, Mg) tetrasilicic potassium mica. Contrib. Mineral. Petrol. 1979, 68, 117–123. [Google Scholar] [CrossRef]
- Miyawaki, R.; Shimazaki, H.; Shigeoka, M.; Yokoyama, K.; Matsubara, S.; Yurimoto, H. Yangzhumingite, KMg2.5Si4O10F2, a new mineral in the mica group from Bayan Obo, Inner Mongolia, China. Eur. J. Mineral. 2011, 23, 467–473. [Google Scholar] [CrossRef]
- Schingaro, E.; Kullerud, K.; Lacalamita, M.; Mesto, E.; Scordari, F.; Zozulya, D.; Ermabert, M.; Ravna, E.J. Yangzhumingite and phlogopite from the Kvaløya lamproite (North Norway): Structure, composition and origin. Lithos 2014, 210, 1–13. [Google Scholar] [CrossRef]
- Brigatti, M.F.; Kile, D.E.; Poppi, M. Crystal structure and crystal chemistry of lithium-bearing muscovite-2M1. Can. Mineral. 2001, 39, 1171–1180. [Google Scholar] [CrossRef]
- Drits, V.A.; Zviagina, B.B.; McCarty, D.K.; Salyn, A.L. Factors responsible for crystal-chemical variations in the solid solutions from illite to aluminoceladonite and from glauconite to celadonite. Am. Mineral. 2010, 95, 348–361. [Google Scholar] [CrossRef]
- Hawthorne, F.C.; Sokolova, E.; Agakhanov, A.A.; Pautov, L.A.; Karpenko, V.Y. The Crystal Structure of Polylithionite-1M from Darai-pioz, Tajikistan: The Role of Short-Range Order in Driving Symmetry Reduction in 1M Li-Rich Mica. Can. Mineral. 2019, 57, 519–528. [Google Scholar] [CrossRef]
- Brigatti, M.F.; Caprilli, E.; Malferrari, D.; Medici, L.; Poppi, L. Crystal structure and chemistry of trilithionite-2M2 and polylithionite-2M2. Eur. J. Mineral. 2005, 17, 475–481. [Google Scholar] [CrossRef]
- Brigatti, M.F.; Mottana, A.; Malferrari, D.; Cibin, G. Crystal structure and chemical composition of Li-, Fe-, and Mn-rich micas. Am. Mineral. 2007, 92, 1395–1400. [Google Scholar] [CrossRef]
- Brown, I.D.; Altermatt, D. Bond-valence parameters obtained from a systematic analysis of the Inorganic Crystal Structure Database. Acta Crystallogr. Sect. B 1985, 41, 244–247. [Google Scholar] [CrossRef]
- Brown, I.D. Predicting bond lengths in inorganic crystals. Acta Crystallogr. B 1977, 33, 1305–1310. [Google Scholar] [CrossRef]


| % | Fluorluanshiweiite | Luanshiweiite | Polylithionite | ||||||
|---|---|---|---|---|---|---|---|---|---|
| Mean | apfu | σ † | Mean | apfu | σ | Mean | apfu | σ | |
| K2O | 9.87 | 0.85 | 0.20 | 10.58 | 0.89 | 0.16 | 10.88 | 0.91 | 0.31 |
| Rb2O | 2.86 | 0.12 | 0.09 | 1.41 | 0.06 | 0.07 | 0.76 | 0.03 | 0.15 |
| Cs2O | 0.86 | 0.02 | 0.17 | 0.21 | 0.01 | 0.21 | 0.65 | 0.02 | 0.11 |
| Na2O | 0.26 | 0.03 | 0.05 | 0.36 | 0.05 | 0.11 | 0.05 | 0.01 | 0.22 |
| Li2O * | 3.85 | 1.05 | 0.22 | 3.85 | 1.02 | 0.35 | 7.70 | 2.04 | 0.29 |
| FeO | 0.26 | 0.01 | 0.10 | 0.08 | 0.00 | 0.23 | 0.00 | 0.00 | 0.00 |
| MnO | 0.43 | 0.02 | 0.18 | 0.07 | 0.00 | 0.15 | 0.01 | 0.00 | 0.17 |
| Al2O3 | 23.65 | 1.88 | 0.57 | 24.86 | 1.93 | 0.65 | 16.00 | 1.24 | 0.45 |
| SiO2 | 52.42 | 3.54 | 0.64 | 53.45 | 3.52 | 0.56 | 57.95 | 3.81 | 0.59 |
| F | 9.35 | 2.00 | 0.24 | 1.31 | 0.27 | 0.31 | 9.71 | 2.02 | 0.27 |
| F≡O | −3.93 | −0.55 | −4.08 | ||||||
| H2O+ | 4.07 | ||||||||
| Total | 99.88 | 99.7 | 99.63 | ||||||
| Imeas | dmeas | dcalc | hkl | Imeas | dmeas | dcalc | hkl |
|---|---|---|---|---|---|---|---|
| 25 | 8.427 | 9.956 | 001 | 9 | 2.1984 | 2.1926 | 041 |
| 57 | 4.5191 | 4.4956 | 020 | 14 | 2.1414 | 2.1386 | 133 |
| 14 | 4.3396 | 4.3242 | 111 | 3 | 2.0992 | 2.0988 | 221 |
| 25 | 4.1208 | 4.0975 | 021 | 10 | 1.9959 | 2.0005 | 223 |
| 14 | 3.8564 | 3.8368 | 111 | 7 | 1.957 | 1.9537 | 133 |
| 61 | 3.6276 | 3.6154 | 112 | 4 | 1.7209 | 1.7237 | 223 |
| 60 | 3.3495 | 3.3368 | 022 | 11 | 1.6614 | 1.6612 | 242 |
| 46 | 3.091 | 3.0802 | 112 | 16 | 1.6403 | 1.6434 | 116 |
| 25 | 2.8975 | 2.8904 | 113 | 10 | 1.5824 | 1.5845 | 243 |
| 17 | 2.6795 | 2.6705 | 023 | 6 | 1.5492 | 1.5494 | 153 |
| 100 | 2.5859 | 2.5856 | 130 | 45 | 1.5061 | 1.507 | 312 |
| 25 | 2.4571 | 2.466 | 131 | 5 | 1.3821 | 1.3778 | 225 |
| 25 | 2.3903 | 2.3873 | 132 | 10 | 1.343 | 1.343 | 136 |
| 17 | 2.2539 | 2.2478 | 040 | 21 | 1.298 | 1.301 | 316 |
| Crystal Symmetry | Monoclinic |
|---|---|
| Space group | C2/m |
| Polytype | 1M |
| a (Å) | 5.2030(5) |
| b (Å) | 8.9894(6) |
| c (Å) | 10.1253(9) |
| β (°) | 100.68(1) |
| V (Å3) | 465.37(7) |
| Z | 2 |
| Density(cal.) (g/cm3) | 2.898 |
| Radiation type | MoKα |
| 2θmax (°) | 60 |
| total reflections | 1255 |
| independent reflections | 577 |
| reflections with Fo ≥ 4σ | 516 |
| Final R1 | 0.091 |
| wR2 factors | 0.202 |
| Goodness-of-fit | 1.318 |
| Largest diff. peak and hole (e−/Å3) | 1.203–0.815 |
| Atom | Wyck. | s.o.f. | x | y | z | Ueq |
|---|---|---|---|---|---|---|
| K1 | 2d | 0.85 | 0 | 1/2 | 1/2 | 0.0306(9) |
| Rb1 | 2d | 0.12 | 0 | 1/2 | 1/2 | 0.0306(9) |
| Li1 | 2a | 1/2 | 1/2 | 0 | 0.0160(5) | |
| Al1 | 4g | 0.71 | 1/2 | 0.8277(5) | 0 | 0.0206(11) |
| Si1 | 8j | 0.88 | 0.4185(4) | 0.6681(2) | 0.2673(2) | 0.0185(6) |
| Al2 | 8j | 0.12 | 0.4185(4) | 0.6681(2) | 0.2673(2) | 0.0185(6) |
| O1 | 4i | 0.4722(19) | 1/2 | 0.3264(9) | 0.0270(2) | |
| O2 | 8j | 0.6769(11) | 0.7649(7) | 0.3313(6) | 0.0258(13) | |
| O3 | 8j | 0.3605(11) | 0.6759(6) | 0.1056(6) | 0.0229(13) | |
| F1 | 4i | 0.8921(16) | 1/2 | 0.0994(8) | 0.0470(2) |
| Atom | U11 | U22 | U33 | U12 | U13 | U23 |
|---|---|---|---|---|---|---|
| K1 | 0.0279(18) | 0.0253(17) | 0.040(2) | 0.00000 | 0.0088(15) | 0.00000 |
| Rb1 | 0.0279(18) | 0.0253(17) | 0.040(2) | 0.00000 | 0.0088(15) | 0.00000 |
| Li1 | 0.011(11) | 0.013(12) | 0.028(13) | 0.00000 | 0.013(10) | 0.00000 |
| Al1 | 0.018(2) | 0.016(2) | 0.029(2) | 0.00000 | 0.0080(19) | 0.00000 |
| Si1 | 0.0147(11) | 0.0133(11) | 0.0286(11) | −0.0006(7) | 0.0067(8) | 0.0018(8) |
| Al2 | 0.0147(11) | 0.0133(11) | 0.0286(11) | −0.0006(7) | 0.0067(8) | 0.0018(8) |
| O1 | 0.037(5) | 0.012(4) | 0.033(5) | 0.00000 | 0.006(4) | 0.00000 |
| O2 | 0.016(3) | 0.028(3) | 0.035(3) | −0.008(2) | 0.009(2) | −0.002(3) |
| O3 | 0.022(3) | 0.015(3) | 0.034(3) | −0.001(2) | 0.011(2) | −0.001(2) |
| F1 | 0.025(4) | 0.088(8) | 0.030(4) | 0.00000 | 0.008(3) | 0.00000 |
| K1—O1 | 2.973(9) × 2 | Al1—O3 | 1.955(8) × 2 |
| K1–O1′ | 3.275(10) × 2 | Al1–O3′ | 1.979(6) × 2 |
| K1–O2 | 2.969(6) × 4 | Al1–F1 | 1.984(7) × 2 |
| K1–O2′ | 3.218(6) × 4 | <M2–O> | 1.973 |
| <I–O> inner | 2.970 | Si1–O1 | 1.631(4) |
| <I–O> outer | 3.237 | Si1–O2 | 1.631(8) |
| Li1–O3 | 2.112(6) × 4 | Si1–O2’ | 1.632(6) |
| Li1–F1 | 2.101(8) × 2 | Si1–O3 | 1.610(6) |
| <M1–O> | 2.108 | <T–O> | 1.626 |
| O1i–K1–O2i | 49.56(10) | Si1–O1–K1ii | 107.25(7) |
| O2i–K1–O1 | 94.95(10) | Si1–O1–K1 | 95.63(7) |
| F1–Li1–O3 | 98.74(16) | K1ii–O1–K1 | 112.58(29) |
| F1–Li1–O3 | 81.3(2) | Si1–O2–K1ii | 97.19(24) |
| O3–Si1–O2 | 111.35(32) | Si1–O3–Al1 | 124.83(34) |
| O3–Si1–O1 | 113.76(23) | Si1–O3–Li1 | 117.43(32) |
| O2–Si1–O1 | 105.99(24) | Al1–O3–Li1 | 92.79(22) |
| I-site | M1-site | M2-site | T-site | Sum | |
|---|---|---|---|---|---|
| O1 | 0.105 × 2↓ | 0.980 × 2→ | 2.11 | ||
| 0.046 × 2↓ | |||||
| O2 | 0.107 × 4↓ | 0.980 | 2.12 | ||
| 0.054 × 4↓ | 0.977 | ||||
| O3 | 0.175 × 4↓ | 0.440 × 2↓ | 1.037 | 2.06 | |
| 0.412 × 2↓ | |||||
| F1 | 0.135 × 2↓→ | 0.308 × 2↓→ | 0.89 | ||
| Sum | 0.95 | 0.97 | 2.31 | 3.97 |
| Fluorluanshiweiite | Luanshiweiite * | Voloshinite † | |||||||
|---|---|---|---|---|---|---|---|---|---|
| I-site | K | K | Rb | ||||||
| M-site | LiAl1.5□0.5 | LiAl1.5□0.5 | LiAl1.5□0.5 | ||||||
| T-site | Si3.5Al0.5 | Si3.5Al0.5 | Si3.5Al0.5 | ||||||
| A-site | F2 | (OH)2 | F2 | ||||||
| Crystal system | Monoclinic | Monoclinic | Monoclinic | ||||||
| Space group | C/2m | C2/c | C2/c | ||||||
| Polytype | 1M | 2M1 | 2M1 | ||||||
| a(Å) | 5.2030(5) | 5.1861(7) | 5.191 | ||||||
| b(Å) | 8.9894(6) | 8.9857 (13) | 9.025 | ||||||
| c(Å) | 10.1253(9) | 19.970(3) | 20.40 | ||||||
| β(°) | 100.68(1) | 95.420(3) | 95.37 | ||||||
| V(Å3) | 465.37(7) | 926.5(2) | 951.5 | ||||||
| Z | 2 | 4 | 4 | ||||||
| Density(cal.) | 2.898 | 2.868 | 2.95 | ||||||
| Optical properties | biaxial (–) | biaxial (–) | biaxial (–) | ||||||
| α | 1.554 | 1.5474 | 1.511 | ||||||
| β | 1.581 | 1.5700 | 1.586 | ||||||
| γ | 1.583 | 1.5729 | 1.590 | ||||||
| 2V(cal.) | 30° | 39° | 25° | ||||||
| Selected strongest lines in the powder pattern, The intensities of 8 strongest lines are in bold. | dmeas | Imeas | hkl | dmeas | Imeas | hkl | dmeas | Imeas | hkl |
| 8.427 | 25 | 001 | 9.891 | 35 | 002 | 10.100 | 60 | 002 | |
| 4.519 | 57 | 020 | 4.451 | 31 | 111 | 4.550 | 80 | 020 | |
| 3.856 | 14 | 111 | 3.870 | 11 | 113 | 3.980 | 40 | 112 | |
| 3.628 | 61 | 112 | 3.703 | 12 | 023 | 3.770 | 40 | 023 | |
| 3.350 | 60 | 022 | 3.314 | 36 | 006 | 3.350 | 60 | 006 | |
| 3.091 | 46 | 112 | 3.090 | 40 | 115 | 3.220 | 40 | 114 | |
| 2.898 | 25 | 113 | 2.973 | 34 | 025 | 3.020 | 45 | 025 | |
| 2.680 | 17 | 023 | 2.769 | 24 | 116 | 2.805 | 30 | 116 | |
| 2.586 | 100 | 130 | 2.565 | 100 | 116 | 2.575 | 100 | 116 | |
| 2.457 | 25 | 131 | 2.454 | 12 | 133 | 2.469 | 15 | 133 | |
| 2.390 | 25 | 132 | 2.378 | 31 | 133 | 2.410 | 20 | 133 | |
| 2.254 | 17 | 221 | 2.243 | 11 | 221 | 2.234 | 10 | 222 | |
| 2.141 | 14 | 133 | 2.130 | 27 | 043 | 2.141 | 40 | 135 | |
| 1.996 | 10 | 223 | 1.986 | 30 | 00,10 | 1.986 | 10 | 224 | |
| 1.640 | 16 | 116 | 1.647 | 32 | 314 | 1.660 | 30 | 314 | |
| 1.506 | 45 | 312 | 1.500 | 26 | 060 | 1.501 | 40 | 332 | |
| 1.343 | 10 | 316 | 1.345 | 14 | 13,13 | 1.351 | 10 | 13,13 | |
© 2020 by the authors. Licensee MDPI, Basel, Switzerland. This article is an open access article distributed under the terms and conditions of the Creative Commons Attribution (CC BY) license (http://creativecommons.org/licenses/by/4.0/).
Share and Cite
Qu, K.; Sima, X.; Li, G.; Fan, G.; Shen, G.; Liu, X.; Xiao, Z.; Guo, H.; Qiu, L.; Wang, Y. Fluorluanshiweiite, KLiAl1.5□0.5(Si3.5Al0.5)O10F2, a New Mineral of the Mica Group from the Nanyangshan LCT Pegmatite Deposit, North Qinling Orogen, China. Minerals 2020, 10, 93. https://doi.org/10.3390/min10020093
Qu K, Sima X, Li G, Fan G, Shen G, Liu X, Xiao Z, Guo H, Qiu L, Wang Y. Fluorluanshiweiite, KLiAl1.5□0.5(Si3.5Al0.5)O10F2, a New Mineral of the Mica Group from the Nanyangshan LCT Pegmatite Deposit, North Qinling Orogen, China. Minerals. 2020; 10(2):93. https://doi.org/10.3390/min10020093
Chicago/Turabian StyleQu, Kai, Xianzhang Sima, Guowu Li, Guang Fan, Ganfu Shen, Xing Liu, Zhibin Xiao, Hu Guo, Linfei Qiu, and Yanjuan Wang. 2020. "Fluorluanshiweiite, KLiAl1.5□0.5(Si3.5Al0.5)O10F2, a New Mineral of the Mica Group from the Nanyangshan LCT Pegmatite Deposit, North Qinling Orogen, China" Minerals 10, no. 2: 93. https://doi.org/10.3390/min10020093
APA StyleQu, K., Sima, X., Li, G., Fan, G., Shen, G., Liu, X., Xiao, Z., Guo, H., Qiu, L., & Wang, Y. (2020). Fluorluanshiweiite, KLiAl1.5□0.5(Si3.5Al0.5)O10F2, a New Mineral of the Mica Group from the Nanyangshan LCT Pegmatite Deposit, North Qinling Orogen, China. Minerals, 10(2), 93. https://doi.org/10.3390/min10020093