Abstract
The rapid development of Multi-access Edge Computing (MEC) technology is transforming traditional platform services and enabling realization of the mMTC vision of 5G networks. MEC allows computational tasks to be offloaded to devices at the network edge, enabling real-time crowd sensing. However, due to the limited resources in MEC environments, it is essential to propose efficient service deployment and traffic management strategies that balance Quality of Service (QoS) with costs. This paper addresses the challenge by modeling the QoS-effective joint service deployment and traffic management problem (QST) as a nonlinear integer optimization problem. We propose a customized genetic algorithm called GA4QST, which aims to minimize cost-performance ratios. In the experimental section, GA4QST is compared with baseline algorithms in terms of efficiency and effectiveness. Although GA4QST exhibits slightly increased complexity compared to the original genetic algorithm, it performs exceptionally well in balancing benefits and average time costs. GA4QST demonstrates strong capabilities in finding optimal solutions, consistently outperforming baseline algorithms. This further confirms the effectiveness and potential applicability of GA4QST in real-world scenarios. Finally, we also explore the impact on optimization outcomes of system configurations such as service diversity, data volume, processing power, and network characteristics. The results indicate that GA4QST has broad applicability and represents a feasible solution for practical MEC applications.
1. Introduction
Gently, the curtain rises on a new era of intelligent mobile computing, with a diverse array of visible mobile applications central to our lives, extending their influence to the unseen corners of our environment []. The report released by Ericsson predicts that there will be 24 billion interconnected devices around us by 2050 (https://www.ericsson.com/en/internet-of-things, accessed on 5 January 2024). This swift expansion presents both opportunities and challenges. The considerable user base and its diverse needs are expected to develop a varied service market. Conversely, we must also consider potential barriers. In addition to the constraints imposed by limited mobile device resources, the network congestion exacerbated by the explosion of connections could impede the provision of seamless experiences in traditional cloud computing paradigm, thereby undermining the adoption and widespread use of mobile services. Therefore, the multi-access edge computing (or mobile edge computing) paradigm has been considered as both a key supplement and an important solution to these issues. With its hierarchical computing architecture, MEC optimizes the utilization of mobile resources and wireless networks by executing computation tasks close to the data sources, thereby facilitating the delivery of high-quality services [,,].
This study focuses on the field of service computing and service management. Several studies published in the Symmetry journal provide important references for this work. Duan et al. optimized cloud task scheduling using an adaptive genetic algorithm []. Cheng et al. proposed an improved beetle optimization algorithm for efficient task offloading in MEC []. Ye and Jiang developed a data integrity verification protocol to enhance security in edge computing []. These studies offer valuable insights for this research.
In our former paper [], we elucidated the role of mobile devices as crowd sensing participants within an MEC environment. Edge servers are located within a single-hop or short-hop distance. Mobile devices capture environmental data, upload these data, and request service modules on the edge servers to perform analysis tasks. []. This architecture is depicted in Figure 1 []. Moreover, to augment the efficiency of sensing and analysis, edge servers can collaborate locally by utilizing Platform as a Service (PaaS) management technologies. Examples of these technologies include OpenShift (http://www.openshift.com/, accessed on 5 January 2024), Kubernetes (https://kubernetes.io/, accessed on 5 January 2024), and Software-Defined Network (SDN)-based network management technologies such as OpenFlow (https://opennetworking.org/sdn-resources/customer-case-studies/openflow/, accessed on 5 January 2024) [,,]. These technologies allow for the flexible utilization of nearby cluster resources on a global scale. For example, an edge server can forward requests along with sensed data to other servers that are capable of processing the data. While this enhances service quality, the proliferation of the MEC paradigm also transforms the economy pattern of traditional PaaS systems, as resources can now be managed from a more fine-grained perspective.
Figure 1.
Framework of MEC-based crowd sensing.
However, the overall QoS improvement trends mentioned above still cannot compensate for the performance losses caused by improper resource allocation or deficiencies in network traffic scheduling strategies. Developers need to be more cautious when formulating resource allocation plans based on budget and QoS requirements, and should focus on how to optimally utilize the resources provided by the MEC platform to achieve QoS objectives. For example, too many available resources may be allocated to services that are rarely used, or high traffic may be scheduled through unstable network connections. This can lead to the edge service system being unable to meet performance expectations, particularly in the case of AI services that require very large amounts of computational power and data. While it is possible to allocate a wide range of resources to improve user experience [], the associated costs can be prohibitive, especially when the resources of the related edge server are insufficient. Therefore, finding a cost-effective service placement and traffic management strategy becomes highly meaningful.
Our experiments demonstrate that the proposed GA4QST algorithm can effectively generate service placement and traffic management strategies with cost benefits. This algorithm outperforms baseline algorithms across multiple metrics. We performed numerous experiments to evaluate the resilience of the proposed GA4QST algorithm, finding that it showed significant ability to achieve optimal solutions. In summary, the contributions of this work are as follows:
- 1.
- We conducted a detailed analysis on the MEC-based crowd sensing service system’s performance. Our investigation aimed to quantify the influence of service deployment and network strategies on system costs.
- 2.
- We thoroughly investigated the tradeoff between performance and cost in the system across various service placement and traffic management strategies by creating a mathematical model of the QoS-effective joint service deployment and traffic management problem (QST).
- 3.
- To address the target problem in a manageable way for a given system configuration, we propose an algorithm named GA4QST, which is based on the classical genetic algorithm framework. A comprehensive analysis of the proposed algorithm is also provided.
- 4.
- To thoroughly evaluate the efficacy of the proposed algorithm, we conducted a detailed comparative analysis with baseline algorithms. The experimental results demonstrate that GA4QST performs excellently in generating optimal solutions. In addition, our experiments explored the impact of different system settings on the performance of the proposed algorithm.
2. Motivation and Scenarios
In this section, we present the motivation behind the current research and exhibit the research scenario using the brief case of an MEC-based crowd sensing service system. The presentation allows optimal operations to be demonstrated clearly before the problem formulation.
In MEC applications, Massive Machine-Type Communication (mMTC) represents one of the key research topics. The primary challenge lies in supporting connection densities as high as 1.0 × 10⁶ device/km2 []. Smart cities represent one such scenario []. In a smart city, millions of distributed mobile devices sense their local environments and upload the data for further analysis, such as the City Brain (https://damo.alibaba.com/labs/city-brain?lang=en, accessed on 12 March 2024). However, to obtain the results in time, it is necessary to increase the data sampling frequency, which will unquestionably result in a data flood []. Thus, the MEC paradigm is taken advantage of to complete tasks using the resources of nearby edge servers.
For instance, a simple MEC-based crowd sensing service system in a smart city project with two different services ( and ), four access points (–), and six edge devices (– and –) is shown in Figure 2. In this case, the MEC architecture follows the European Telecommunications Standards Institute (ESTI) reference (https://portal.etsi.org/, accessed on 8 February 2024) as Figure 3, where the MEC servers (edge servers) act as filters to hand the data flows from the mobile device to the cloud. Because not all edge devices are adequate to become edge servers [,,], here only and are selected.
Figure 2.
Case illustrating the MEC-based crowd sensing service system.
Figure 3.
A feasible form of data flow in an MEC-based crowd sensing system.
Using PaaS technology, service instances can be placed on any accessible MEC server that has sufficient resources. In this scenario, service is deployed on two individual service instances, namely, MEC servers and , while only one instance of service is deployed on . Each SDN-enabled edge device has its own flow table [], represented by matrix-like forms near the edge devices (as shown in Figure 2). These flow tables indicate the routing of service requests. For instance, the entry , in the flow table near signifies that requests for are routed to by , while requests for are routed to . It is worth noting that ⌀ is used in this example to indicate that requests are processed by the service instance on the corresponding edge device; consequently, only MEC servers with the deployed service have ⌀ in their flow tables. In this case, the workloads of the instances for are unbalanced, as no requests for are dispatched to , resulting in the idle state of the service instance on , while the instance on handles all the requests. Thus, there are several potential optimizations of this system. For instance, when the instance on is capable of handling all the requests, the service instance of on can be released to reduce costs. Additionally, the flow table of can be modified from (:) to (:) in order to offload some of the workload from to for load balancing. Choosing between these operations depends on the present system state as well as the performance and cost requirements of the operator. Therefore, the objective of this paper is to quantify performance and cost while considering strategies for service deployment and network management (e.g., flow tables) as decision variables. The aim is to identify the optimal strategy for satisfying both performance and cost requirements.
3. Literature Review
3.1. Service Deployment in Edge Environments
As the evolution of MEC technology continues, the issue of service deployment has become increasingly important. An effective service deployment or placement strategy serves a dual purpose, balancing the workloads of high-load servers while ensuring the quality of service required by users. Many researchers have focused on studying service deployment strategies on edge servers. The main aim has been to improve the service hit rate on edge servers by optimizing service deployment, thereby reducing the average response time of services.
For instance, researchers have explored service deployment in industrial IoT-based MEC environments. Borsatti et al. introduced an automated deployment framework tailored for Industrial IoT applications, harnessing the capabilities of proximity computing platforms such as edge and fog environments. Their implementation showcased the swift conversion of industrial IoT applications to services based on MEC, covering a range of technological fields in mere seconds []. Although IoT plays a significant role, many researchers are also concerned with the cooperation of internal nodes. Lv et al. investigated the impact of service interactions and the resulting reduction in service performance due to increased node loads. They modeled service interactions as a communication overhead graph and introduced an approach using deep Q-learning to address the multi-objective service deployment problem. The goal was to control communication overhead and balance node load []. Regarding service deployment costs, Sriraghavendra et al. proposed a novel multilayer deadline-aware service placement architecture that comprehensively considers service response time and resource overhead []. Wang et al. proposed a microservice-oriented service placement mechanism to optimize resource utilization and reduce service latency in sustainable Internet of Vehicles (IoV) contexts supported by MEC []. Tang et al. introduced a two-time-scale hierarchical framework for jointly optimizing service deployment and task scheduling in satellite edge computing networks to enhance the network’s computational performance [].
Compared to the aforementioned methods, many studies have also focused on designing efficient service chain deployment strategies to optimize the way in which services are provided. Zhang et al. proposed a framework called Dapper that uses Deep Reinforcement Learning (DRL) to deploy service function chains in programmable data planes []. Addressing the impact of heterogeneous devices on deployment and management in edge computing environments, Huang et al. proposed a service function chain deployment strategy that considers device heterogeneity, then optimizes the placement of service function chains to minimize service latency and improve resource utilization and energy efficiency []. While the above works focus on optimizing objectives such as service response time and resource utilization, they overlook the impact of service deployment on quality of service.
3.2. Network Management in Edge Environment
Network traffic management is also a significant challenge in MEC environments. In smart city scenarios, a large number of edge devices simultaneously sending service requests may cause network congestion, leading to degraded service quality and reduced data transmission efficiency. Mavromatis et al. developed a management framework for MEC-enabled IoT systems for multi-domain wireless sensor networks that was grounded in a software-defined network architecture. Their proposed dynamic framework offers continual detection for sensor faults. []. Bellavista et al. conducted research on application-aware network traffic management in MEC-integrated industrial environments by combining SDN and edge computing, leveraging eINP to achieve higher packet load processing capabilities []. To address the issues of high data traffic and latency in smart city scenarios, Saleem et al. proposed an Adaptive Information-Centric Networking–Edge Computing Framework (AICN-ECF), introducing network caching into the information-centric networking to enhance content delivery and improve user experience [].
Compared to the aforementioned approaches, many recent studies have utilized deep learning for traffic management. Kim et al. focused on IoT device traffic and queuing delays, exploring innovative self-learning network management algorithms at edge nodes. They introduced a method hinging on deep reinforcement learning stratagems, incorporating a modulatory factor into the reward equation in order to strike a balance between queuing delay and data throughput []. Song et al. proposed a low-power active queue management algorithm based on deep reinforcement learning for IoT sensor networks, thereby optimizing information freshness to achieve traffic management []. Absardi et al. introduced a novel deep learning-based traffic management algorithm designed to predict alternative optimal paths containing specified nodes in IoT-pervasive environments [].
Although there has been a significant amount of research on network traffic management and service deployment in edge environments, very few existing studies have combined these two directions for joint optimization. As a result, the aforementioned research on network management and service deployment cannot address the problem proposed in this paper, namely, optimizing service deployment and network traffic management strategies in order to balance system performance and cost while ensuring QoS.
4. System Model and Problem Description
This section explores the key related entities and how they connect with each other, showing the effect these connections have on the system’s state.
4.1. Introduction to System Entities
In this study, we investigate a crowd sensing service system based on MEC in which SDN is employed to manage the communication of edge devices. The primary goal is to pinpoint the optimal MEC servers for placing services and to create flow tables designed to ease possible network congestion. We represent the edge nodes or devices that may be chosen for MEC server deployment as = . We denote the remaining edge nodes, which function as SDN switches, as = . For the purpose of this study, we designate wireless routers or base stations as our access points and represent these access points as =, considering A as the collection of access points. Each is responsible for connecting with mobile devices and receiving their requests. The array of services provided by the crowd sensing system based on MEC is represented as = , with each service capable of being deployed and instantiated on any . In particular, we define the set = to encompass all devices capable of dispatching requests, where = . The topology of the MEC-based crowd sensing service system network is represented as . The topology is calculated using , where for we have
4.2. System QoS Analysis
Given the aforementioned examples and definitions, we are equipped to begin evaluating the QoS and performance exhibited by the MEC-based crowd sensing service system. Specifically, we examine the average processing time of mobile device requests along with their resource consumption. If a service instance is situated on an MEC server that cannot be accessed, we may consider that such instances do not contribute to the processing of requests in these circumstances. As a result, the implementation of service deployment strategies and network management techniques is deemed to have minimal significance for these particular requests. Therefore, we divide the MEC-based crowd sensing service system into several connected subgraphs based on the value of , which are denoted as . This division enables us to disregard extraneous details, permitting us to concentrate solely on examining the device behaviors pertinent to the specified request within a singular subgraph. For clarity and consistency, the notation in the rest of this paper omits the superscript j in the performance–cost analysis of .
4.2.1. Wireless Transmission
For service requests pertaining to (including the collected data) produced from mobile devices in the vicinity of at a rate of qps, the required duration for wireless data transfer between a mobile device and the access point is depicted as
where represents the mean rate of wireless data transmission.
4.2.2. Request Routing
When the access point receives the service request of , it initiates a journey through the SDN switches until it reaches the target service instance of . The flow tables within the SDN switches and MEC servers can determine the routing of requests. However, in contrast to the example provided in Section 2, we can consider all flow tables to be represented using a tensor. This tensor is denoted as
The deployment status of a service instance can be denoted by a matrix. This matrix is represented as
Due to resource constraints, the MEC server cannot accommodate an infinite number of service instances. Under the limitation of service instances, we can assume that an MEC server can accommodate a maximum of service instances and . For every server , we have the following constraint:
Assuming that the service instance of any given service is deployed only once on an MEC server and that flows do not possess multiple destinations, we can deduce the following conclusion:
Given the presence of a flow table tensor for the system, it is possible to identify the target device for the service emanating from the edge device v by using . This representation is signified by and is an element of the set . By analyzing , we can obtain a set of routing paths ). These routing paths indicate the order of nodes that a request visits for service :
where = , = and = 1.
Given the network’s prohibition of loops, the ensuing constraint is required to be in effect for and for any , within :
The total time cost of routing can be appraised as follows:
for all , with the average data transmission rate between edge devices u and v denoted by .
4.2.3. Service Execution
When the MEC server receives the requests, it activates the relevant service instance for execution. Here, the mean rate at which service processes data is represented by , while the time cost of processing is represented as
In summary, the overall lifespan of a service request received from access point can be estimated as follows:
When service requests are received at a rate of qps near access point , the anticipated duration of a request’s lifetime, i.e., the mean time expense, is
With Equation (11), this can be transformed to
where the constant = stands for the average wireless transmission time and = is the average processing time.
4.3. System Cost Evaluation
Now, we can measure the overall cost of the MEC-based crowd sensing service system considering a given flow table strategy and service placement strategy . The cost comprises two components: monetary expense and balancing loss.
Budget Surplus. The budget surplus represents the difference between the allocated budget and the monetary expense incurred by utilizing edge device resources [,]. The monetary expense is determined by the pricing models employed by infrastructure vendors []. Here, we also utilize the linear model to determine the pricing for allocating resources to service instances. As a result, the budget surplus is computed as
where is the unit price of instance . The value of is consistently influenced by maintenance costs, R&D costs, and electricity costs.
Balancing Gain. It is widely acknowledged that unbalanced allocation of resources can result in wasteful inefficiencies. In this study, we focus on the MEC-based crowd sensing service system and examine the balance between network resources and computation resources. Specifically, we investigate the extent of imbalance between these resources. The metric employed for assessing the network connectivity efficacy between a pair of edge devices is the total throughput :
where is the indicator that checks whether the expression expr is true (=1) or not (=0). Consequently, the degree of network imbalance is
In a parallel context, the service instances which leverage the computational resources of MEC servers exhibit a level of service imbalance that can be assessed using the following formula:
The cumulative unbalancing of the computational resources can be quantified as
Summing these measures allows us to assess the balancing gain:
4.4. Problem Formulation
Upon introducing the aforementioned constraints, the objective becomes the quotient of system performance to system cost (the cost–performance ratio):
Now, we can present a precise and formal definition of our problem involving traffic management and service deployment within the MEC-based crowd sensing service system:
Note that the no-loop constraint is translated into , as a possible path without loops can only contain at most nodes.
The important notation is summarized in Table 1.
Table 1.
Symbol description.
5. Metaheuristic Algorithm for QST
The Genetic Algorithm (GA) is a well-established family of metaheuristic algorithms inspired by the natural selection process. GAs simulate evolution to solve optimization problems []. First, a GA evaluates a population by using a fitness function that describes how well an individual in the population adapts to the environment, then simulates how a solution contributes to the minimization of a given objective. Through iterative selection and filtering of the most adaptive characteristics, the quality of solutions is gradually enhanced. The converged solutions can then be adopted as the optimal final solutions. Based on the considerations above, in this paper we propose the GA4QST algorithm for solving the joint optimization problem of service deployment and traffic management (QST) by improving the GA framework. The flow of the proposed algorithm is shown in Algorithm 1, with an elite model specifically introduced to ensure the algorithm’s convergence []. In Algorithm 1, the function selectElite is used to ensure that the optimal solution is retained in each iteration. The subsequent sections delve into the details of the proposed algorithm at different stages.
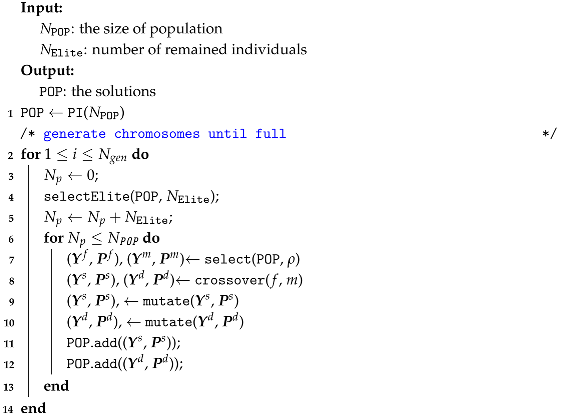
| Algorithm 1: GA for QST, GA4QST |
![]() |
- (1)
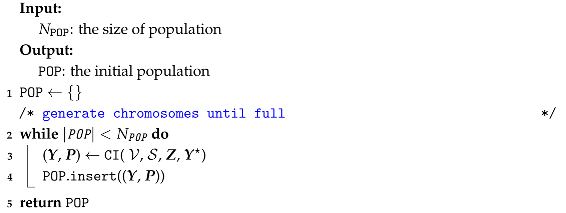
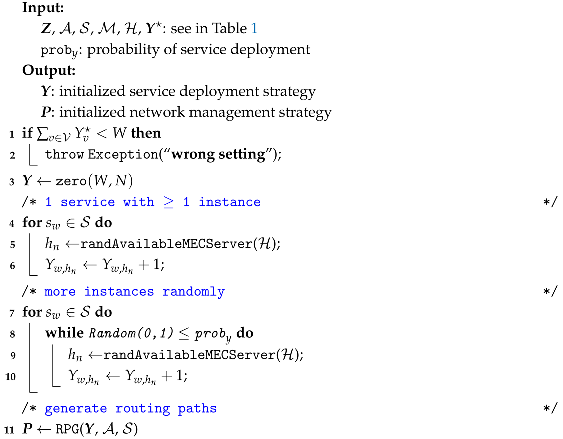
- Encoding and Initialization. In this phase, our objective is to represent our solution as a series of binary digits, commonly referred to as chromosomes, which is a term borrowed from biology where chromosomes carry genetic information and represent individuals. In this study, because and are 0–1 (binary) variables, it is unnecessary to make an additional effort to encode chromosomes or solutions. After the encoding is established, we proceed to initialize the population, as shown in Algorithm 2. Typically, a large number of possible chromosomes are randomly generated (CI in line 3 of Algorithm 2) to form an initial population. The random generation is aimed at covering a wider solution space. However, because our problem imposes constraints on the solutions, the initialization cannot be random. On the contrary, we employ Algorithm 3 to initialize a valid solution. Initially, it randomly chooses an available that is able to accommodate more than one service instance for each involved service , ensuring the existence of all services (Algorithm 3, lines 3–5). Subsequently, it considers different service deployment strategies, where certain services may have multiple instances (Algorithm 3, lines 6–9). During this phase, a hyperparameter proby is used to control the number of instances in the final service deployment strategy. The function randAvailableMECServer() selects the MEC server with the following probability:
| Algorithm 2: Population Initialization, PI |
![]() |
| Algorithm 3: Chromosome Initialization, CI |
![]() |
Finally, the routing paths are determined (Algorithm 4, lines 5) by tracing the request of service from access point . In this phase, the function randPath(,v) is used to randomly select a legal routing path that starts from and ends with v by sampling from the legal routing path set , which is generated recursively by
Note that in Equation (23) the neighbor of u (i.e., ) is obtained by observing the value of , which means that generation of is performed offline in advance.
With chromosomes or solutions initialized by Algorithm 3, the population initialization algorithm (Algorithm 2) is then completed by packing them up.
| Algorithm 4: Routing Path Generation, RPG |
![]() |
- (2)
- Selection. The genetic algorithm operates through the process of generation updating, with each iteration representing a attempt to find new solutions. In each update, some of the existing solutions are chosen to reproduce and create a new solutions based on their fitness or qualities. In our research, where the goal is to minimize the cost–performance ratio , the fitness function f in our approach can be defined as . Let represent the i-th chromosome in the population POP. The probability of selecting as a parent can be denoted as
- (3)
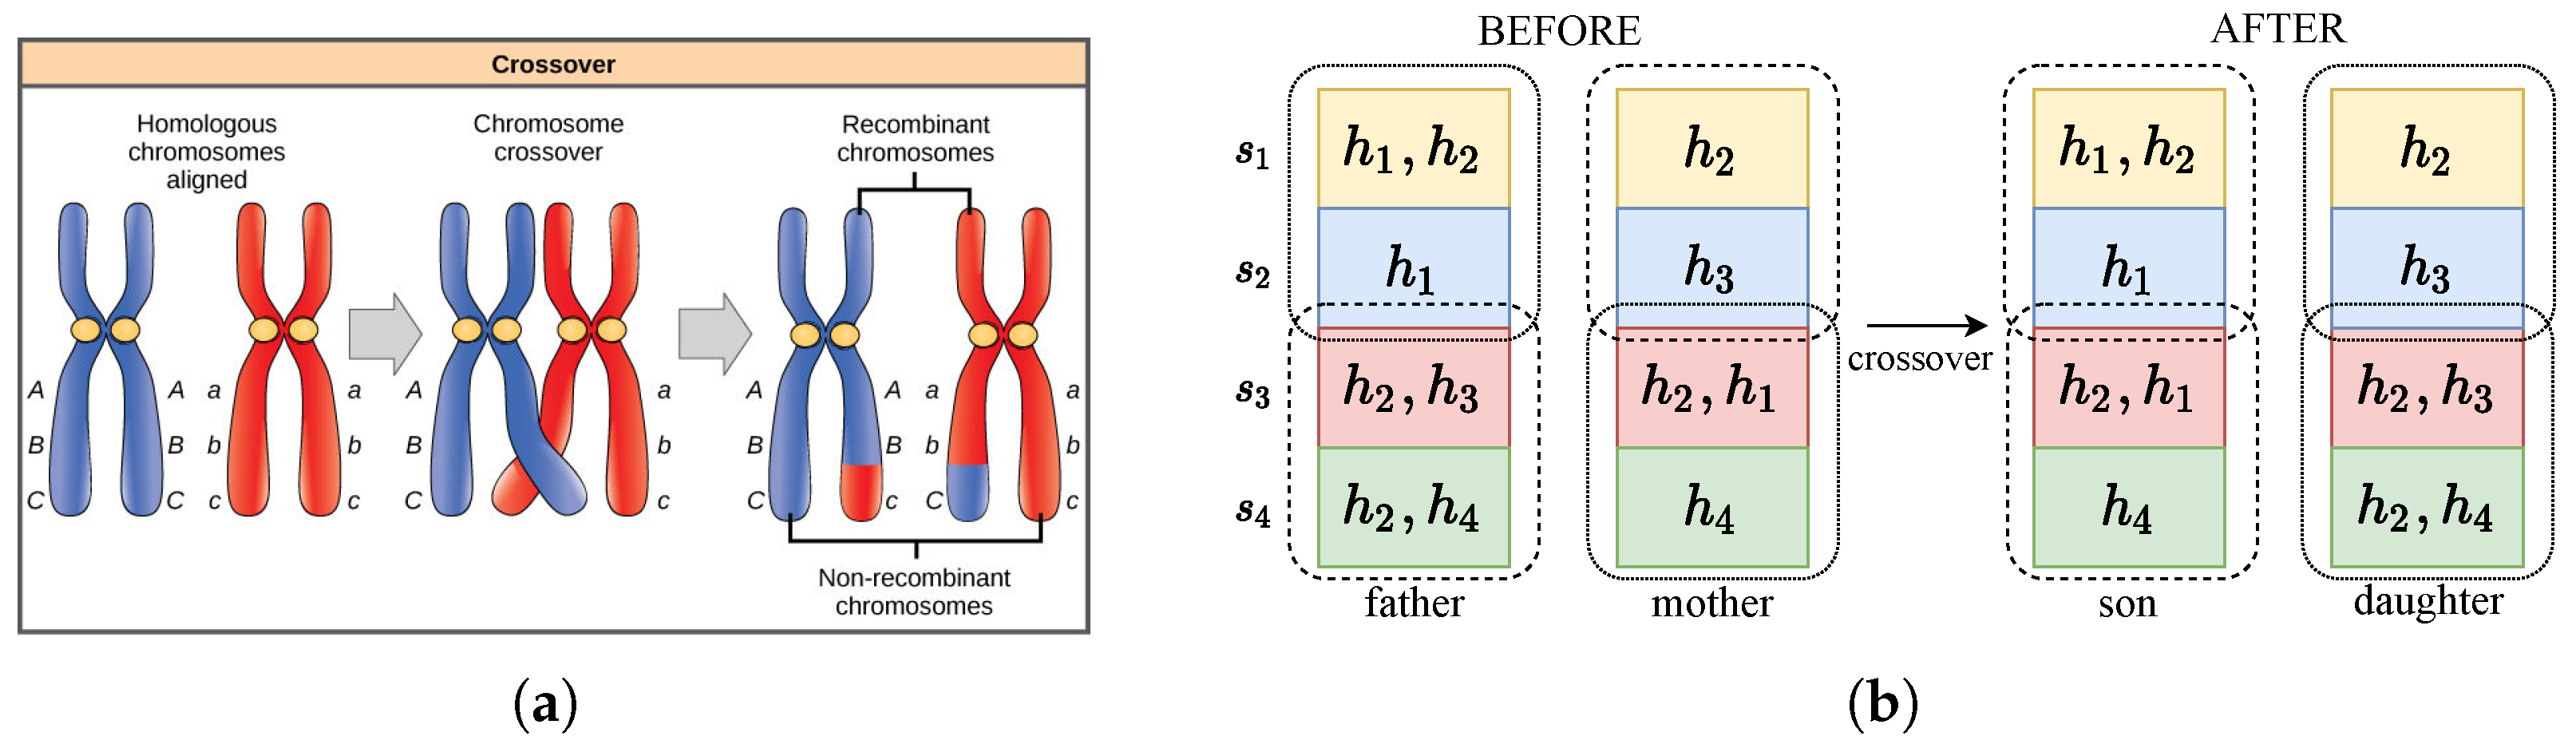
- Crossover. After selecting the mother chromosome and father chromosome with probabilities , as shown in Equation (24), the partial values carried by the father solution are exchanged into the mother solution to generate new child solutions. This process is similar to the chromosome crossover shown in Figure 4a (https://open.lib.umn.edu/horticulture/chapter/14-3-linkage-and-inheritance-of-small-differences/, accessed on 1 January 2024). In the method proposed in this paper, the crossover of two solutions in Algorithm 5 stands for the exchanging of selected service instances and their network status.
Figure 4. (a) An illustration of chromosome crossover in biology and (b) an illustration of the crossover of two solutions in GA4QST.
| Algorithm 5: Crossover |
Input: , : the father solution , : the mother solution : the capacity vector Output: , : the son solution , : the daughter solution 1 ; 2 ;
/*
instances to be exchanged */ 3 sample(, Random(W)); 4 ;
/*
separate solutions */ 5 ; 6 ; 7 ; 8 ;
/*
generate new children */ 9 ;
/*
child solution standardization */ 10 makeMatrix(), makeMatrix();
/*
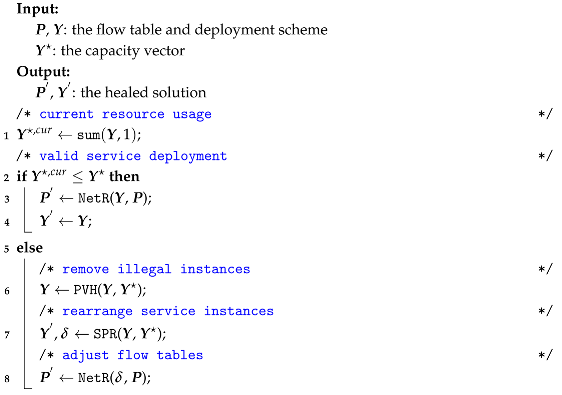
heal the solutions */ 11 , ←SH(, , ); 12 , ←SH(, , ); |
For instance, given a father solution and a mother solution as shown in Figure 4b, the service deployment strategies are initially partially exchanged. After is chosen as the crossover point, the target MEC servers of and from the two chromosomes are interchanged, yielding a son solution and a daughter solution. Correspondingly, the traffic is redirected. In the son solution, the requests on that were initially sent to the instances on or in the father solution are now directed to or . The requests pertaining to are now required to be sent to . However, it is important to note that not all service deployment strategy crossovers are valid, as the capacities of MEC servers may vary. For instance, the father solution and mother solution are valid when = 2, = 3, = 1, = 1; however, for the son solution, now carries three service instances (, , ), while for the daughter solution now holds three service instances (, , ), where 3 > and 2 >. Therefore, we need to heal the solutions generated during the crossover process, as outlined in Algorithm 6.
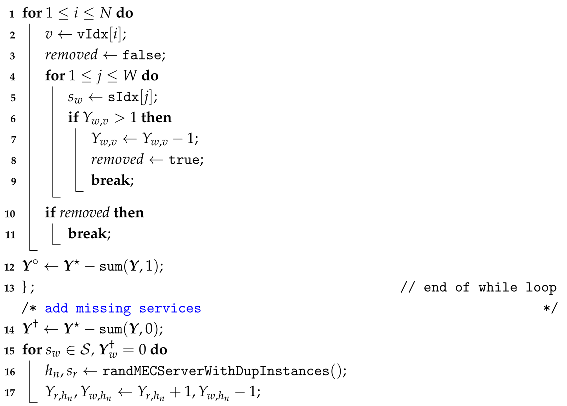
| Algorithm 6: Solution Healing, SH |
![]() |
The heal operation consists of three phases: service deployment violation healing (PVH), service deployment rearranging (SPR), and network rearranging (NetR). In the PVH step, invalid placements resulting from the crossover operation are addressed by removing instances that exceed the capacities of the MEC servers. The detailed procedure is described in Algorithm 7.
| Algorithm 7: Placement Violation Healing, PVH. |
![]() |
![]() |
When all service instances have been successfully deployed via PVH, they must be transferred to suitable MEC servers via SPR, as outlined in Algorithm 8.
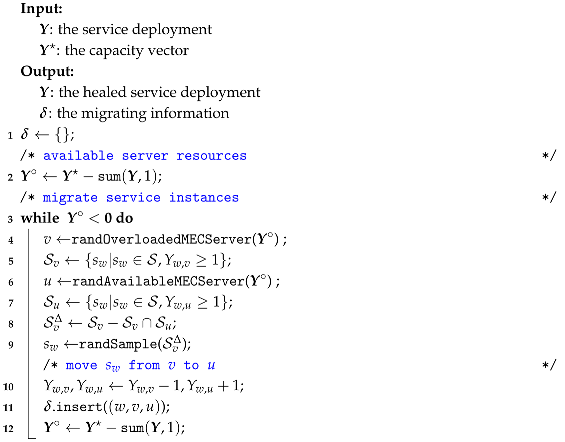
| Algorithm 8: Service Deployment Rearranging, SPR |
![]() |
At last, relevant network management tasks such as adjusting the flow tables are carried out via NetR (see Algorithm 9).
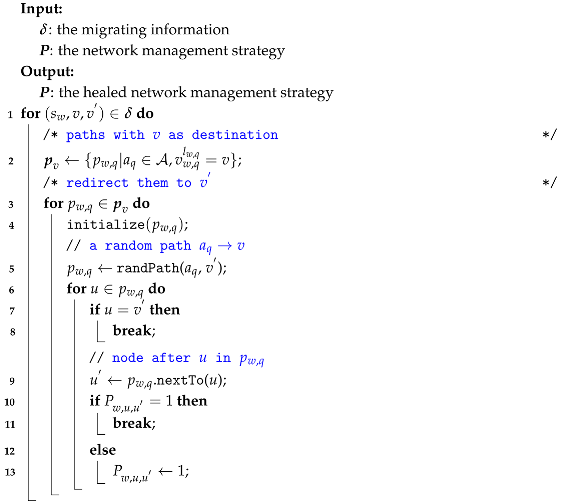
| Algorithm 9: Network Rearranging, NetR |
![]() |
- (4)
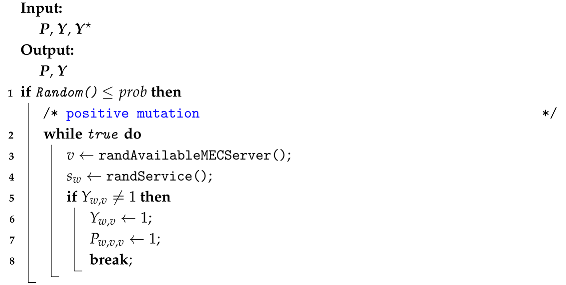
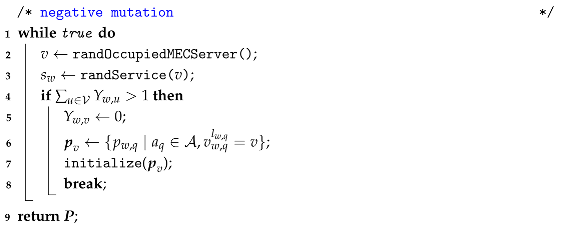
- Mutate. Following crossover, the mutate operation is adopted to prevent premature convergence. In this phase, some segments of the solutions change with probability , which is referred to as the mutation probability. In our study, mutation can occur in two directions: positive and negative. The process is illustrated in Algorithm 10. In positive mutation, a random service instance is deployed on an available MEC server , then the relationship (: ) is added to the flow tables for . Conversely, in negative mutation, a duplicate service instance is removed from a randomly selected MEC server , then the corresponding flow tables are reset.
| Algorithm 10: Mutation |
![]() |
![]() |
6. Experiments and Analysis
In this section, we evaluate the efficacy of the proposed approach by comparing its results with those of numerous baselines. Additionally, perform a deeper analysis to identify factors that could influence the outcomes of our proposed approach.
6.1. Preliminary
The proposed GA4QST algorithm was implemented using Python 3.8 on a computer with 5220R CPU, 128 GB memory, and Ubuntu 20.04. Due to the absence of standard platforms and widely used datasets, we performed the experiments with synthetic data. The process used to generation the synthetic data is detailed in Algorithm 11, while Table 2 presents the statistics of the data. The code for GA4QST will be thoroughly documented and subsequently released.
| Algorithm 11: Generate experimental data |
![]() |
Table 2.
System configurations.
6.2. Baselines
The target problem is framed as a constrained nonlinear integer optimization problem, making it challenging to find either an analytical solution or numerical optima. Consequently, researchers often resort to metaheuristic algorithms when solving such problems. The primary advantages of metaheuristic algorithms lie in their ability to handle complex nonlinear problems and their strong global optimization capabilities. In light of this, we selected several representative metaheuristic baseline algorithms for comparison with our proposed GA4QST algorithm:
- 1.
- Original Genetic Algorithm (GA). As described above, the original GA draws inspiration from the process of natural selection, simulating evolution to solve optimization problems. It assesses a population of solutions using a fitness function that describes how an individual within the population adapts to the environment. The GA iteratively selects and retains those components that currently perform better, thereby facilitating adaptation.
- 2.
- Artificial Fish Swarm Algorithm (AFSA). Swarm algorithms are a family of gradient-free population-based algorithms designed to solve complex nonlinear problems. The key concept of the AFSA is to comparison the aquatic environment of a fish to the solution space of the target problem and use the analogy of a fish finding food in water to the search for an optimum solution. Typically, a fish finds food by individually observing the environment or following others. The AFSA obtains optima in a similar way [].
- 3.
- Particle Swarm Optimization (PSO). The PSO algorithm is a population-based technique comprising numerous particles or agents. By shifting these particles or agents within the search space based on their current positions and velocities, they eventually reach the optimal position and identify the best solution [,].
- 4.
- Differential Evolution (DE). DE is a population-based metaheuristic iterative search algorithm used for non-convex optimization problems. Unlike traditional real-coded genetic algorithms and evolution strategies, DE employs a mandatory self-referential mutation for its population members. Each member is perturbed with the scaled difference of individuals from the current generation [].
These classical metaheuristic algorithms are generally capable of handling complex nonlinear problems to a large extent; however, they often face certain limitations when dealing with high-dimensional problems []. As the dimensionality of the problem increases, the characteristics of the objective function become more complex, making it difficult for the algorithms to efficiently explore the entire solution space. This paper aims to optimize service deployment and network traffic management while ensuring QoS. Due to the complexity and high-dimensional nature of the problem, classical metaheuristic algorithms may struggle to achieve satisfactory results.
6.3. Comparison with Baselines
The line chart in Figure 5a displays the performance of the objective across different algorithms. Based on the description of the system model in Section 4, it is clear that the optimization goal is to minimize the objective function . A smaller value of the objective function indicates a better tradeoff between system performance and cost. It is evident that GA4QST outperforms the baselines as the population evolves, particularly when the settings are held constant across all approaches. The primary reason behind this advantage lies in the superior exploration ability of GA4QST. Unlike the baselines, which quickly converge and cease to change after the 25th generation, GA4QST continues to update itself until the 79th generation. This continuous evolution facilitated by our carefully designed mutation and crossover operators ensures that GA4QST maintains the necessary constraints throughout the process. Consequently, GA4QST has a greater likelihood of discovering optimal solutions. Furthermore, it is worth noting that the differences among the baselines in the final results are relatively small, which confirms the general applicability of these metaheuristic methods in addressing such complex problems. The objective function encompasses multiple metrics, including budget surplus, balancing gain, and average request time cost. Hence, it is essential to evaluate these metrics individually. Figure 5b presents the corresponding results, with the y-axis on the right indicating the time cost measured in seconds. Upon analysis, it becomes evident that the budget surplus achieved by GA4QST surpasses that of the baselines by approximately 27.6%. Additionally, the trends for balancing gains and average time costs exhibit similar patterns across all approaches. In particular, GA4QST lags behind the best-performing baseline by only 9.5% in terms of balancing gain and 4.8% in terms of average time cost. To sum up, the proposed GA4QST algorithm demonstrates the ability to achieve a balanced running environment at lower cost. Furthermore, the average time cost of the system remains within acceptable limits.
Figure 5.
(a) Variation of the objective function value for different algorithms as the number of iterations increases; (b) changes in different metrics within the objective function for various algorithms, including the budget surplus , balanced revenue , and average request time cost ; (c) progress of execution time for different algorithms as they approach the optimal solution throughout the evolutionary process; (d) data distribution of the objective function for different algorithms after 1000 experimental runs.
However, achieving better optimization results comes at a cost. The incorporation of complex operators in GA4QST for solution validation introduces additional computational burden, resulting in increased running time compared to the original GA. Figure 5c illustrates the progression of execution times for GA4QST and the comparative baseline algorithms as they collectively approach the optimal solution throughout the evolutionary process. The measure of the difference between the current solution and the optimal solution is denoted by
where represents the objective function value of . The quantity is utilized to measure the closeness of the obtained result to the optimal solution in Figure 5c. Comparing GA4QST with the original GA, it is evident that the runtime curve of GA4QST is positioned above that of GA, indicating that GA4QST requires more time to generate a solution for a given objective value. However, this tradeoff is deemed acceptable, as the two curves almost intersect when they both achieve 60% of the optimal solution. This implies that in a case where a 60% near-optimal solution is sufficient, GA4QST can achieve a similar time cost. Additionally, GA4QST stands out as the only algorithm capable of surpassing the 60% optimality “barrier” that represents the best achievable result among the baseline algorithms.
To assess the resilience of the proposed algorithm, 1000 independent runs were conducted for each algorithm. The results are presented as a violin graph in Figure 5d. The violin plot is a method for visualizing continuous data, showcasing the distribution of the objective function values across different algorithms after 1000 independent runs. A smaller value of the objective function indicates a better tradeoff between system performance and cost. In the violin plot, the white dot represents the median, reflecting the central tendency of the data. The width of the violin plot corresponds to the density of the data distribution for each algorithm; wider regions indicate higher frequencies of results within that range, suggesting greater fluctuations in outcomes across multiple experiments. Notably, GA4QST exhibits remarkable ability to reach the optimum solution. Compared to the baselines, the violin graph for GA4QST is narrower and more concentrated in the lower-value region, indicating that the algorithm consistently achieves near-optimal solutions across most runs. The medians of the baseline algorithms are significantly higher than the median of GA4QST; even the SA algorithm, which exhibits the best robustness among the baselines, has a median value higher than GA4QST. These results further confirm the effectiveness and potential applicability of GA4QST in real-world scenarios.
6.4. Impact of System Properties
The comparisons mentioned above highlight the effectiveness of our proposed GA4QST algorithm in optimizing budget surplus while balancing the gains and average time costs of requests. In addition to comparing GA4QST with the baseline algorithms, we explored the impact of various factors associated with GA4QST from the service, server, and network perspectives.
6.5. Impacts of Service
- (1)
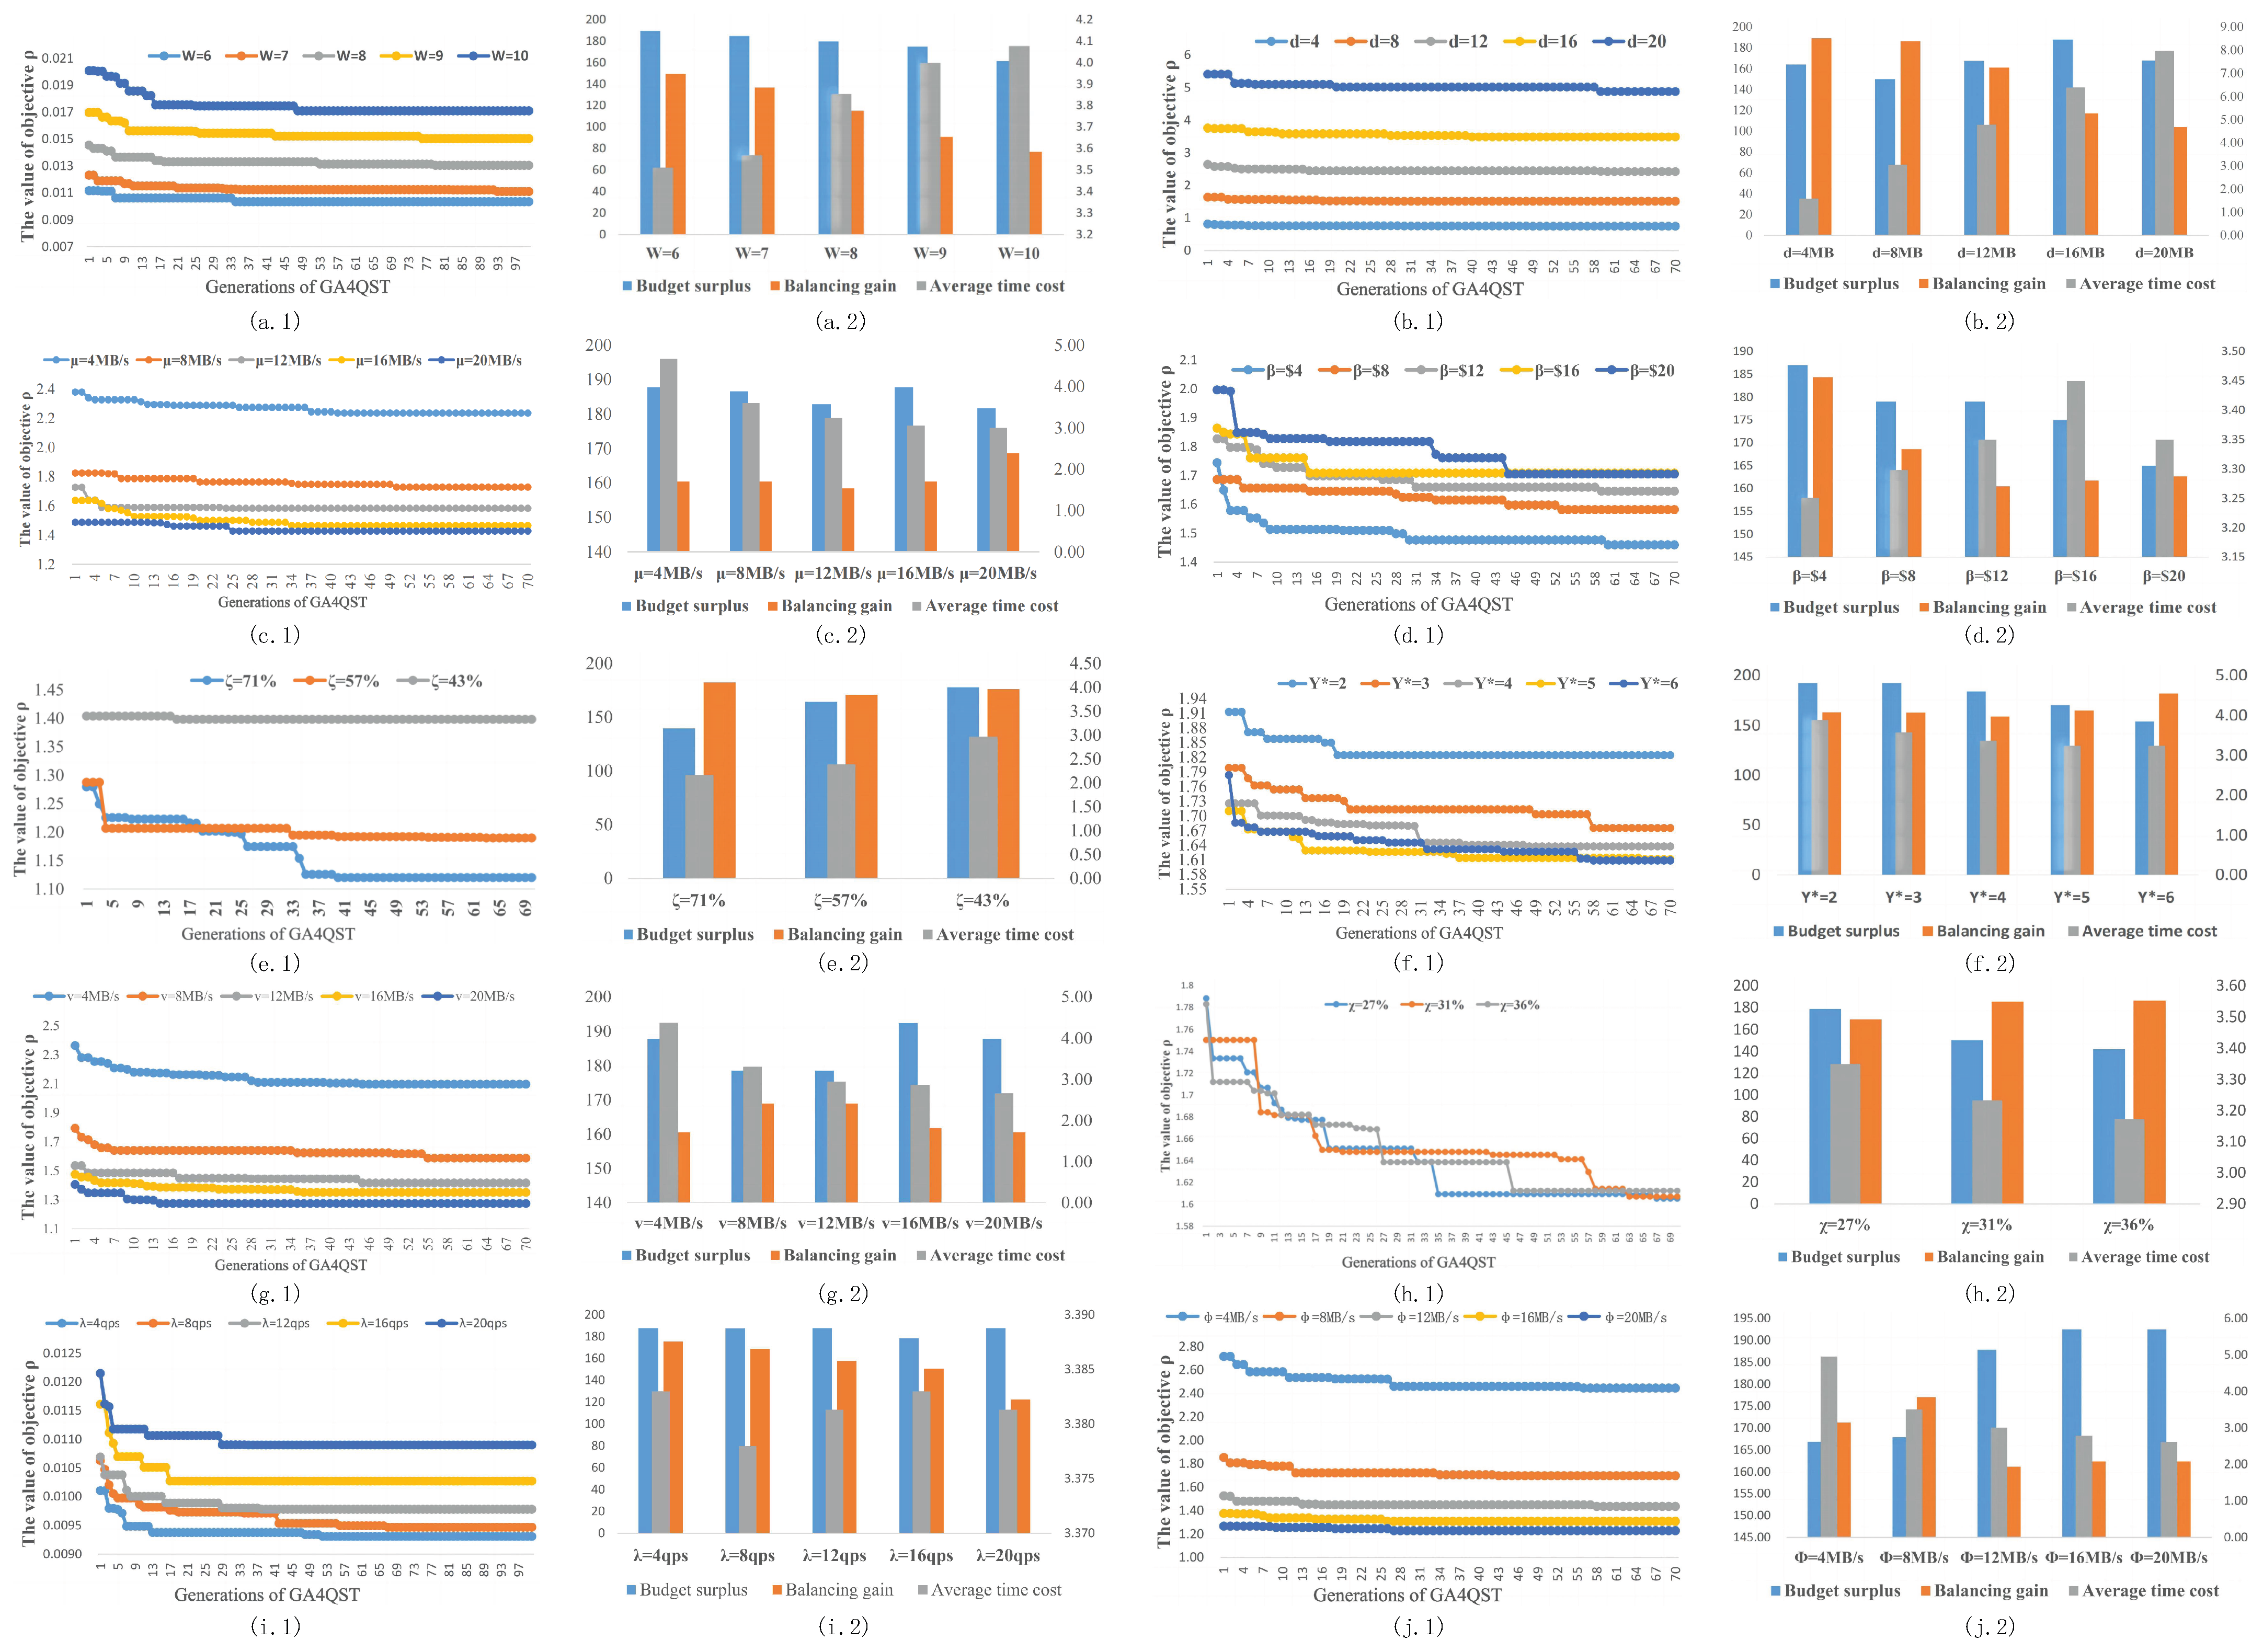
- Service Diversity. The service diversity (W) quantifies the complexity of the tasks handled by the system. To explore the impact of W on the results of GA4QST, we kept the same system settings as in Table 2 and varied the value of W. Figure 6(a.1) shows that the objective function value increases as W grows. Conversely, in Figure 6(a.2) we can observe a close relationship between the budget surplus, balancing gain, and average time cost regardless of the value of W. This can be attributed to the limited availability of resources. When the system must handle a larger number of services, it becomes more challenging to achieve a good balance of performance and cost.
Figure 6. Under different system parameters, the impact on the proposed GA4QST algorithm is as follows: (a) Under different numbers of services W: 1. Changes in the objective function value of the GA4QST; 2. Changes in different indicators within the objective function of the GA4QST; (b) Under different service request data volumes d: 1. Changes in the objective function value of the GA4QST; 2. Changes in different indicators within the objective function of the GA4QST; (c) Under different edge server processing capabilities : 1. Changes in the objective function value of the GA4QST; 2. Changes in different indicators within the objective function of the GA4QST; (d) Under different edge server deployment costs : 1. Changes in the objective function value of the GA4QST; 2. Changes in different indicators within the objective function of the GA4QST; (e) Under different edge server densities : 1. Changes in the objective function value of the GA4QST; 2. Changes in different indicators within the objective function of the GA4QST; (f) Under restrictions on the maximum number of service instances per server : 1. Changes in the objective function value of the GA4QST; 2. Changes in different indicators within the objective function of the GA4QST; (g) Under different wireless transmission rates v: 1. Changes in the objective function value of the GA4QST; 2. Changes in different indicators within the objective function of the GA4QST; (h) Under different edge server connection densities : 1. Changes in the objective function value of the GA4QST; 2. Changes in different indicators within the objective function of the GA4QST; (i) Under different service request arrival rates : 1. Changes in the objective function value of the GA4QST; 2. Changes in different indicators within the objective function of the GA4QST; (j) Under different communication qualities of edge devices : 1. Changes in the objective function value of the GA4QST; 2. Changes in different indicators within the objective function of the GA4QST. - (2)
- Data Size. The data size, denoted as d in this paper, represents the throughput of the system. To investigate the impact of d, the system settings were kept the same as in Table 2 during the experiment while varying the value of d. As shown in Figure 6(b.1), the objective function value increases as d increases. This indicates that the optimization target deteriorates as the system becomes progressively overloaded. The details are illustrated in Figure 6(b.2). Specifically, it can be observed that the average time cost exhibits a nearly linear increase due to the proportional relationship between and . Moreover, the balancing gain decreases as the system faces additional challenges in efficiently processing heavy traffic. It is worth noting that the budget surplus exhibits fluctuations in this figure, indicating that cost is no longer the primary factor contributing to the final objective when the traffic becomes heavier.
- (3)
- Processing Capacity. The processing capacity is indicative of the construction cost of the underlying infrastructure, as higher processing capacity often requires higher-quality hardware. To examine the impact of on the results, we maintained the system settings specified in Table 2 while varying the value of . In Figure 6(c.1), it is evident that the objective function value decreases as increases. However, a diminishing marginal effect becomes apparent when reaches a certain threshold. Because improving processing capacity entails significant expenses, it is not advisable to overspend on this aspect. Figure 6(c.2) reveals that the optimization of is primarily driven by the improvement in average time cost when 16 MB/s. Conversely, when 20 MB/s, the balancing gain assumes a more prominent role. This is because increasing beyond a certain level does not substantially reduce the average time cost, instead enabling the system to manage traffic scheduling more flexibly.
- (4)
- Deployment Cost. The deployment cost represents the rental cost for developers, and is sometimes related to the value of in the same system. In Figure 6(d.1), it can be observed that the increase in deployment cost leads to a larger value of , indicating a worse optimization outcome. The changes in , , and depicted in Figure 6(d.2) shed light on the relationship between the decrease in and the tradeoff between average time cost and balancing gain. Both factors vie for the available resources, with the average time cost typically exerting a greater influence due to its higher weight in the calculation of .
6.6. Impacts of Server
- (1)
- Server Density. The server density, denoted as , represents the percentage of edge servers in the device pool, and primarily reflects the parallelism of the system. In Figure 6(e.1), we can observe that an increase in server density leads to a better value of , indicating an improved optimization outcome. However, the main contribution to this improvement can be attributed to the average time cost, as demonstrated in Figure 6(e.2). A higher server density facilitates better optimization results when the balancing gains are similar, such as at = 71%, 57%, and 43%. Additionally, the budget surpluses show an upward trend in these cases.
- (2)
- Available Resources. The available resource metric represents the storage capacity of an edge server, which may have a partial effect on the value of . In Figure 6(f.1), it can be observed that an increase in available resources leads to a decrease in the value of , indicating an improvement in the optimization outcome. Similarly, in Figure 6(f.2) we can see that the contribution to this improvement primarily stems from the average time cost. This can be attributed to the fact that the edge servers can accommodate a greater number of service instances when there are more available resources, leading to better optimization results.
6.7. Impacts of Network
- (1)
- Wireless Transmission Rate. The wireless transmission rate v reflects the quality of communication between mobile IoT devices and the system. Figure 6(g.1) illustrates that an increase in the wireless transmission rate leads to a better value of . This improvement can be attributed to the fact that a higher wireless transmission rate reduces the value of . However, it is interesting to see that is not linear with v, resulting in a nonlinear improvement in the optimization outcome. Similarly, in Figure 6(g.2) it can be observed that an increase in v also leads to a reduction in budget cost. This is because in most cases the time cost of a request is dominated by the transmission time. Therefore, improving the wireless transmission rate reduces the overall cost associated with the transmission process.
- (2)
- Connection Density. The connection density, denoted as , reflects the level of connectivity, and describes the system’s ability to efficiently handle traffic. In Figure 6(h.1), we can observe that an increase in the connection density does not necessarily lead to a better value of . The relationship between the two is not straightforward. We can further examine the reasons behind this observation in Figure 6(h.2). Here, both the average time cost and balancing gain show improvements, suggesting that an increase in connections provides more opportunities for the system to optimize communication and accelerate response times. However, it is important to note that these improvements come at a cost. The decrease in the budget surplus is almost linear with the increase in due to the deployment of more service instances.
- (3)
- Request Rate. The request rate reflects the popularity or total load of the services. Figure 6(i.1) reveals that a heightened rate of requests results in an elevation of the optimization goal’s value. This is reasonable, as an increase in external requirements can strain the system’s capabilities. In Figure 6(i.2), it can be seen that the GA4QST algorithm maintains similar budget usage while adjusting the average time cost and balancing gain as the request rate changes. Furthermore, by observing the trends of the balancing gains in Figure 6(i.2), we can deduce that the GA4QST algorithm prioritizes the balancing gain as a lower optimization target when dealing with increasing values of . Therefore, if we want emphasize the importance of the balancing gain, this would require assigning it a higher weight during the optimization process.
- (4)
- Wired Transmission Rate. The wired transmission rate, denoted as in this paper, reflects the quality of communication between edge devices. In Figure 6(j.1), we can observe that the value of decreases as the wired transmission rate increases. This is because a higher wired transmission rate reduces the value of , resulting in improved optimization outcomes. However, it is important to note that the relationship between and is inversely proportional, leading to a nonlinear improvement in the optimization outcome. Similarly, in Figure 6(j.2) we can observe that increasing can potentially reduce the budget cost. This is because in most cases the time cost of a service request is dominated by the transmission time. Therefore, improving the wired transmission rate can lead to a reduction in the overall cost associated with the transmission process.
7. Conclusions and Future Work
In summary, this study has investigated the impact of service deployment and traffic management strategies on average response times of service requests, financial expenditure, and system resource balancing. To achieve optimal performance at minimal cost, we have introduced a specialized evolutionary algorithm called GA4QST. This algorithm incorporates unique operators to generate appropriate service deployment and traffic management strategies. Experimental results using synthetic data demonstrate that GA4QST outperforms other baseline approaches in terms of performance.
In large-scale edge server scenarios, the use of appropriate strategies for service deployment and traffic management can enhance system performance and resource utilization. In smart city scenarios, for example, many smart home devices can act as edge servers to handle smaller tasks. This approach can improve overall service quality and reduce latency.
While the proposed approach in this study exhibits strong performance, it is important to acknowledge that real-world scenarios become more intricate when considering service redundancy. With the increasing adoption of Software as a Service (SaaS) techniques, there may be multiple available services that offer the same functionality, which necessitates careful selection among these services. The current research primarily focuses on establishing a model for deploying services on the optimal edge server within a steady time slot. However, many additional factors affect this problem in real-world scenarios, such as service priority and the speed of data transmission between edge servers across different time slots. In future research, we plan to analyze how these factors influence service provisioning in MEC environments.
Author Contributions
Problem analysis: Z.X.; GA4QST algorithm design: Z.X. and F.Y.; conducting the experiments in Section 6: H.Y.; feasibility analysis, modeling discussion, and problem formulation: Y.X., Z.Z. and Y.Z.; writing—original draft preparation: Z.X. and F.Y.; writing—review and editing: Z.X. and Y.Z.; proofreading the manuscript: Y.Z. All authors have read and agreed to the published version of the manuscript.
Funding
This research was supported by the National Science and Technology Major Project (2022ZD0119103) and the National Natural Science Foundation of China (No. 62102350, 62072402).
Data Availability Statement
The experimental data and simulation results that support the findings of this study are available in https://github.com/xiangzz/GA4QST (accessed on 31 May 2024).
Conflicts of Interest
The authors declare no conflicts of interest.
Abbreviations
The following abbreviations are used in this manuscript:
| MEC | Multi-access Edge Computing |
| mMTC | Massive Machine-Type Communication |
| PaaS | Platform as a Service |
| QoS | Quality of Service |
| QST | QoS-effective Joint Service Deployment and Traffic Management Problem |
| ESTI | European Telecommunications Standards Institute |
| SDN | Software-Defined Network |
| IoT | Internet of Things |
| IoV | Internet of Vehicles |
| BPSO | Binary Particle Swarm Optimization |
| GA | Genetic Algorithm |
| GA4QST | Genetic Algorithm for QoS-effective Service Deployment and Traffic Management |
| PI | Population Initialization |
| CI | Chromosome Initialization |
| RPG | Routing Path Generation |
| SH | Solution Healing |
| PVH | Placement Violation Healing |
| SPR | Service Deployment Rearranging |
| NetR | Network Rearranging |
| AFSA | Artificial Fish Swarm Algorithm |
| PSO | Particle Swarm Optimization |
| DE | Differential Evolution |
| SaaS | Software as a Service |
References
- Badidi, E.; Moumane, K.; El Ghazi, F. Opportunities, applications, and challenges of edge-AI enabled video analytics in smart cities: A systematic review. IEEE Access 2023, 11, 80543–80572. [Google Scholar] [CrossRef]
- Lu, S.; Lu, J.; An, K.; Wang, X.; He, Q. Edge computing on IoT for machine signal processing and fault diagnosis: A review. IEEE Internet Things J. 2023, 10, 11093–11116. [Google Scholar] [CrossRef]
- Walia, G.K.; Kumar, M.; Gill, S.S. AI-empowered fog/edge resource management for IoT applications: A comprehensive review, research challenges, and future perspectives. IEEE Commun. Surv. Tutor. 2023, 26, 619–669. [Google Scholar] [CrossRef]
- Hua, H.; Li, Y.; Wang, T.; Dong, N.; Li, W.; Cao, J. Edge computing with artificial intelligence: A machine learning perspective. ACM Comput. Surv. 2023, 55, 1–35. [Google Scholar] [CrossRef]
- Duan, K.; Fong, S.; Siu, S.W.; Song, W.; Guan, S.S.U. Adaptive incremental genetic algorithm for task scheduling in cloud environments. Symmetry 2018, 10, 168. [Google Scholar] [CrossRef]
- Cheng, X.; Lu, X.; Deng, Y.; Lu, Q.; Kang, Y.; Tang, J.; Shi, Y.; Zhao, J. Offloading Strategy for Forest Monitoring Network Based on Improved Beetle Optimization Algorithm. Symmetry 2024, 16, 1569. [Google Scholar] [CrossRef]
- Ye, J.; Jiang, Y. Data Integrity Verification for Edge Computing Environments. Symmetry 2024, 16, 1648. [Google Scholar] [CrossRef]
- Xiang, Z.; Deng, S.; Zheng, Y.; Wang, D.; Zhang, C.; Chen, Y.; Zheng, Z. Activate Cost-Effective Mobile Crowd Sensing with Multi-access Edge Computing. In Proceedings of the Communications and Networking: 15th EAI International Conference, ChinaCom 2020, Shanghai, China, 20–21 November 2020; Springer: Berlin/Heidelberg, Germany, 2021; pp. 78–97. [Google Scholar]
- Xiang, Z.; Deng, S.; Jiang, F.; Gao, H.; Tehari, J.; Yin, J. Computing power allocation and traffic scheduling for edge service provisioning. In Proceedings of the 2020 IEEE International Conference on Web Services (ICWS), Beijing, China, 19–23 October 2020; pp. 394–403. [Google Scholar]
- Siriwardhana, Y.; Porambage, P.; Liyanage, M.; Ylianttila, M. A survey on mobile augmented reality with 5G mobile edge computing: Architectures, applications, and technical aspects. IEEE Commun. Surv. Tutor. 2021, 23, 1160–1192. [Google Scholar] [CrossRef]
- Van Anh, D.; Chehri, A.; Quy, N.M.; Hue, C.T.M.; Nguyen, D.C.; Quy, V.K. An Software Defined Networking (SDN) Enhanced Edge Computing Framework for Internet of Healthcare Things (IoHT). In Proceedings of the GLOBECOM 2024—2024 IEEE Global Communications Conference, Cape Town, South Africa, 8–12 December 2024; pp. 415–419. [Google Scholar]
- Al-Hammadi, I.; Li, M.; Islam, S.M.; Al-Mosharea, E. Collaborative computation offloading for scheduling emergency tasks in SDN-based mobile edge computing networks. Comput. Netw. 2024, 238, 110101. [Google Scholar] [CrossRef]
- Al-Shareeda, M.A.; Alsadhan, A.A.; Qasim, H.H.; Manickam, S. Software defined networking for internet of things: Review, techniques, challenges, and future directions. Bull. Electr. Eng. Inform. 2024, 13, 638–647. [Google Scholar] [CrossRef]
- Yu, J.; Alhilal, A.; Zhou, T.; Hui, P.; Tsang, D.H. Attention-based QoE-aware digital twin empowered edge computing for immersive virtual reality. IEEE Trans. Wirel. Commun. 2024, 23, 11276–11290. [Google Scholar] [CrossRef]
- Elgarhy, O.; Reggiani, L.; Alam, M.M.; Zoha, A.; Ahmad, R.; Kuusik, A. Energy efficiency and latency optimization for IoT URLLC and mMTC use cases. IEEE Access 2024, 12, 23132–23148. [Google Scholar] [CrossRef]
- Zaman, M.; Puryear, N.; Abdelwahed, S.; Zohrabi, N. A review of IoT-based smart city development and management. Smart Cities 2024, 7, 1462–1501. [Google Scholar] [CrossRef]
- Xiang, Z.; Wang, D.; He, M.; Chen, Y. Dynamic System Reconfiguration in Stable and Green Edge Service Provisioning. Mob. Netw. Appl. 2023, 29, 1663–1679. [Google Scholar] [CrossRef]
- Mehta, A.; Verma, R.K. QoS-aware edge server placement for collaborative predictive maintenance in industrial internet of things. J. Supercomput. 2024, 80, 19324–19350. [Google Scholar] [CrossRef]
- Li, X.; Teng, M.; Bu, Y.; Qiu, J.; Qin, X.; Wu, J. Cooperation-based server deployment strategy in mobile edge computing system. Comput. Netw. 2025, 257, 110932. [Google Scholar] [CrossRef]
- Xue, H.; Xia, Y. Profit-aware Edge Server Placement based on All-pay Auction for Edge Offloading. In Proceedings of the 2024 IEEE/ACM 32nd International Symposium on Quality of Service (IWQoS), Guangzhou, China, 19–21 June 2024; pp. 1–2. [Google Scholar]
- Kuźniar, M.; Perešíni, P.; Kostić, D. What you need to know about SDN flow tables. In Proceedings of the International Conference on Passive and Active Network Measurement. PAM 2015; Lecture Notes in Computer Science. Springer: Berlin/Heidelberg, Germany, 2015; Volume 8995, pp. 347–359. [Google Scholar]
- Borsatti, D.; Davoli, G.; Cerroni, W.; Raffaelli, C. Enabling industrial IoT as a service with multi-access edge computing. IEEE Commun. Mag. 2021, 59, 21–27. [Google Scholar] [CrossRef]
- Lv, W.; Wang, Q.; Yang, P.; Ding, Y.; Yi, B.; Wang, Z.; Lin, C. Microservice Deployment in Edge Computing Based on Deep Q Learning. IEEE Trans. Parallel Distrib. Syst. 2022, 33, 2968–2978. [Google Scholar] [CrossRef]
- Sriraghavendra, M.; Chawla, P.; Wu, H.; Gill, S.S.; Buyya, R. DoSP: A deadline-aware dynamic service placement algorithm for workflow-oriented IoT applications in fog-cloud computing environments. In Energy Conservation Solutions for Fog-Edge Computing Paradigms; Lecture Notes on Data Engineering and Communications Technologies; Springer: Singapore, 2022; Volume 74, pp. 21–47. [Google Scholar]
- Wang, L.; Deng, X.; Gui, J.; Chen, X.; Wan, S. Microservice-oriented service placement for mobile edge computing in sustainable internet of vehicles. IEEE Trans. Intell. Transp. Syst. 2023, 24, 10012–10026. [Google Scholar] [CrossRef]
- Tang, Q.; Xie, R.; Fang, Z.; Huang, T.; Chen, T.; Zhang, R.; Yu, F.R. Joint Service Deployment and Task Scheduling for Satellite Edge Computing: A Two-Timescale Hierarchical Approach. IEEE J. Sel. Areas Commun. 2024, 42, 1063–1079. [Google Scholar] [CrossRef]
- Zhang, X.; Cui, L.; Tso, F.P.; Li, Z.; Jia, W. Dapper: Deploying Service Function Chains in the Programmable Data Plane Via Deep Reinforcement Learning. IEEE Trans. Serv. Comput. 2023, 16, 2532–2544. [Google Scholar] [CrossRef]
- Huang, Y.; Yao, T.; Lin, Z.; Shang, X.; Yuan, Y.; Cui, L.; Yang, Y. Efficient Service Function Chain Placement Over Heterogeneous Devices in Deviceless Edge Computing Environments. IEEE Trans. Comput. 2024, 74, 222–236. [Google Scholar] [CrossRef]
- Mavromatis, A.; Colman-Meixner, C.; Silva, A.P.; Vasilakos, X.; Nejabati, R.; Simeonidou, D. A software-defined IoT device management framework for edge and cloud computing. IEEE Internet Things J. 2019, 7, 1718–1735. [Google Scholar] [CrossRef]
- Bellavista, P.; Fogli, M.; Giannelli, C.; Stefanelli, C. Application-aware network traffic management in mec-integrated industrial environments. Future Internet 2023, 15, 42. [Google Scholar] [CrossRef]
- Jaber, M.M.; Ali, M.H.; Abd, S.K.; Alkhayyat, A.; Malik, R. Application of edge computing-based information-centric networking in smart cities. Comput. Commun. 2023, 211, 46–58. [Google Scholar]
- Kim, M.; Jaseemuddin, M.; Anpalagan, A. Deep reinforcement learning based active queue management for iot networks. J. Netw. Syst. Manag. 2021, 29, 1–28. [Google Scholar] [CrossRef]
- Song, T.; Kyung, Y. Deep-Reinforcement-Learning-Based Age-of-Information-Aware Low-Power Active Queue Management for IoT Sensor Networks. IEEE Internet Things J. 2024, 11, 16700–16709. [Google Scholar] [CrossRef]
- Absardi, Z.N.; Javidan, R. IoT traffic management using deep learning based on osmotic cloud to edge computing. Telecommun. Syst. 2024, 87, 419–435. [Google Scholar] [CrossRef]
- Lai, P.; He, Q.; Cui, G.; Chen, F.; Grundy, J.; Abdelrazek, M.; Hosking, J.G.; Yang, Y. Cost-effective user allocation in 5g noma-based mobile edge computing systems. IEEE Trans. Mob. Comput. 2021, 21, 4263–4278. [Google Scholar] [CrossRef]
- Stavrinides, G.L.; Karatza, H.D. An energy-efficient, QoS-aware and cost-effective scheduling approach for real-time workflow applications in cloud computing systems utilizing DVFS and approximate computations. Future Gener. Comput. Syst. 2019, 96, 216–226. [Google Scholar] [CrossRef]
- Xiang, Z.; Zheng, Y.; He, M.; Shi, L.; Wang, D.; Deng, S.; Zheng, Z. Energy-effective artificial internet-of-things application deployment in edge-cloud systems. Peer-to-Peer Netw. Appl. 2022, 15, 1029–1044. [Google Scholar] [CrossRef]
- Bhandari, D.; Murthy, C.; Pal, S.K. Genetic algorithm with elitist model and its convergence. Int. J. Pattern Recognit. Artif. Intell. 1996, 10, 731–747. [Google Scholar] [CrossRef]
- Tirkolaee, E.B.; Goli, A.; Weber, G.W. Fuzzy mathematical programming and self-adaptive artificial fish swarm algorithm for just-in-time energy-aware flow shop scheduling problem with outsourcing option. IEEE Trans. Fuzzy Syst. 2020, 28, 2772–2783. [Google Scholar] [CrossRef]
- Al Hilli, A.; Al-Ibadi, M.; Alfadhel, A.M.; Abdulshaheed, S.H.; Hadi, A.H. Optimal path finding in stochastic quasi-dynamic environments using particle swarm optimization. Expert Syst. Appl. 2021, 186, 115706. [Google Scholar] [CrossRef]
- Han, H.; Bai, X.; Han, H.; Hou, Y.; Qiao, J. Self-Adjusting Multi-Task Particle Swarm Optimization. IEEE Trans. Evol. Comput. 2021, 26, 145–158. [Google Scholar] [CrossRef]
- Ghosh, A.; Das, S.; Das, A.K.; Gao, L. Reusing the past difference vectors in differential evolution—A simple but significant improvement. IEEE Trans. Cybern. 2019, 50, 4821–4834. [Google Scholar] [CrossRef]
- Kamal, R.; Amin, E.; AbdElminaam, D.S.; Ismail, R. A Comprehensive Survey on Meta-Heuristic Algorithms for Feature Selection in High-Dimensional Data: Challenges, Applications, and Future Directions. In Proceedings of the 2024 International Mobile, Intelligent, and Ubiquitous Computing Conference (MIUCC), Cairo, Egypt, 13–14 November 2024; pp. 84–90. [Google Scholar] [CrossRef]
Disclaimer/Publisher’s Note: The statements, opinions and data contained in all publications are solely those of the individual author(s) and contributor(s) and not of MDPI and/or the editor(s). MDPI and/or the editor(s) disclaim responsibility for any injury to people or property resulting from any ideas, methods, instructions or products referred to in the content. |
© 2025 by the authors. Licensee MDPI, Basel, Switzerland. This article is an open access article distributed under the terms and conditions of the Creative Commons Attribution (CC BY) license (https://creativecommons.org/licenses/by/4.0/).


