Article

Measuring Device for More Precise Mistuning Identification of Integrated Bladed Discs

1
Institute of Automotive Engineering, Brno University of Technology, Technická 2896/2, 616-69 Brno, Czech Republic
2
Department of Cars and Carriage Facilities, State University of Infrastructure and Technologies, Kyrylivska Street, 9, 04071 Kyiv, Ukraine
3
Department of Ship’s Power Plant, National University “Odessa Maritime Academy”, 8, Didrikhson Street, 65052 Odessa, Ukraine
*
Author to whom correspondence should be addressed.
Symmetry 2025, 17(5), 717; https://doi.org/10.3390/sym17050717
Submission received: 8 April 2025 / Revised: 24 April 2025 / Accepted: 6 May 2025 / Published: 7 May 2025
(This article belongs to the Special Issue Symmetry in Process Optimization)

Abstract

:
In integrated turbine wheel designs, small deviations, known as mistuning, often occur in the modal properties of individual blades due to manufacturing tolerances and material inhomogeneity. During operation, this mistuning can cause some rotor blades to be subjected to significantly higher loads than predicted for an ideal rotor. The degree of rotor mistuning can only be determined using methods of experimental modal analysis. However, the manual use of the modal hammer cannot ensure precise repeatability of the force impulse’s location and timing, leading to inaccuracies. This article introduces a mechanism that replaces manual modal hammer operations, guaranteeing consistent impact location and timing while eliminating double strikes. The device was verified on bladed discs of various sizes, and its usability is demonstrated in this article on a turbine wheel of a marine engine turbocharger. The developed mechanism automates modal hammer strikes, ensuring precisely repeatable force courses and positioning for each impact. This automation reduces the measurement time and significantly improves the accuracy. The results of this research showed that even with careful manual operation of the modal hammer by an experienced operator, statistically significant differences arise in the repeated measurements of a bladed disc mistuning, whereas with the use of the presented measuring device, the results of the repeated measurements are practically identical.

1. Introduction

The issue of structural vibrations poses a significant challenge in the design of new devices across a wide range of engineering products. This challenge spans various applications, including combustion engine components, turbines, vehicle parts, and even large-scale structures, such as buildings and bridges, where structural integrity is paramount and precise knowledge of dynamic characteristics is essential. Addressing dynamic stress in these applications is, therefore, crucial [1]. This article primarily focuses on machines and their components, where understanding dynamic behaviour is vital to prevent failure or damage during operation. Excessive machine vibrations are closely linked to performance and may cause malfunctions due to the risk of increased mechanical stress. For instance, in the case of a turbine wheel from a marine engine turbocharger, higher mechanical stress can accelerate wear or lead to cracks, culminating in the breakage of blade tips or entire blades. Another notable effect of machine vibrations is increased noise during operation [2], which creates an uncomfortable working environment and reduces operator satisfaction. Reducing machine vibrations remains a pressing issue in the field, drawing the attention of numerous researchers and experts [3,4,5,6,7,8,9,10,11,12].
Vibration measurements can be categorised into two approaches based on their objectives. The first approach involves measuring vibration responses during the operation of a machine in its natural working environment and is referred to as the field of vibro-diagnostics [13]. The second approach, which holds greater relevance to the topic discussed here [14], involves inducing oscillations in the component or machine through known excitation and measuring the response, as illustrated in Figure 1. This method is often carried out in more controlled laboratory conditions outside of the machine’s working environment, enabling more precise response measurements. Structural excitation can be implemented in various ways, with the simplest being impact excitation using a modal impact hammer. Alternatively, shakers—connecting devices designed for this purpose—can be employed. For modal testing of small- to medium-sized structures, excitation with a modal impact hammer is typically sufficient. The procedure involves identifying specific points or a network of points on the structure, depending on the component’s scope, where hammer strikes are executed. The response at these points is recorded by a sensor fixed at a designated reference point, which remains stationary during excitation. Dynamic responses can be detected using accelerometers or optical instruments, such as laser vibrometers. The measured values at individual points form the matrix elements of the frequency response function H() [1], as defined in Equation (1) below.
H Ω = o u t p u t i n p u t = m o t i o n f o r c e = r e s p o n s e e x c i t a t i o n
The measured data are processed using the fast Fourier transformation (FFT), which converts it from the time domain to the frequency domain. Before this conversion, a weighting function is often applied to minimise the impact of slightly attenuated signals in the measured data. Following this, the converted data are interpolated with a curve, enabling the determination of the frequency response function and the extraction of desired modal parameters.
This method is referred to as modal testing [15]. An example of its application under real-world conditions is demonstrated in Figure 2, featuring a turbine wheel from a marine engine turbocharger.
Modal testing, also known as modal analysis, is a critical and robust tool in machinery design, providing insights into how a structure’s design responds to various dynamic loads. It involves studying the dynamic properties of structures through structural testing or simulations based on a finite element analysis. These properties include resonance frequencies, also referred to as natural frequencies, and structural modes. The dynamic behaviour of a structure under operational loads is determined by its mass M, stiffness K, and damping distribution B. Understanding these properties enables designers to modify or optimise the structural designs to enhance their dynamic performance [16].
The vibration behaviour of any component, such as a turbocharger turbine wheel, is governed by the differential equation of motion.
M q ¨ + B q ˙ + K q = F t .
Here, q represents the vector of generalised coordinates, F denotes the vector of forces, and t stands for time, with the continuous structure being discretised into a finite number of degrees of freedom [17].
Experimental modal tests on turbine wheels with integrated blades have been performed in the past using a manually controlled excitation of a modal hammer, as described in [17] and shown in Figure 2. During testing, the turbine wheel is positioned on a highly flexible pad to minimise the influence of boundary conditions.
The modal hammer is used to excite individual rotor blades at an appropriate location, typically near the blade tip. The resulting blade vibrations are measured contactless using a laser Doppler vibrometer. However, in experiments involving manual guidance of the modal hammer, certain inaccuracies can occur due to the inherent variability of manual operations [18,19,20,21,22].
Some of these inaccuracies include the following:
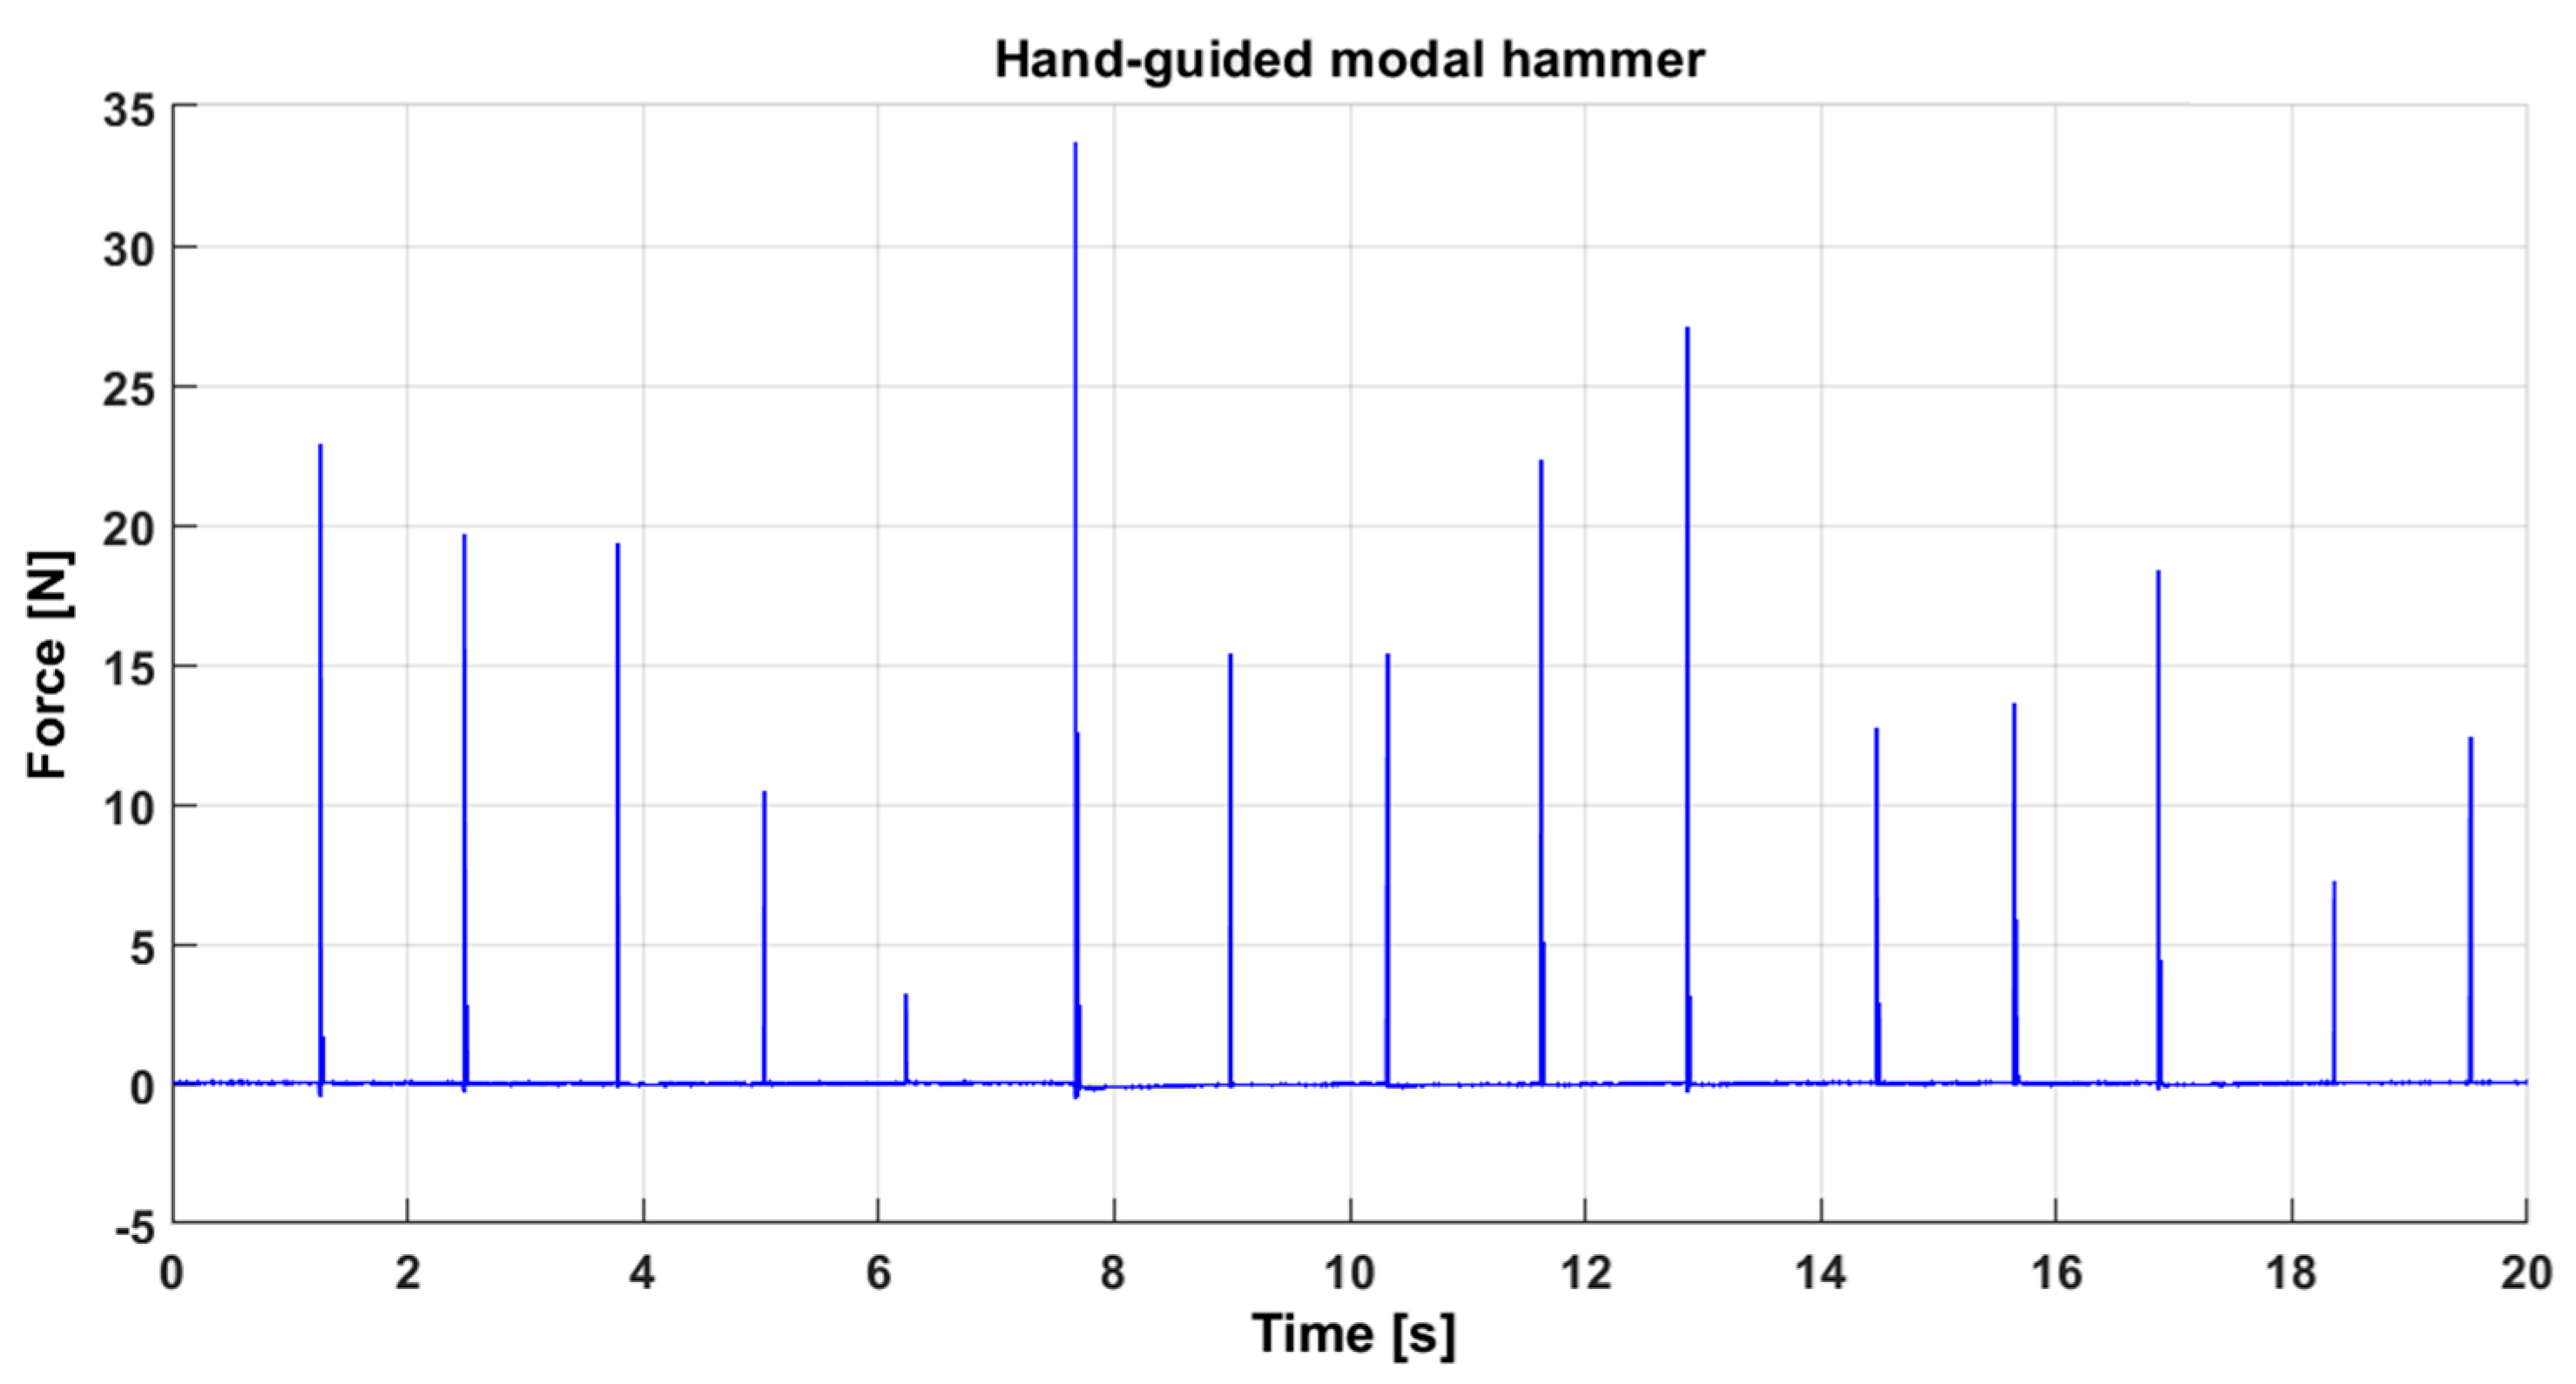
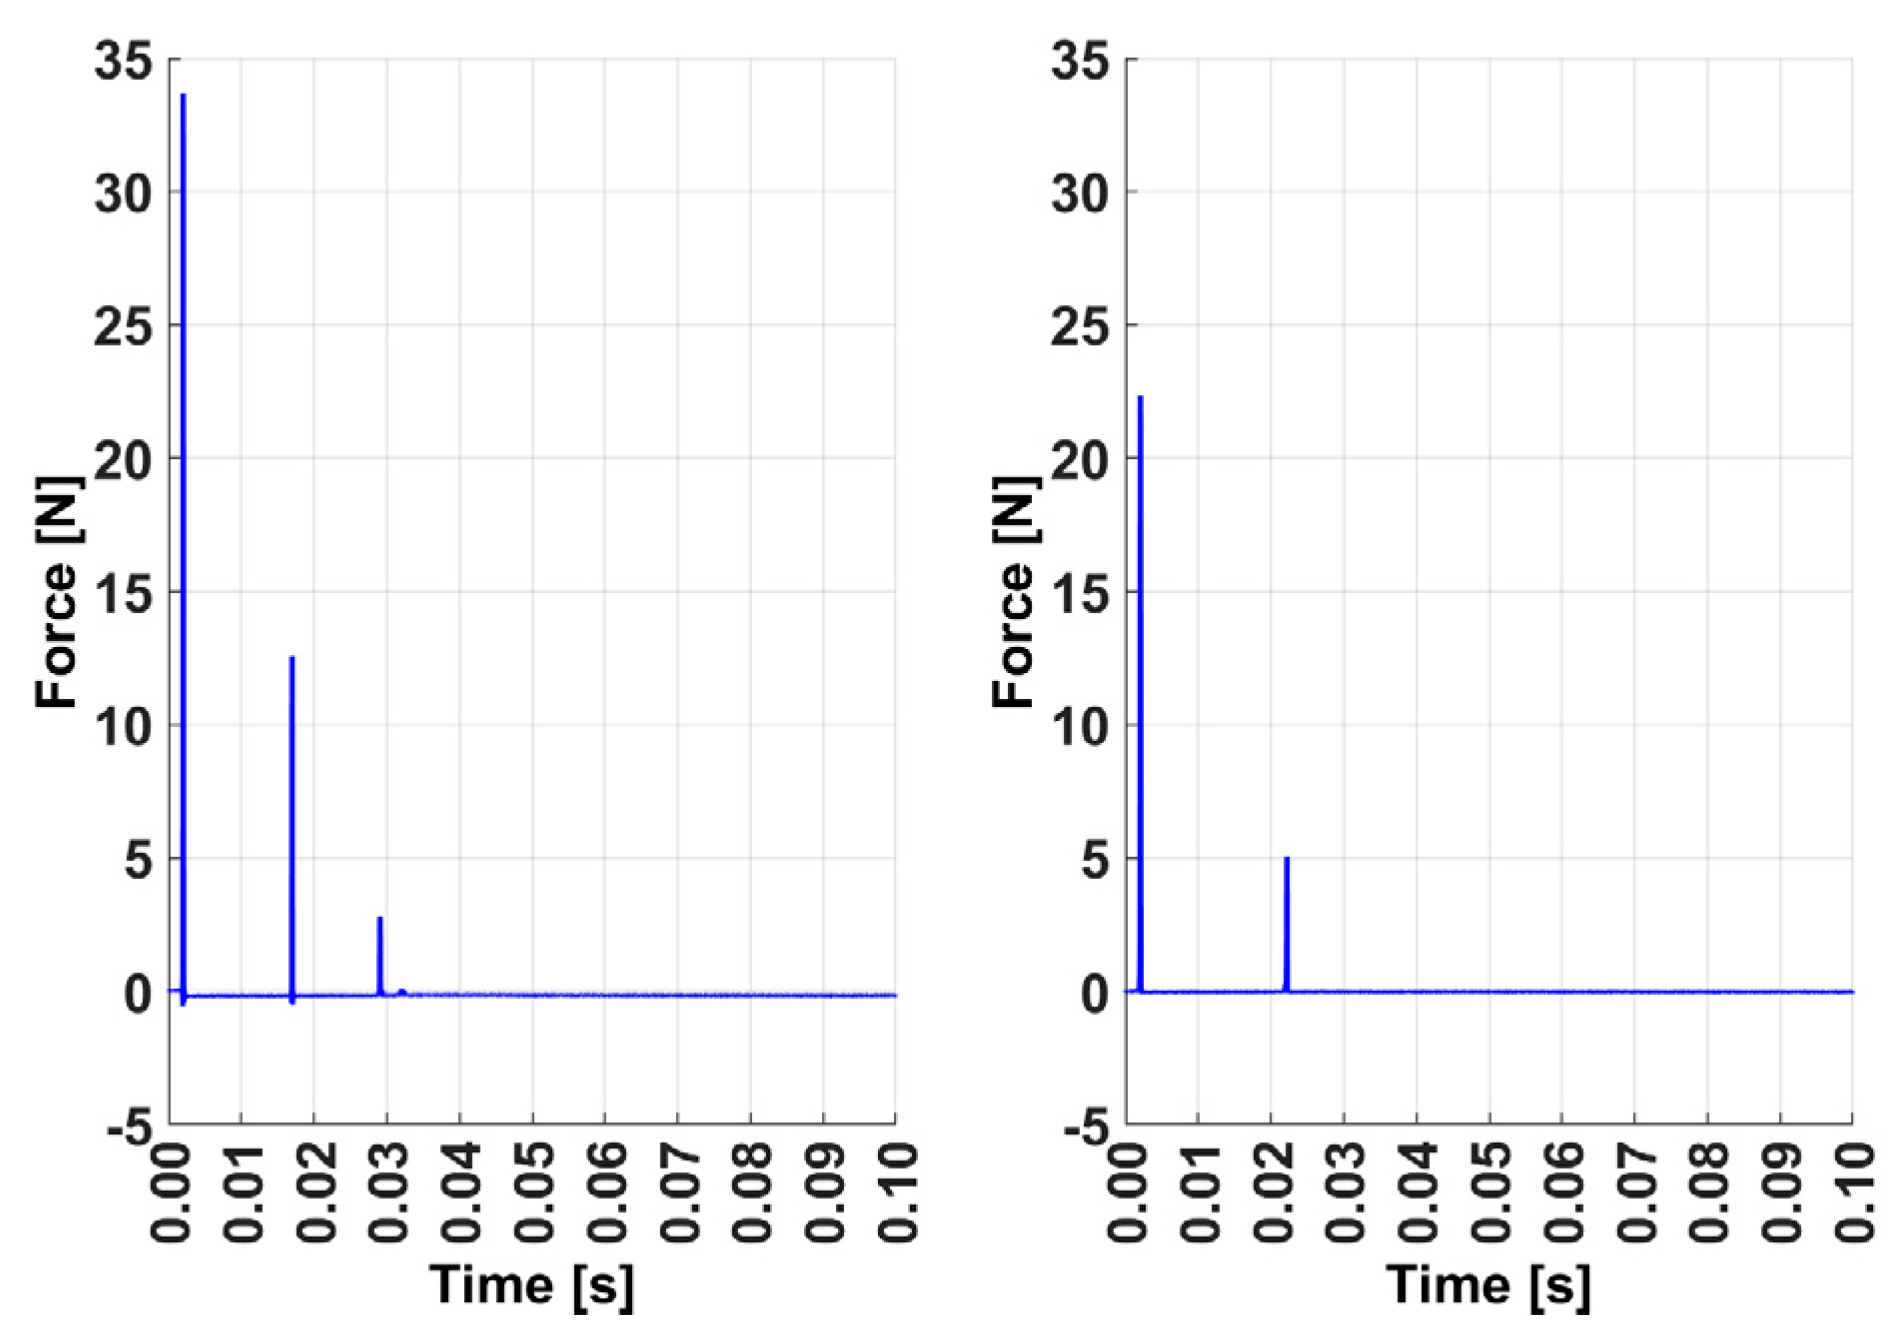
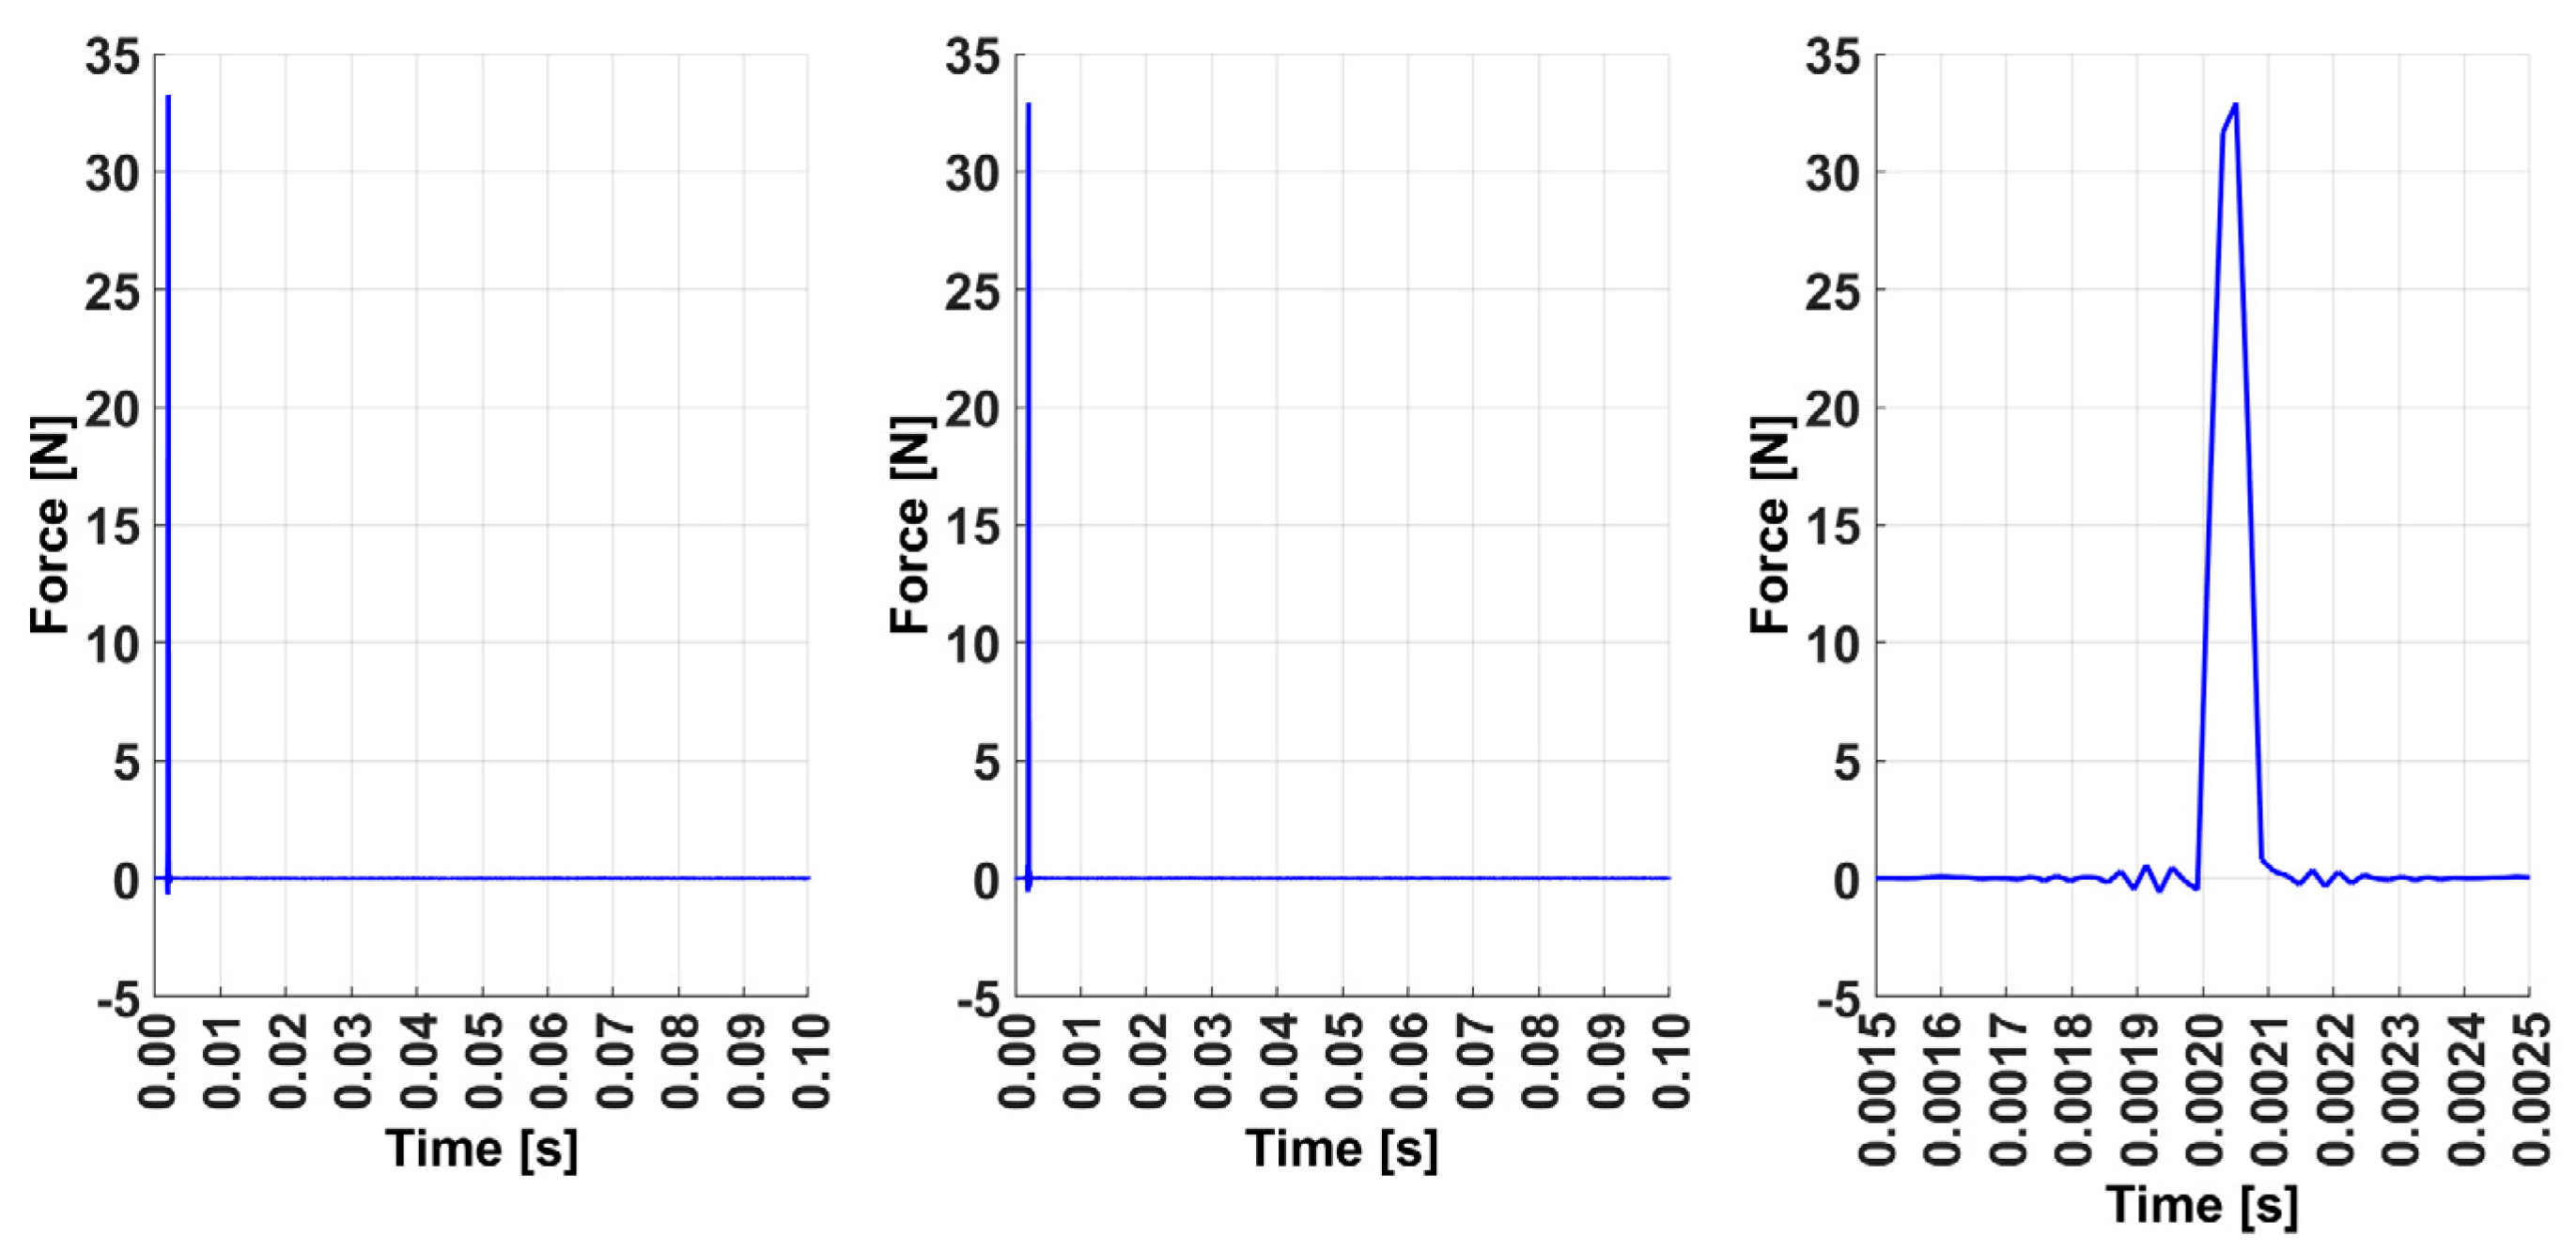
  • Variability of strike force. Manual control of the modal hammer can cause variability in the strike force between individual measurements. If the strike force is not constant, it can affect the results of the analysis, especially in terms of accurate measurements of amplitudes and frequencies of the structure’s response.
  • Incorrect strike angle. It is difficult to ensure that the strike is always performed at the required angle during manual operations. Changes in the angle can alter the excitation characteristics and lead to errors in the data, which may impact the accuracy of mode identification.
  • Lack of repeatability. Manual control can lead to repeatability issues, meaning that each strike may not be exactly the same. Even small differences in position, angle, and strike force can cause changes in the dynamic responses of the measured structure.
  • Introduction of unwanted influences. In addition to the strike force, manual operation may transfer vibrations from the hand or arm to the hammer. These transfers can affect the results of the analysis, as unwanted interferences may be recorded in the data instead of a pure structural response.
  • Limited positioning accuracy. The placement of the hammer at different points on the structure (depending on the manual handling) can influence the characteristics of the excitation. Different areas of the structure may have different dynamic properties, resulting in varying responses to the same strike.
When evaluating the results of the experimental modal analysis with the manual control of the modal hammer (see Figure 2), the authors have long observed that the results of repeated measurements of the same bladed discs show significant statistical dispersion in the degree of mistuning of individual blades. Therefore, the intention arose to control the modal hammer with a suitable mechanism instead of a human hand, which would ensure the repeatability of the location and timing of force impulses on all blades.

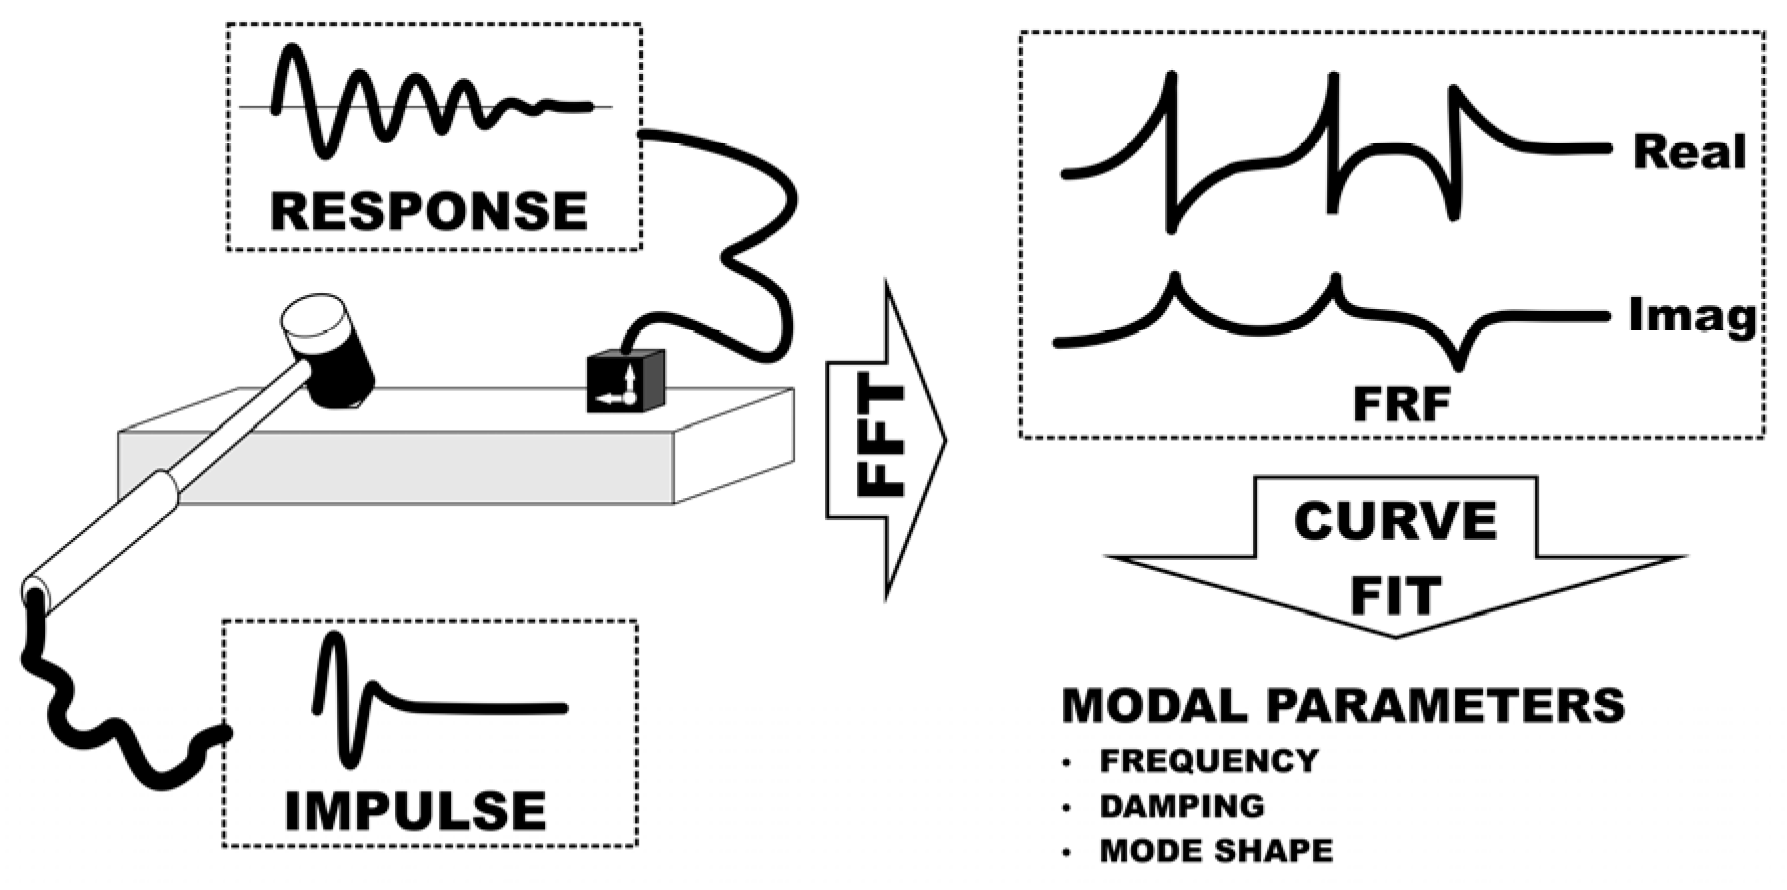
2. Materials and Methods

2.1. Inaccuracies in Manual Control of the Modal Hammer

The first type of inaccuracy mentioned above can be observed in Figure 3, which illustrates the force generated by the hammer’s force sensor during individual blade strikes. At a glance, variations in the strength of each strike are clearly noticeable. Additionally, some strikes exhibit double impacts, visible even without zooming in on the time axis. Achieving consistent, high-quality hammer strikes suitable for a modal analysis demands significant practice in manually controlling the modal impact hammer.
While these factors—aside from double strikes—may theoretically have a minimal impact on the evaluation of transfer functions, practical experience reveals that they exert a non-negligible influence. This makes data evaluation cumbersome, increases testing time, and, above all, the aforementioned large statistical deviations arise when evaluating the degree of mistuning.

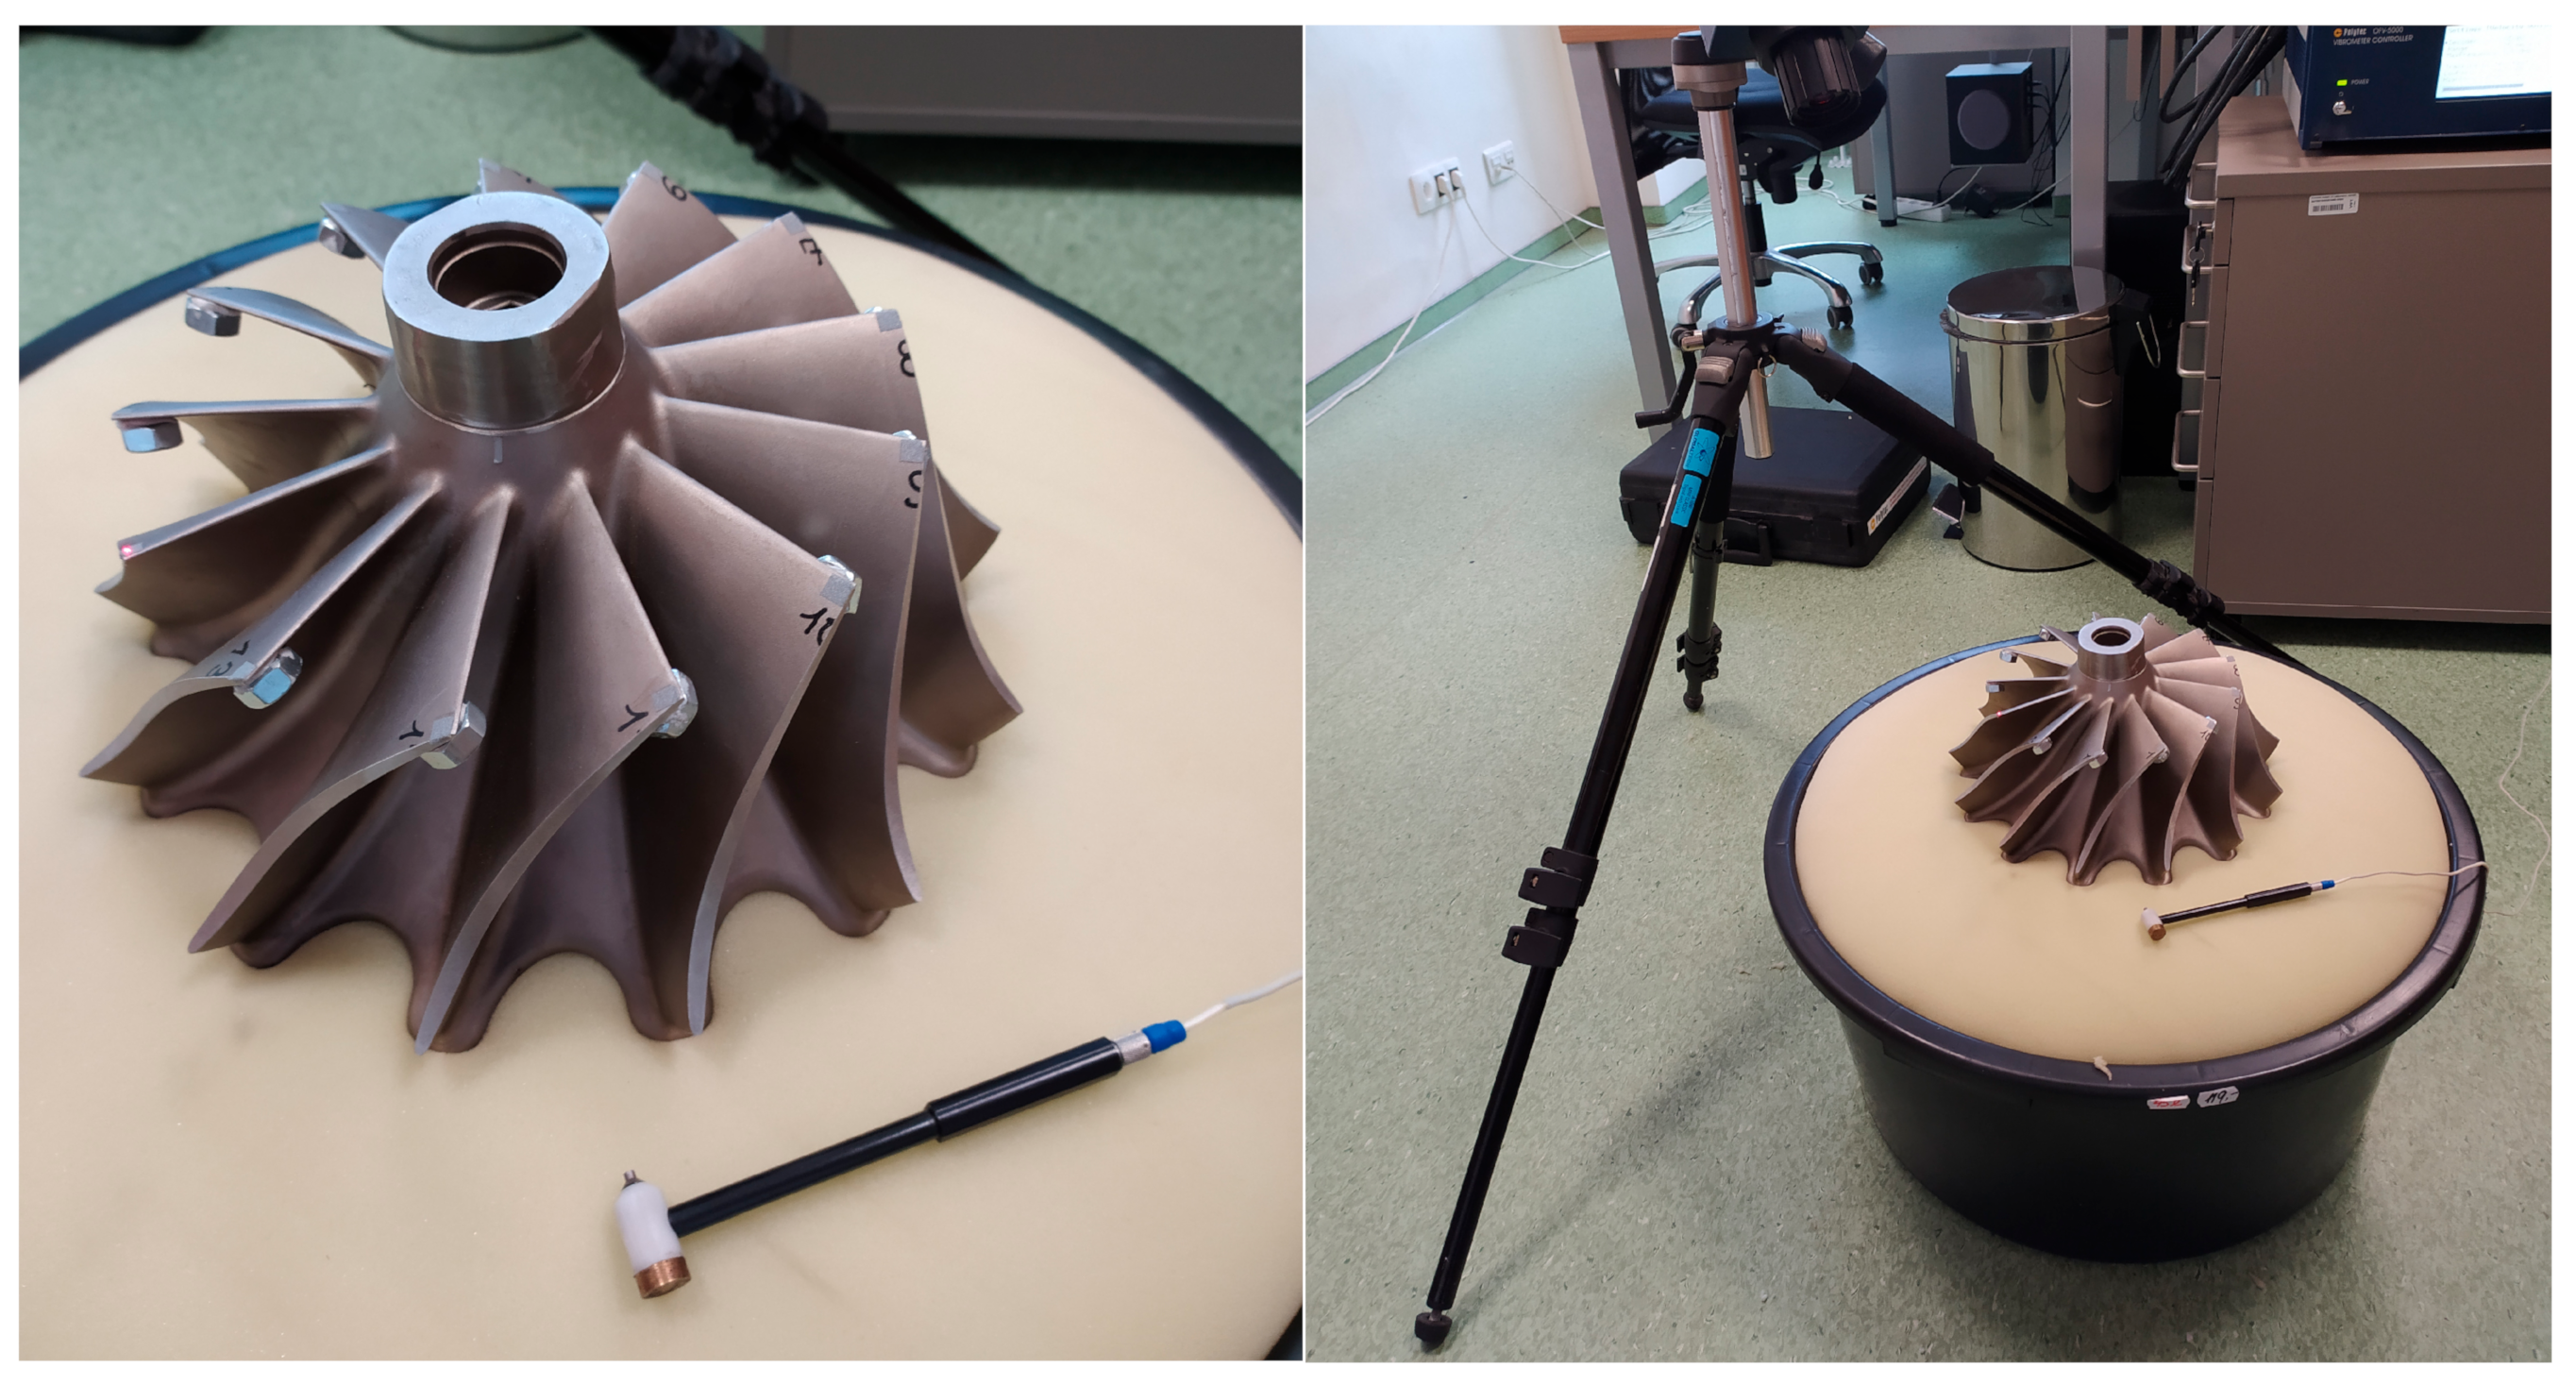
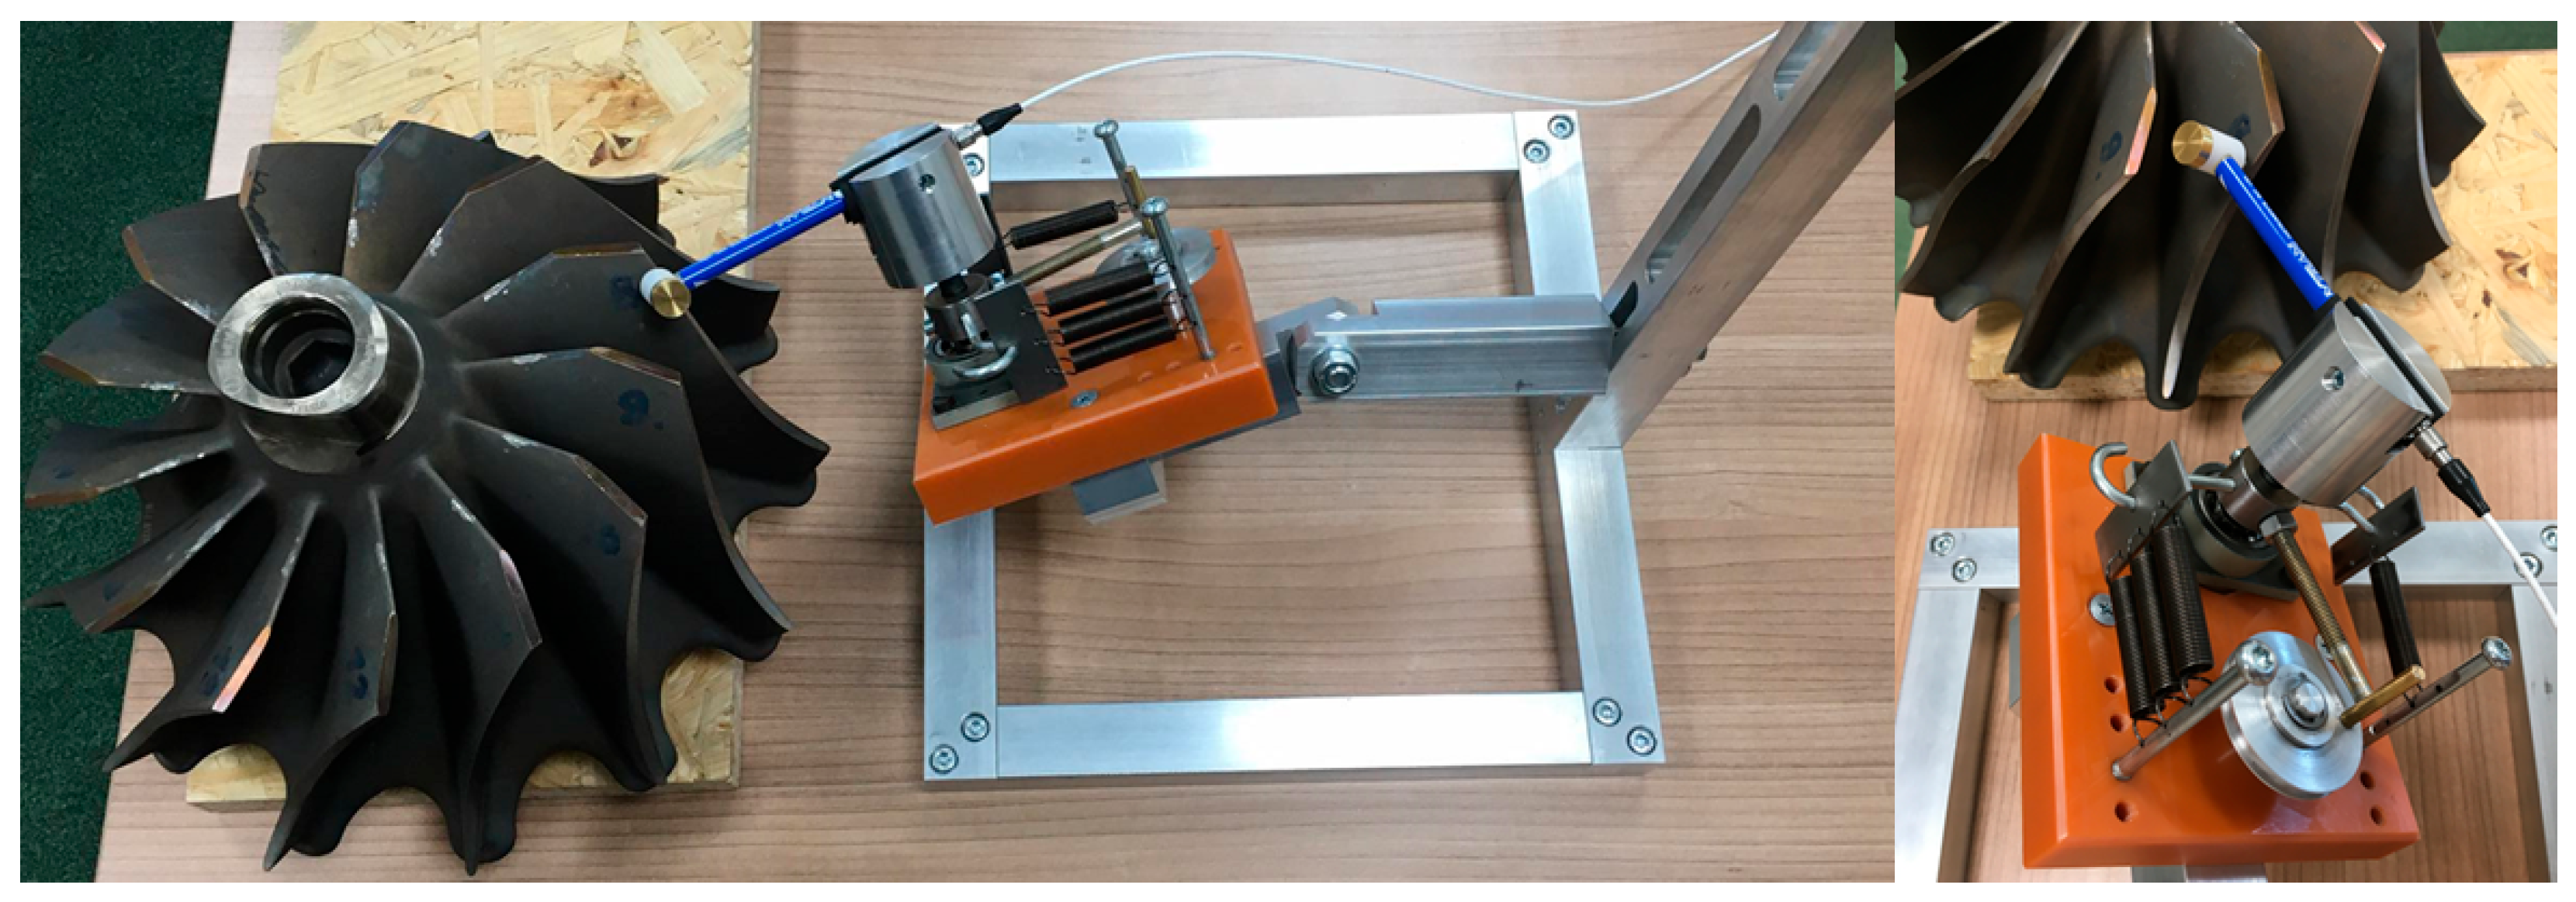
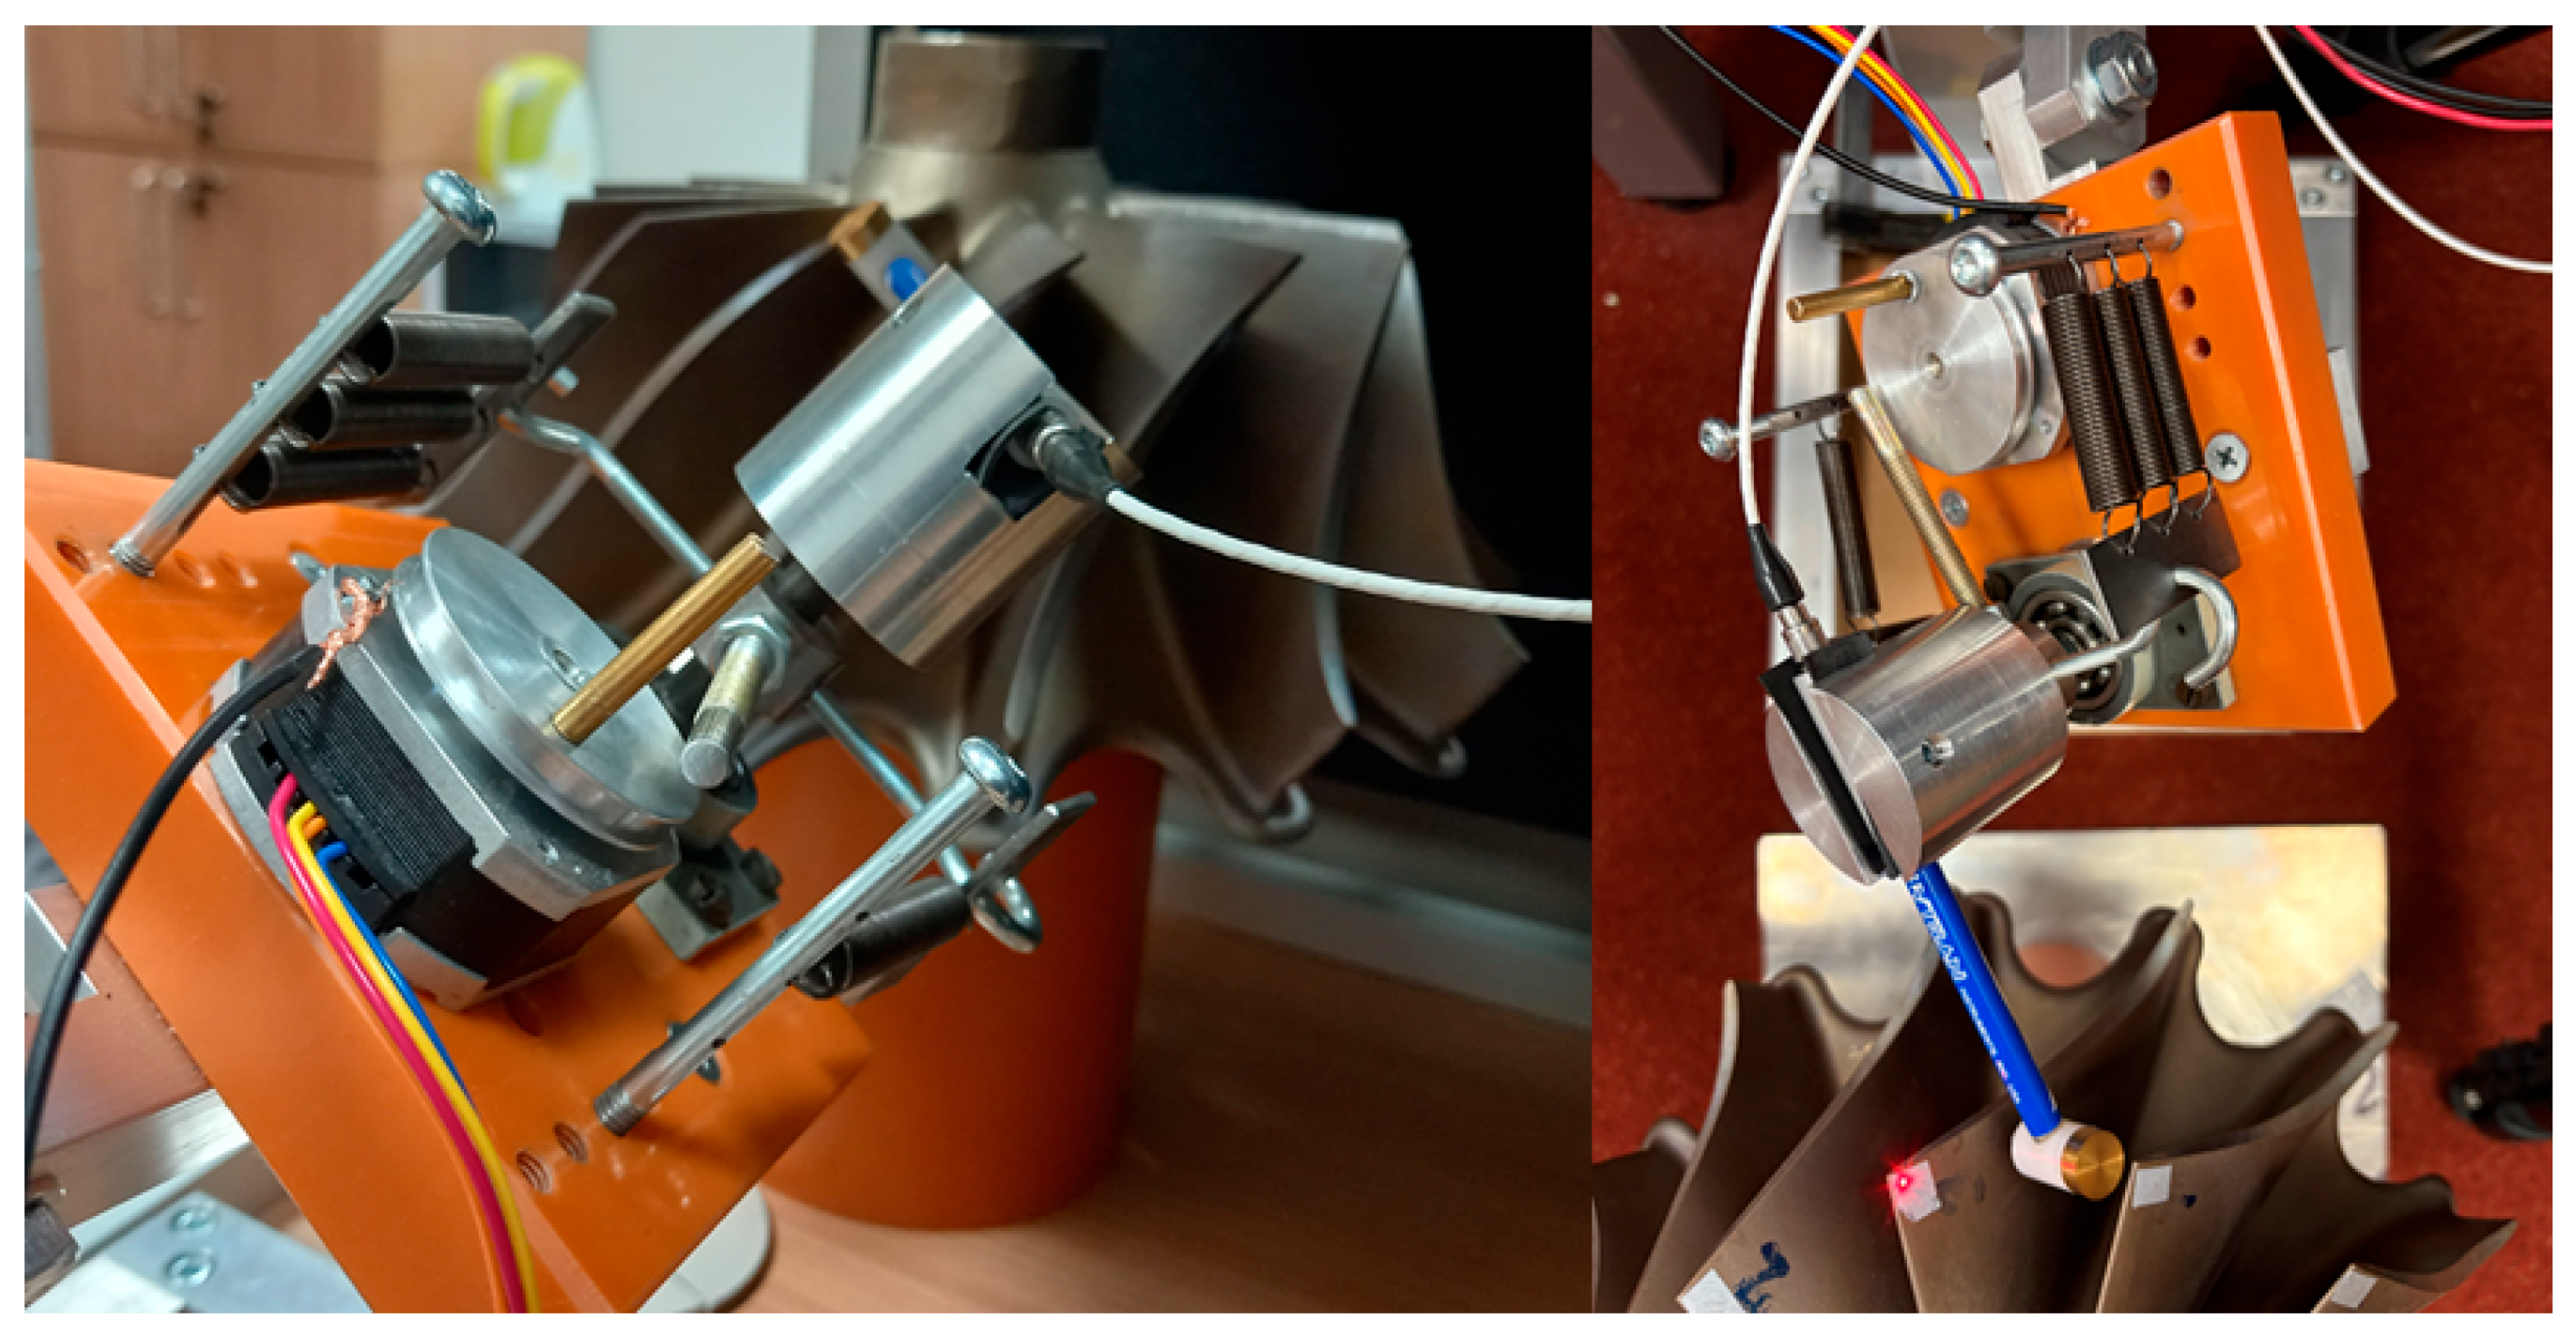
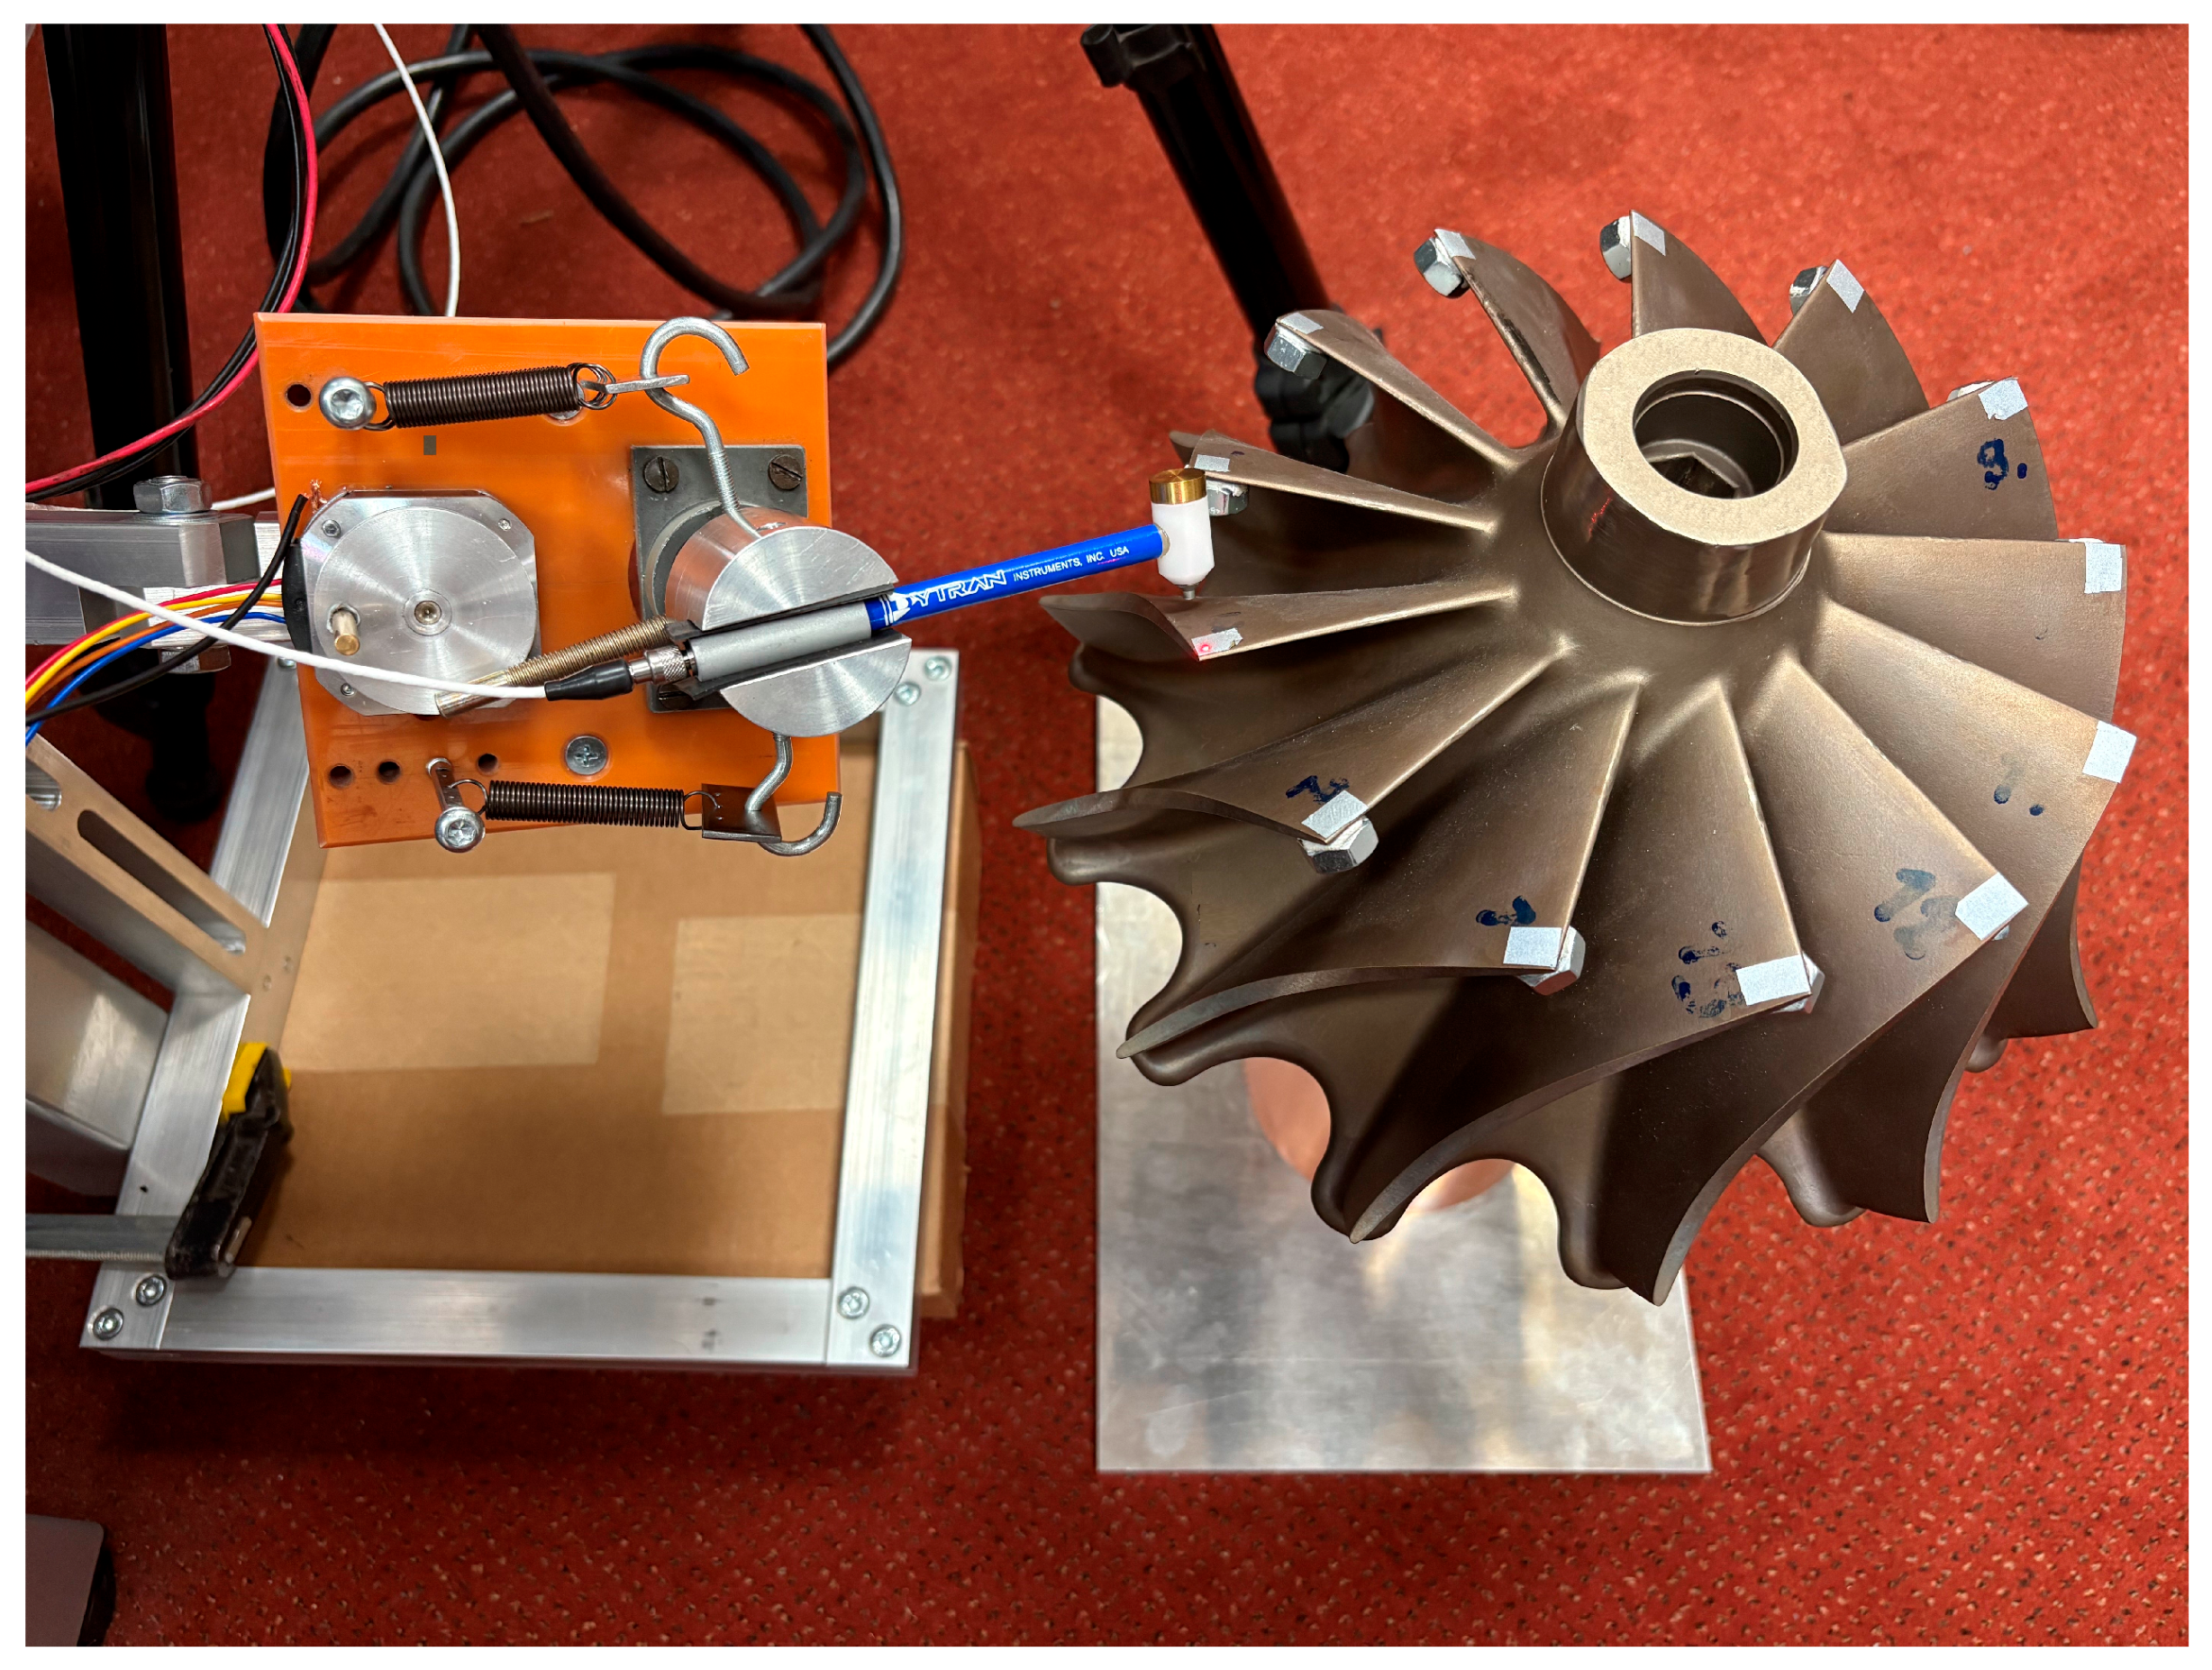
2.2. Measuring Device Replacing the Human Hand

To address these challenges, a concept was developed for a measuring device capable of conducting experimental modal tests on integrated bladed discs—specifically turbine wheels of various sizes and blade counts—while simultaneously mitigating these shortcomings. Ideally, such a device would be fully automatic and remotely controlled via a computer. However, before developing a more advanced fully automatic system, it was necessary to validate the functionality of a simpler, semi-automatic device. This device replaces the manual guidance of the modal hammer with a controlled mechanism, though it is still manually operated.
The core of the device consists of a hammer holder mounted on an axis supported by two radial ball bearings, which facilitate the primary measuring motion—the hammer strike. Additionally, the device allows for secondary movements, including displacements and rotations, essential for accurately aligning the hammer perpendicular to the analysed blade during measurements on turbine wheels of varying sizes.
To conduct the initial tests, the prototype shown in Figure 4 was assembled. This prototype enables the primary hammer movement as well as secondary adjustments, thanks to its aluminium adjustable console on which the device is mounted. The hammer is manually cocked, with its impact and subsequent return to the starting position ensured by a system of tension springs. The alignment and rotation of the hammer perpendicular to the blade’s measured location were achieved by adjusting the console to the appropriate position.
The principle behind the hammer’s impact on the turbine blade involves setting its equilibrium position to maintain a gap of several millimetres between the hammer tip and the blade surface. This gap depends on the desired impact force, the stiffness, and the number of tension springs. When the hammer is extended to its designated stop, an over-oscillation occurs upon release, causing it to strike the blade as it moves beyond the equilibrium position. The system of tension springs ensures that the hammer gradually returns to its equilibrium without causing any further impacts.
To evaluate the device’s functionality, particularly with regard to double strikes of the hammer, it is sufficient to analyse the force impulse recorded by the hammer’s force sensor. A series of hammer strikes was conducted to confirm the device’s operational accuracy. Data collection was performed at 20 s intervals with a sampling rate of 50 kHz, facilitated by the NI cDAQ-9179 measurement card. The data were recorded using the LabView software (version 2024) and subsequently exported to MatLab (version 2024) for processing and visualisation, with the results displayed in Figure 5.
At first glance, the results demonstrate that the measuring device fulfils the defined requirements. The location and force of individual strikes remain consistent across all instances, indicating that the device provides reliable hammer guidance. Consequently, all test measurements are suitable for experimental modal testing and, importantly, do not exhibit the previously mentioned errors, particularly double strikes. In Figure 6, there are examples of incorrect strikes when manually operating the modal hammer. This does not occur when using the measuring device; Figure 7 shows examples of hammer strikes, which are practically identical.
As observed, each strike involves only a single hammer impact on the turbine blade. This confirms that the concept of designing a measuring device is validated through the successful practical testing of the prototype, paving the way for further development of the device.
The next stage of development focuses on automating the hammer’s cocking mechanism and ensuring consistent striking force. To achieve this, a stepper motor was selected, as shown in Figure 8. The motor operates in one full revolution, during which it cocks and releases the hammer. This design allows the hammer sufficient time to stabilise in its equilibrium position after each strike before the motor returns to its starting position. Consequently, strikes can be performed consecutively, reducing the measurement time while eliminating the need to account for hammer settling, thereby preventing deviations in the measurements.

3. Results

To verify the full functionality of the improved measuring mechanism, an experimental modal analysis was conducted on a real turbine wheel from a marine engine turbocharger. Utilising a single laser vibrometer in combination with a computational FE model offers several advantages over scanning vibrometers in turbine wheel analyses. A simple laser vibrometer is significantly more economical, reducing laboratory equipment costs. Additionally, the measurement process is less time-intensive, as scanning the entire turbine wheel surface is unnecessary—measuring a single point on each blade suffices when natural frequencies are accurately matched to mode shapes derived from the computational model. This method can also be automated with relative ease, enabling efficient processing and evaluation of the acquired data. As a result, the turbine manufacturer gains comprehensive statistical insights into blade parameters, addressing mistuning influenced by various factors in the production process.

3.1. Computational Model of Tuned Turbine Wheel

The computational finite element model of the tuned turbine wheel was developed using the ANSA software (version 2024). Leveraging the turbine wheel’s cyclic symmetry, the analysis focused on a single sector without any loss of information, as all sectors were considered identical. This approach significantly reduced the model’s degrees of freedom. Element size and type were carefully optimised through a series of sensitivity analyses to ensure both accuracy and computational efficiency. A fine, structured mesh was employed for the blade surface to capture detailed stress distributions and geometric features, while larger elements were utilised for the disc body and shaft, where stress gradients were less pronounced. This combination ensured optimal balance between precision and computational cost.
To validate the robustness of the results, mesh independence was demonstrated by performing analyses with multiple mesh resolutions. The results showed consistent outcomes, indicating that further refinement of the mesh would not significantly alter the conclusions of the analysis.
To generate the complete rotational model, the mesh of one sector underwent periodic expansion and merging of sector boundaries, as illustrated in Figure 9. For optimal correlation with the real turbine wheel mounted in plain bearings, no boundary conditions were applied during the computational modal analysis.
The computed natural frequencies of the blade are presented in Table 1. These frequencies, covering the range up to 18,000 Hz, include the first seven modes. The calculated values offer an approximation of the blade-dominant mode shapes within the rotationally symmetric turbine wheel.

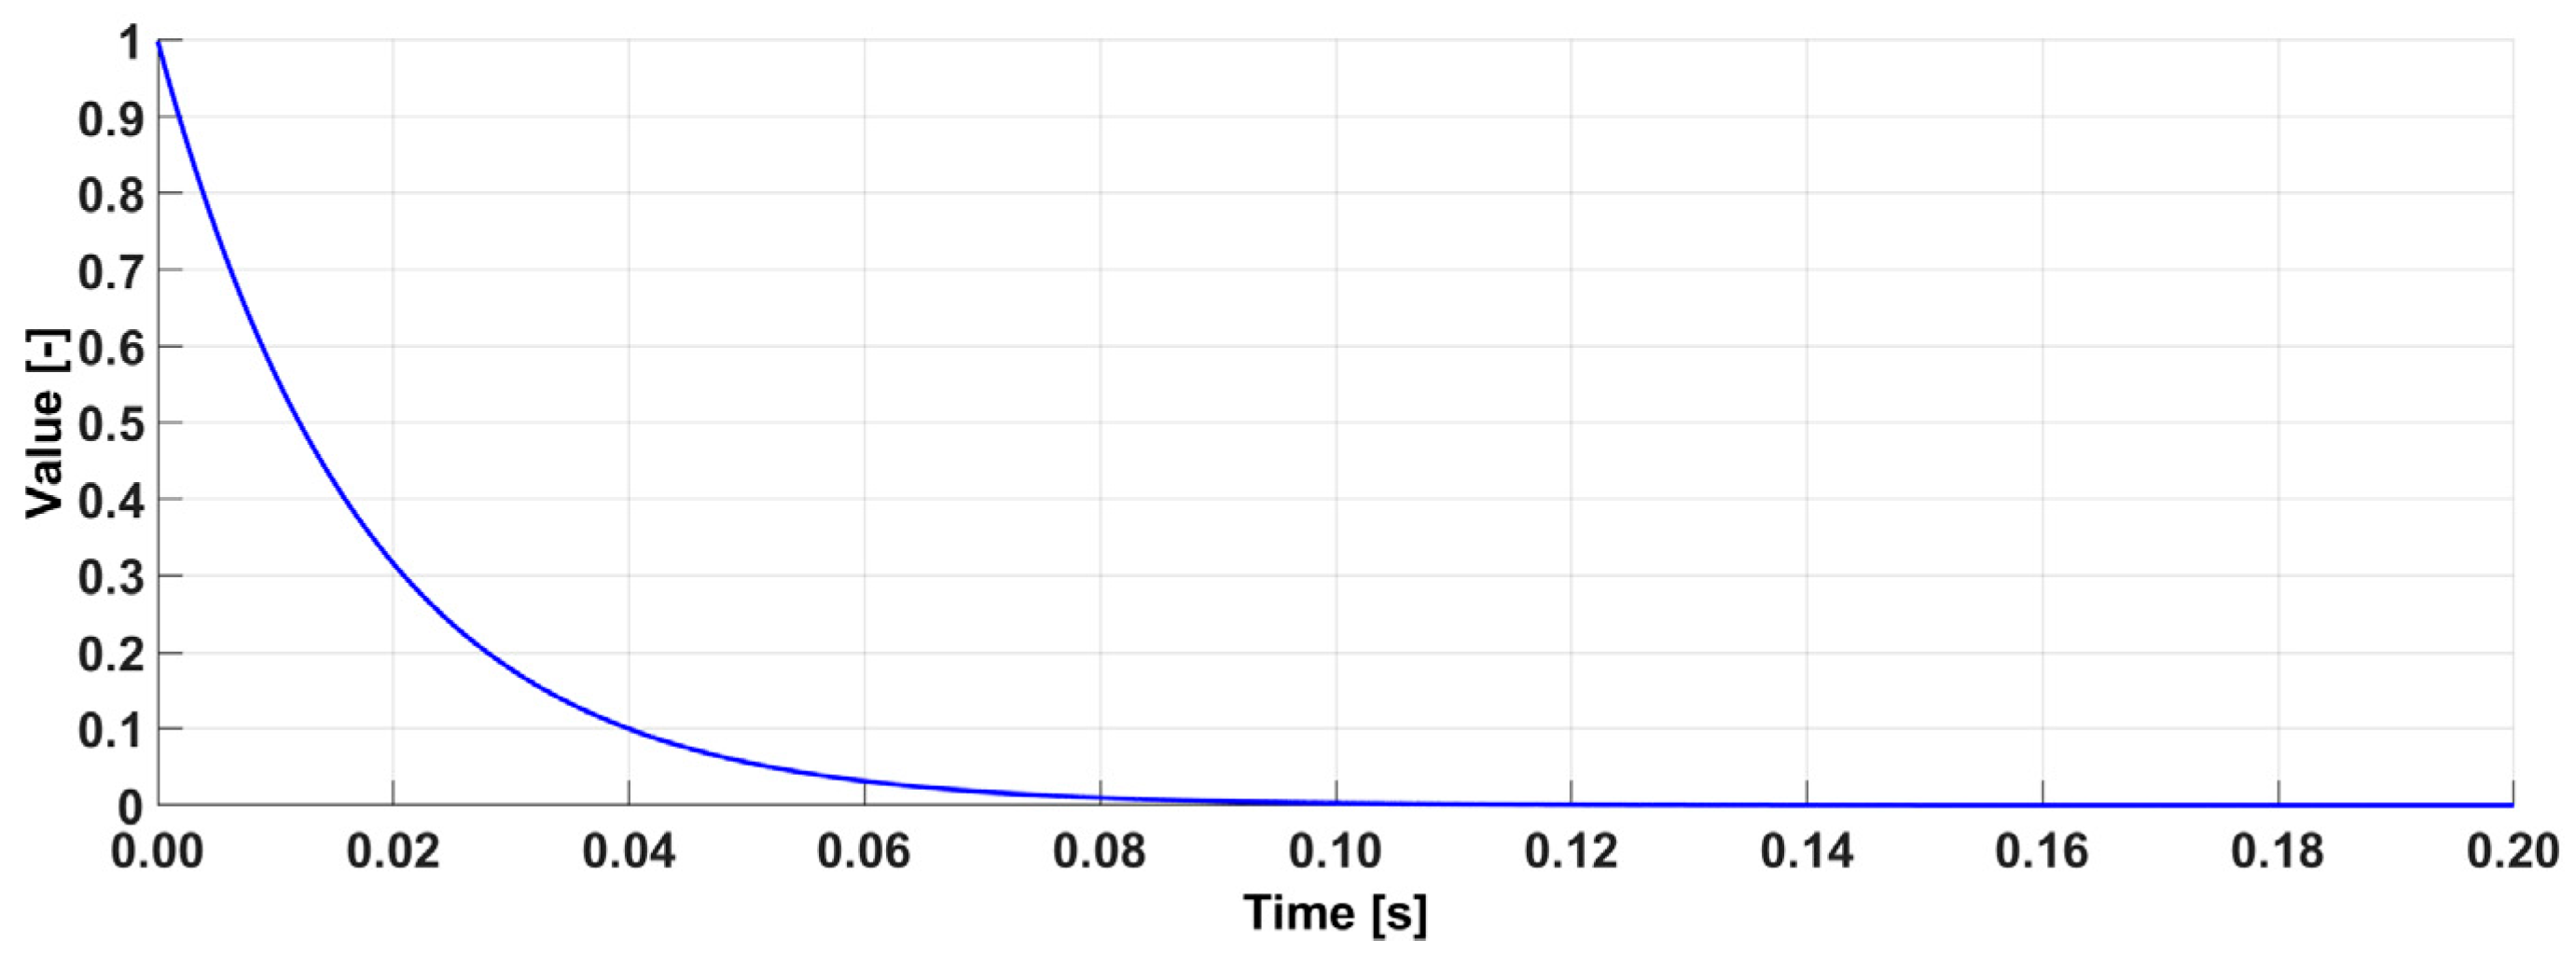
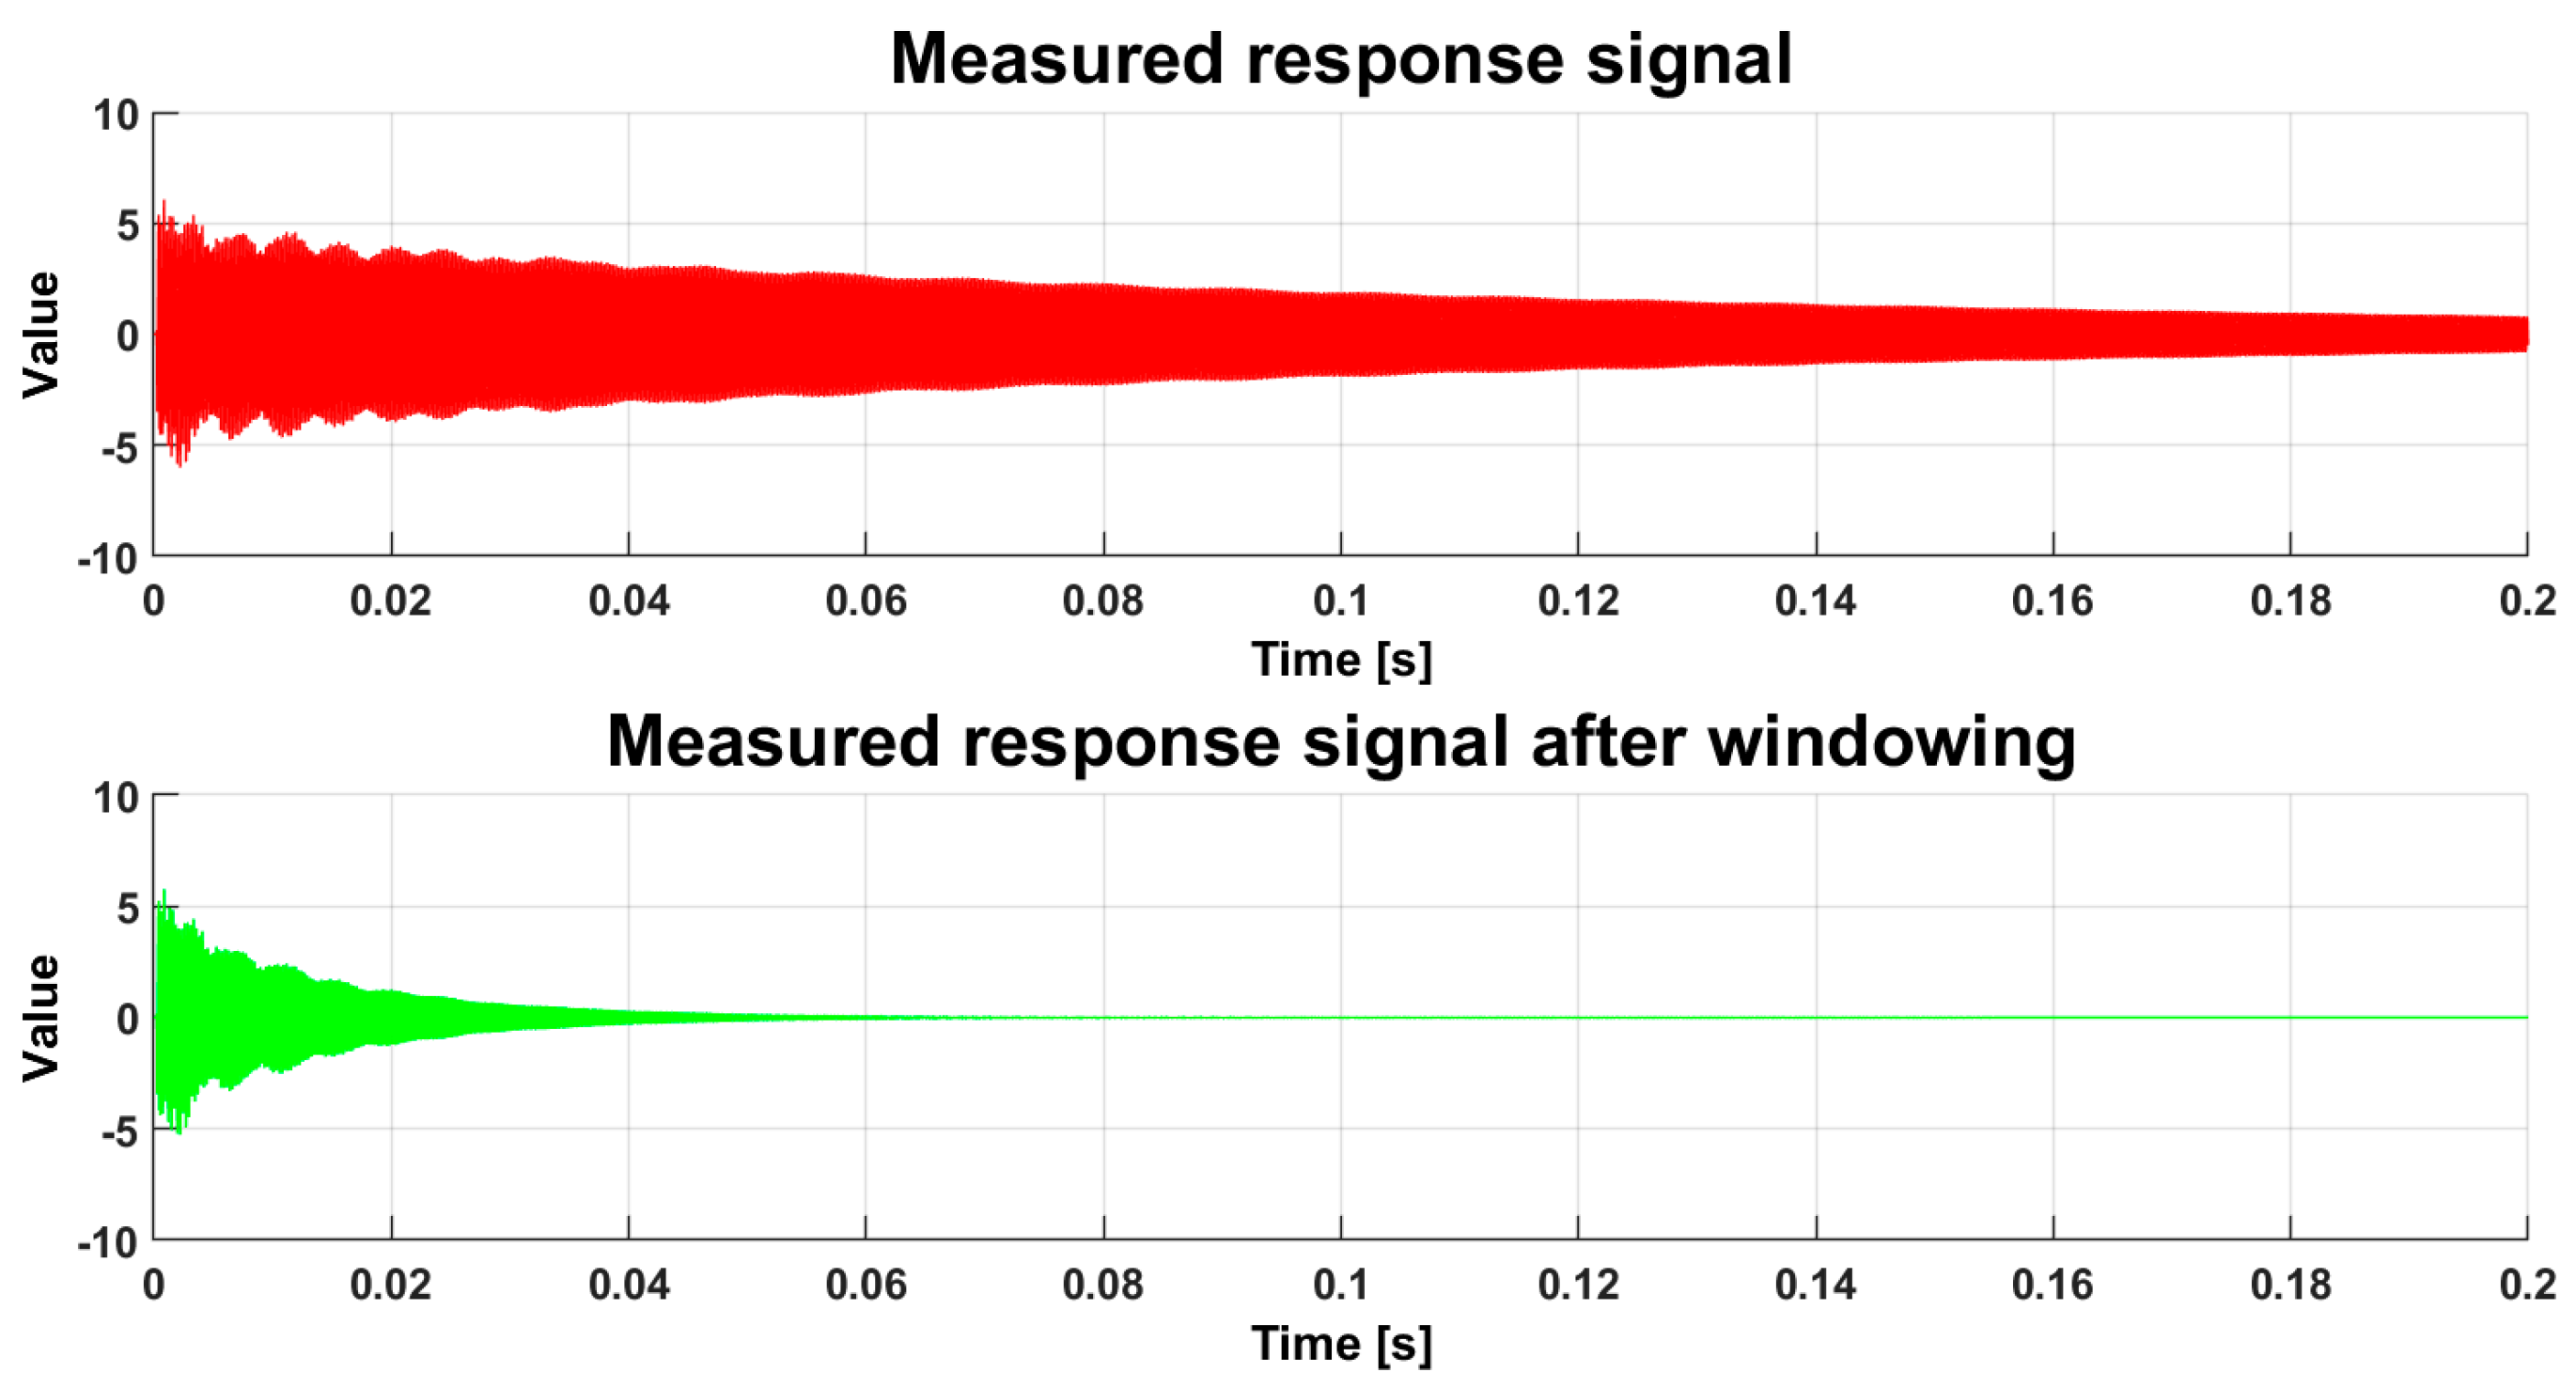
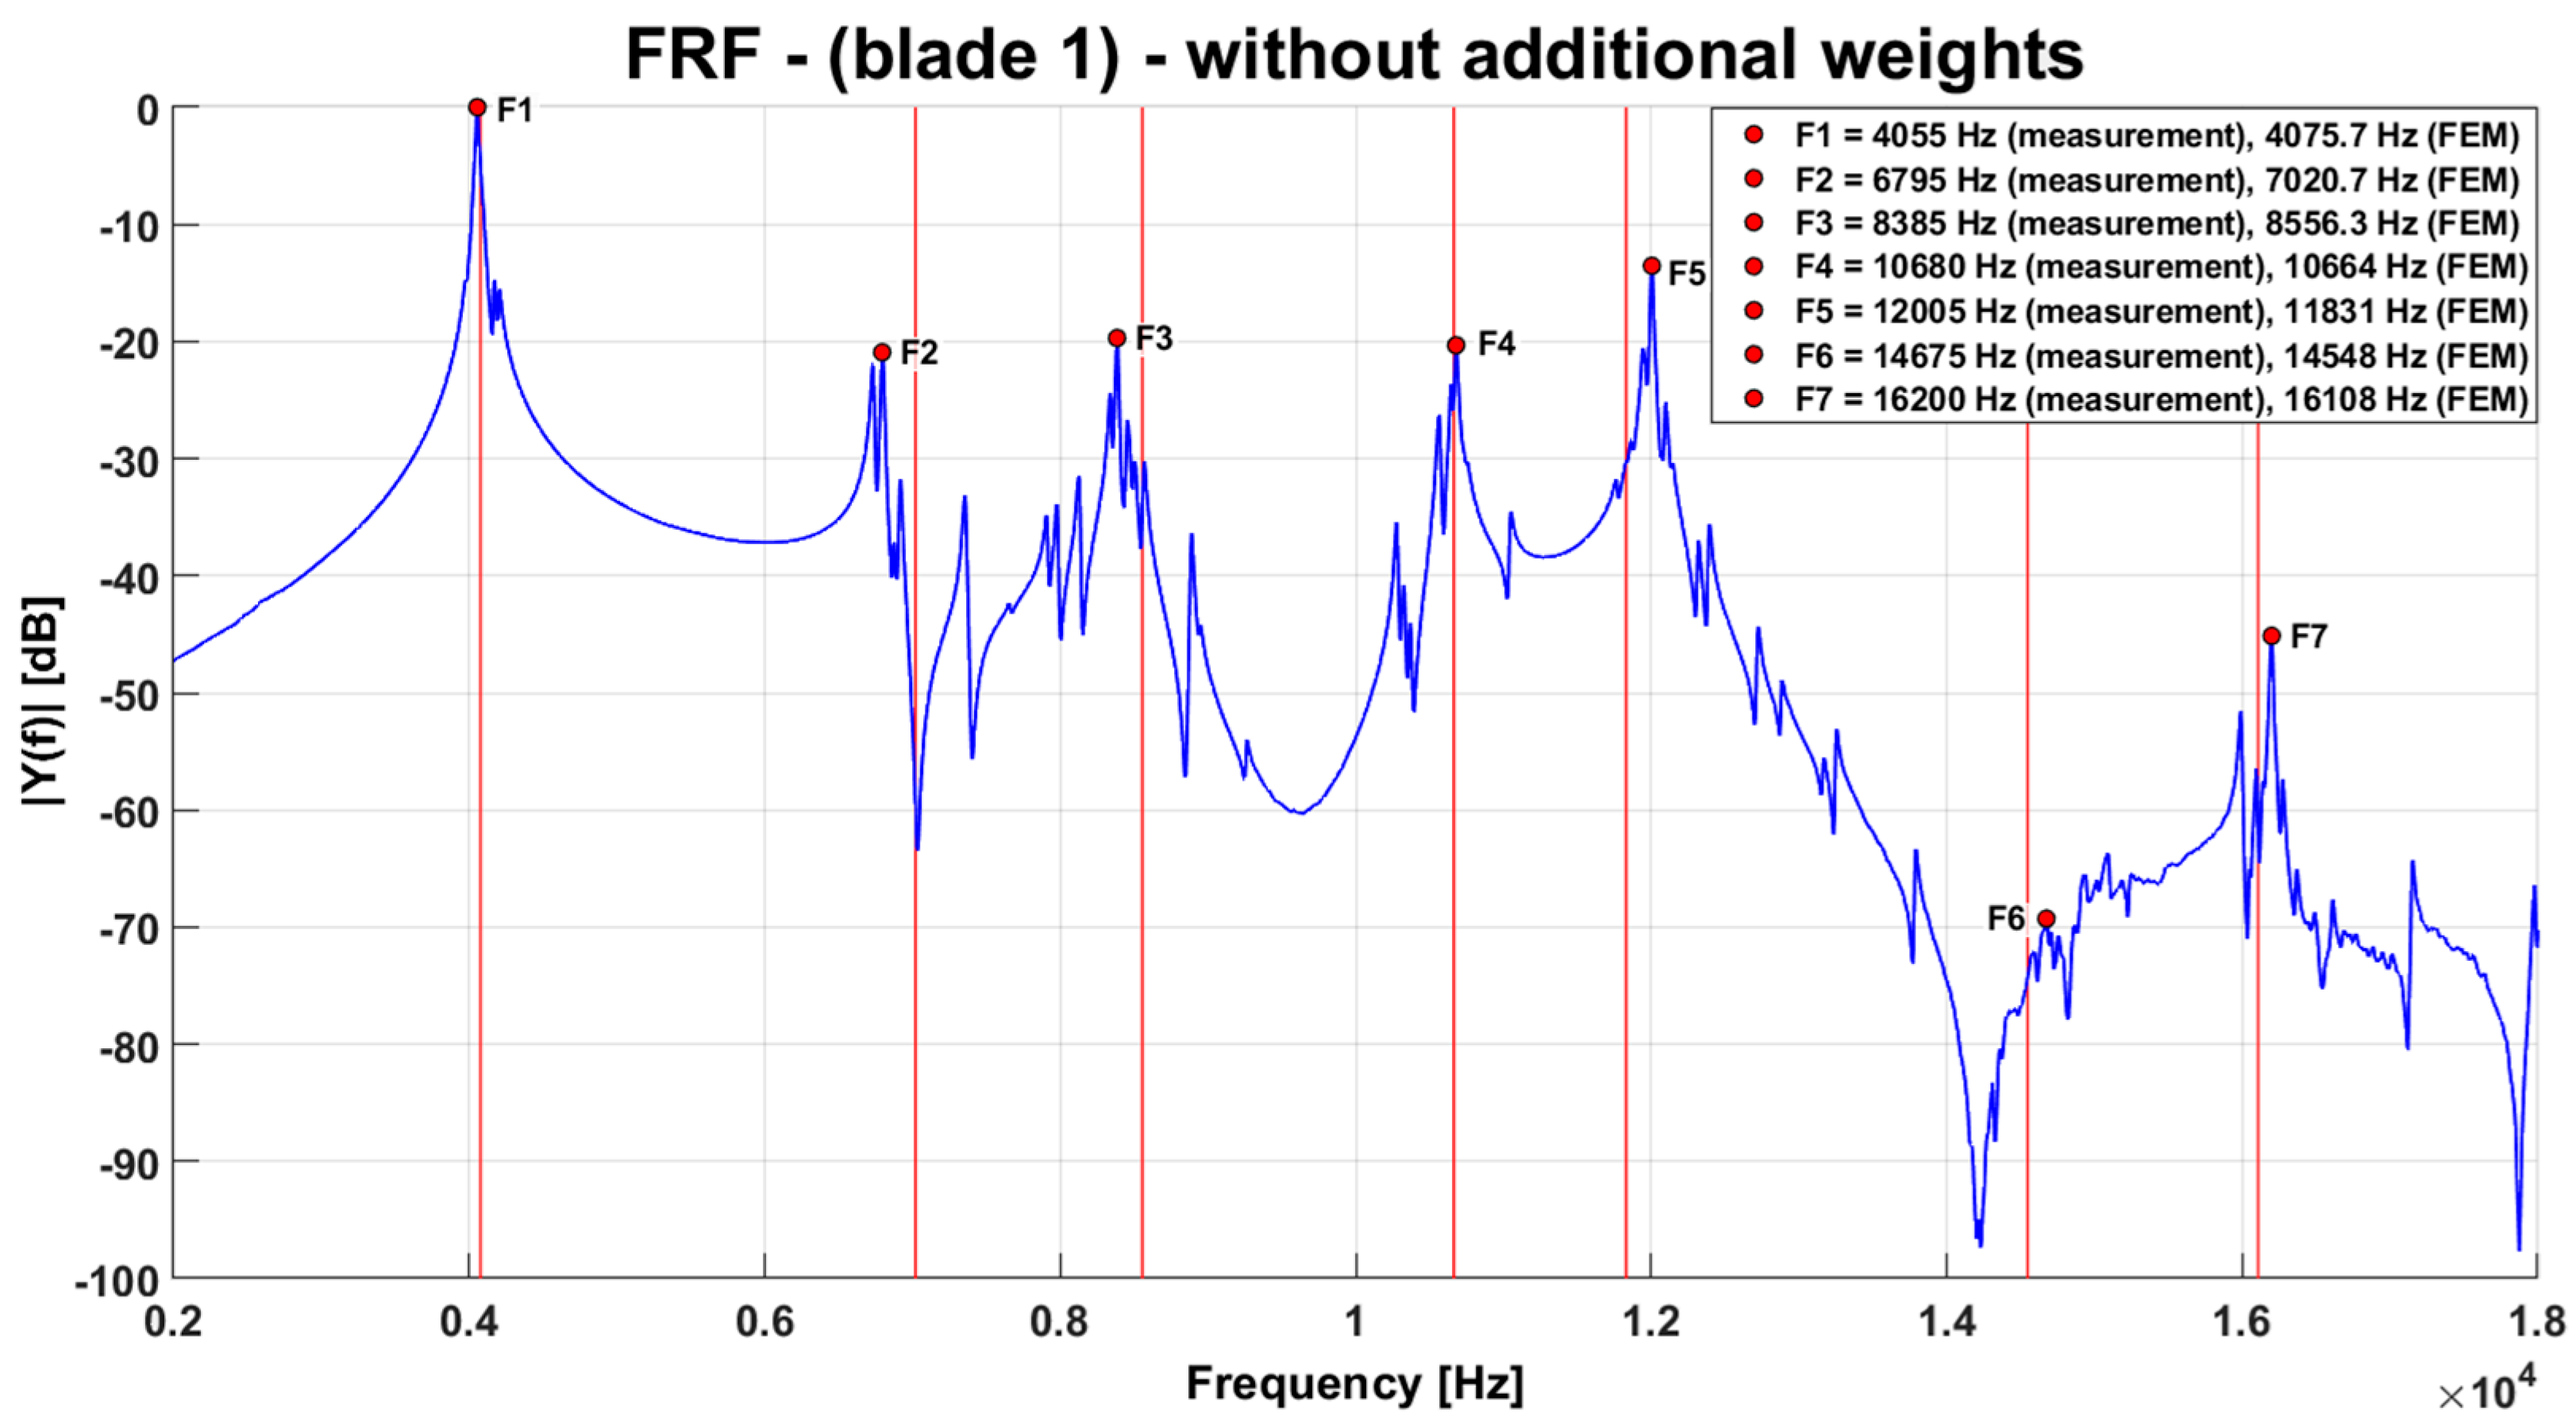
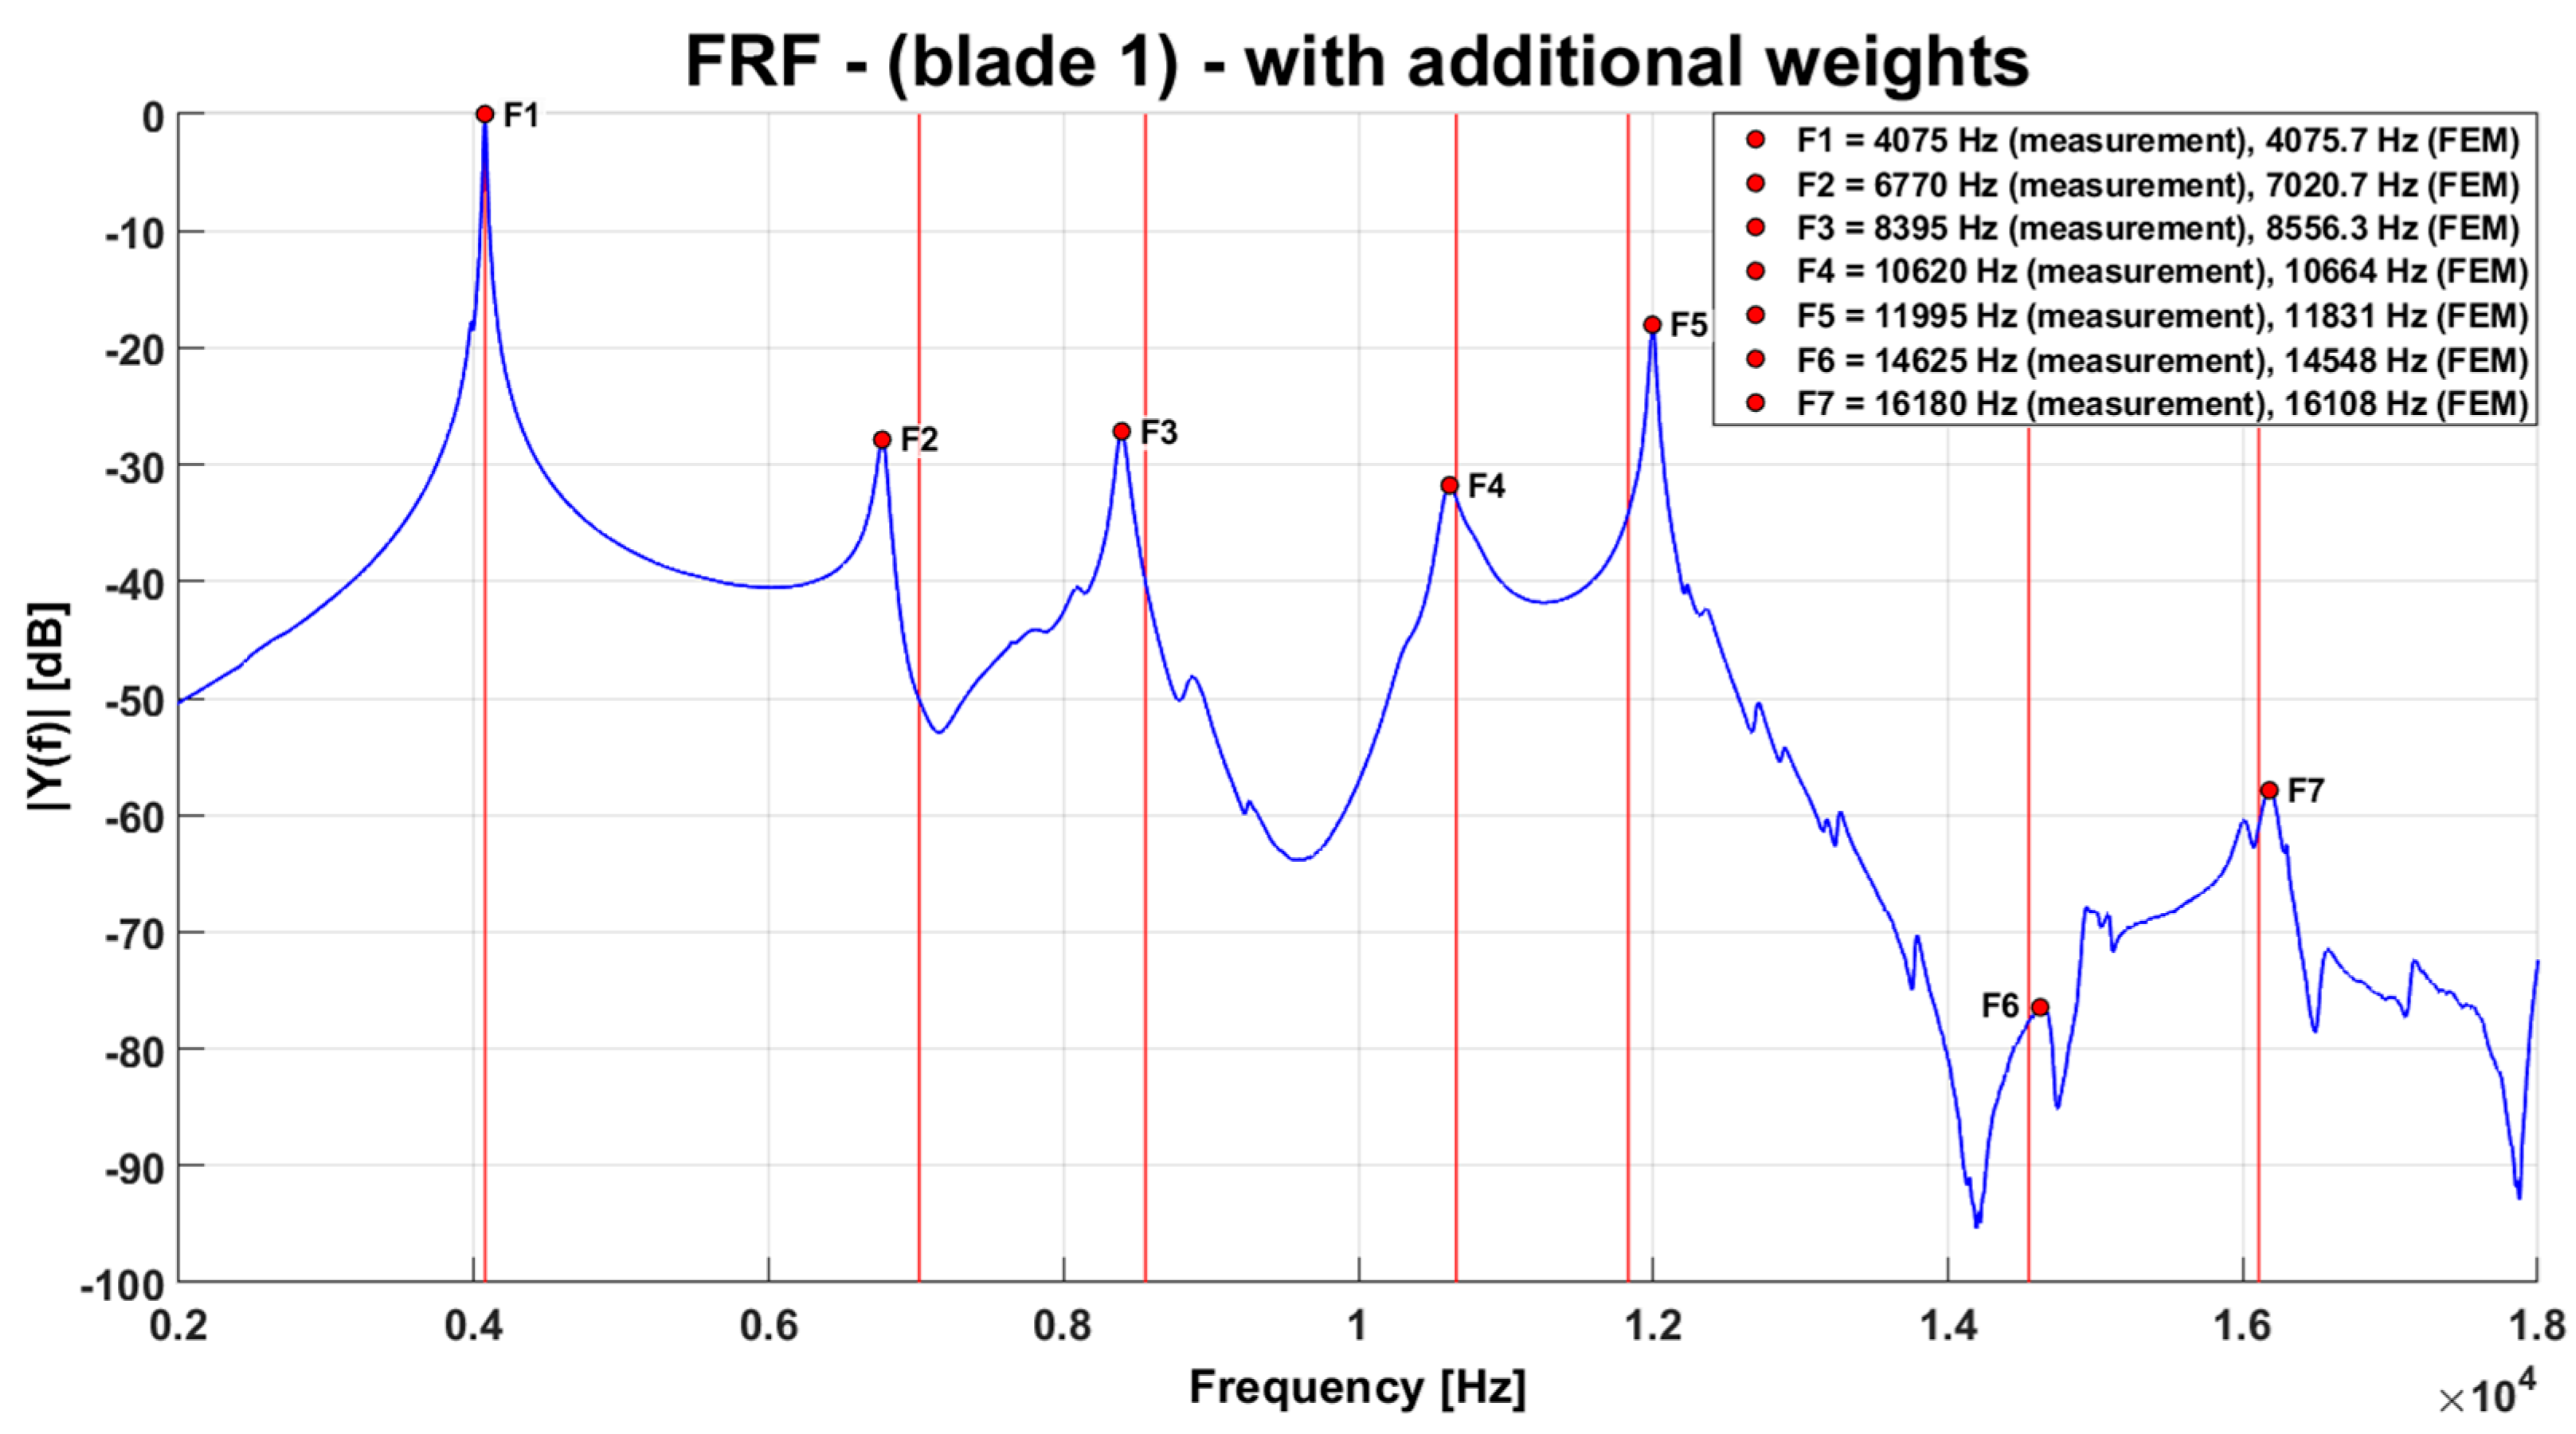
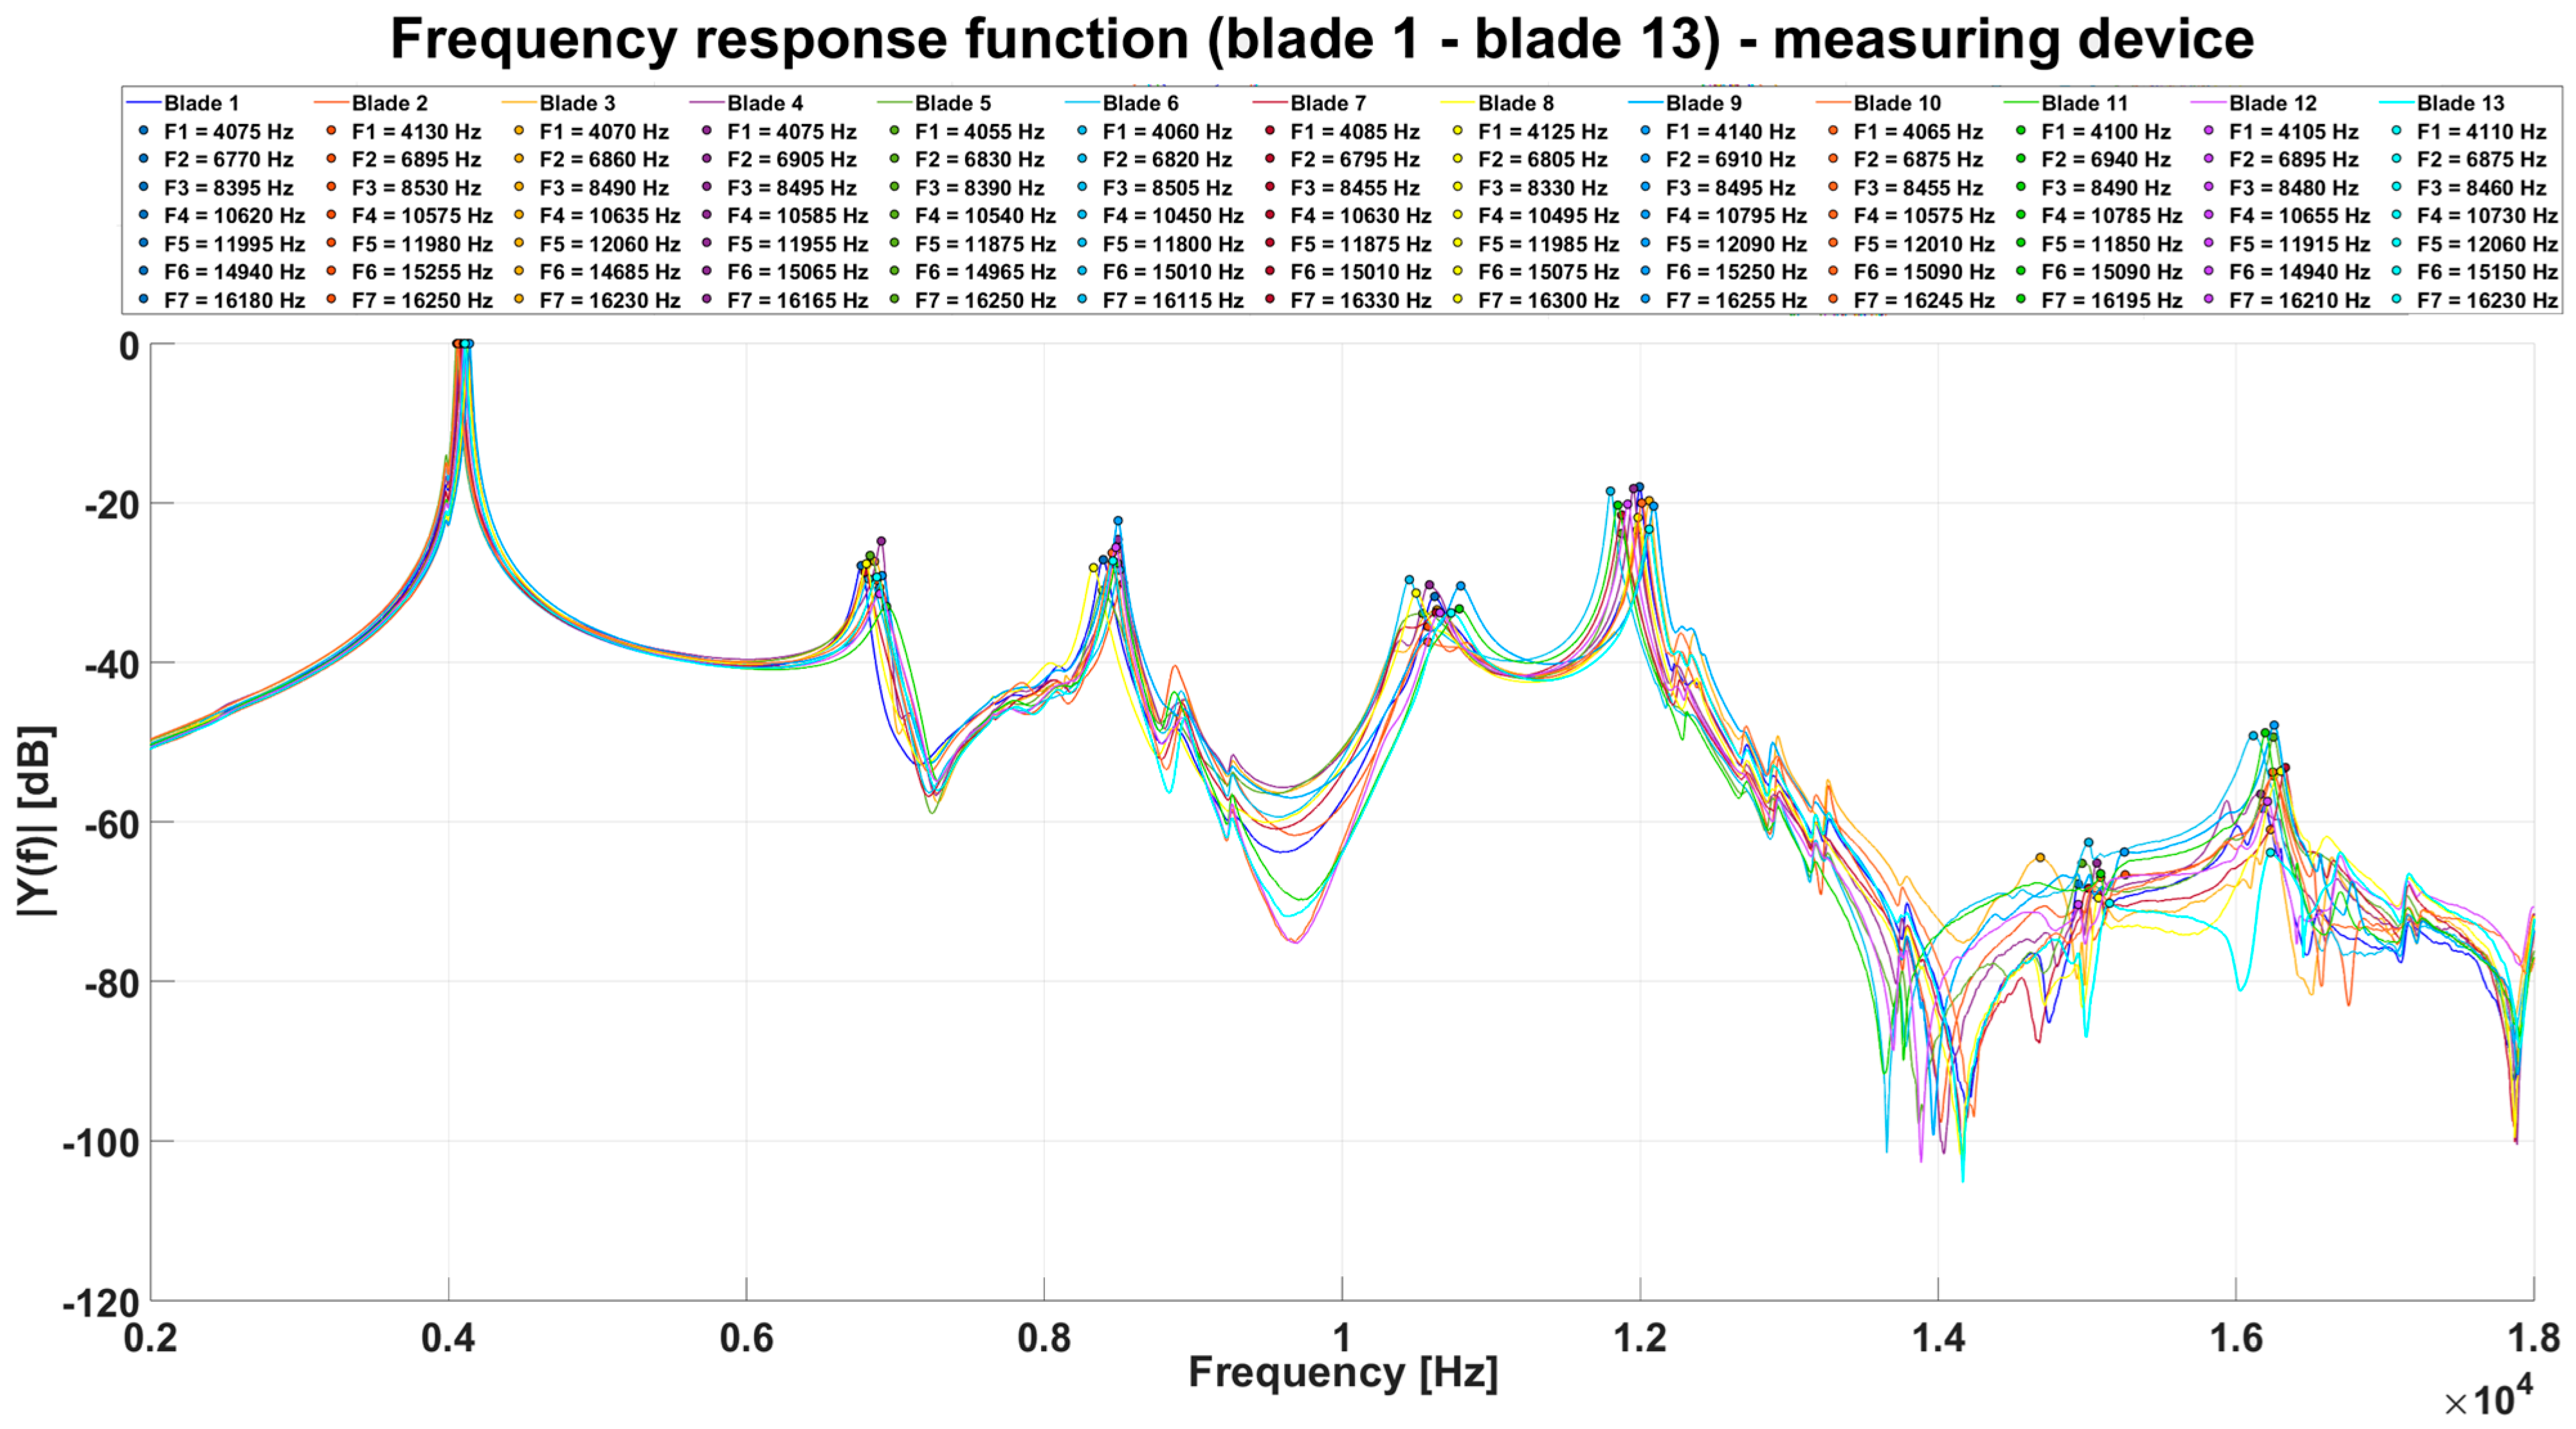
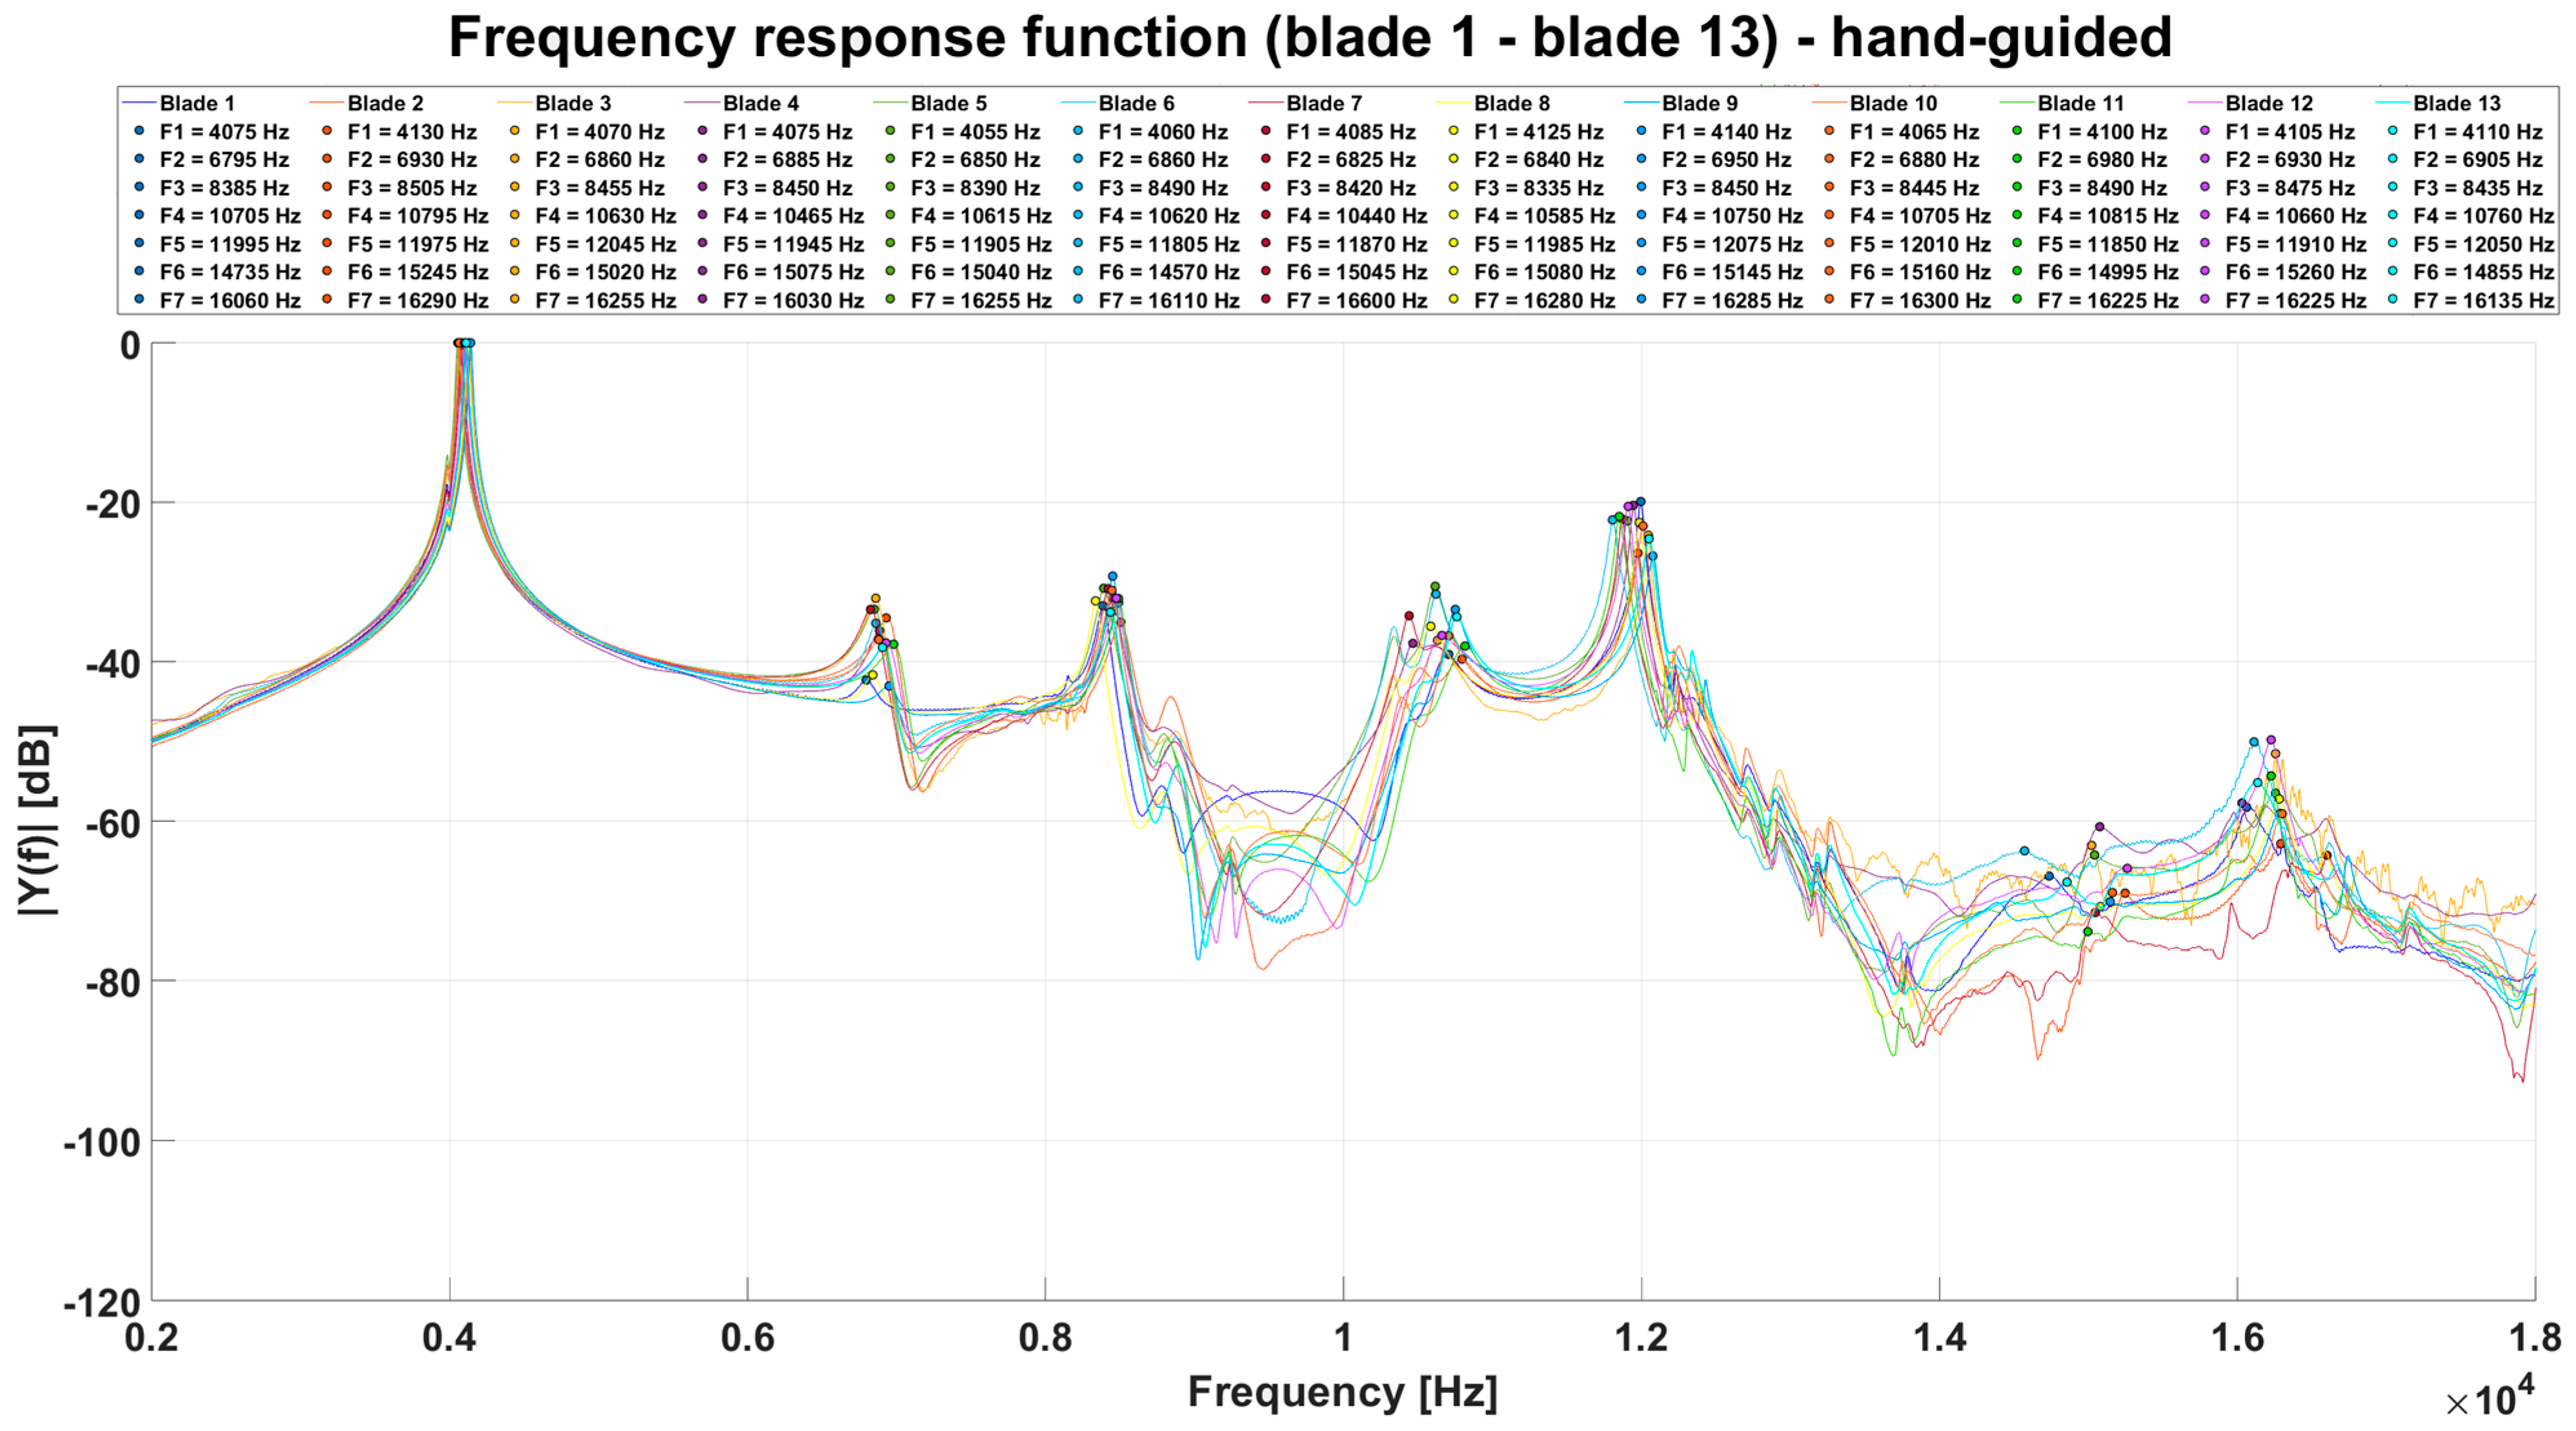
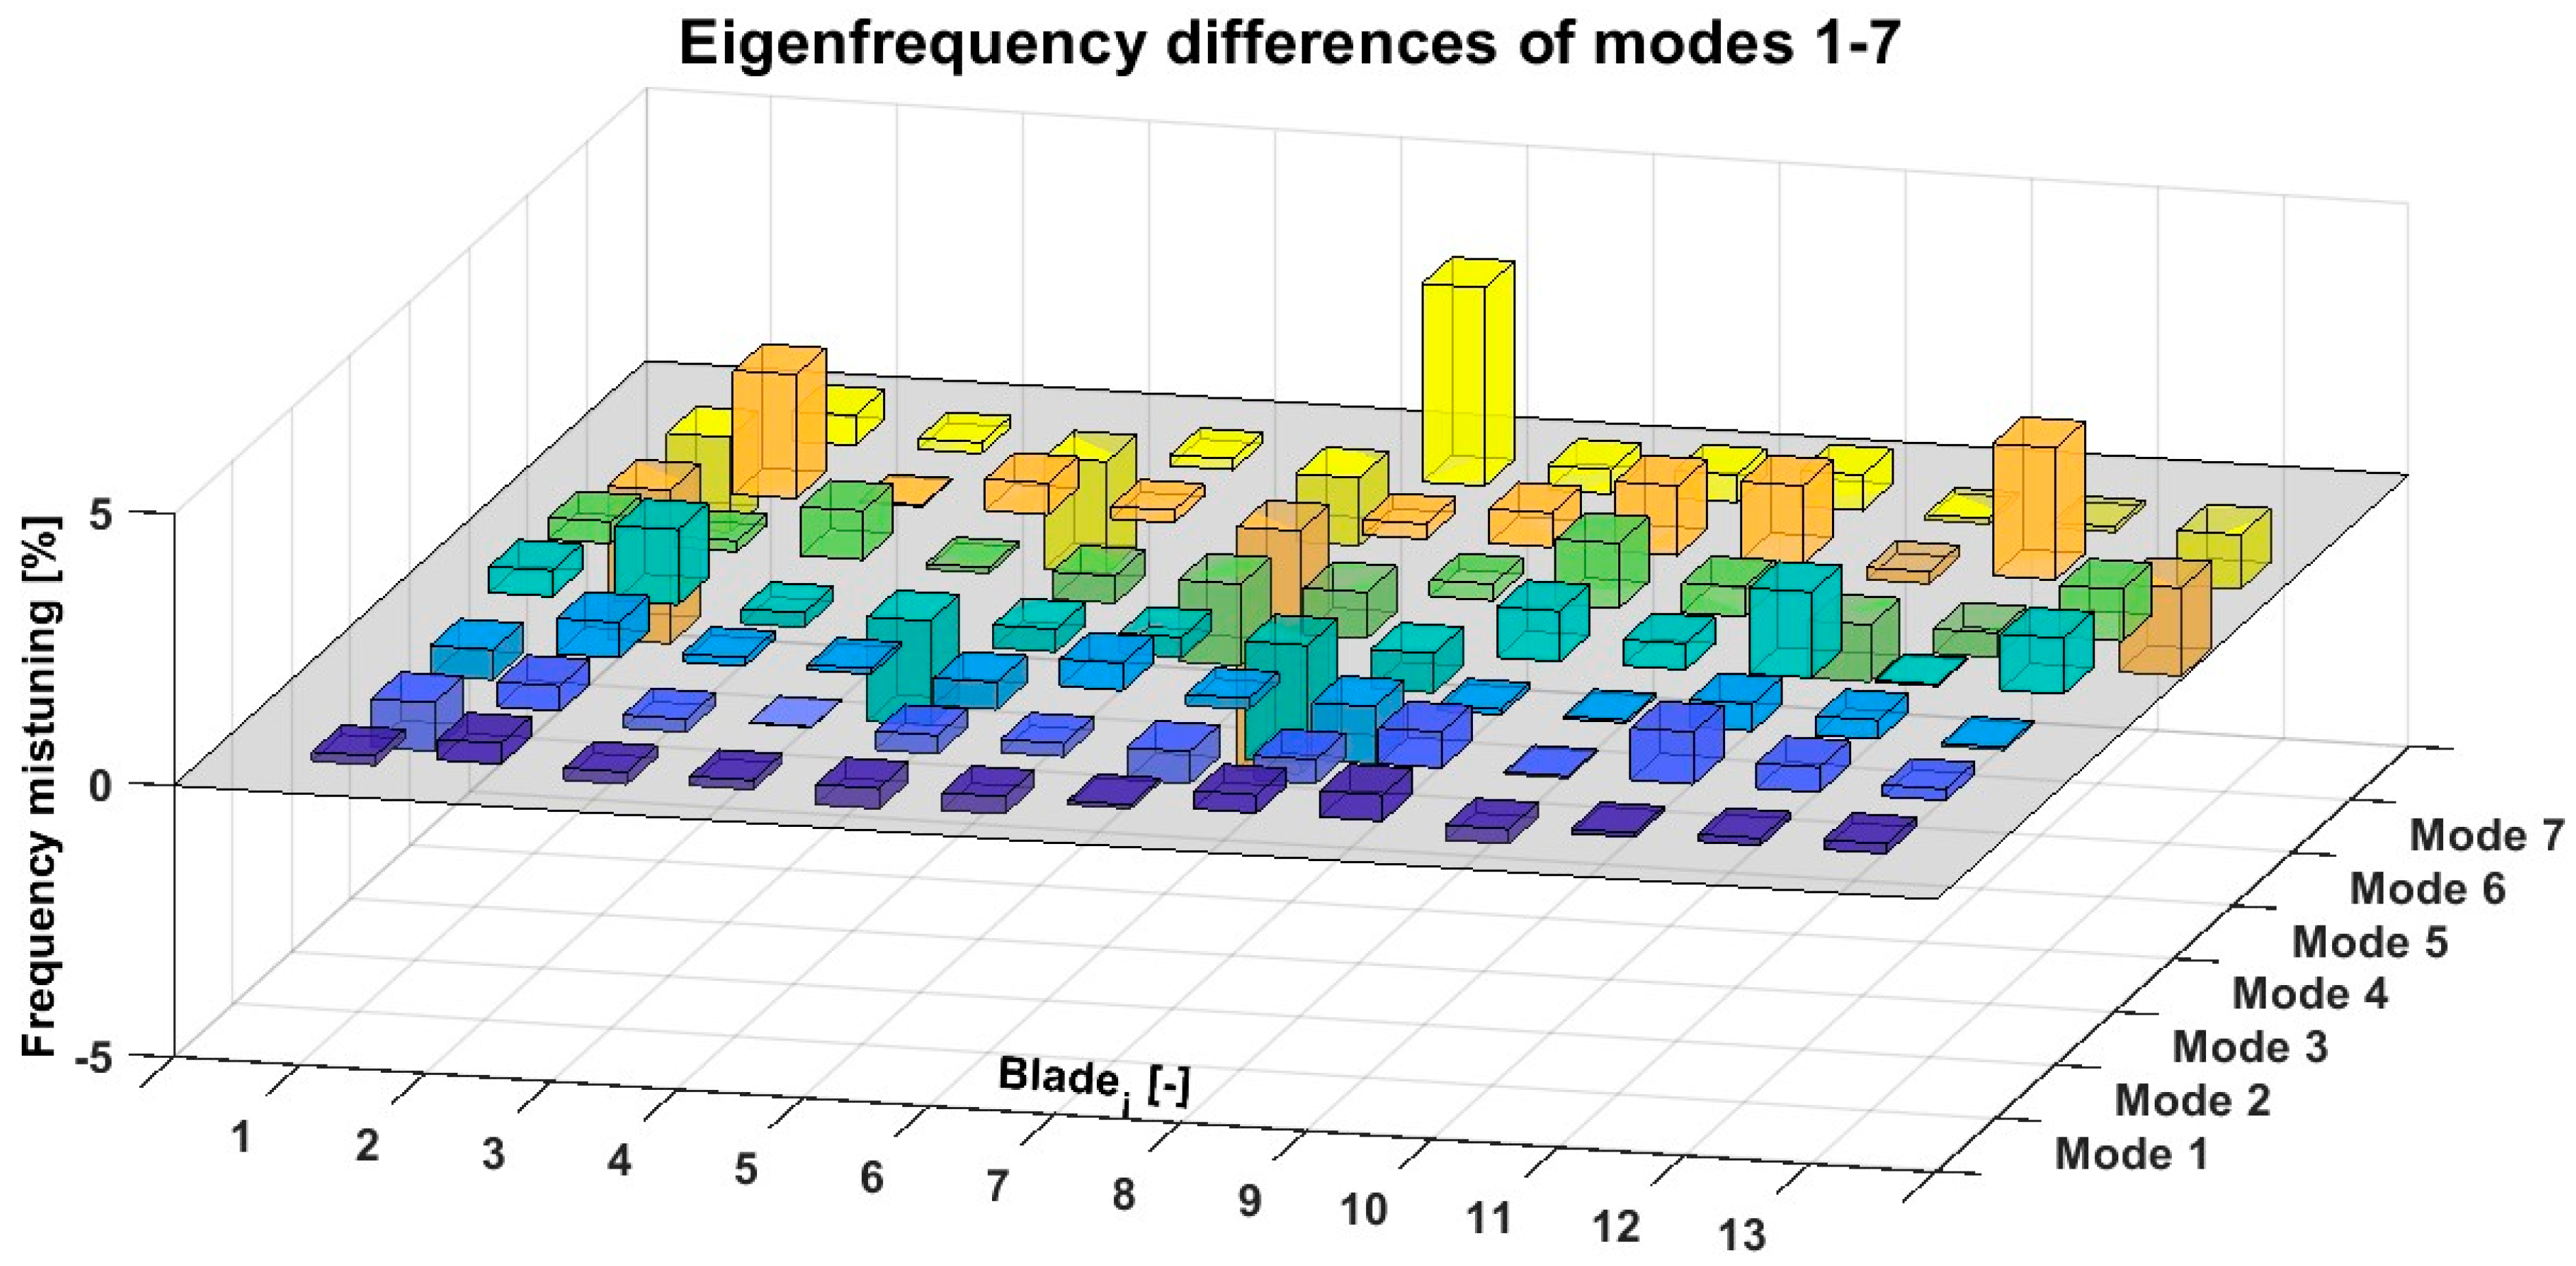
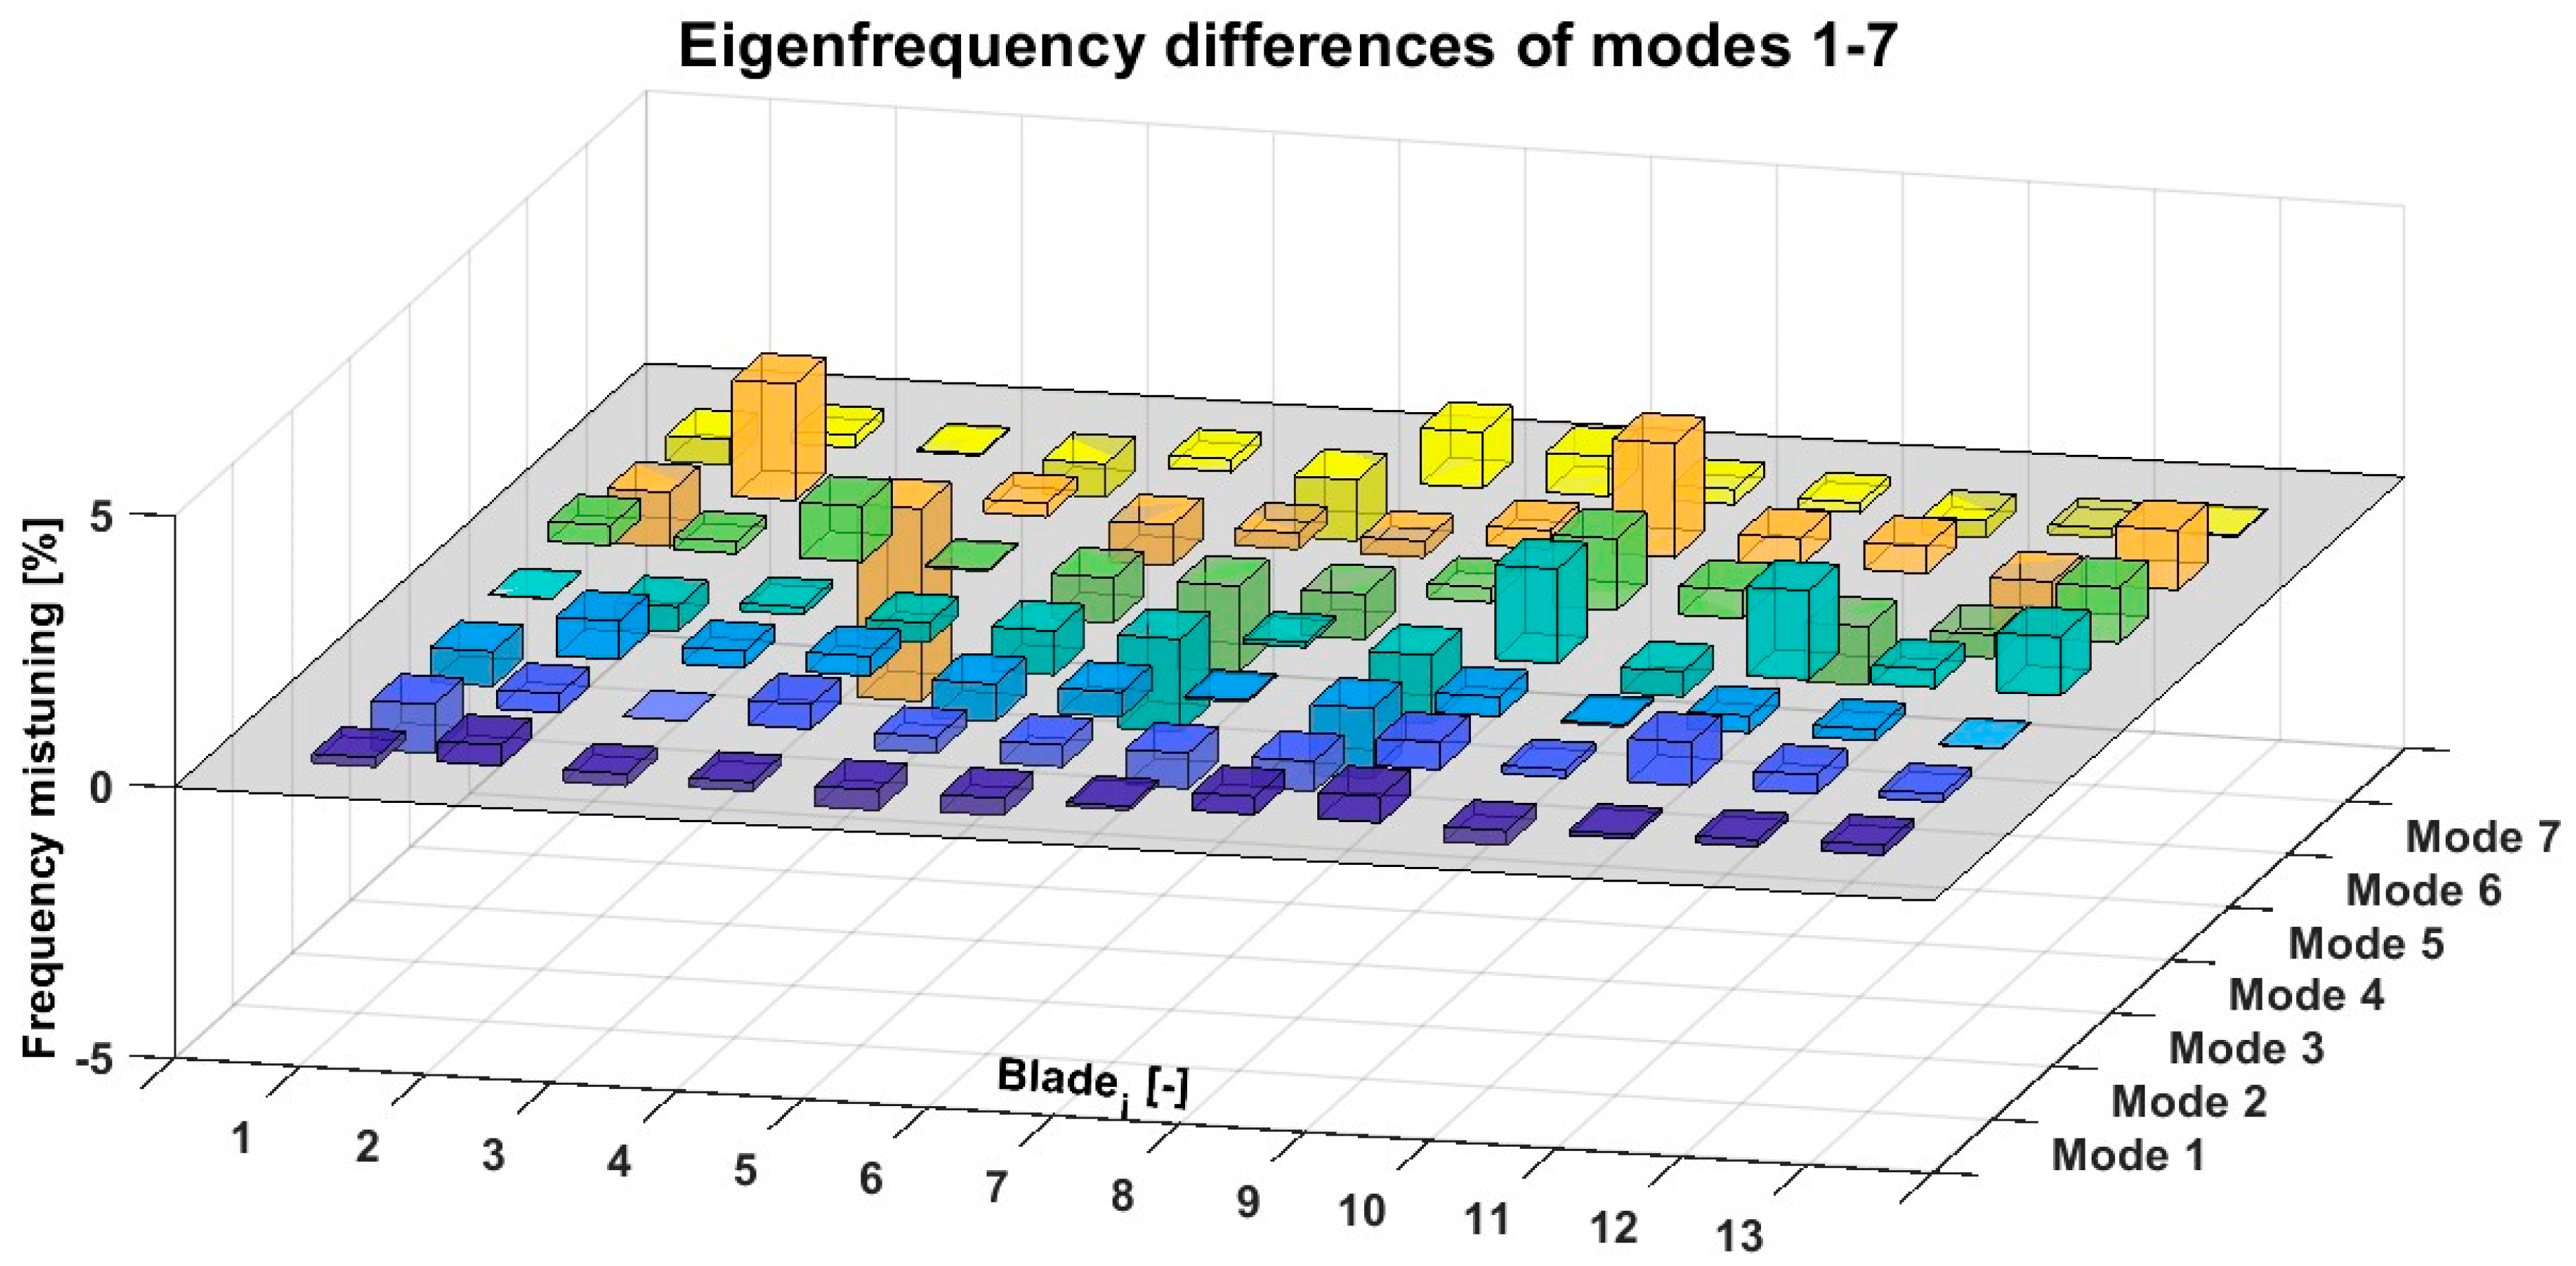
3.2. Measurement and Processing of Measured Data

The measuring chain comprises a Dytran modal hammer (Dytran Instruments Inc., Chatsworth, CA, USA), which generates excitation impulses that are subsequently captured by a POLYTEC Sensor Head OFV-505 (Polytec GmbH, Waldbronn, Germany) laser vibrometer. The vibrometer is connected via an OFV-5000 vibrometer (Polytec GmbH, Waldbronn, Germany) controller to an NI cDAQ-9179 (National Instruments, Austin, TX, USA) measurement centre, equipped with NI-9229 and NI-9234 modules. The measurement centre is linked to the computer through a USB interface. Generally, the device can record data with a high sampling rate. In the case of this measurement, the sampling rate was set to 50,000 Hz. In terms of the accuracy of the individual modules, the values for calibration every year at temperatures of 23 °C ± 5 °C for NI-9232 are “Percent of Reading (Gain Error)” 0.1% and “Offset (Percent of Range)” 0.023%, and for NI-9229 are “Percent of Reading (Gain Error)” 0.03% and “Offset (Percent of Range)” 0.008%. The Doppler laser vibrometer head was configured as per the data sheet instructions, with the laser beam precisely aimed at the blade tip, where reflective tape was applied. The vibrometer lens was positioned perpendicular to the blade surface at the prescribed distance.
The experiment was carried out as a standard experimental modal analysis, with the only distinction being the placement of the modal hammer within the aforementioned measuring device. This setup allowed for the automation of hammer strikes, as illustrated in Figure 10.
During the measurement process, the turbine rotor was positioned on a soft plastic tube with rubber ends. To ensure the response of the measured blade was not influenced by the oscillation of other blades, all blades were intentionally detuned by attaching weights of reasonable size [23]. These weights were glued to the tip of each blade using an adhesive with a consistency similar to beeswax.
Data collection was conducted using the LabView software (version 2024), with a specially compiled program for recording measurements. Once activated, the program facilitated the collection and storage of a 20 s measurement segment, during which multiple strikes with a modal hammer were made at the same blade location. The program was configured with a maximum sampling rate of 50 kHz, simultaneously recording the measured response from the laser vibrometer and the excitation pulse from the modal hammer sensor. This process was repeated for all turbine blades.
The data obtained were processed using the MATLAB software (version 2024). Initially, data from the LabView program were loaded and subsequently divided into individual quantities for plotting and further processing. A critical step before converting the data from the time domain to the frequency domain involved applying a weighting function in the time domain, specifically an exponential window (Figure 11).
As defined in the following equation:
y i = e ln f n 1 i ,   i = 1 n ,
the exponential window is characterised by the parameters f (the final value of the window), n (the sample count), and i (the function index).
In lightly damped blade systems, the structural response often extends beyond the data collection period, as illustrated in Figure 12 (TOP). Since the response does not diminish to near zero by the end of the time record, an exponential window is employed. This technique attenuates the signal towards the record’s conclusion, reducing it to approximately 1%. The resulting signal, as depicted in Figure 12 (BOTTOM), offers a more accurate representation of a transient event.
The data were analysed using a fast Fourier transform (FFT) algorithm in its complex form to determine the system’s transfer function. Specifically, an FFT analysis was applied to the impact force and its corresponding measured response. The transfer function was then derived by calculating the ratio of the system’s output to its input:
Y i = A B S F F T o u t F F T f o r c e ,   i = 1 n ,
The resulting FFT analysis produced complex vectors, namely FFTout from the response data and FFTforce from the force pulse data. These calculations were performed using complex arithmetic. Each turbocharger blade was measured five times to minimise potential errors. The data from these measurements were processed, resulting in five FFT spectra that were subsequently averaged. With a time window of 0.2 s, the FFT offered a frequency resolution of 5 Hz, ensuring an uncertainty of 2.5 Hz per spectral component, an accuracy entirely suitable for assessing turbine wheel mistuning.
For illustration, Figure 13 shows the transfer function of blade No. 1, where the mentioned appropriate weights were not placed on the other blades during the measurement. It is evident that, due to mistuning of the other blades, the natural frequency of the measured blade cannot be reliably evaluated. A significant difference occurs when suitable weights are applied to the unmeasured blades (Figure 14), making it possible to clearly associate individual peaks with the corresponding modal shapes of the blades.
The same process, i.e., a measurement with additional weights on the unmeasured blades, was repeated for all blades. The individual peaks in the transfer functions, as plotted in Figure 15, represent the natural frequencies of the respective blades.
Similarly, the results of the modal analysis of the same turbine wheel were evaluated using manual control of the modal hammer, as shown in Figure 16.

4. Discussion

Slight deviations in the transfer functions of individual blades can be observed. These discrepancies stem from minor variations in material and geometric properties, which arise due to manufacturing tolerances and material inhomogeneity. In real turbine wheels with an integrated design, such differences lead to small deviations in the modal properties of individual blades from their nominal values, commonly referred to as mistuning.
As a result, certain blades may experience significantly higher stress levels during operation than those calculated for an ideal rotor. Determining the extent of turbine wheel mistuning is only possible through an experimental modal analysis. This challenge inspired the improvement and acceleration of modal testing for rotors with an integrated design by developing and manufacturing a measuring device to guide a modal hammer, replacing manual hammer strikes.
The results of the turbine wheel experimental modal analysis show that the designed measuring device meets the set requirements for the accuracy and repeatability of the modal hammer strikes. The mistuning of adjacent blades is represented by the relative deviations in eigenfrequencies among all of the blades.
f i = f i f 0 f 0 ,   f 0 = 1 N j = 1 N f j
The blade mistuning results for the measured turbine wheel, obtained using the measuring device, are depicted in Figure 17, while those derived from a manual operation with a modal hammer are shown in Figure 18.
From the comparison of these two figures, noticeable differences are evident, with the only variation in the conducted measurements being the method of modal hammer operation. The processing and evaluation of the measured signals remained entirely consistent. The repeated measurements of the same turbine wheel using the measuring device yielded results that closely matched those shown in Figure 17. In contrast, the manual operation of the modal hammer resulted in statistically significant deviations compared to the results depicted in Figure 18. Similar findings were observed during measurements of various other turbine wheels of different sizes and designs, conducted using both methods. These results underscore that the manual operation of the modal hammer introduces significant inaccuracies in the modal analysis of turbine wheels. Consequently, replacing manual handling with an appropriate mechanical device is strongly recommended to ensure the repeatability of force impulses in both their timing and point of application.
The developed measuring device successfully automates the process of modal hammer strikes, ensuring consistent force and precise positioning for each impact. This automation not only significantly reduces the measurement time but also improves the accuracy of the results. With its ability to deliver reliable and repeatable excitation impulses, the device proves to be a valuable tool for analysing the dynamic properties and mistuning of turbocharger blade wheels.
The successful prototype testing highlights its potential for broader applications in industrial practice. Future enhancements should focus on optimising the design and integrating the device into comprehensive measurement systems. Moreover, exploring additional automation possibilities could further boost the efficiency and precision of the measurement process.

Author Contributions

Conceptualisation, O.K., V.P. and O.F.; methodology, O.K., S.S. and P.K.; software, P.K.; validation, V.P., P.K. and O.F.; formal analysis, S.S.; investigation, O.K. and P.K.; resources, O.F.; data curation, O.F.; writing—original draft preparation, O.K., P.K., O.F. and V.P.; writing—review and editing, P.K.; visualisation, S.S. and O.K.; supervision, V.P.; project administration, V.P. and S.S.; funding acquisition, V.P. All authors have read and agreed to the published version of the manuscript.

Funding

This publication was supported by the project “Innovative Technologies for Smart Low Emission Mobilities”, funded as project No. CZ.02.01.01/00/23_020/0008528 by the Programme Johannes Amos Comenius, call Intersectoral cooperation.

Data Availability Statement

Data available on request.

Acknowledgments

The authors thank Brno University of Technology for the support.

Conflicts of Interest

The authors declare no conflicts of interest.

Abbreviations

The following abbreviations are used in this manuscript:
FFTFast Fourier Transform
FRFFrequency Response Function

References

  1. Ewins, D.J. Modal Testing: Theory, Practice and Application, 2nd ed.; Wiley: Hoboken, NJ, USA, 2000; ISBN 978-0-863-80218-8. [Google Scholar]
  2. Zhao, J.; Experimental Modal Analysis Overview. Crystal Instruments. 2017. Available online: https://www.crystalinstruments.com/blog/2017/8/28/experimental-modal-analysis-overview (accessed on 28 January 2025).
  3. Feng, K.; Ji, J.C.; Ni, Q.; Beer, M. A review of vibration-based gear wear monitoring and prediction techniques. Mech. Syst. Signal Process. 2023, 182, 109605. [Google Scholar] [CrossRef]
  4. Qin, Y.; Tang, X.; Jia, T.; Duan, Z.; Zhang, J. Noise and vibration suppression in hybrid electric vehicles: State of the art and challenges. Renew. Sustain. Energy Rev. 2020, 124, 109782. [Google Scholar] [CrossRef]
  5. Moon, B.Y.; Cho, D.S. A study on vibration reduction by heat deformation of casting frame motor. J. Mech. Sci. Technol. 2022, 36, 1621–1630. [Google Scholar] [CrossRef]
  6. Qiang, L.; Jingxin, L.; Jing, M.; Dayong, G.; Jiaming, H. Structure design and vibration control of vibration reduction boring bar with variable damping. Int. J. Adv. Manuf. Technol. 2024, 134, 5301–5319. [Google Scholar] [CrossRef]
  7. You, X.; Feng, H.; Zhang, H.; Liu, P. Optimization analysis of vibration reduction for aeroengine multistage blade-disk system. J. Vibroeng. 2024, 26, 1547–1566. [Google Scholar] [CrossRef]
  8. Park, M.-H.; Yeo, S.; Choi, J.-H.; Lee, W.-J. Review of noise and vibration reduction technologies in marine machinery: Operational insights and engineering experience. Appl. Ocean Res. 2024, 152, 104195. [Google Scholar] [CrossRef]
  9. Haywood-Alexander, M.; Mills, R.S.; Champneys, M.D.; Jones, M.R.; Bonney, M.S. Full-scale modal testing of a Hawk T1A aircraft for benchmarking vibration-based methods. J. Sound Vib. 2024, 576, 118295. [Google Scholar] [CrossRef]
  10. Pais, T.; Silvestri, P. Full scale cruise ship dynamic identification using operational modal analysis on sea trial data measurements. Ocean Eng. 2024, 311, 118931. [Google Scholar] [CrossRef]
  11. Cai, J.; Ding, S.; Zhang, Q.; Liu, R.; Zeng, D.; Zhou, L. Broken Ice Circumferential Crack Estimation via Image Techniques. Ocean Engineering 2022, 259, 111735. [Google Scholar] [CrossRef]
  12. Zhi, S.; Wu, H.; Shen, H.; Wang, T.; Fu, H. Entropy-Aided Meshing-Order Modulation Analysis for Wind Turbine Planetary Gear Weak Fault Detection under Variable Rotational Speed. Entropy 2024, 26, 409. [Google Scholar] [CrossRef] [PubMed]
  13. Monka, P.; Monkova, K.; Uban, M.; Hruzik, L.; Vasina, M. Vibrodiagnostics as the tool of a tap wear monitoring. Procedia Struct. Integr. 2018, 13, 959–964. [Google Scholar] [CrossRef]
  14. Gatti, P.L. Experimental modal analysis. In Applied Structural and Mechanical Vibrations; CRC Press: London, UK, 1999. [Google Scholar]
  15. He, J.; Fu, Z.-F. Modal Analysis; Butterworth-Heinemann: Oxford, UK, 2001; ISBN 978-0-7506-5079-3. [Google Scholar] [CrossRef]
  16. Siemens. Modal Analysis: What Is Modal Analysis? 2025. Available online: https://www.sw.siemens.com/en-US/technology/modal-analysis/ (accessed on 21 February 2025).
  17. Píštěk, V.; Kučera, P.; Fomin, O.V.; Lovska, A. Effective Mistuning Identification Method of Integrated Bladed Discs of Marine Engine Turbochargers. J. Mar. Sci. Eng. 2020, 8, 379. [Google Scholar] [CrossRef]
  18. Ewins, D.J. Experimental Modal Analysis; Springer: London, UK, 2000; ISBN 978-1852334236. [Google Scholar]
  19. Blevins, R.D. Modal Testing: Theory, Practise and Application; Prentice Hall: Upper Saddle River, NJ, USA, 2001; ISBN 978-0750675991. [Google Scholar]
  20. Statham, G.E.M. Introduction to Experimental Modal Analysis and Testing; Prentice Hall: Upper Saddle River, NJ, USA, 2000; ISBN 978-0131048536. [Google Scholar]
  21. Shapiro, M.H. Vibration Testing: Theory and Practice; Wiley-Interscience: New York, NY, USA, 1993; ISBN 978-0471047890. [Google Scholar]
  22. Schenck, W.C.; Driscoll, G.B. Handbook of Experimental Structural Dynamics; ASME Press: New York, NY, USA, 1997; ISBN 978-0791802099. [Google Scholar]
  23. Kühhorn, A.; Beirow, B. Method for Determining Blade Mistuning on Integrally Manufactured Rotor Wheels. U.S. Patent 20,100,286,934 A1, 11 November 2010. [Google Scholar]
Figure 1. Principle of the experimental modal analysis.
Symmetry 17 00717 g001
Figure 2. Experimental modal analysis of a turbine wheel using hand-guided modal hammer excitation.
Symmetry 17 00717 g002
Figure 3. Signal measured by a force sensor at the tip of a modal hammer during multiple hand-guided strikes on a single turbine wheel blade.
Symmetry 17 00717 g003
Figure 4. First assembled prototype of the measuring device.
Symmetry 17 00717 g004
Figure 5. Force waveforms recorded during the operation of the modal hammer by the measuring device.
Symmetry 17 00717 g005
Figure 6. Incorrect triple and double strikes when manually operating the modal hammer.
Symmetry 17 00717 g006
Figure 7. Examples of force impulses of the modal hammer when using the measuring device (the figure on the right is a zoom of the figure on the left).
Symmetry 17 00717 g007
Figure 8. Details of the measuring device enhanced with a stepper motor for automated functionality.
Symmetry 17 00717 g008
Figure 9. Finite element model of the turbine wheel.
Symmetry 17 00717 g009
Figure 10. Experimental modal analysis of the turbine wheel performed using the measuring device (The turbine wheel blades are numbered).
Symmetry 17 00717 g010
Figure 11. Weighting function of the exponential window type.
Symmetry 17 00717 g011
Figure 12. Measured response signal of a lightly damped turbine blade under impact excitations, (TOP) original and (BOTTOM) modified, using the exponential window.
Symmetry 17 00717 g012
Figure 13. Natural frequencies from the FE model and the transfer function without additional weights.
Symmetry 17 00717 g013
Figure 14. Natural frequencies from the FE model and the transfer function with additional weights.
Symmetry 17 00717 g014
Figure 15. Comparison of measured transfer functions of individual turbine blades measured by the presented measuring device.
Symmetry 17 00717 g015
Figure 16. Comparison of measured transfer functions of individual turbine blades measured by a hand-guided modal hammer.
Symmetry 17 00717 g016
Figure 17. Eigenfrequency differences of modes 1–7 measured using the presented device.
Symmetry 17 00717 g017
Figure 18. Eigenfrequency differences of modes 1–7 measured with a hand-guided modal hammer.
Symmetry 17 00717 g018
Table 1. Computed natural frequencies of the turbine wheel blade section.
Mode [-]Frequency [Hz]
14075.7
27020.7
38556.3
410,664.0
511,831.0
614,548.0
716,108.0
Disclaimer/Publisher’s Note: The statements, opinions and data contained in all publications are solely those of the individual author(s) and contributor(s) and not of MDPI and/or the editor(s). MDPI and/or the editor(s) disclaim responsibility for any injury to people or property resulting from any ideas, methods, instructions or products referred to in the content.

