Article

Numerical Simulation of Principal Stress Axes Rotation in Clay with an Anisotropic Bounding Surface Model Incorporating a Relocatable Mapping Center

1
Department of Civil Engineering, Lishui University, Lishui 323000, China
2
Faculty of Science and Engineering, University of Nottingham Ningbo, Ningbo 315100, China
*
Author to whom correspondence should be addressed.
Symmetry 2025, 17(10), 1741; https://doi.org/10.3390/sym17101741
Submission received: 2 September 2025 / Revised: 7 October 2025 / Accepted: 13 October 2025 / Published: 15 October 2025
(This article belongs to the Special Issue Asymmetry and Symmetry in Infrastructure)

Abstract

In engineering practice, soils will inevitably experience some rotation of principal stress directions. Recent experimental evidence has highlighted how principal stress axes rotation significantly impacts clay behavior. However, most existing constitutive models accounting for this effect are essentially designed for sand and may not be applicable to clays. This paper introduces an anisotropic bounding surface model to reproduce the response of clay to principal stress axes rotation. The model’s key innovation lies in its incorporation of a secondary mapping procedure in the deviatoric stress ratio plane, which utilizes a relocatable mapping center. This step is a complement to the conventional radial mapping procedure in the meridional plane, which utilizes a fixed mapping center. This constitutive enhancement facilitates the precise modeling of plastic deformation triggered by the rotation of principal stress axes, without introducing additional loading mechanisms or incremental stress–strain nonlinearity. The performance of the model is first evaluated under various conditions and then verified through comparisons between simulation results and experimental data. The results demonstrate the effectiveness of the model and underscore the necessity of incorporating stress rotation effects into the constitutive modeling of clay.

1. Introduction

Soils in engineering practice are frequently subjected to rotation of principal stress directions, in addition to variations in the magnitudes of these principal stresses. Principal stress axes rotation can arise from simple static problems, such as strip footing settlement, or complex dynamic problems, such as loading from waves or earthquakes. Extensive experimental investigations conducted over recent decades have revealed the significant role of principal stress axes rotation in governing soil behavior. For instance, Arthur and coworkers [1,2] conducted directional shear cell tests, finding that rotation of principal stress axes alone (without changes in principal stress magnitudes) could induce substantial plastic deformation and volumetric compression in both loose and dense sands. It should be noted that Arthur’s work has been somewhat questioned because of the low confining stress limits of the testing device used. Nevertheless, liquefaction has also been observed in sand torsional shearing tests [3,4,5,6] using a hollow cylindrical apparatus (HCA) with confining stresses up to 300 kPa, due to cyclic rotation of the principal stress axes. Similar phenomena were identified by Tong et al. [7] and Yu et al. [8], who performed stress axes rotations in a drained cyclic manner. Micro-mechanical studies have also confirmed the important role of principal stress axes rotation in driving soil deformation [9,10,11,12]. In addition to these investigations on sands, experimental studies on principal stress axes rotation for clay have been performed [13,14,15,16,17,18,19]. These studies consistently reported that continuous rotation of the principal stress axes induces considerable plastic strains and marked degradation in clay.
Several constitutive models have been proposed to properly account for principal stress axes rotation in numerical simulation. Within the classical elastoplasticity framework, a stress path of pure rotation of the principal axes corresponds to a fixed point in the stress-invariant space, and consequently, it does not initiate plastic deformation. To address this issue, Tsutsumi and Hashiguchi [20] introduced an additional tangential loading mechanism into their subloading surface model. Afterwards, more attempts were made to extend the capability of the tangential loading models [21,22,23]. A discussion on the applicability of the tangential loading mechanism on the stress rotation problems can be found in the work of Lu [24]; it is also noted that the main limitation of these models is the exclusion of the volumetric strain from the new mechanism in order to maintain incremental stress–strain linearity. This simplification, however, is inconsistent with experimental observation. In addition, the implementation of a new mechanism often involves arbitrary assumptions for its constituents, which are physically ambiguous and challenging to calibrate. Alternatively, Pande and Sharma [25] and Neher et al. [26] suggested using multi-laminate models to simulate principal stress axes rotation; however, such models have only been validated qualitatively and not in practice.
Additionally, a number of incremental nonlinear models have been proposed [27,28,29,30,31,32,33,34]. These models are comprehensive and versatile, but their application has proven difficult due to their incrementally nonlinear properties. Gutierrez et al. [35] proposed a relatively simple incrementally nonlinear model, although its application is limited to two-dimensional analysis. Further consideration for three-dimensional situations was conducted by Lashkari and Latifi [36], Papadimitriou et al. [37], and Wang et al. [38]. Ueda and Iai [39] also incorporated inherent fabric anisotropy into their strain space model. Moreover, Yang and coworkers [40,41] revised the SANISAND model to consider the stress axes rotation. In their model, the stress rate is decomposed into a rotational part and a non-rotational part, and plastic strain is computed separately for each part. Petalas et al. [42] also developed a refined SANISAND model incorporating anisotropic critical state theory [43]; the novel feature of this model is the explicit dependence of the dilatancy and plastic modulus on the ensuing non-coaxiality (the noncoincidence between principal directions of stress and plastic strain rate). Some successful attempts were made by considering the fabric effect, especially the evolution of fabric with reference to the direction of loading [38,44,45,46], but these models are somewhat complex in terms of the formulations. Lu et al. [47] followed the lines of the tangential loading mechanism and moreover considered plastic volumetric strain in their model. This model was successfully applied to the simulation of clay simple shear tests. Tian and Yao [48] proposed a model that is manipulated in a transformed stress space, in which the rotational shear stress path is associated with varying stress magnitudes, thereby enabling the initiation of plastic loading. Most recently, Du et al. [49,50] employed a non-coaxial flow rule based on the work by Qian et al. [22] and Li and Dafalias [51] and applied their model to simulate clay under traffic loading.
Most of the aforementioned models, with a few exceptions, were designated for sand simulation. Therefore, to properly simulate the influence of principal stress axes rotation on clay, a new bounding surface plasticity model is proposed in this study. This model can simulate the response of clay under principal stress axes rotation without introducing additional loading mechanisms or incremental nonlinearity. The model formulation is straightforward, and the material constants are easy to calibrate. Comparisons between simulations and experimental data are presented to comprehensively validate the proposed model.

2. Model Formulations

Within the framework of elastoplasticity, the total strain rate ε ˙ is decomposed additively into an elastic and plastic parts:
ε ˙ = ε ˙ e + ε ˙ p
Here, the superscripts e and p correspond to the elastic and plastic constituents of the strain rate, respectively. By denoting the deviatoric strain as e , the volumetric strain as ε v , the deviatoric stress as s , and the mean stress as p , the elastic relation of the soil can be described as
ε ˙ e = e ˙ e + ε ˙ υ e 3 I = s ˙ 2 G + p ˙ 3 K I
K = 1 + e κ p ;   G = 3 ( 1 2 υ ) 2 ( 1 + υ ) K
where I is the second-order identity tensor, e denotes the void ratio, κ is the slope of the swelling/recompression line in the e − lnp plane, and υ represents Poisson’s ratio. The plastic strain rate is generally expressed as
ε ˙ p = Λ R
Λ = 1 K p L : σ ˙
where are the Macaulay brackets, Λ is the loading index, K p denotes the plastic modulus, L denotes the loading direction, and R denotes the flow direction. The specific forms for K p , L , and R will be outlined in the subsequent sections.

2.1. Bounding Surface

The bounding surface in the p-q space (where q is the deviatoric stress) is defined as an inclined ellipse, as illustrated in Figure 1. The analytical expression for the bounding surface, adopting the formulation proposed by Dafalias [52], is given as
F = ( q ¯ p ¯ α ) 2 M 2 α 2 p ¯ p 0 p ¯ = 0
q ¯ = 3 2 s ¯   : s ¯   ;     α = 3 2 α : α
In the above equations, p 0 is the isotropic hardening parameter and α is the anisotropic hardening parameter. A bar symbol above a stress quantity indicates its association with the bounding or “image” stress state σ ¯ residing on the bounding surface. The bounding surface is inclined at the slope α , which is also a phenomenological representation of soil anisotropy. The parameter M is the stress ratio at critical state; it is dependent on the Lode angle θ ¯ α , as described in [53,54]. However, to ensure continuity of the bounding surface near the hydrostatic axis, particularly when considering the anisotropic tensor α , the Lode angle must be defined with reference to s ¯ p ¯ α rather than s ¯ . Thus,
M = M c 2 c 4 1 + c 4 1 c 4 s i n 3 θ ¯ α 1 / 4
θ ¯ α = 1 3 s i n 1 ( 27 2 J ¯ 3 α q ¯ α 3 )
s ¯ α = s ¯ p ¯ α ;     q ¯ α = 3 2 s ¯ α : s ¯ α ;     J ¯ 3 α = 1 3 s ¯ α 3
where c = M e / M c with M e and M c denoting the values of M under triaxial extension and compression conditions, respectively. Equation (8) is convex for c ≥ 0.6, or equivalently φ ≤ 48.6° (φ is the friction angle). This range encompasses the majority of soil types.

2.2. Hardening Rules

The model incorporates two hardening mechanisms: isotropic hardening and rotational (anisotropic) hardening. The isotropic hardening, which prescribes the evolution of p 0 , follows the volumetric hardening rule of Modified Cam Clay [55]:
p ˙ 0 =   ( 1 + e ) p 0 λ κ ε ˙ υ p
where λ is the slope of the virgin compression line in e − lnp space and ε ˙ υ p is the plastic volumetric strain rate.
The rotational hardening, governing the evolution of α , follows Wheeler et al. [56]:
α ˙ =   μ 3 s ¯ 4 p ¯ α ε ˙ υ p + ω ( s ¯ 3 p ¯ α ) ε ˙ q p
where µ and ω are model constants, ε ˙ q p   =   ( 2 / 3 ) e ˙ p : e ˙ p represents the plastic distortional strain rate, and | | denote the modulus. This rule concurrently captures the evolution of soil anisotropy driven by both plastic volumetric and distortional straining.
The initial value of α can be determined by assuming a K0 consolidation history for the soil [56,57]. Under this condition, a relationship exists where ε ˙ q / ε ˙ υ = 2 / 3 . Using this relation alongside the plastic dilatancy relation
ε ˙ υ p ε ˙ q p = M 2 η 2 2 ( η α )
where η = q / p is the stress ratio, and including the elastic strain, one obtains the value of α at the K0 condition:
α K 0 =   η K 0 2 + 3 1 ( κ / λ ) η K 0 M c 2 3 1 ( κ / λ )
Here, η K 0 represents the stress ratio under the K0 condition, given by η K 0 = 3 ( 1 K 0 ) / ( 1 + 2 K 0 ) . If measured data is unavailable, the K0 value can be estimated using Jaky’s formula. The multiaxial tensor-valued α is then initialized by exploiting its deviatoric nature and the correlation with its triaxial scalar-valued counterpart α , yielding
α 1 = 2 3 α K 0 ; α 2 = α 3 = 1 3 α K 0  
In this equation, α 1,2 , 3 are the principal values of α . Under the K0 condition, the principal directions align with the coordinate axes, and all shear components are zero; thus, the tensor α is fully defined by these three principal values.

2.3. Mapping Rules

In bounding surface plasticity, a mapping rule uniquely relates the current stress point σ to a bounding or “image” stress point on the bounding surface. This paper employs a deliberately designed two-step mapping rule. The first step utilizes a fixed mapping center and is performed within the meridional plane (a plane of constant Lode angle). The second step utilizes a relocatable mapping center and is performed within the deviatoric stress ratio plane.

2.3.1. First Step of Mapping in the Meridional Plane

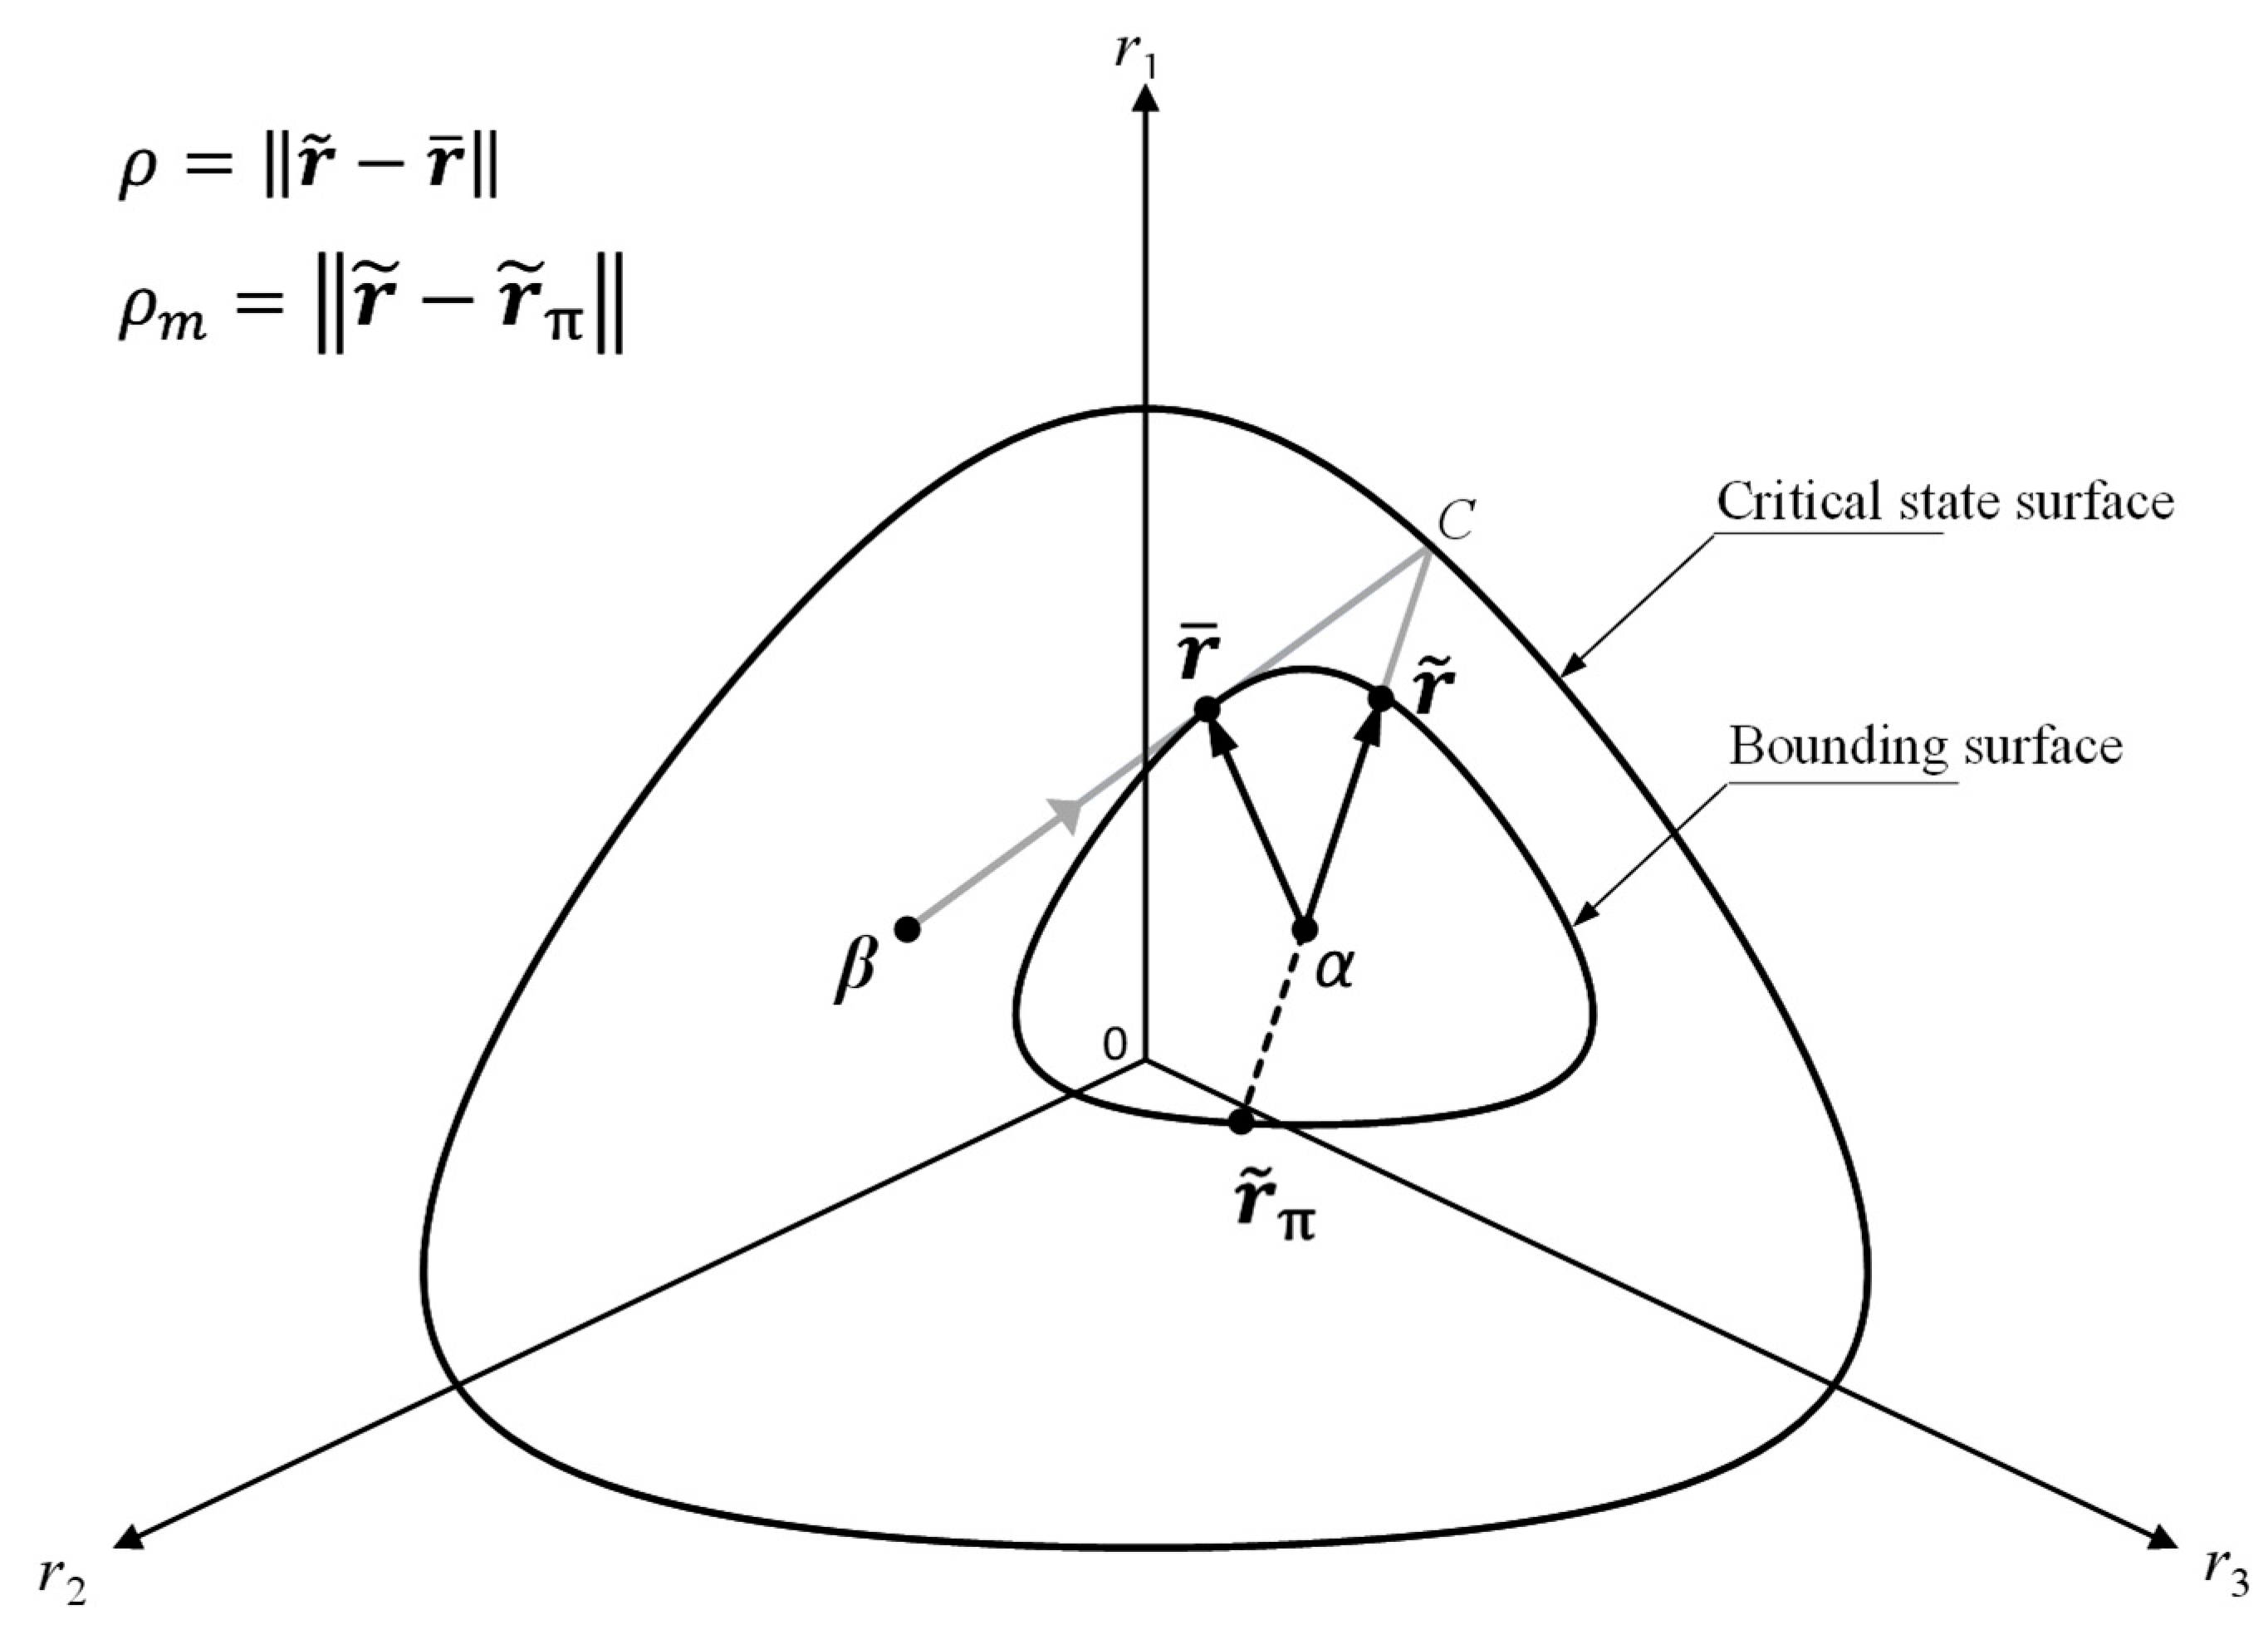
The first mapping step adheres to the conventional radial mapping approach within the meridional plane, wherein the mapping center is conveniently fixed at the origin. Figure 1 depicts this mapping step. The bounding stress point σ ¯ is determined as
σ ¯ = b σ
Here, b is known as the similarity ratio; its value can be easily solved by combining Equations (16) and (6). Note that σ ¯ is proportional to the current stress σ .
It must be noted that in the proposed model, σ ¯ is not the ultimate bounding stress point. In fact, it serves as an intermediate variable to define the ultimate bounding state and the plastic flow direction, which will be discussed later in more detail.

2.3.2. Second Step of Mapping in the Deviatoric Stress Ratio Plane

For non-proportional loading, such as the case of principal stress axes rotation, a loading direction L defined solely based on the outward normal to the bounding surface at σ ¯ generally fails to replicate the plastic deformation induced by stress rotation. To address this limitation, a second mapping step is introduced to identify an additional stress point, which will coincide with σ ¯ under proportional loading but diverges from it under non-proportional loading involving principal stress axes rotation.
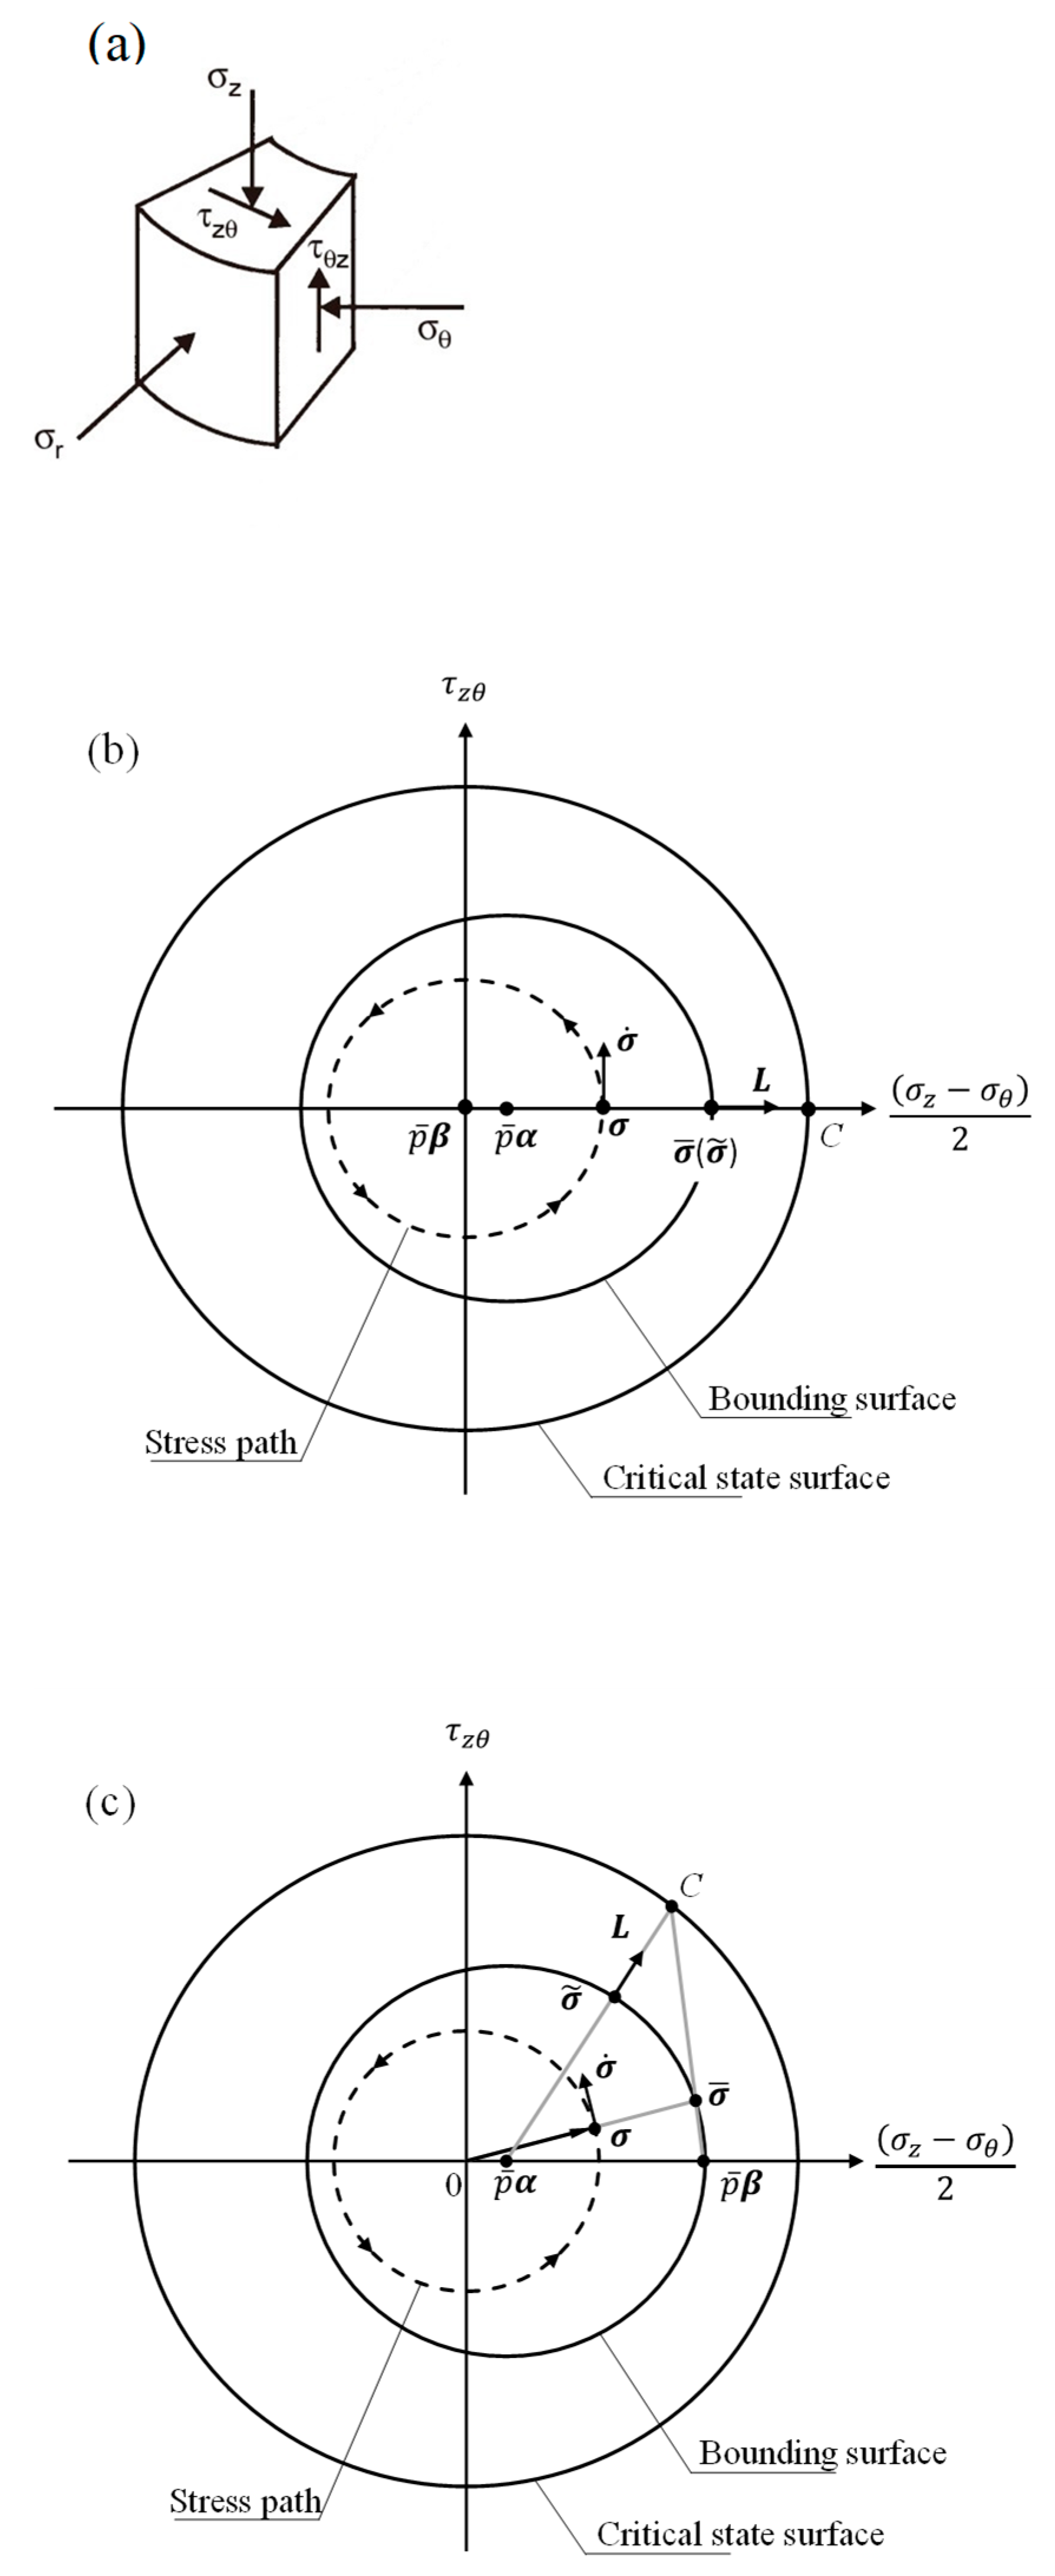
Consider a deviatoric plane passing through σ ¯ (the vertical dashed line in Figure 1); for clarity, the axes of this plane are normalized by p ¯ , resulting in the deviatoric stress ratio plane illustrated in Figure 2. All quantities plotted in this plane are stress ratios, sharing the same mean stress p ¯ . The stress point σ ¯ is now represented by the point r ¯ = σ ¯ / p ¯ in this plane. The critical state surface and the corresponding cross-section of the bounding surface possess the same non-circular shape in this plane. The critical state surface is centered at the origin, while the bounding surface is centered at α , with its size depending on p ¯ . The second mapping step, performed within this deviatoric stress ratio plane, is also radial mapping but utilizes a relocatable mapping center β . If the loading is virgin (i.e., no prior loading/unloading cycles), one can initially place β at the origin. Then, during later loading procedures, whenever unloading is detected, i.e., Λ ≤ 0, the mapping center β is translated to the position of r ¯ at the onset of unloading. The evolution of β can be summarized as
β n + 1 = β n         i f   Λ > 0 r ¯ n         i f   Λ 0
where the subscripts n and n + 1 refer to the current and subsequent loading steps, respectively.
With the position of β determined, the second mapping is performed as follows:
(1)
In Figure 2, draw a straight line from β through r ¯ to locate the point of intersection with the critical state surface, denoted as point C;
(2)
Link the back stress ratio α and point C to find the point of intersection with the bounding surface, denoted as r ~ in Figure 2.
Note that r ~ is the projection of the ultimate bounding stress σ ~ on this deviatoric plane. Thus, the complete expression for the ultimate bounding stress is
σ ~ = ( r ~ + I ) p ¯  
For a given β , as r ¯ approaches the critical state, r ~ converges to r ¯ . When r ¯ reaches the critical state surface, one has r ~ = r ¯ regardless of the position of β .
A computational consideration arises for stress states on the “dry” side of the critical state. Under such conditions, r ¯ lies outside the critical state surface, complicating the determination of the intersection point C, and consequently r ~ . While the proposed model is not intended for stress states on the “dry” side, computational stability necessitates handling such cases carefully as they might occur locally in the boundary value problem analysis. This can be addressed by reverting to the first mapping results, setting σ ~ = σ ¯ when the condition M r ¯ ( 3 / 2 ) r ¯ : r ¯ 0 is met. Here, M r ¯ is evaluated at the Lode angle of r ¯ , not r ¯ α . This approach implies that the second mapping is effective only for the “wet” side stress states, while for the “dry” side, the model defaults to conventional bounding surface clay models. This feature is sufficient for the current modeling purpose.
It should be noted that the relocation of the mapping center in this model occurs exclusively within the deviatoric plane, distinguishing it from some other mapping rules in the literature [58,59,60] where translation in the meridional plane is also allowed. Allowing meridional translation of the mapping center is unsuitable for the present study. For example, in an undrained test of principal stress axes rotation, the effective stress path would be a horizontal line shifting leftwards in Figure 1 as the deviator stress q is constant and the mean effective stress decreases due to excess pore pressure generation. Allowing the mapping center to translate within this meridional plane could cause it to migrate to the right end of the stress path. As a result, the “image” point determined relative to such a translated center would lie on the “dry” side of the critical state. As has been discussed above, including such features is outside the scope of the current study.

2.4. Loading Direction and Flow Direction

In this model, the loading direction L and flow direction R are defined as follows:
L =   F σ ~
R = z F σ ¯ + ( 1 z ) F σ ~
Here, F / σ ¯ and F / σ ~ are the bounding surface derivatives evaluated at σ ¯ and σ ~ , respectively. The flow direction R is an interpolation between F / σ ¯ and F / σ ~ , with the interpolation parameter z ranging from 0 to 1. Note that the loading direction L is not interpolated to avoid ambiguity in the loading/unloading determination.
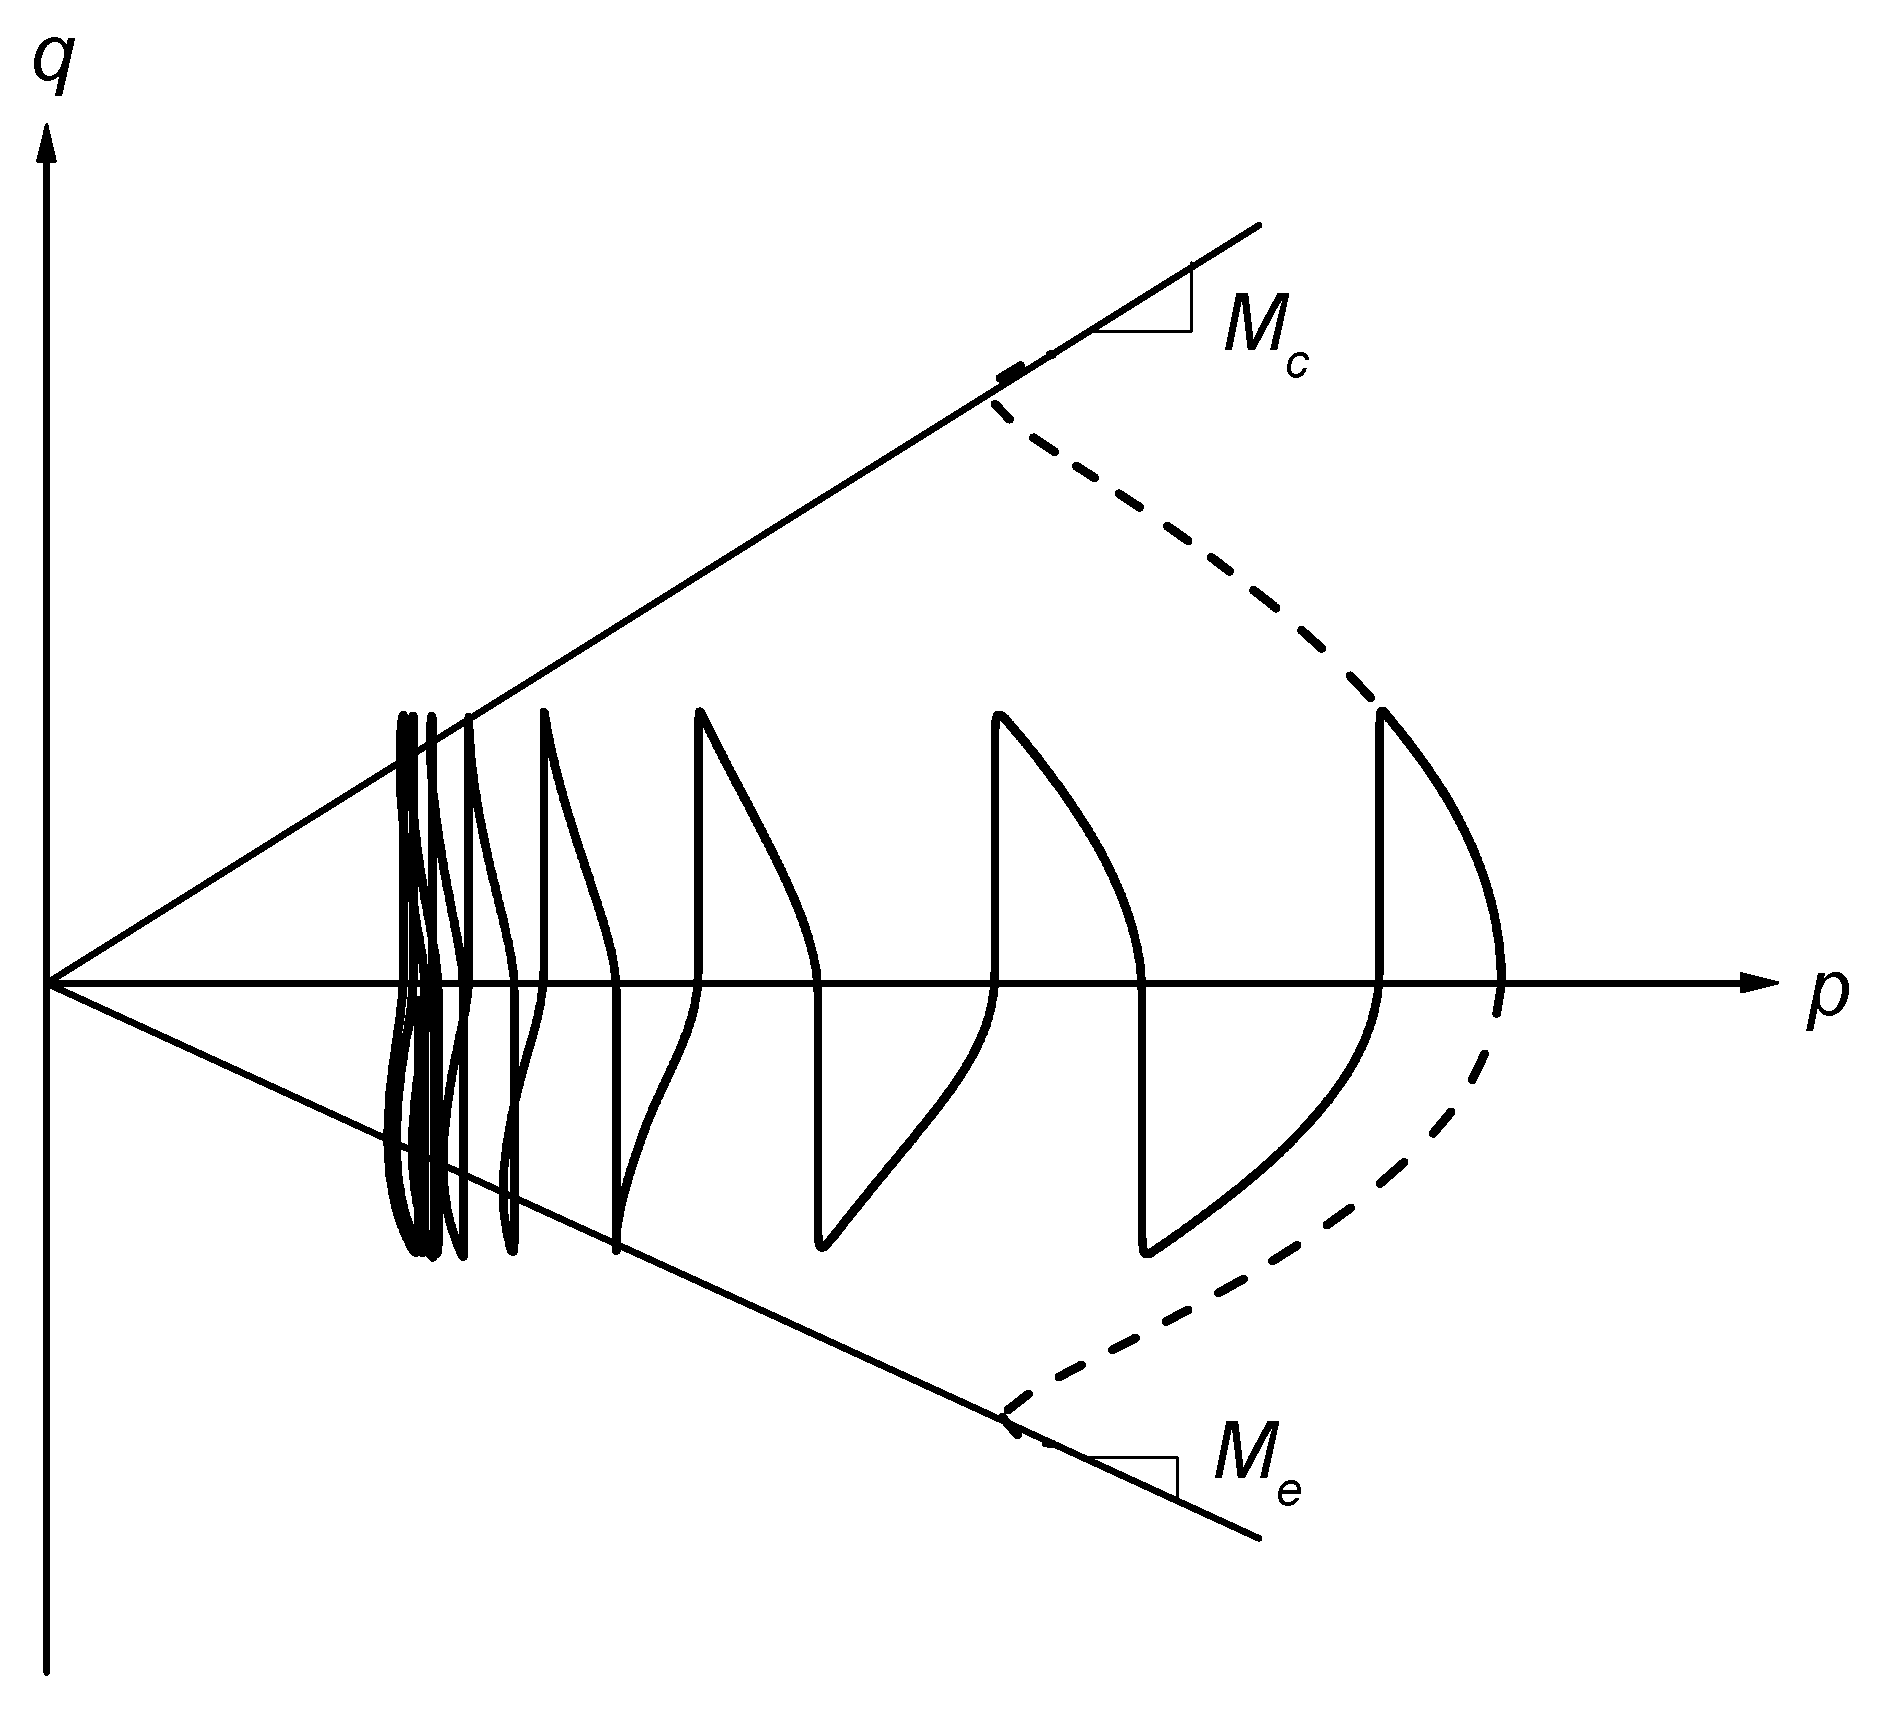
The effectiveness of Equation (19) under principal stress axes rotation can be examined in Figure 3. To facilitate the analysis, the stress component definitions of the hollow cylindrical apparatus (HCA) are employed, as illustrated in Figure 3a. The stress path corresponding to pure principal stress axes rotation is represented by the dashed circle in the ( σ z σ θ ) / 2 ~ τ z θ plane, as illustrated in Figure 3b. By assuming that β is initially at the origin and σ is on the horizontal axis, one can see from Figure 3b that the loading direction L is orthogonal to σ ˙ , resulting in Λ = 0. According to Equation (17), p ¯ β is relocated to the current position of p ¯ r ¯   =   σ ¯ , as depicted in Figure 3c. In this figure, σ has moved slightly above the horizontal axis following the previous loading step. In this scenario, the loading direction L is generally not orthogonal to the stress rate σ ˙ . Consequently, plastic loading is induced by the rotation of principal stress axes. Note that this discussion is limited to the “wet” side stress states, and the resulting flow rule must be volumetrically contractive.

2.5. Plastic Modulus

In bounding surface plasticity, the plastic modulus K p is dependent on the distance between the current and bounding stress states. In the proposed model, two distance measurements are considered: the distance between σ and σ ¯ (Figure 1) and the distance between σ ¯ and σ ~ (or r ¯ and r ~ , Figure 2). Thus, the following form for K p is proposed:
K p = K ~ p + 1 + e λ κ p a R : R h ¯ δ δ m δ + h ~ ( ρ ρ m ρ )
K ~ p = F q n : r n
δ = σ ¯ σ ;       δ m = σ ¯ ;       ρ = r ~ r ¯ ;       ρ m = r ~ r ~ π
Here, K ~ p is the bounding plastic modulus evaluated at σ ~ ; q n denotes the set of plastic internal variables ( p 0 and α in this case); r n represents the “direction” of q ˙ n , which can be easily derived from the hardening rules Equations (11) and (12); p a is the atmospheric pressure; h ¯ and h ~ are model parameters controlling stiffness degradation; δ m and ρ m are two reference distances as shown in Figure 1 and Figure 2, respectively; and r ~ π is the point “opposite” to r ~ on the bounding surface, along the projection line from r ~ through α .
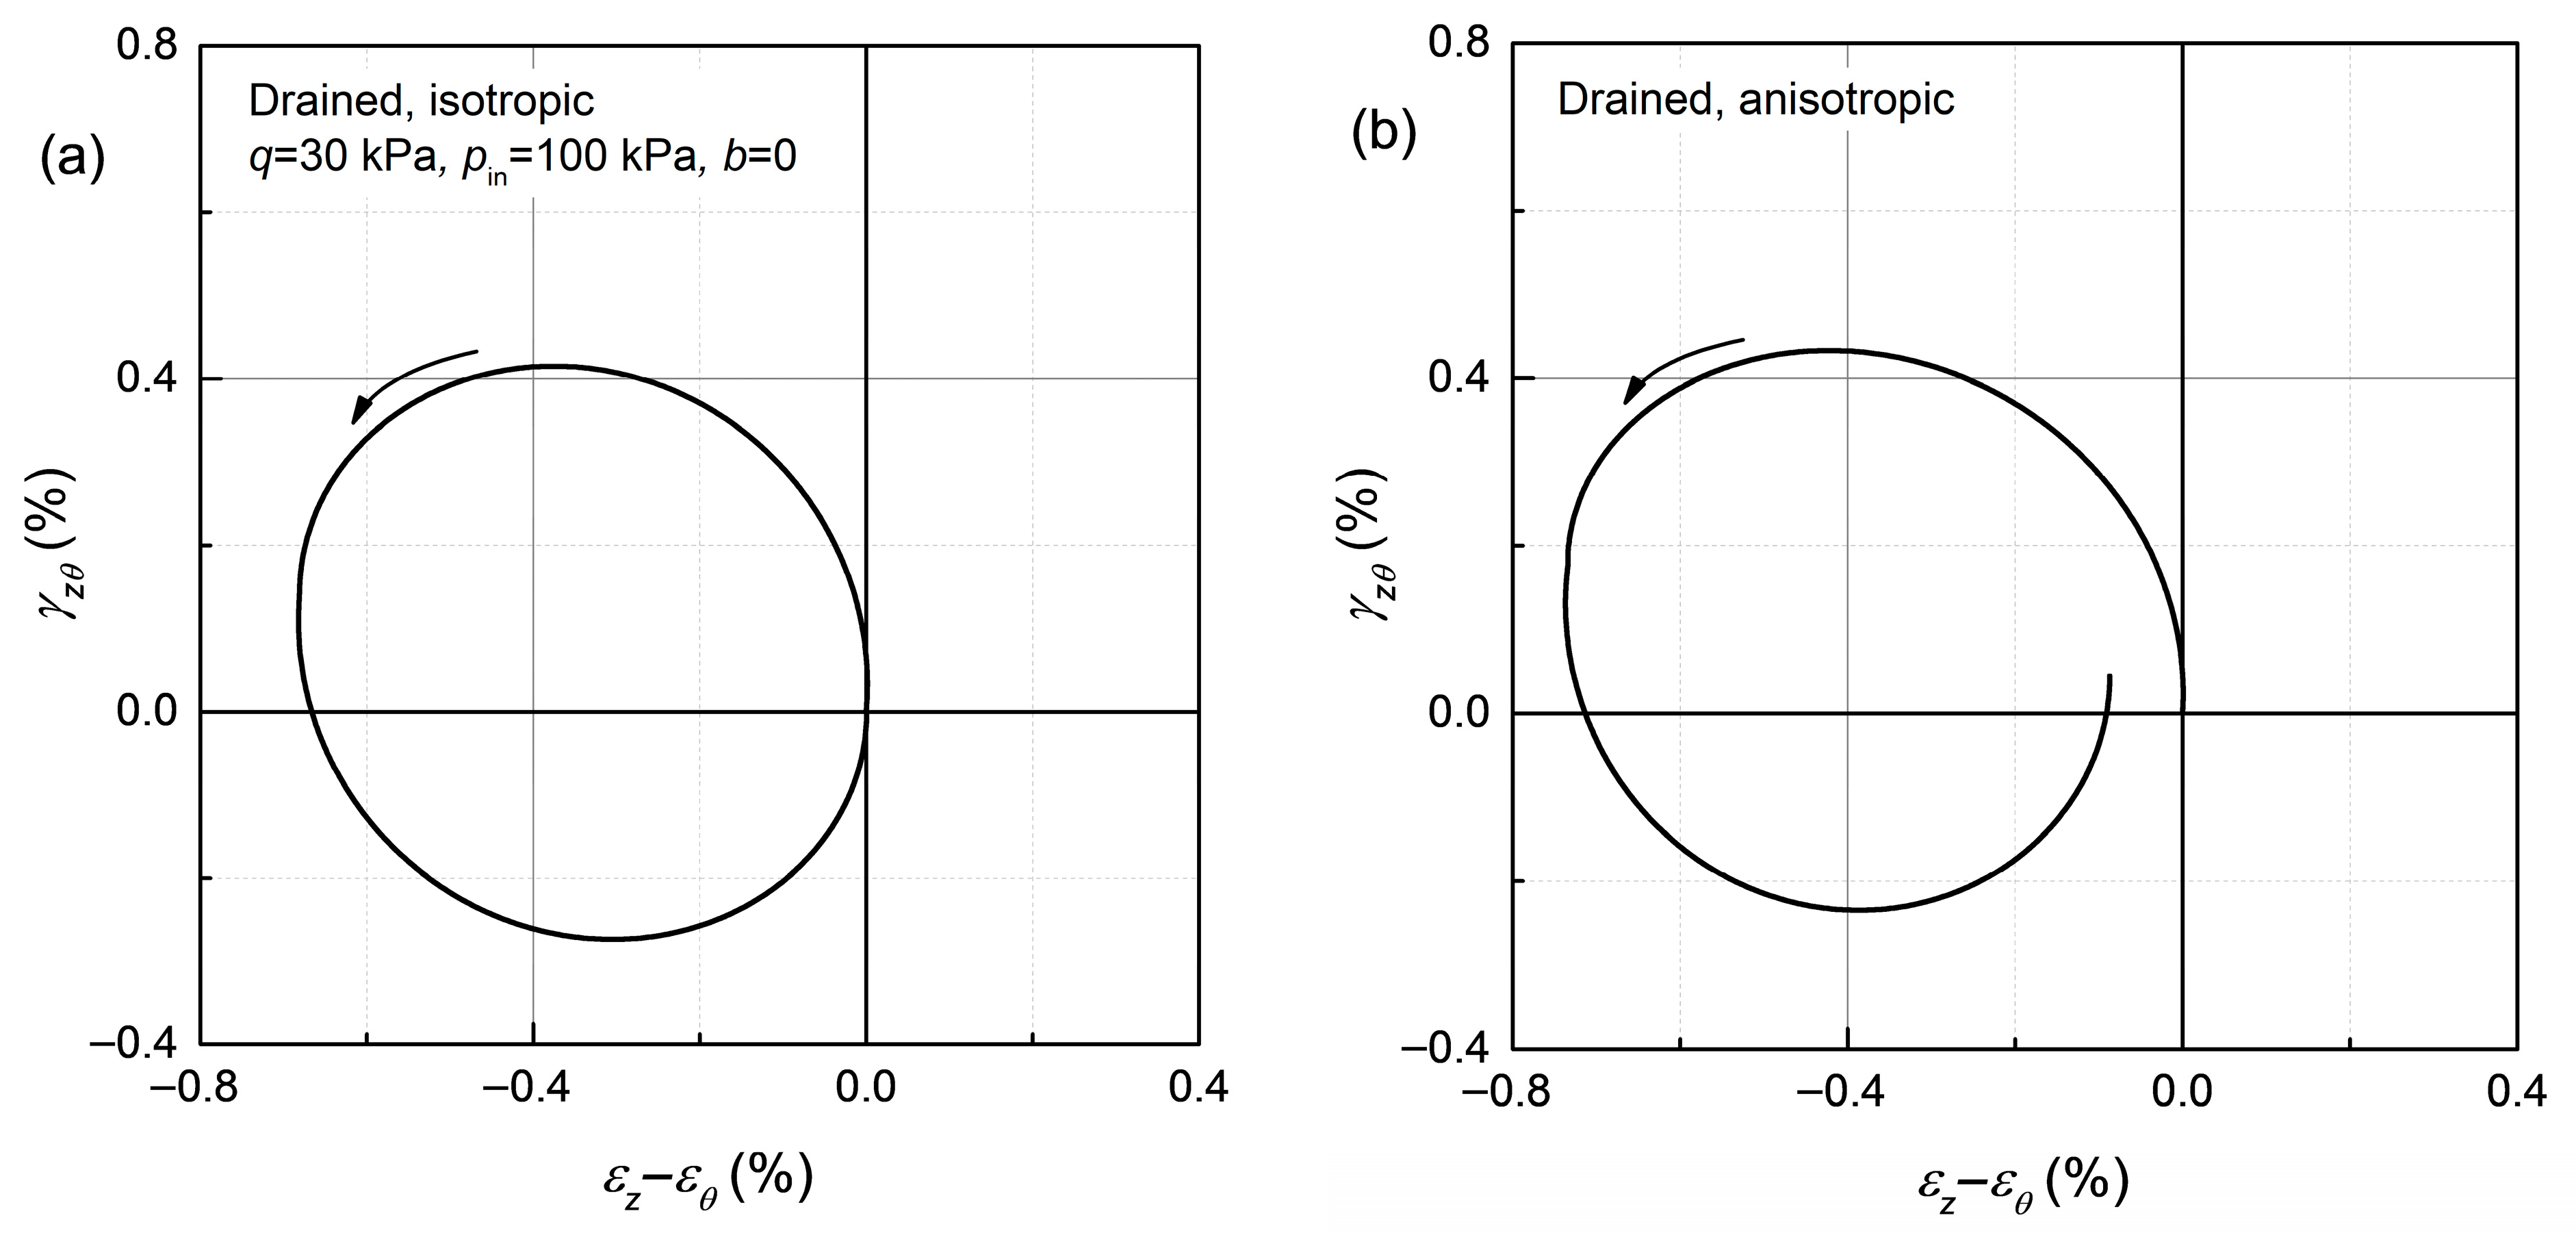
The performance of the plastic modulus defined in Equation (21) can be examined through a typical triaxial loading–unloading–reverse loading cycle. Consider a virgin triaxial compression test. Initially, β is located at the origin, leading to r ~ coinciding with r ¯ , which implies ρ = 0. Consequently, the contribution from ρ in Equation (21) vanishes, and the model reduces to a conventional radial mapping model. Upon unloading, the stress path reverses direction (downwards in Figure 2), and β is updated to the position of r ¯ at the onset of unloading. Note that β is now outside the bounding surface, and r ~ will be located at the bottom of the bounding surface (triaxial extension side). Thus, ρ   =   ρ m and K p =   , resembling an elastic unloading response. Following subsequent reverse loading, r (and r ¯ ) continues to evolve downwards and eventually passes through α , and r ~ again coincides with r ¯ , giving a typical triaxial extension response. Figure 4 showcases the typical model predictions for undrained monotonic and cyclic triaxial tests. It is evident that including the second mapping step does not alter the model response to the conventional triaxial loading path, which is advantageous for calibration. Compared with classical clay models in the literature (e.g., [56,61,62]), this model is an enhancement that incorporates the effects of principal stress axes rotation. In the meantime, it can be downgraded to conventional formulations if this feature is not desired.
It should be noted that Equations (19)–(21) are all independent of the stress rate, indicating an overall linear incremental stress–strain relation. This is a favorable feature in terms of numerical implementations. The explicit integration scheme (e.g., Abbo [63], Sloan et al. [64]) is considered to be more suitable for the present model as the stress path of principal stress axes rotation may intersect the yield surface repeatedly. A detailed discussion on the numerical scheme is outside the scope of this paper and can be found in the work of Lu [24].

3. Numerical Simulations

3.1. General Model Performance

This section presents a few typical model responses to qualitatively highlight the features of the proposed model. The model constants and their calibration will be discussed later.
Figure 5 depicts representative model simulations during one cycle of drained pure principal stress axes rotation. In this figure, the horizontal axis is the major principal stress direction α σ , and the vertical axis shows the strain components. The initial mean effective stress p i n is set to 100 kPa, and the intermediate principal stress coefficient b = 0 (where b   =   ( σ 2 σ 3 ) / ( σ 1 σ 3 ) , with σ 1 σ 2 σ 3 being the principal stresses). Three deviator stresses, q = 30, 45, and 60 kPa, are employed. It is evident from the results that the strain amplitude increases with a higher shear stress level. Furthermore, the model successfully captures the sinusoidal-like pattern of strain variations.
An important aspect of the model formulations is that plastic loading can be triggered even for an isotropic soil ( α = 0). Nevertheless, the consideration of anisotropy is non-trivial. Figure 6 illustrates the predicted strain trajectories during drained principal stress axes rotation. For an isotropic soil (Figure 6a), the strain trajectory forms a closed loop, even though plastic loading occurs. This is a result of the symmetric nature of the stress path (see the dashed circle in Figure 3), which induces equal but opposite strains at symmetrically located stress points. Consequently, the accumulated strain diminishes over a full cycle of rotation. In contrast, the strain trajectory is not closed for an anisotropic soil (Figure 6b). This is because the material response is anisotropic; thus, symmetric stress points do not necessarily produce symmetric strain increments. Similar observations were reported by Tsutsumi and Hashiguchi [20].
The influence of anisotropy is further demonstrated in Figure 7, which shows typical model responses under undrained principal stress axes rotation at three different inherent anisotropy levels: α i n / η i n = 0, 0.5, and 0.9. Clearly, all the stress paths move leftwards, indicating excess pore pressure generation, as soils are on the “wet” side and tend to contract under shear. Moreover, Figure 7 reveals that the magnitude of generated excess pore pressure increases with the degree of soil anisotropy. A common postulation in clay plasticity is that when the stress anisotropy is more closely aligned to the material anisotropy, the plastic flow direction tends more towards the hydrostatic axis (see Figure 1 for the meridional plane illustration). Therefore, as the ratio of α i n / η i n increases towards unity, the soil exhibits a more contractive tendency under shear. The results in Figure 7 are consistent with the experimental observation [65] that undisturbed clay is more contractive than reconstituted clay under principal stress axes rotation.

3.2. Calibration Methods

The calibration of the proposed model necessitates the determination of 10 constants (as summarized in Table 1): two elasticity constants: κ and υ ; three critical state constants: λ , M c , and M e ; two rotational hardening constants: μ and ω ; two stiffness constants: h ¯ and h ~ ; and one flow rule constant: z .
The elasticity constants and critical state constants are standard parameters of the critical state soil mechanics framework. These parameters can be determined following established procedures and, therefore, will not be elaborated here. The calibration of rotational hardening constants is also straightforward. One can start by assuming the rotational hardening is saturated, which implies that Equation (12) equals zero. Thus, a specific relation between ω , α , and η is obtained. Subsequently, by considering a K0 condition and substituting α   = α K 0 (Equation (14)) and η   =   η K 0 into Equation (12), one obtains ω   =   3 ( 3 η K 0 4 α K 0 ) ( M c 2 η K 0 2 ) / 8 ( 3 α K 0 η K 0 ) ( η K 0 α K 0 ) . Then, the value of μ can be found by fitting test data involving significant rotation of the bounding surface, preferably an undrained constant- η triaxial test with η being very different from the initial soil anisotropy. Finally, h ¯ can be determined by fitting of undrained triaxial test data, and h ~ and z can be determined by fitting of test data involving significant principal stress axes rotation.
It is important to emphasize that h ¯ is a standard parameter in classical bounding surface models (e.g., [66,67]). Therefore, only the parameters h ~ and z are newly introduced specifically within the context of the present model.

3.3. Model Validation Against Experimental Results

The model is validated against experimental data of two soils: Hangzhou soft clay and Shanghai soft clay. The model parameters used are listed in Table 1.
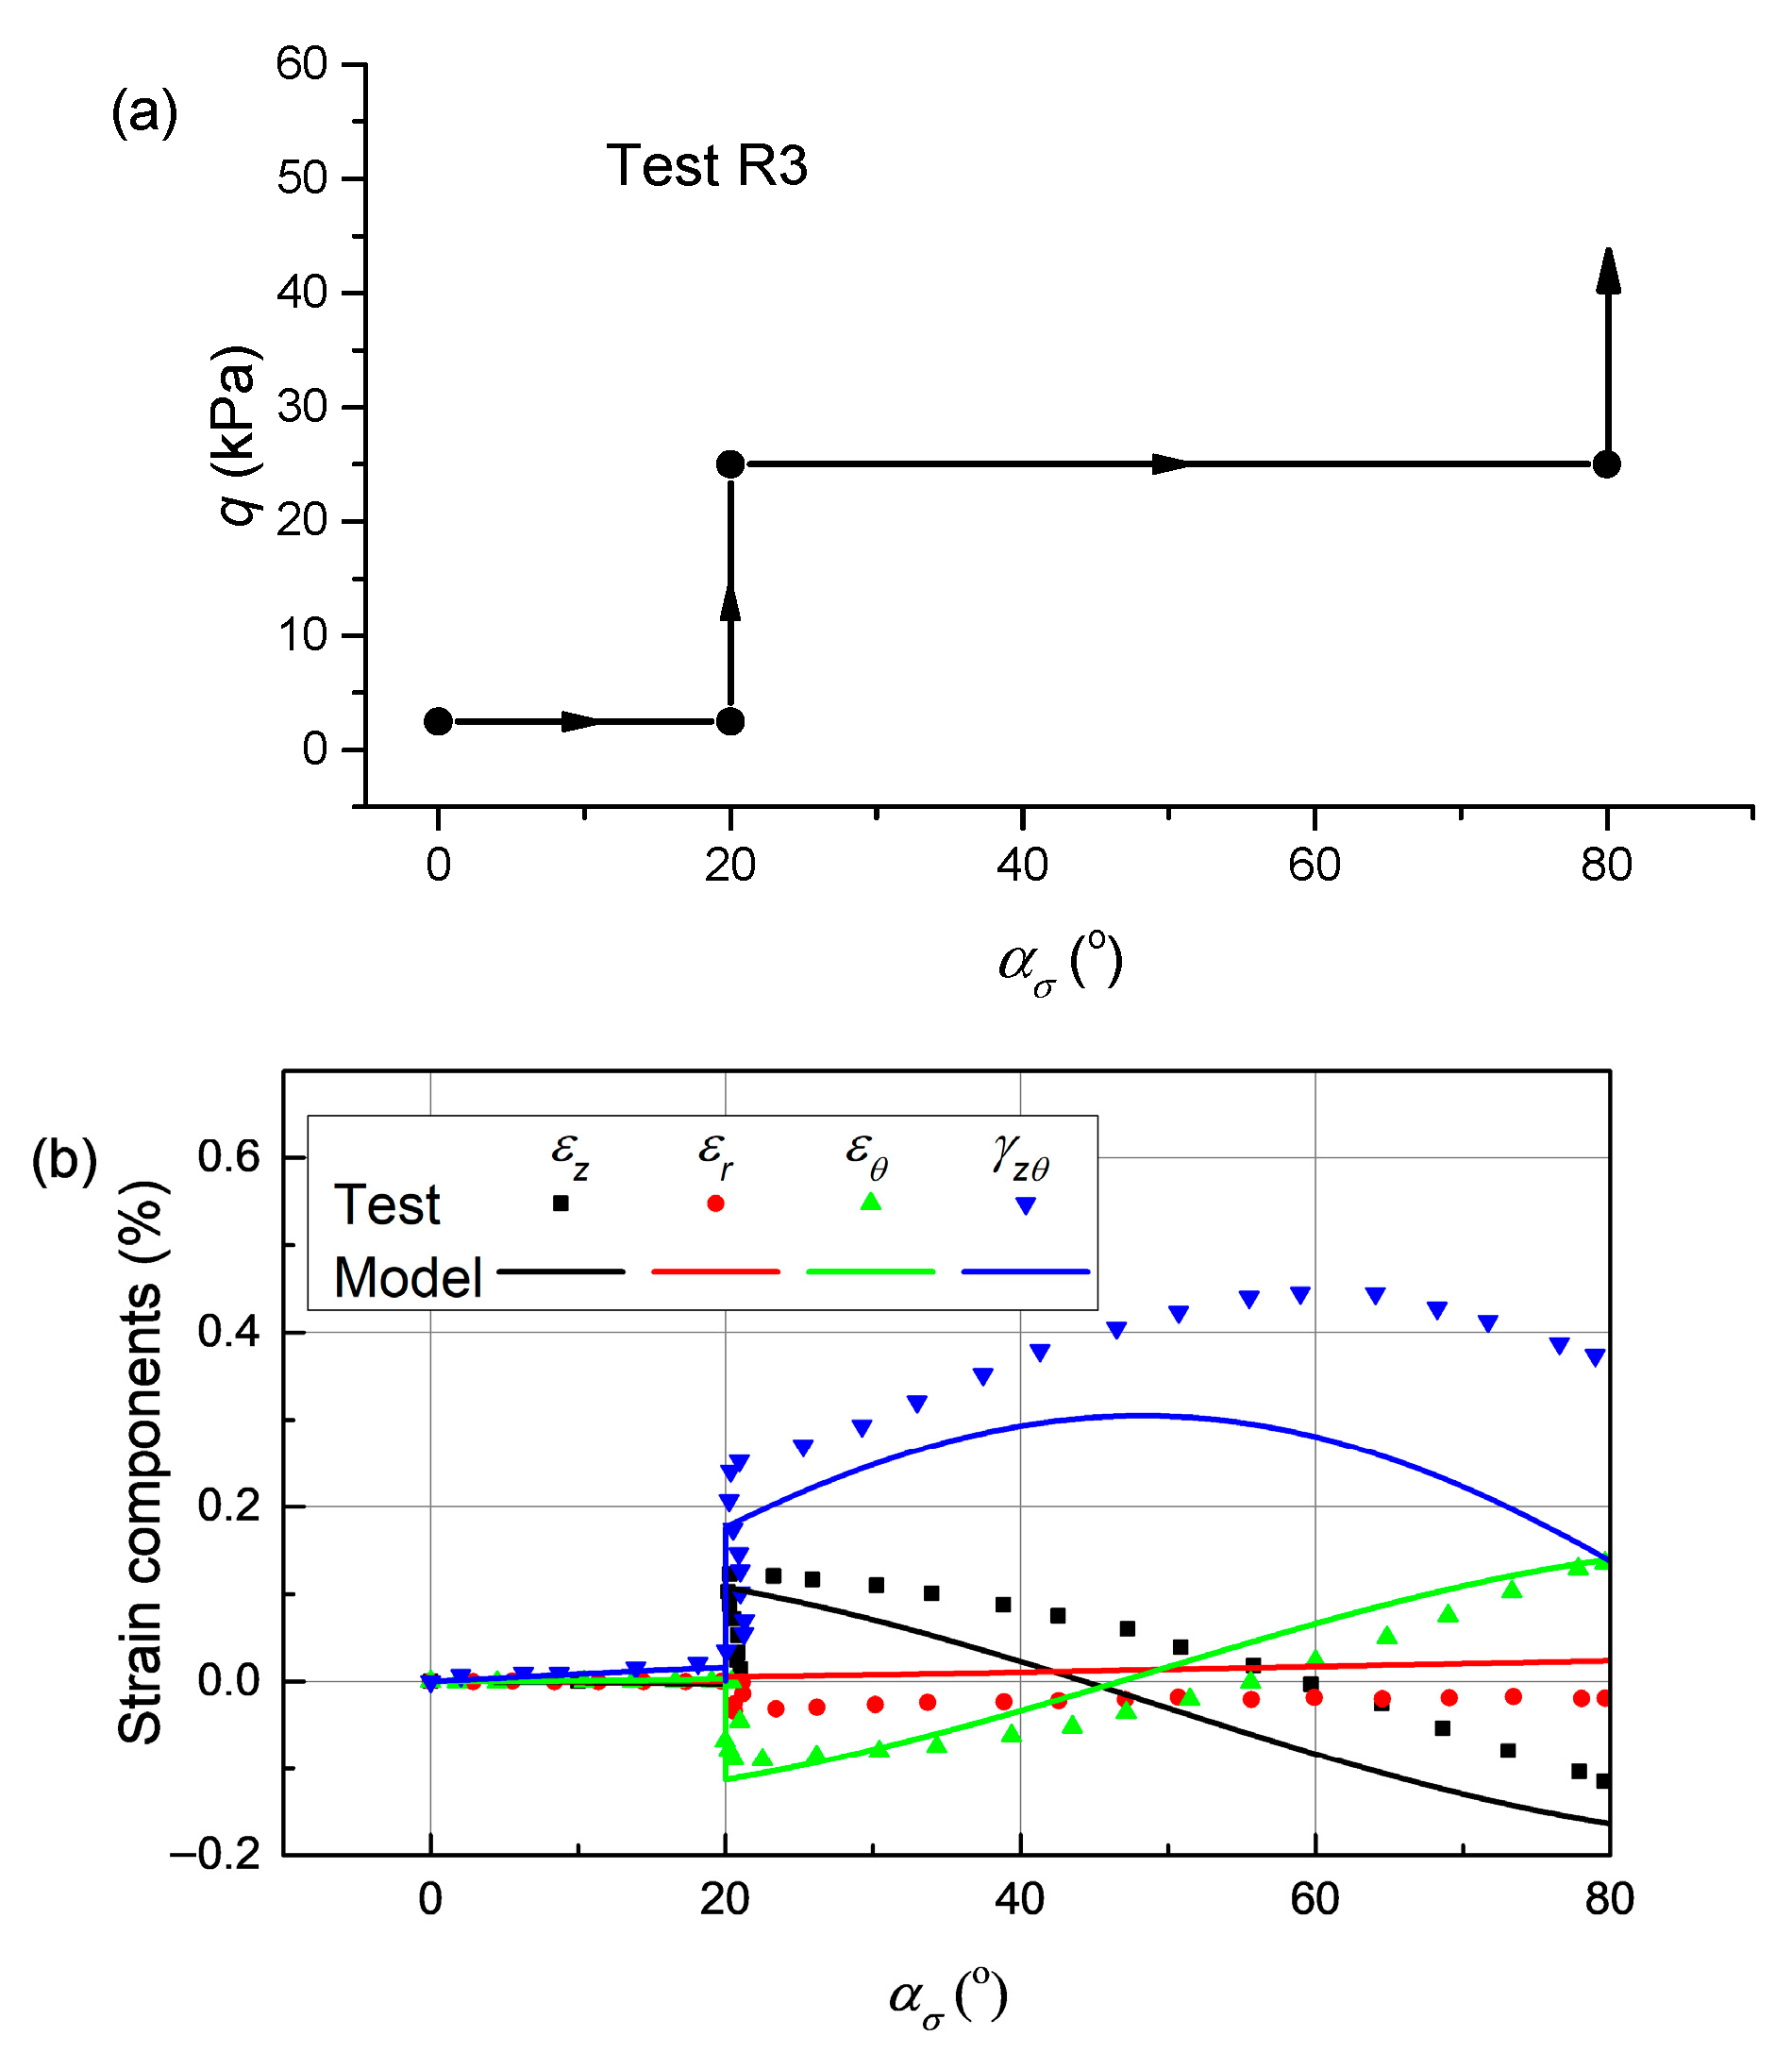
The model parameters for Hangzhou clay were calibrated primarily for the HCA tests reported by Zhou and Xu [14], in which intact clay samples were extracted from a 7 m deep pit in Hangzhou, China. As the source reference lacked complementary triaxial/oedometer test data, values for the elastic and critical state constants were selected from independent studies performed on the same soil [68,69]. In the work of Zhou and Xu [14], soil specimens were first consolidated to an initial state of p i n = 150 kPa, q = 2.5 kPa, and b = 0.5. The testing program includes undrained rotation of the major principal stress direction α σ at constant q and undrained monotonic shearing under constant α σ , while maintaining constant total mean stress and intermediate principal stress coefficient b . The first test simulated, referred to as test R1 in Figure 8a, involves the following protocol: (1) monotonic shearing with q increasing from 2.5 kPa to 25 kPa at fixed α σ = 0°, (2) rotation of α σ from 0° to 80° at fixed q = 25 kPa, and (3) again, monotonic shearing at fixed α σ until failure. The second test, referred to as test R3 in Figure 9a, is conducted by (1) rotation of α σ from 0° to 20° at fixed q = 2.5 kPa, (2) monotonic shearing with q increasing from 2.5 kPa to 25 kPa at fixed α σ = 20° and (3) rotation of α σ from 20° to 80° at fixed q = 25 kPa, followed by (4) a final stage of monotonic shearing along α σ = 80° until failure. A brief summary of the experimental protocols is presented in Table 2. Figure 8a and Figure 9b depict the stress paths followed in these two tests, respectively. Comparisons between model simulations and measured data of strain variation are presented in Figure 8b and Figure 9b, respectively.
Overall, Figure 8 and Figure 9 show very good agreement between the model simulations and test data. By comparing Figure 8b and Figure 9b, one can see that the rotation of α σ from 0° to 20° induces substantially larger strain in test R1 than it does in test R3, a phenomenon attributed to the different shear stress level q . Furthermore, the monotonic shearing with q increasing from 2.5 kPa to 25 kPa induces larger strains in test R3 than R1. This discrepancy is due to the soil’s inherent anisotropy. In R3, the monotonic shearing is performed along α σ = 20°, while in R1, it was performed along α σ = 0°. The soil’s strength along α σ = 20° is lower than that along 0° (sedimentation direction). Therefore, larger strains are induced during this shearing stage in R3.
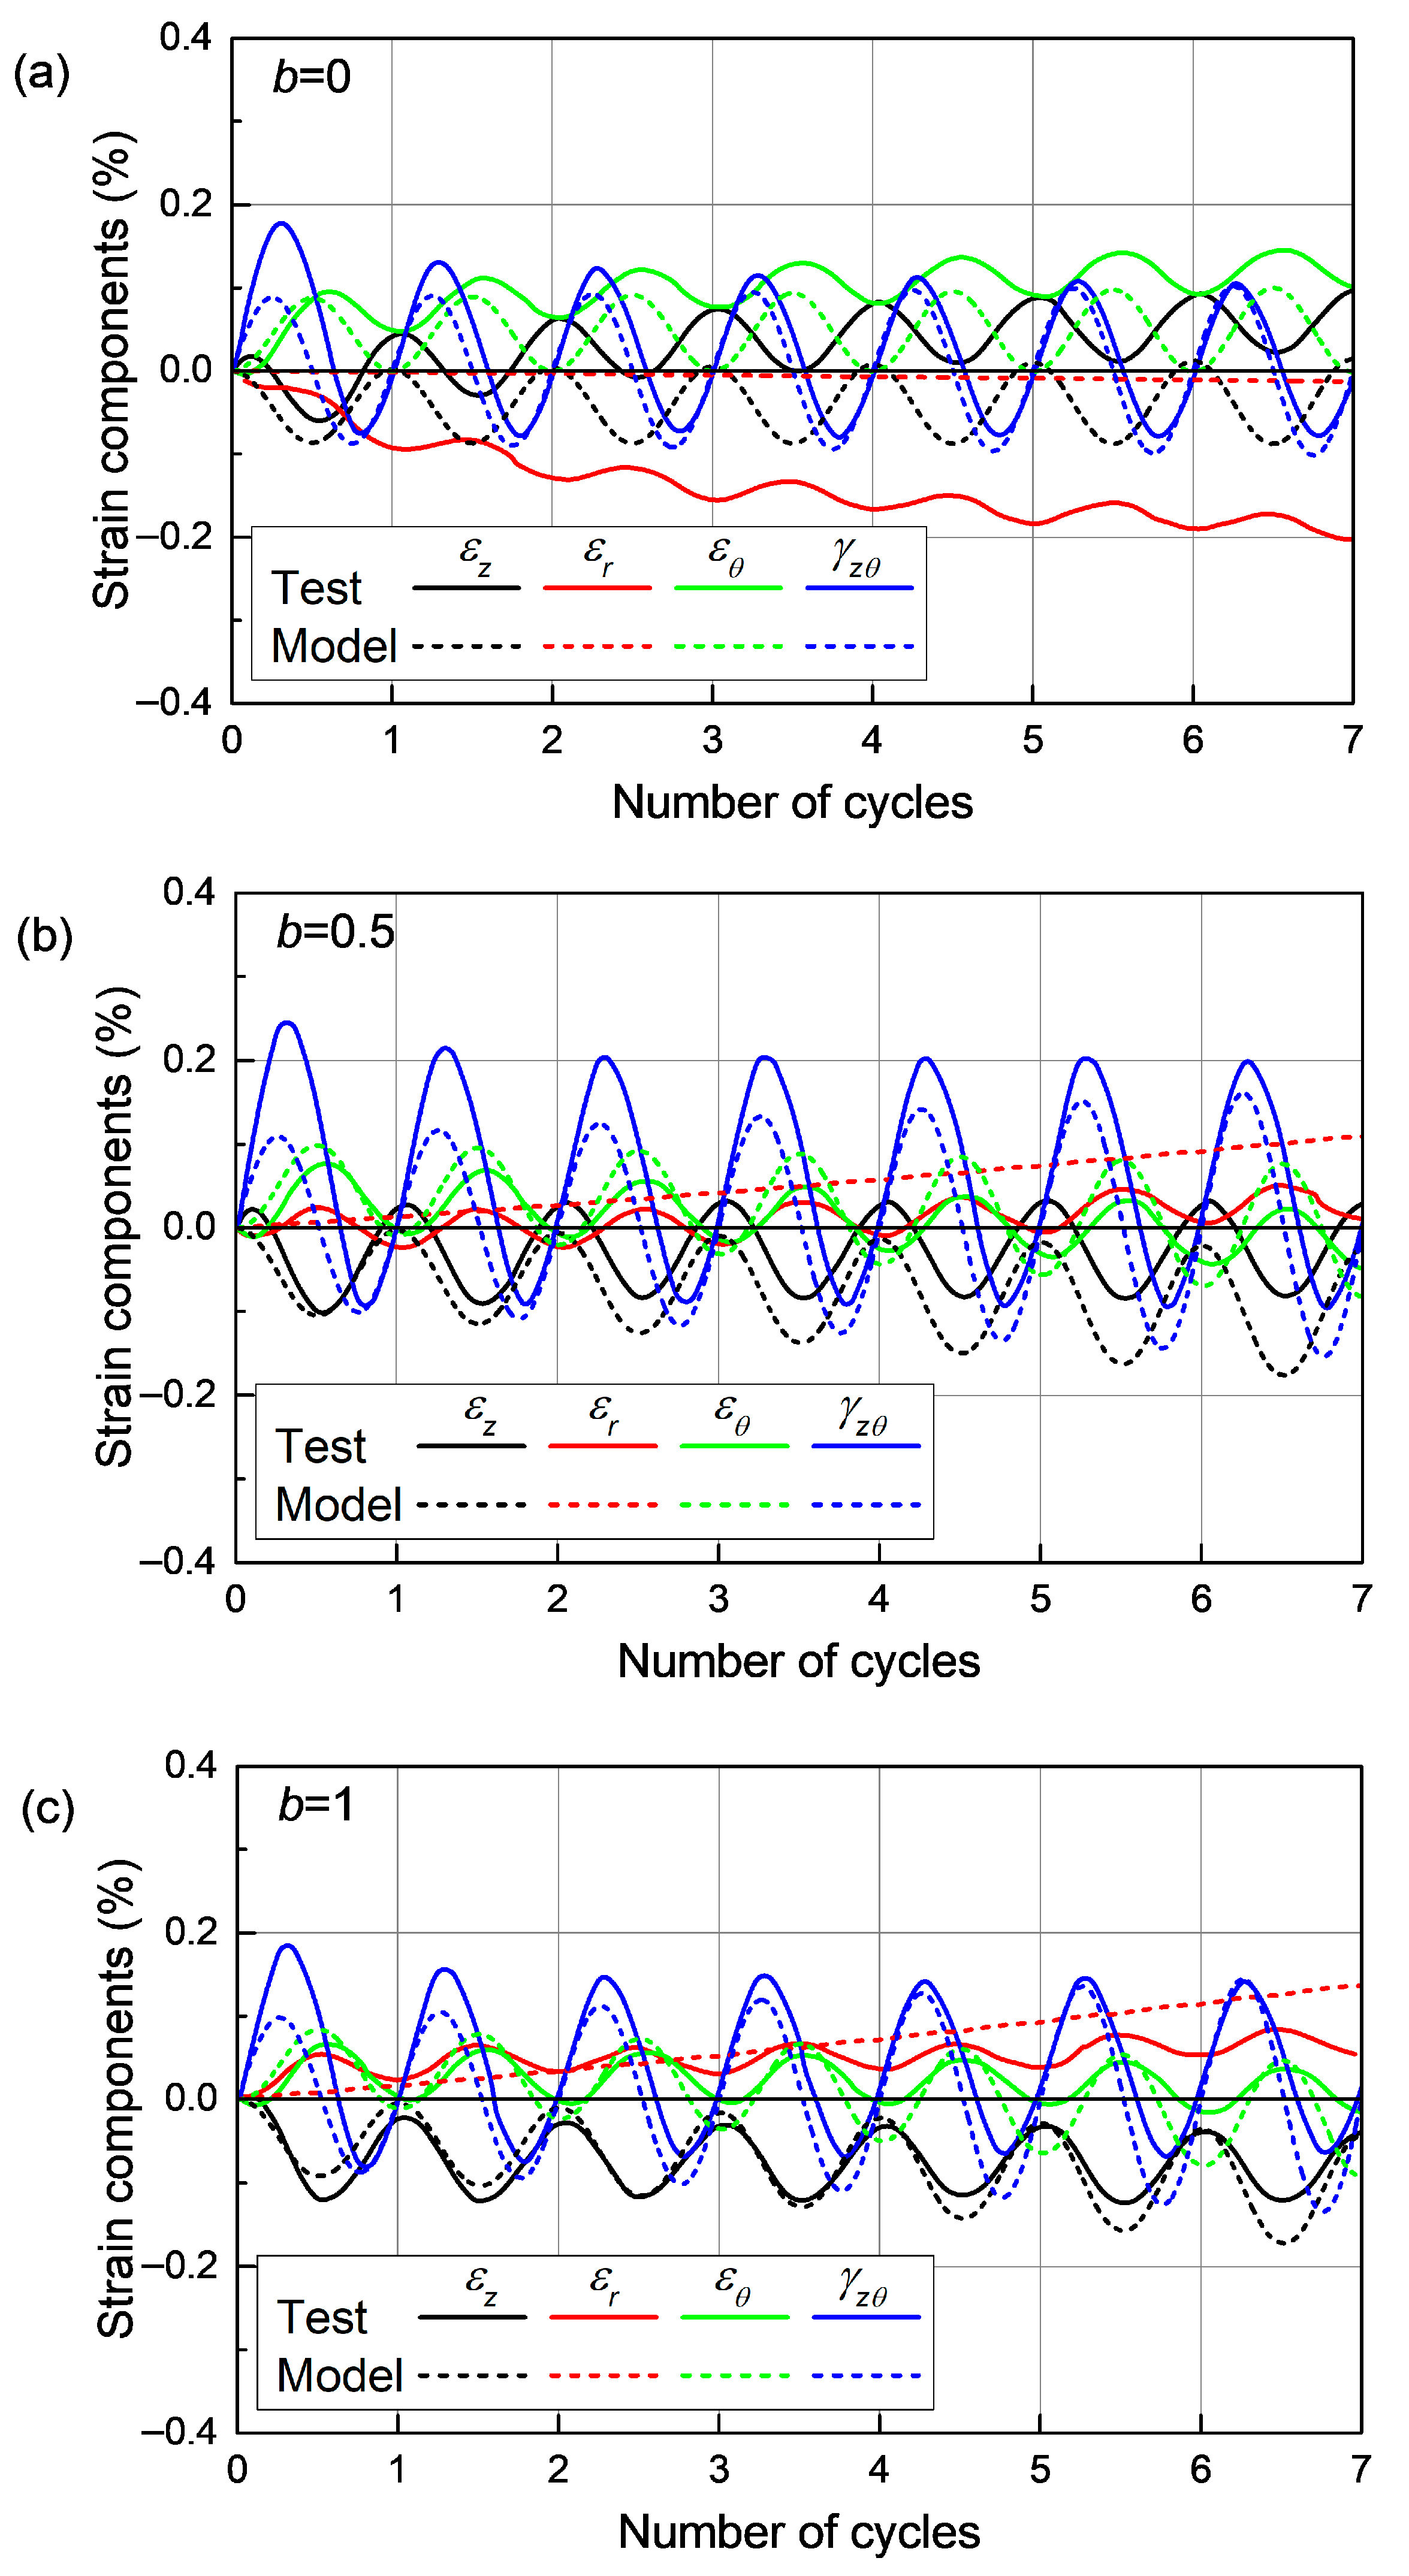
The experiments on Hangzhou clay involve only a single value of the intermediate principal stress coefficient b = 0.5 with the rotation limited to 80°. Qian et al. [15], on the other hand, presented a series of more comprehensive tests on Shanghai soft clay. Undisturbed Shanghai clay specimens were retrieved from a 18–20 m deep construction site, possessing a vertical preconsolidation pressure of approximately 149 kPa. Then, these specimens were consolidated isotropically to an initial mean effective stress of p i n = 150 kPa. This procedure ensured that the soil was normally consolidated and would yield immediately upon subsequent loading. Subsequently, the samples were subjected to drained monotonic shearing to reach a state of q = 30 kPa while p   =   p i n remained constant. Three values of b = 0, 0.5, and 1 were used. Afterwards, the main shearing stage commenced, which involves undrained rotation of the principal stress axes. In total, seven full cycles of rotation were performed, marking α σ changes from 0° to 1260°. The test protocols are summarized in Table 2. These tests are simulated, and model constants are listed in Table 1.
Figure 10 presents a comparison between the measured and model-predicted effective stress paths in the p q plane. It can be seen that the principal stress axes rotation induces substantial excess pore pressure and reduces the effective confining pressure. A larger excess pore pressure is generated as the b value increases. This trend is associated with the reduced constraint provided by the intermediate principal stress under higher b values, generally leading to lower soil strength. Measured and model-predicted strain components are presented in Figure 11. The patterns of strain variation are very well captured by the model, demonstrating satisfactory agreement between model simulations and test data.

4. Conclusions

Recent experimental data has underscored the important role of principal stress axes rotation in clay behavior. However, the majority of existing constitutive models that incorporate this effect are primarily developed for sand. To properly simulate this effect on clay, a novel anisotropic bounding surface model was developed. The model’s distinctive characteristic is a second mapping step in the deviatoric stress ratio plane with a relocatable mapping center, which complements the conventional meridional plane radial mapping step that uses a fixed mapping center. The model can accurately reproduce plastic loading induced by the rotation of principal stress axes, achieving this without employing additional loading mechanisms or incrementally nonlinear formulations. Despite this enhancement, the model formulation retains relative simplicity and clarity. Its response under conventional proportional loading paths (e.g., triaxial loading) remains unaffected. Moreover, the model parameters are intuitive and easy to calibrate.
Simulations of experiments comprehensively demonstrated the capabilities of the model and highlighted the importance of considering principal stress axes rotation effects in clay behavior. These findings offered a practical tool for considering principal stress axes rotation in the numerical analysis of soil–structure interactions. Future work includes extensive validation against various conditions and finite element applications of the model. In addition, the model’s numerical integration scheme should be further investigated and verified. Enhancements regarding high cyclic loading should also be considered for applications such as traffic loading and seismic analysis.

Author Contributions

Conceptualization, N.L.; Formal Analysis, N.L.; Funding Acquisition, N.L. and Z.W.; Methodology, N.L.; Validation, Z.W. and H.Z.; Visualization, N.L. and Z.W.; Writing—Original Draft, N.L.; Writing—Review and Editing, Z.W. and H.Z. All authors have read and agreed to the published version of the manuscript.

Funding

This research was funded by the National Natural Science Foundation of China (Grant No. 52408369) and the Zhejiang Provincial Natural Science Foundation (Grant No. LY23E080004 and No. LQN25A020008).

Data Availability Statement

The original contributions presented in this study are included in the article. Further inquiries can be directed to the corresponding author.

Acknowledgments

The authors wish to express their sincere gratitude to the late Yunming Yang for his invaluable guidance during the early stages of their academic careers.

Conflicts of Interest

The authors declare no conflicts of interest.

References

  1. Arthur, J.; Chua, K.; Dunstan, T. Dense sand weakened by continuous principal stress direction rotation. Geotechnique 1979, 1, 91–96. [Google Scholar] [CrossRef]
  2. Wong, R.; Arthur, J. Sand sheared by stresses with cyclic variations in direction. Geotechnique 1986, 36, 215–226. [Google Scholar] [CrossRef]
  3. Hight, D.; Gens, A.; Symes, M. The development of a new hollow cylinder apparatus for investigating the effects of principal stress rotation in soils. Geotechnique 1983, 33, 355–383. [Google Scholar] [CrossRef]
  4. Ishihara, K.; Towhata, I. Sand response to cyclic rotation of principal stress directions as induced by wave loads. Soils Found. 1983, 23, 11–26. [Google Scholar] [CrossRef] [PubMed]
  5. Symes, M.; Gens, A.; Hight, D. Undrained anisotropy and principal stress rotation in saturated sand. Geotechnique 1984, 34, 11–27. [Google Scholar] [CrossRef]
  6. Miura, K.; Miura, S.; Toki, S. Deformation behavior of anisotropic dense sand under principal stress axes rotation. Soils Found. 1986, 26, 36–52. [Google Scholar] [CrossRef]
  7. Tong, Z.-X.; Zhang, J.-M.; Yu, Y.-L.; Zhang, G. Drained deformation behavior of anisotropic sands during cyclic rotation of principal stress axes. J. Geotech. Geoenviron. Eng. 2010, 136, 1509–1518. [Google Scholar] [CrossRef]
  8. Yu, H.-S.; Yang, L.-T.; Li, X.; Wanatowski, D. Experimental investigation on the deformation characteristics of granular materials under drained rotational shear. Geomech. Geoengin. 2016, 11, 47–63. [Google Scholar] [CrossRef]
  9. Li, X.; Yu, H.-S. Numerical investigation of granular material behaviour under rotational shear. Géotechnique 2010, 60, 381–394. [Google Scholar] [CrossRef]
  10. Tong, Z.; Fu, P.; Dafalias, Y.F.; Yao, Y. Discrete element method analysis of non-coaxial flow under rotational shear. Int. J. Numer. Anal. Methods Geomech. 2014, 38, 1519–1540. [Google Scholar] [CrossRef]
  11. Wu, Q.X.; Yang, Z.X. Undrained Responses of Anisotropic Granular Material under Rotational Shear by DEM. J. Geotech. Geoenviron. Eng. 2022, 148, 04022112. [Google Scholar] [CrossRef]
  12. Cui, X.; Li, X.; Du, Y.; Bao, Z.; Zhang, X.; Hao, J.; Hu, Y. Macro-micro numerical analysis of granular materials considering principal stress rotation based on DEM simulation of dynamic hollow cylinder test. Constr. Build. Mater. 2024, 412, 134818. [Google Scholar] [CrossRef]
  13. Akagi, H.; Saitoh, J. Dilatancy characteristics of clayey soil under principal axes rotation. In Proceedings of the International Symposium on Pre-Failure Deformation Characteristics of Geomaterials, Sapporo, Japan, 12–14 September 1994; pp. 311–314. [Google Scholar]
  14. Zhou, J.; Xu, C. Impact of shear stress on strain and pore water pressure behavior of intact soft clay under principal stress rotation. Geotech. Test. J. 2014, 37, 447–462. [Google Scholar] [CrossRef]
  15. Qian, J.-G.; Du, Z.-B.; Yin, Z.-Y. Cyclic degradation and non-coaxiality of soft clay subjected to pure rotation of principal stress directions. Acta Geotech. 2017, 13, 943–959. [Google Scholar] [CrossRef]
  16. Wang, Y.; Gao, Y.; Cai, Y.; Guo, L. Effect of initial state and intermediate principal stress on noncoaxiality of soft clay–involved cyclic principal stress rotation. Int. J. Geomech. 2018, 18, 04018081. [Google Scholar] [CrossRef]
  17. Wang, Y.; Gao, Y.; Guo, L.; Yang, Z. Influence of intermediate principal stress and principal stress direction on drained behavior of natural soft clay. Int. J. Geomech. 2018, 18, 04017128. [Google Scholar] [CrossRef]
  18. Wang, Y.; Gao, Y.; Li, B.; Guo, L.; Cai, Y.; Mahfouz, A.H. Influence of initial state and intermediate principal stress on undrained behavior of soft clay during pure principal stress rotation. Acta Geotech. 2018, 14, 1379–1401. [Google Scholar] [CrossRef]
  19. Lei, H.; Yang, X.; Feng, S.; Ma, T. Softening and deformation characteristics of Tianjin soft soil under principal stress rotation induced by traffic loading. Soil Dyn. Earthq. Eng. 2023, 164, 107587. [Google Scholar] [CrossRef]
  20. Tsutsumi, S.; Hashiguchi, K. General non-proportional loading behavior of soils. Int. J. Plast. 2005, 21, 1941–1969. [Google Scholar] [CrossRef]
  21. Yang, Y.; Yu, H.-S. A non-coaxial critical state soil model and its application to simple shear simulations. Int. J. Numer. Anal. Methods Geomech. 2006, 30, 1369–1390. [Google Scholar] [CrossRef]
  22. Qian, J.; Yang, J.; Huang, M. Three-dimensional noncoaxial plasticity modeling of shear band formation in geomaterials. J. Eng. Mech. 2008, 134, 322–329. [Google Scholar] [CrossRef]
  23. Papamichos, E.; Vardoulakis, I. Shear band formation in sand according to non-coaxial plasticity model. Geotechnique 1995, 45, 649–661. [Google Scholar] [CrossRef]
  24. Lu, N. Elastoplastic Constitutive Modelling of Clay Behaviour Under Principal Stress Rotation. Ph.D. Thesis, University of Nottingham, Nottingham, UK, 2019. [Google Scholar]
  25. Pande, G.N.; Sharma, K. Multi-laminate model of clays—A numerical evaluation of the influence of rotation of the principal stress axes. Int. J. Numer. Anal. Methods Geomech. 1983, 7, 397–418. [Google Scholar] [CrossRef]
  26. Neher, H.; Cudny, M.; Wiltafsky, C.; Schweiger, H. Modelling principal stress rotation effects with multilaminate type constitutive models for clay. Numer. Models Geomech. 2002, 42, 41–47. [Google Scholar]
  27. Dafalias, Y.F. Bounding surface plasticity. I: Mathematical foundation and hypoplasticity. J. Eng. Mech. 1986, 112, 966–987. [Google Scholar] [CrossRef]
  28. Wang, Z.-L.; Dafalias, Y.F.; Shen, C.-K. Bounding surface hypoplasticity model for sand. J. Eng. Mech. 1990, 116, 983–1001. [Google Scholar] [CrossRef]
  29. Li, X.; Dafalias, Y. A constitutive framework for anisotropic sand including non-proportional loading. Geotechnique 2004, 54, 41–55. [Google Scholar] [CrossRef]
  30. Gao, Z.; Zhao, J. A non-coaxial critical-state model for sand accounting for fabric anisotropy and fabric evolution. Int. J. Solids Struct. 2017, 106, 200–212. [Google Scholar] [CrossRef]
  31. Xue, L.; Yu, J.K.; Pan, J.H.; Wang, R.; Zhang, J.M. Three-dimensional anisotropic plasticity model for sand subjected to principal stress value change and axes rotation. Int. J. Numer. Anal. Methods Geomech. 2020, 45, 353–381. [Google Scholar] [CrossRef]
  32. Liao, D.; Yang, Z. Hypoplastic modeling of anisotropic sand behavior accounting for rotation of principal stress direction. J. Eng. Mech. 2022, 148, 04022060. [Google Scholar] [CrossRef]
  33. Liao, D.; Zhou, C.; Yang, Z. A Constitutive Model for Anisotropic Sand Considering Fabric Evolution Under Proportional and Non-Proportional Loadings. Int. J. Numer. Anal. Methods Geomech. 2025, 49, 1575–1596. [Google Scholar] [CrossRef]
  34. Fu, L.-y.; Zhou, J.; Gong, X.-N. A hypoplastic model simulating the cyclic clay behaviors under principal stress rotation. Soil Dyn. Earthq. Eng. 2025, 199, 109681. [Google Scholar] [CrossRef]
  35. Gutierrez, M.; Ishihara, K.; Towhata, I. Model for the deformation of sand during rotation of principal stress directions. Soils Found. 1993, 33, 105–117. [Google Scholar] [CrossRef]
  36. Lashkari, A.; Latifi, M. A non-coaxial constitutive model for sand deformation under rotation of principal stress axes. Int. J. Numer. Anal. Methods Geomech. 2008, 32, 1051–1086. [Google Scholar] [CrossRef]
  37. Papadimitriou, A.G.; Chaloulos, Y.K.; Dafalias, Y.F. A fabric-based sand plasticity model with reversal surfaces within anisotropic critical state theory. Acta Geotech. 2019, 14, 253–277. [Google Scholar] [CrossRef]
  38. Wang, R.; Cao, W.; Xue, L.; Zhang, J.-M. An anisotropic plasticity model incorporating fabric evolution for monotonic and cyclic behavior of sand. Acta Geotech. 2021, 16, 43–65. [Google Scholar] [CrossRef]
  39. Ueda, K.; Iai, S. Noncoaxiality considering inherent anisotropy under various loading paths in a strain space multiple mechanism model for granular materials. Int. J. Numer. Anal. Methods Geomech. 2021, 45, 815–842. [Google Scholar] [CrossRef]
  40. Yang, Y.; Yu, H.S. A kinematic hardening soil model considering the principal stress rotation. Int. J. Numer. Anal. Methods Geomech. 2013, 37, 2106–2134. [Google Scholar] [CrossRef]
  41. Wang, Z.; Yang, Y.; Lu, N.; Li, Y.; Yu, H.-S. Effects of the principal stress rotation in numerical simulations of geotechnical laboratory cyclic tests. Comput. Geotech. 2019, 109, 220–228. [Google Scholar] [CrossRef]
  42. Petalas, A.L.; Dafalias, Y.F.; Papadimitriou, A.G. SANISAND-FN: An evolving fabric-based sand model accounting for stress principal axes rotation. Int. J. Numer. Anal. Methods Geomech. 2018, 43, 97–123. [Google Scholar] [CrossRef]
  43. Li, X.S.; Dafalias, Y.F. Anisotropic critical state theory: Role of fabric. J. Eng. Mech. 2011, 138, 263–275. [Google Scholar] [CrossRef]
  44. Hu, N.; Zhuang, P.-Z.; Yang, D.-S.; Yu, H.-S. On the evolution law of a contact normal-based fabric tensor for granular materials. Comput. Geotech. 2021, 132, 103857. [Google Scholar] [CrossRef]
  45. Wang, Z.; Yang, Y.; Li, Y.; Liu, S.; Zhou, P. Numerical simulation of cyclic shear tests considering the fabric change and principal stress rotation effects. Int. J. Numer. Anal. Methods Geomech. 2022, 46, 1409–1432. [Google Scholar] [CrossRef]
  46. Liu, H.; Nagula, S.; Petter Jostad, H.; Piciullo, L.; Nadim, F. Considerations for using critical state soil mechanics based constitutive models for capturing static liquefaction failure of tailings dams. Comput. Geotech. 2024, 167, 106089. [Google Scholar] [CrossRef]
  47. Lu, N.; Yang, Y.; Yu, H.-S.; Wang, Z. Modelling the simple shear behaviour of clay considering principal stress rotation. Mech. Res. Commun. 2020, 103, 103474. [Google Scholar] [CrossRef]
  48. Tian, Y.; Yao, Y.-P. Constitutive modeling of principal stress rotation by considering inherent and induced anisotropy of soils. Acta Geotech. 2018, 13, 1299–1311. [Google Scholar] [CrossRef]
  49. Du, Z.; Shi, Z.; Qian, J.; Huang, M.; Guo, Y. Constitutive modeling of three-dimensional non-coaxial characteristics of clay. Acta Geotech. 2022, 17, 2157–2172. [Google Scholar] [CrossRef]
  50. Du, Z.; Qian, J.; Zhang, J.; Liu, Y.; Huang, M. Elastoplastic modeling cyclic behavior of natural soft clay with principal stress rotation under traffic loading. Acta Geotech. 2023, 18, 3643–3660. [Google Scholar] [CrossRef]
  51. Li, X.S.; Dafalias, Y.F. Noncoaxiality between Two Tensors with Application to Stress Rate Decomposition and Fabric Anisotropy Variable. J. Eng. Mech. 2020, 146, 04020004. [Google Scholar] [CrossRef]
  52. Dafalias, Y.F. An anisotropic critical state soil plasticity model. Mech. Res. Commun. 1986, 13, 341–347. [Google Scholar] [CrossRef]
  53. Van Eekelen, H. Isotropic yield surfaces in three dimensions for use in soil mechanics. Int. J. Numer. Anal. Methods Geomech. 1980, 4, 89–101. [Google Scholar] [CrossRef]
  54. Sheng, D.; Sloan, S.W.; Yu, H.-S. Aspects of finite element implementation of critical state models. Comput. Mech. 2000, 26, 185–196. [Google Scholar] [CrossRef]
  55. Roscoe, K.H.; Burland, J.B. On the Generalized Stress-Strain Behaviour of Wet Clay. In Engineering Plasticity; Heyman, J., Leckie, F.A., Eds.; Cambridge University Press: Cambridge, UK, 1968; pp. 535–609. [Google Scholar]
  56. Wheeler, S.J.; Näätänen, A.; Karstunen, M.; Lojander, M. An anisotropic elastoplastic model for soft clays. Can. Geotech. J. 2003, 40, 403–418. [Google Scholar] [CrossRef]
  57. Dafalias, Y.F.; Taiebat, M. Anatomy of rotational hardening in clay plasticity. Géotechnique 2013, 63, 1406–1418. [Google Scholar] [CrossRef]
  58. Li, T.; Meissner, H. Two-surface plasticity model for cyclic undrained behavior of clays. J. Geotech. Geoenviron. Eng. 2002, 128, 613–626. [Google Scholar] [CrossRef]
  59. Hu, C.; Liu, H. Implicit and explicit integration schemes in the anisotropic bounding surface plasticity model for cyclic behaviours of saturated clay. Comput. Geotech. 2014, 55, 27–41. [Google Scholar] [CrossRef]
  60. Seidalinov, G.; Taiebat, M. Bounding surface SANICLAY plasticity model for cyclic clay behavior. Int. J. Numer. Anal. Methods Geomech. 2014, 38, 702–724. [Google Scholar] [CrossRef]
  61. Dafalias, Y.F.; Manzari, M.T.; Papadimitriou, A.G. SANICLAY: Simple anisotropic clay plasticity model. Int. J. Numer. Anal. Methods Geomech. 2006, 30, 1231–1257. [Google Scholar] [CrossRef]
  62. Hu, C.; Liu, H.; Huang, W. Anisotropic bounding-surface plasticity model for the cyclic shakedown and degradation of saturated clay. Comput. Geotech. 2012, 44, 34–47. [Google Scholar] [CrossRef]
  63. Abbo, A.J. Finite Element Algorithms for Elastoplasticity and Consolidation. Ph.D. Thesis, The University of Newcastle, Callaghan, Australia, 1997. [Google Scholar]
  64. Sloan, S.W.; Abbo, A.J.; Sheng, D. Refined explicit integration of elastoplastic models with automatic error control. Eng. Comput. 2001, 18, 121–194. [Google Scholar] [CrossRef]
  65. Akagi, H.; Yamamoto, H. Stress-dilatancy relation of undisturbed clay under principal axes rotation. In Proceedings of the Deformation and Progressive Failure in Geomechanics, Nagoya-shi, Japan, 1 October 1997; Volume 216. [Google Scholar]
  66. Jiang, J.; Ling, H.I.; Kaliakin, V.N. An associative and non-associative anisotropic bounding surface model for clay. J. Appl. Mech. 2012, 79, 031010. [Google Scholar] [CrossRef]
  67. Ling, H.I.; Yue, D.; Kaliakin, V.N.; Themelis, N.J. Anisotropic elastoplastic bounding surface model for cohesive soils. J. Eng. Mech. 2002, 128, 748–758. [Google Scholar] [CrossRef]
  68. Liu, Z. Study on Yielding Characteristic and Anisotropic Yield Surface Equation of Soft Clay. Master’s Thesis, Zhejiang University, Hangzhou, China, 2014. (In Chinese). [Google Scholar]
  69. Xia, Y. Study of Mechanical Behavior of Hangzhou clay Considering Samll Strain Stiffness and Its Engineering Application. Master’s Thesis, Shanghai Jiao Tong University, Shanghai, China, 2014. (In Chinese). [Google Scholar]
Figure 1. The bounding surface and first mapping step illustrated in the p-q (meridional) plane.
Symmetry 17 01741 g001
Figure 2. The second mapping step illustrated in the deviatoric stress ratio plane.
Symmetry 17 01741 g002
Figure 3. (a) Definition of stress components in the HCA; (b,c) schematic illustration of the model’s responses during pure principal stress axes rotation, depicted in the ( σ z σ θ ) / 2 ~ τ z θ plane.
Symmetry 17 01741 g003
Figure 4. Typical model responses to undrained monotonic and cyclic triaxial loadings.
Symmetry 17 01741 g004
Figure 5. Typical model predictions for drained rotation of principal stress axes at varying deviator stress.
Symmetry 17 01741 g005aSymmetry 17 01741 g005b
Figure 6. Different strain trajectories during drained principal stress axes rotation: (a) isotropic soil and (b) anisotropic soil.
Symmetry 17 01741 g006
Figure 7. Typical model predictions for undrained rotation of principal stress axes at varying inherent anisotropy.
Symmetry 17 01741 g007
Figure 8. (a) Stress path followed in test R1; (b) model simulation and test data for strain evolution during test R1 on Hangzhou soft clay [14].
Symmetry 17 01741 g008
Figure 9. (a) Stress path followed in test R3; (b) model simulation and test data for strain evolution during test R3 on Hangzhou soft clay [14].
Symmetry 17 01741 g009
Figure 10. Measured and predicted effective stress paths during undrained principal stress axes rotation on Shanghai soft clay (test data from [15]).
Symmetry 17 01741 g010
Figure 11. Measured and predicted strain components’ variation during undrained principal stress axes rotation on Shanghai soft clay (test data from [15]).
Symmetry 17 01741 g011
Table 1. Model constants.
ConstantsHangzhou
Soft Clay
Shanghai
Soft Clay
Calibration
Remarks
Elasticity κ 0.0220.024Oedometer or triaxial test
υ 0.250.03Lateral stress oedometer test
Critical state λ 0.1230.157Oedometer or triaxial test
M c 1.1741.727Triaxial compression test
M e 0.8441.096Triaxial extension test
Rotational
hardening
μ 100150Constant stress ratio test
ω 1.3831.74Theoretically estimated
Stiffness h ¯ 1040Trial-and-error
h ~ 2040Trial-and-error
Flow rule z 0.70.85Trial-and-error
Table 2. Summary of experimental protocols.
Hangzhou Soft Clay [10]
TestDrainage Condition p i n q b α σ
R1Undrained150 kPastage ①: 2.5 kPa → 25 kPa
stage ②: = 25 kPa
stage ③: 25 kPa → failure
0.5stage ①: = 0°
stage ②: 0° → 80°
stage ③: = 80°
R3stage ①: = 2.5 kPa
stage ②: 2.5 kPa → 25 kPa
stage ③: = 25 kPa → failure
stage ④: 25 kPa → failure
stage ①: 0° → 20°
stage ②: = 20°
stage ③: 20° → 80°
stage ④: = 80°
Shanghai Soft Clay [11]
TestDrainage Condition p i n q b α σ
1Undrained150 kPa30 kPa00° → 1260°
(7 cycles)
20.5
31
Disclaimer/Publisher’s Note: The statements, opinions and data contained in all publications are solely those of the individual author(s) and contributor(s) and not of MDPI and/or the editor(s). MDPI and/or the editor(s) disclaim responsibility for any injury to people or property resulting from any ideas, methods, instructions or products referred to in the content.