Abstract
The social interest in outdoor advertising signs, which have been recognized as an important element affecting impressions of a town, has been gradually increasing. However, when these signs are fully scattered around commercial areas, an oppressive feeling may be experienced by people, which cannot be neglected. Thus, this paper attempts to identify the characteristics of such visual oppression in urban landscapes through factor analysis, aiming to control them in such a way that does not oppress people. In addition, comparisons between Japanese and foreign nationals (i.e., foreign students from the Republic of Korea and the People’s Republic of China) were carried out, in order to check for any differences in perception of oppressive feelings depending on nationality. At the same time, to check for the possibility of different levels of perception depending on nationality, 20 Japanese and 20 foreign nationals (including Koreans and Chinese) were selected as test subjects. We expect this study to provide useful research material when reviewing the possibility of creating desirable urban landscapes or establishing guidelines for outdoor advertisements. For the research, landscape pictures focusing on outdoor advertising signs (15 wall, 6 roof-top, and 6 projection advertising signs) were taken as a sample for analysis. They were then presented in a 3D cyberdome for factor analysis, focusing on an impression evaluation test in relation to oppressive feelings. In addition, among the data obtained from the sample analysis, “Proportion,” which was considered to be the most influential factor on the oppressive feeling, was studied. The correlation coefficient between these two populations was 0.918, revealing a high level of correlation; thus, all subjects were treated as a single population. The factor analysis revealed 50.87% for the first factor (Evaluation), 25.39% for the second factor (capacity), and 9.47% for the third factor (Emotion), suggesting a relationship wherein the first factor decreased when the oppressive feeling increased; while the oppressive feeling increased along with the second factor.
1. Background and Objective of Research
Cities or urban landscapes are considered to be visual environments, which are maintained all across the country to keep them in a favorable state [1]. Among them, outdoor advertising signs are elements which have a relatively large influence on their impression. When outdoor advertising signs are highly present in a commercial area—also referred to as “Visual noise”—they are considered to have a harmful psychological effect on people, becoming one of the problems in the urban landscape [2,3,4]. In fact, in Kyoto (Japan), a trial concerning the oppressive impression of a certain building was carried out in an attempt to prove its influence on the otherwise satisfactory city landscape surrounding the building; the study results considered the oppressive feeling arising from the scale (height and/or area) of the building used [4,5,6,7,8]. They showed that such oppressive feelings had started to become a social problem; therefore, the necessity of setting criteria or a measuring method to make judgments on the subject of “oppressive feeling” in urban landscapes has become apparent as well.
There have been many research works focused on creating a good city landscape. Studies concerning the oppressive feeling perceived with respect to the buildings in various construction fields have made much progress (i.e., planting trees to ease the oppressive feeling or researching the permissible limit of such a feeling) [9,10]. Nonetheless, studies related to outdoor advertisement signs, which can be considered as an important landscape element, are still scarce.
Moreover, considering the sophistication of urban cities in the Republic of Korea, city environments have become mechanical and disorderly, where outdoor advertisement signboards cause visual pollution due to their different colors and sizes [11]. Although this may be considered an inevitable and necessary process to go through when a city or town is growing, residents are nonetheless feeling pressure from them.
One of the most important issues in the development process of a city is creating a visually pleasing environment; furthermore, residents have increasingly demanded high-quality urban landscapes. Even though there have been a series of micro-perspective research works in the city planning, civil engineering, and architectural fields, which have been reflected in reality, providing a great effect; however, there has been a growing need for research on satisfying human sensibilities.
Thus, this study seeks to investigate and analyze the current status of outdoor advertising signs in city landscapes, quantify the oppressive feeling felt by people by performing impression evaluations along with a factor analysis, and determine the characteristics of such feelings through correlations with the elements (e.g., percentages, colors, and so on) of outdoor advertising signs and relevant factors. For the experimental setup, a 3D cyber dome which can provide a high sense of realism and immersion was used to create a condition close to an actual environment. The result is expected to be useful when developing guidelines for reducing the oppressive feeling generated by outdoor advertising signs, which is the ultimate objective of this study.
2. Related Research
It is critical to devise an improvement plan through the evaluation of landscapes when conducting urban planning. For this, Hyeon-Soon Lee and Chang-Hwan Kang (2017) attempted to propose an improvement plan for the underrated areas of individual landscape features based on the quantitative evaluation of each landscape type in Changwon City in the Republic of Korea: 60 representative landscapes were carefully selected and classified into six types for image evaluation based on the five categories. As a result, festival, culture, and art landscapes were found to have been overrated, as opposed to industrial and architectural landscapes [12]. Most tourist cities have been trying to attract tourists by upgrading the openness of their landscapes through the improvement of their physical elements. Kyeon-Hwa Byeon and Tai-Yeong Kim (2013) attempted to determine the physical elements that affect urban landscapes by evaluating the openness and attractiveness features of Seongangil Road in the Republic of Korea. Their evaluation items were Openness, Unsatisfactory openness, Dullness, and Attractiveness; the openness of the road rated as being low in general, whereas dullness was rated relatively higher. Moreover, attractiveness was rated low, thus requiring improvement of the openness and/or attractiveness of the road [13]. Therefore, such evaluation of landscapes for the physical improvement of urban landscapes is expected to lead to a significant result.
Research on an evaluation system is also required to evaluate landscapes. Gwang Young Lee and Hak-bong Kyoung (2019) proposed an analysis model for the implementation and evaluation of urban landscape planning based on a normative and phenomenological approach by analyzing the contents of landscape planning, which they applied to the Cheonan and Asan cities of the Republic of Korea; in particular, concerning their deliberation in terms of architectural, public design, and urban dimensions. As a result, 16 approach elements (e.g., ecology, road, skyline, and so on) were drawn up for landscape planning involving the urban dimension, along with 28 details from them [14]. The data obtained from this task can be quite useful when implementing landscape planning. It is quite difficult to perform the actual on-site evaluation of landscape planning, as there are physical limitations to the number of evaluation members actually studying the landscape. Thus, it is appropriate and meaningful to use VR to evaluate the environment created in the same manner as the real one. Won-Pyo Son et al. (2012) proposed a method for selecting a landscape with an excellent level of landscape, technological, and environmental qualities, based on a roadside landscape design evaluation system using VR to measure the level of a driver’s satisfaction with the road; the alternatives obtained from the evaluation were eventually applied. The results showed that drivers were more satisfied while they were driving on the planned road, as compared to a general city road, as the balance and comfort significantly affected their satisfaction [15]. In addition, Hyun Choi (2006) performed road design, wherein a sense of reality was emphasized based on a VR technique, for an environmental impact evaluation. He proposed a visualization technique through the construction of a 3D model and its simulation. His model was designed to become a tool that could efficiently show the final view of a road after it was completed by visually maximizing it [16].
Considering the research works mentioned above, it became clear that the landscapes were evaluated quantitatively, and that the results were used for improvement in the establishment of a city plan. In addition, VR was used to overcome the limitations of landscape evaluation in urban areas. Thus, in this study, we attempted to perform an image evaluation of outdoor advertisement signboards in Urban Landscapes by using VR techniques.
2.1. Landscape and Urban Landscapes
‘Landscape’, as defined in the Article 2 of Chapter 1 of the Korean Landscape Act, refers to the regional characteristics of natural and artificial elements at the boundaries of people’s lives. Further details can be found in [17,18,19]. The definition of landscape may vary between researchers, depending on which area(s) they place academic significance in. This study defines it as “the scenes or surrounding environment of space where people are living, including a physical environment embodying the structures, outdoor signboards, atmosphere, and surrounding environment” [20,21].
Likewise, urban landscapes refer to the environment surrounding everyday urban life, including visual urban landscapes in a narrow sense, or the image or atmosphere of the city environment in a broad sense [22]. All natural and artificial creations, such as forests, trees, water, structures, streetscapes, and outdoor advertisement signboards can be included. As people’s intangible attributes, such as cultural tastes or living environments, can affect urban landscapes, it is a holistic concept involving visual and perceptual views, including historical or cultural venues [23].
Recreating an urban landscape in virtual reality assists in creating a cyberspace in which people can foresee what the future landscape will be like, walk through it, and make adjustments. A variety of conceptual dimensions and details can be reflected in such virtual urban landscapes, until the design is satisfactory enough for the residents. For the virtualization, such as in Data Mountain [24], semantics or layouts need not be defined in advance and users are able to plan a neighborhood environment for webpage snapshots. City of News [25] adopted an urban landscape visualization technique for its webpages, in order to show various neighboring districts (including shopping and banking facilities) as well as adding some additional sections, introducing bookshops and sports events, among others. Meanwhile, the urban landscape example we created shows a dynamically synthesized view reflecting an abstract concept, which is nonetheless realistic to a certain extent. The previously introduced urban landscape design plans did not reflect spatial considerations in the allocation of objects and, so, the concept of parallel co-ordinates [26] was adopted in the proposed approach for the development of urban landscapes [27].
There are many structures in an urban landscape, and it is clear that the sense of openness or oppressiveness that they provide is an important factor. Taeyon Hwang et al. (2009) devised criteria for measuring oppressiveness and openness according to the solid angle of an object, which was used to check the limitations in using the solid angle as an index for evaluating physical oppressiveness or openness [28].
Furthermore, Kurotaki et al. (2005) studied the sense of oppressiveness provided by skyscrapers by conducting an empirical analysis on whether the subjects actually felt oppressiveness from selected high-rise buildings [29]. The street space in an urban landscape is known to be an important key element; Munakata et al. (2008) conducted a research on the factors involving the oppressiveness and openness of urban street spaces while considering regionality [30].
2.2. Outdoor Advertisement Signboards
In the Outdoor Advertisement Act, signboards installed outside are defined as those being shown to the public constantly (or for a certain period), which can be seen at places where people can travel freely [20,23].
Outdoor advertisement signboards play an important role as urban compositional elements, as well as in providing necessary information while being regarded as an important element that determines the impression of urban streetscapes. Nonetheless, their sizes have been becoming larger and larger, and their colors are getting fancier within the individual logic of competition, such that residents often experience psychological pressure due to visual confusion. Thus, in this study, we attempt to analyze such visual pressure experienced by humans as a result of outdoor advertisement signboards, through an empirical study using Virtual Reality (VR). In addition, for the experiment, Japanese subjects were compared with foreigners (Korean and Chinese subjects) to consider differences with respect to nationality.
The main academic significance of the study lies in the fact that an empirical study utilizing VR has been performed for image evaluation, and that a visual judgment was made against outdoor advertisement signboards on the basis of psychological pressures. We expect this study to lead to further studies, enabling the quantitative measurement of visual pressures (i.e., indicating invisible temperatures in figures).
2.3. Virtual Reality and Landscape
As an important visualization technique, VR has been utilized in a variety of industries and has been studied widely for its applications. Some interesting aspects of VR can be found in journals such as Environmental Communication [31] or Landscape and Urban Planning (to be published soon). A series of notable research works have been introduced in these journals: VR-based visualization techniques have been use for environmental communications and with a specific objective, such as a showcase. While all of these works described applications or new technological dimensions of visualization techniques/technologies, a common element was the construction or utilization of VR (see, e.g., Ball, Capanni, and Watt, 2008 [32]; Bishop, Wherrett, and Miller, 2001 [33]; Ghadirian and Bishop, 2008 [34]; Lange, 2011 [35]; Paar, 2006 [36]; Portman, 2014 [37]).
Different from ’visibility’, ’visuality’ is what connects visualization and VR, and has become a significant factor in modern communication technology. Tufte (1990) [38] claimed that visualization was a more effective and efficient method when representing a huge volume of complex data, compared to the traditional methods of representation often used, such as text or voice.
Some researchers (e.g., Bruce, Green, and Georgeson, 1996 [39]; Rose, 2012 [40]) have claimed that the sense of sight is superior to the other human senses in terms of perception and has been recognized as the most popular sense for the modern scientific observation of objects, phenomena, graphics, images, or data or tables relevant to the above, which can all be visualized for easier understanding by viewers (Hansen and Machin, 2013 [41]; Valiela, 2009 [42]; Ware, 2013 [43]). VR is not limited to providing a realistic view or experience but offers more functions when it is used for a designed purpose that requires flexibility or imaginative skills.
Adopting various types of simulation technologies when developing a universal virtual platform or application for a particular industry (e.g., games, automation, communication industry, and so on) has attracted the interest of some researchers engaged in the field of design (e.g., Koutsabasis, Vosinakis, Malisova, and Paparounas, 2012 [44]). The visual quality of VR in an online game such as World of Warcraft or Second Life is superior to that which is being used in the other games or developed by many professional VR research institutions; collaborative research efforts among the design professions or institutions/labs to improve the level of VR-construction skills has not been performed enough, despite its importance in the field of visual design (Gill et al., 2013 [45]; Paar, 2006 [46]; Silvestri, Motro, Maurin, and Dresp-Langley, 2010 [47]). This problem might be related to the fact that the definition of VR has not been properly established or the issue of not knowing which part of the visualization technique should be focused on (i.e., Visuality or Reality).
Simpson (2001) [48] searched for cases involving the application of simulation technologies (visual simulations) in urban planning tasks and introduced an urban landscape simulation methodology, which has been used by one of the regional development and planning labs as an example of adopting a computer-aided and GIS-supported technology. However, he pointed out that such cases requiring interdisciplinary collaboration are still rare and difficult to achieve, due to the costs involved.
Meanwhile, Pietsch (2000) [48] also claimed that most urban planning authorities or research institutions at the time did not have sufficient knowledge about such technologies; however, as they are continuously evolving and becoming more easily available, more effort should be put into researching them. In other words, interdisciplinary research is essential for the development of visual simulation techniques/technologies, which needs to be performed in parallel with the other types of research tasks associated with visual communication technology.
Following the rapid development of the VR-based visualization technologies, a question pertaining to the level of the reality that can be provided by VR has emerged. The level may vary, depending on its application range but, in most cases, users expect it to be as real as possible. The VRs used in the medical and science fields must especially be highly realistic.
One of the examples of requiring such a high level of visualization can be found in the field of telemedicine, which includes real-time medical consultations or on-line remote surgery (Millesi et al., 1997 [49]); such an application can be found in the cases of treating the PTSD of overseas combat veterans or performing brain surgery remotely (Rizzo, Reger, Gahm, Difede, and Rothbaum, 2009 [50]), during which high-resolution or highly ’realistic’ VR can play a vital role. On the other hand, the use of low-grade (i.e., unrealistic) VR can lead to a misdiagnosis or malpractice, as practitioners are not be able to make a proper judgment on a patient’s condition and respond accordingly. Unrealistic VR or a low-performance VR system serves little purpose when evaluating a landscape, as the level of its representation will not be as satisfactory as it should be (Daniel and Meitner, 2001 [51]). In the end, however, determining an agreeable level of abstraction for each application is what really matters (Lange, 2002 [52]; Portman et al, 2015 [53]).
3. Research Plan
The research flow followed the process described in Figure 1. For on-site investigation, test samples were selected from landscape pictures containing outdoor advertising signs [54], which were subjected to a status analysis to perform the impression evaluation. The relationship between Japanese and foreign nationals was then checked; if there were any correlations, then the factor analysis would be performed by considering them to be identical populations, and it would be performed separately if there was no correlation. The relationship between the oppressive feeling and factors or oppressive feeling and the proportion (area ratio) of advertising signs was then calculated, followed by the final comprehensive considerations.
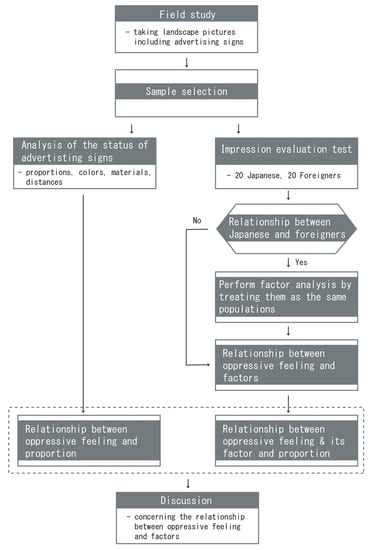
Figure 1.
Research flow.
4. Taking Landscape Pictures and Selecting Experimental Samples
Pictures of 27 urban landscapes including typical walls, rooftops, and protruded advertising signs were taken from the viewpoint of the pedestrians walking on a sidewalk to conduct an impression evaluation for outdoor advertising signs. The pictures were then reproduced in the 3D cyberdome and the resulting urban landscapes were quite similar to the real ones, as the images were recreated in three dimensions.
The landscape samples are shown in Figure 2, wherein a number of urban districts were selected for taking pictures with a digital camera (Nikon D100) during the period June, 19–21. The image data was input by using the Adobe Photoshop 7.0.1J software while capturing 72 ppi (pixels per inch) landscape images with size of 1024 × 1024 pixels. Individual landscape images are shown in Figure 2.
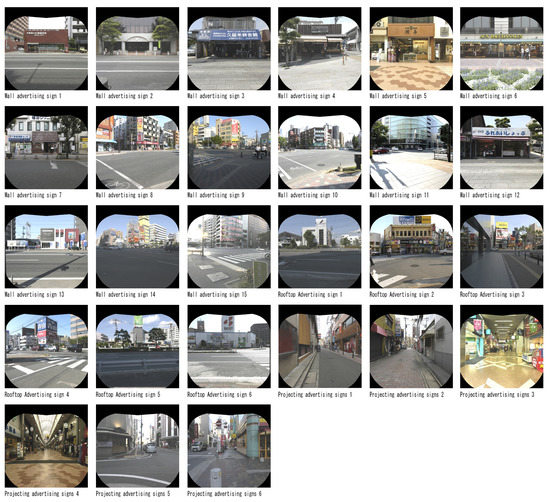
Figure 2.
Urban outdoor advertisement sample. The images used in this study were taken in Fukuoka town.
A tripod was used, and the level and vertical alignment were adjusted at a height of 130 cm. In the landscapes to be presented to the subjects, 15 images containing wall advertisements, 6 images containing rooftop advertisements, and 6 images containing projection signboards were selected (for a total of 27 images). The pictures were taken in such a way that the surrounding conditions could be recognized sufficiently, with a central focus on the road.
The reason for setting the height at 130 cm by using a tripod when shooting the landscapes was that we speculated that the average camera view of East Asian subjects would be about 130 cm, even though their respective physical heights may be different. Furthermore, the reason for choosing more wall advertising sign pictures (wall 15, rooftop 6, and outdoor 6) was that they are included in the majority of urban landscapes. Meanwhile, it was important to set the resolution at 72 ppi (pixels per inch) with a size at 1024 × 1024 in order to make the result seem real when creating a 3D cyberdome. Photoshop was used to edit the pictures, even though other graphic programs could have been used as well.
5. Situational Analysis of Outdoor Advertising Signs in Sample Pictures
A situational analysis was conducted using the sample pictures taken in a downtown area. Information regarding the distance, proportion, number, and color of individual outdoor advertising signs was collected, which plays an important role in understanding the visual oppressiveness level.
The outdoor advertising signs in the selected sample pictures were analyzed based on their Distance, Proportion, and Color (base and medium). Distance refers to the distance from a wall or a rooftop advertising sign to the building where it is installed. For a projection signboard, the measurement was taken between the buildings at both ends of the road where the signs were installed. In other words, calculations were performed based on either a traffic lane (3.5 m), a sidewalk (3 m), or a step length. Proportion refers to the proportion between the area of advertisement sign(s) and the picture view. Due to limitations in the experiment, however, the proportion was calculated based on the ratio between the area of outdoor advertising sign(s) and the viewable range that the 3D cyber dome was able to present, regarding it as being 100%. Meanwhile, for the colors, the basic colors of red, yellow, green, blue, and purple of the Munsell color system were used, along with white and black, to analyze the base and medium colors of advertising signs. Table 1 shows the analysis of landscape samples of wall advertising signs; Table 2 presents the analysis of landscape samples of rooftop advertising signs; and Table 3 shows the analysis of landscape samples of projection advertising signs.

Table 1.
Analysis of landscape samples of wall advertising signs.
Table 2.
Analysis of landscape samples of rooftop advertising signs.
Table 3.
Analysis of landscape samples of projection advertising signs.
The Munsell color system was devised by Albert Henry Munsell in the early 20th century, which adopts shade, brightness, and chroma to represent a color space. After being adopted as an official color system for the study of soils in the 1930s, it has been widely used for the evaluation of Asian urban landscapes.
The Ground Color refers to the base color of an outdoor advertising sign, whereas Medium refers to the color(s) of letters or characters.
In Table 1, the distance between the wall advertising signs and camera ranged from 5 to 25 m, whereas the proportion and the number of wall advertising signs were from 0.5%–12% and 1–50, respectively. For wall advertising signs, a variety of ground colors, such as red, blue, yellow, green, white, and black, were used as the base color; but the color white was mainly used. For the same types of signs, the colors for the letters also varied but the major color was either black or white.
Meanwhile, in Table 2, the distance between the rooftop advertising signs and camera ranged from 10 to 21 m, whereas the proportion and the number of wall advertising signs were from 1.5%–6% and 1–3, respectively. Similar to the wall advertisement signs, a variety of ground colors were used as the base color, but white was mainly used. Also, many colors were used for the letters, but the major color was either black or white.
In Table 3, the distance between protruding advertising signs and the camera ranged from 4 to 13 m, whereas the proportion and the number of wall advertising signs were from 1%–4.5% and 2–24, respectively. A wide variety of colors (e.g., white, black, blue, red, yellow, green, and purple) were used as the ground color or medium, but the majority were white.
6. Impression Evaluation Test
An empirical test was performed for the subjects by using the realistic 3D urban landscape images, which were quite immersive.
A test was performed for the impression evaluation at Ohashi Campus, Kyushu University using a 3D cyber dome. The test subjects included 40 undergraduate and graduate students (Kyushu University) consisting of 20 Japanese and 20 foreign students (from the Republic of Korea and People‘s Republic of China).
6.1. Test Environment
Although it would have been desirable to conduct the test directly at the street sites for the impression evaluation of landscapes including outdoor advertising signs, most preceding studies have used slides, PC monitors, or printed pictures to do so. Thus, this study attempted to use a 3D cyber dome, which we expected to provide a high sense of realism and immersion.
Research on the depth of objects in the cyberdome was first performed to find out whether it was possible to evaluate landscapes by using a 3D cyberdome. This was an experiment to investigate whether the distance presented in the cyberdome corresponded psychologically with the perceived distance as much as the physical aspect. As a result, it was confirmed that the matching accuracy was higher when the distance was close (10–40 m). This finding was used to perform a 3D cyberdome-based urban landscape evaluation [23,55,56,57,58].
A schematic drawing of the 3D cyberdome test environment is shown in Figure 3. The height of the cyber dome was 260 cm and the subject’s line of sight while sitting on the chair was set at 130 cm (the center of the dome’s height). Figure 4 shows the profile of the 3D cyberdome at Kyushu University, Japan. The explanation for Figure 3 is as follows: the two beam projectors positioned at the top of the cyberdome project separate images, which are reflected in a plane mirror to create VR images in the dome, as seen by the subject wearing a pair of polarizing lens. In this case, one eye sees the image projected by one of the two projectors, whereas the other eye sees the image projected by the other projector. Furthermore, to avoid the subject’s head from interfering with the images, they keep a distance of 65 cm while maintaining their eye level at 130 cm from the ground. Picture (a) in Figure 4 portrays the scene captured from the top of the 3D cyberdome, whereas picture (b) shows the scene from the side.
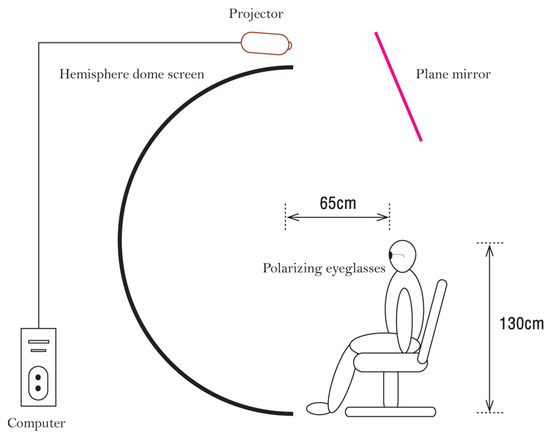
Figure 3.
Schematic drawing of the 3D cyber dome test environment.
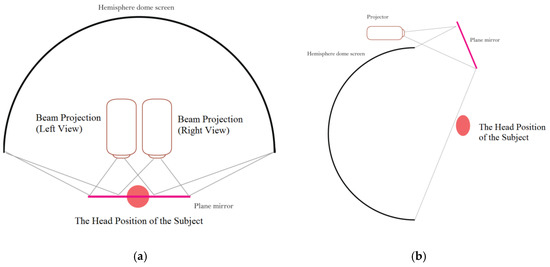
Figure 4.
3D cyber dome profile: Kyushu University in Japan. (a) Position of beam projection from above, (b) Position of beam projection from side.
6.2. Rating Scale
Considering the preceding studies in the field of architecture, 15 categories considered to have a close relationship with the impression evaluation of landscapes tested in this study were selected from the rating scales associated with “Oppressive Feeling”, which were presented to the subjects.
Meanwhile, 15 scale items were also selected from the studies conducted for the correlations between structures and psychological oppressiveness (Tae-Yon Hwang et al., (2009) [27]; Kurotaki et al., (2005) [28]; and Munakata et al., (2008)) focusing on the oppressiveness/openness in urban landscapes and the oppressiveness provided by skyscrapers [29]. These items include evaluation, competency, and emotional content. As mentioned earlier, the scale items were extracted from previous studies associated with investigating the visual psychology of oppressiveness of structures and urban landscapes.
The scale items for oppressiveness (Figure 5) were selected based on the research works mentioned above [13].
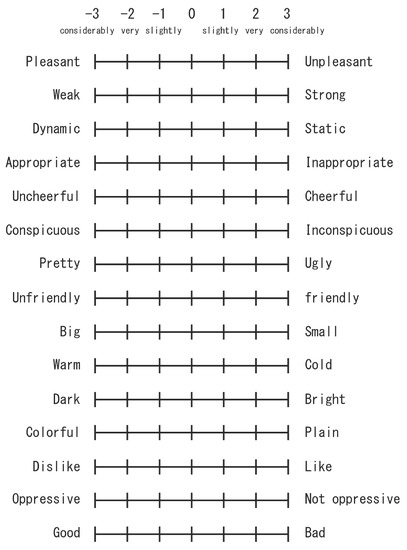
Figure 5.
Categories for the oppressive feeling scale.
As shown in Figure 5, each rating scale had 7 stages, where “Neither” was placed in the middle, whereas the determiners “Slightly,” “Very,” and “Considerably” were added to both ends, to which the corresponding points −3, −2, −1, 0, +1, +2, and +3 were given, in order to calculate the average values and standard deviations.
6.3. Test Method
The objective, contents, and method (evaluation of entire landscapes in sample pictures) of the experiment were explained to the test subjects in advance, along with precautions. They then proceeded to the test by being handed answer sheets after being seated at the central position, facing toward the dome. No time was set, in order to allow the subjects to evaluate their impressions autonomously while they completed the sheet and moved to the next image. Although there were some individual time differences in the completion of the test, the average time of completion was approximately 40 min.
7. Comparison between Japanese and Foreigners
7.1. Correlations
The correlations between Japanese and foreigners, as identified through the impression evaluation of landscapes, are shown in Table 4 and Table 5 and Figure 6. The correlation coefficients of the oppressive feeling and rating scales other than oppressive feeling were 0.918 and 0.833, respectively. Such results confirmed that they both had a very high positive relationship.
Table 4.
Correlation coefficient between Japanese and foreign nationals associated with oppressive feeling. (**: p < 0.01).
Table 5.
Correlation coefficient between Japanese and foreign nationals associated with rating scales excluding oppressive feeling. (**: p < 0.01).
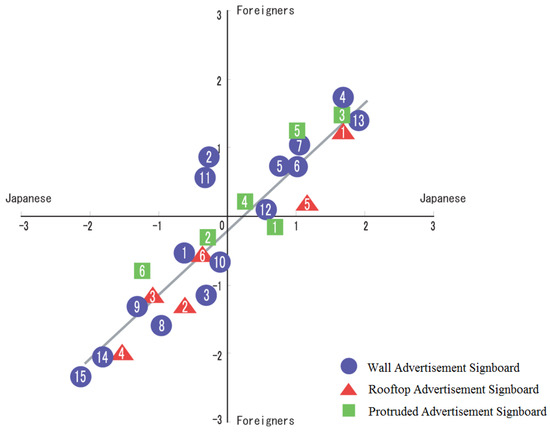
Figure 6.
Scatter diagram of the correlations between Japanese and foreign nationals associated with oppressive feelings.
For the item Oppressiveness in Table 4, the correlations were the same (0.918) between Japanese and foreigners, and were considered to be quite high. Their graphic representation showed that they were distributed in a positive direction (Figure 6). The correlations with the other evaluation items were also high (0.838) between the parties, as shown in Table 5.
7.2. Comparison Based on Factor Analysis
A factor analysis was performed, based on the data obtained from the landscape impression evaluation test. Table 6 and Table 7 show the Japanese and foreign national cases, respectively. In addition, the major factor method and varimax method for Kaiser normalization were used as a factor-extraction method and a rotation method, respectively. The comparison of rating scales contributing to individual factors confirmed that the factors were almost identical.
Table 6.
Japanese factor load.
Table 7.
Factor load for foreigners.
The reason for separating the subjects into Japanese and foreign nationals when performing the factor analysis was that the 27 landscapes presented in this study were from a Japanese city, such that familiarity with such scenes could be quite different and the analysis result may have produced varying results.
For No. 1 (Table 6), Good-Bad, Pretty-Ugly, Dislike-Like, Pleasant-Unpleasant, Appropriate-Inappropriate, and Unfriendly-friendly were loaded, in that sequence, with a contribution ratio of 49.7%; whereas, for No. 2, the loading sequence was Weak-Strong, Conspicuous-Inconspicuous, Colorful-Plain, Dark-Bright, Big-Small, and Dynamic-Static, and the resulting contribution ratio was 23.26%. The loading sequence for No. 3 was Warm-Cold followed by Oppressive-Cheerful, revealing a contribution ratio of 10.81%.
Furthermore, for No. 1 (Table 7), Good-Bad, Pretty-Ugly, Dislike-Like, Pleasant-Unpleasant, Appropriate-Inappropriate, Unfriendly-friendly, Weak-Strong, Conspicuous-Inconspicuous, and Colorful-Plain were loaded, in that sequence, with a contribution ratio of 52.71%; whereas, for No. 2, the loading sequence was Dark-Bright, Big-Small, and Dynamic-Static and the resulting contribution ratio was 23.90%. The loading sequence for No. 3 was Warm-Cold and then Oppressive-Cheerful, revealing a contribution ratio of 8.55%.
As an exploratory factor analysis was performed in this research, the most universal factor rotation ‘varimax rotation’ was used. Table 6 shows the factor analysis result for the Japanese subjects, whereas Table 7 shows the results of the foreigners. After comparing the correlations in each items, which were at a positively high level (Table 7), we decided to treat these groups as the same.
7.3. Comparison Result
Both Japanese and foreign nationals had high positive correlation in terms of the Oppressive Feeling or other Rating Scales. Moreover, although the rating points for factor No. 3 were different, it was decided that both sides would be treated as the same population, as its contribution was minimal.
8. Analysis of Characteristics of Oppressive Feeling
8.1. Factor Analysis (Considering both Japanese and Foreigners to Be the Same Population)
Table 8 presents the factor matrix obtained from the factor analysis, resulting in the dispersion of 50.87% of the No. 1 factor, 25.39% of the No. 2 factor, and 9.47% of the No. 3 factor; establishing a cumulative contribution ratio of 85.73%.
Table 8.
Factor loads when treating both Japanese persons and foreigners as being part of the same population.
Meanwhile, the loading sequence for No. 1 (Table 8) was as follows: Good-Bad, Pretty-Ugly, Dislike-Like, Pleasant-Unpleasant, Appropriate-Inappropriate, Unfriendly-friendly, and Weak-Strong, with a contribution ratio of 50.87%; whereas the sequence for No. 2 was Conspicuous-Inconspicuous, Colorful-Plain, Dark-Bright, Big-Small, Dynamic-Static, and Warm-Cold, with resulting contribution ratio of 25.39%. Only Oppressive-Cheerful was loaded in No. 3, with a contribution ratio of 9.47%. Thus, we attempted to set factor names for Nos. 1, 2, and 3, which were decided as Evaluation, Capacity, and Emotion, respectively.
The No. 1 factor was defined as an evaluation factor as its loads reflected the evaluations of the seven scales Good-Bad, Pretty-Ugly, Dislike-Like, Pleasant-Unpleasant, Appropriate- Inappropriate, Unfriendly-Friendly, and Weak-Strong. At the same time, the No. 2 factor was defined as a capacity factor, as its high loads reflecting the six scales Conspicuous-Inconspicuous, Colorful-Plain, Dark-Bright, Big-Small, Dynamic-Static, and Warm-Cold. Finally, the No. 3 factor was defined as an emotional factor, as its load reflecting a single scale, Oppressive-Cheerful, was high.
8.2. Relationship between Oppressive Feeling and Each Factor
The relationships between oppressive feeling and each factor, based on the factor analysis using the data obtained from the impression evaluation, are shown in Table 9 and Figure 7 and Figure 8.
Table 9.
Correlations between oppressive feelings and each factor. (**: p < 0.01).
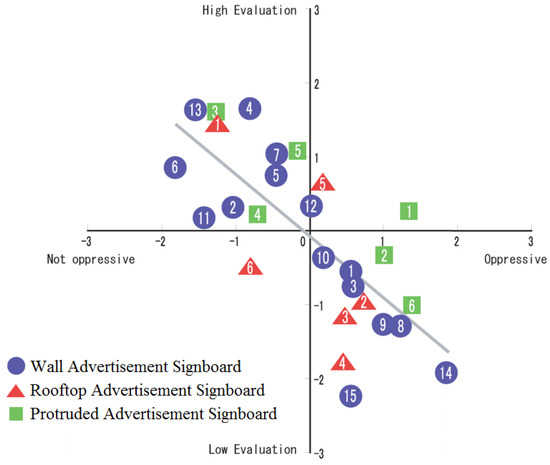
Figure 7.
Scatter diagram of correlations based on the oppressive feeling and evaluation factor values.
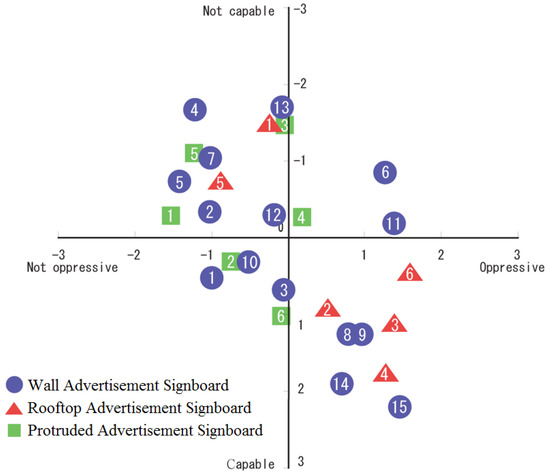
Figure 8.
Scatter diagram of correlations based on the oppressive feeling and capacity factor values.
Figure 7 shows the distribution of correlations according to the individual scores obtained between oppressiveness and evaluation factor, which was the first factor. Meanwhile, Figure 8 shows the distribution of correlations according to the individual scores obtained between oppressiveness and the competency factor, which was the second factor. Meanwhile, Table 9 represents the correlations between oppressiveness and each factor. The resulting values for the evaluation factor, competency factor, and emotional factor (third factor) were −0.736, 0.562, and 0.302, respectively.
As the third factor (involving Feeling) showed a low level of relationship, the correlation coefficients were calculated based on the evaluations made on the first factor and the capacity of the second factor. In this case, the correlation coefficients between oppressive feeling and the factor point obtained for each landscape sample could be identified. Additionally, by observing their positions, it is possible to check the relational tendency between the evaluation and capacity factors against oppressive feeling in each landscape sample. The value of the No. 1 (No. 2) factor (capacity factor) became lower (higher) as the value of the oppressive feeling increased.
8.3. Relationship between Oppressive Feelings and Each Factor
The correlations between oppressive feelings and proportions in the 27 kinds of landscapes including wall, rooftop, and projection advertising signs subjected to evaluation are shown in Table 10.
Table 10.
Correlation between proportion and oppressive feelings.
In addition, the individual scatter diagrams are illustrated in Figure 9 (wall advertising signs), Figure 10 (rooftop advertising signs), and Figure 11 (projection advertising signs). Comprehensively, in a positive correlation, the oppressive feeling increased when the proportion increased or vice versa. There was a high correlation between oppressive feeling and proportion of rooftop advertising signs, as well as relatively strong correlations between oppressive feelings and wall or projection advertising signs. Thus, it is possible to conclude that the differences in impression evaluation results obtained from the sample pictures were closely related to the proportion of outdoor advertising signs.
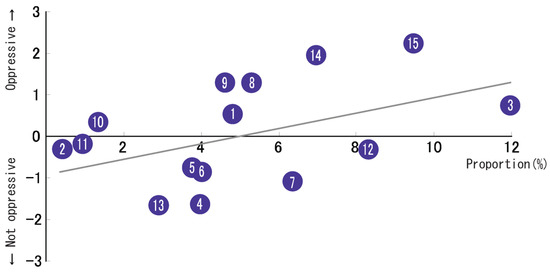
Figure 9.
Correlation between proportion and oppressive feelings (wall advertising signs).
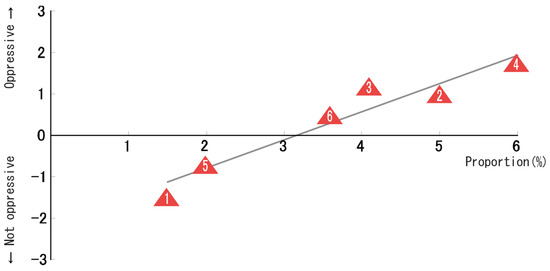
Figure 10.
Correlation between proportion and oppressive feelings (rooftop advertising signs).
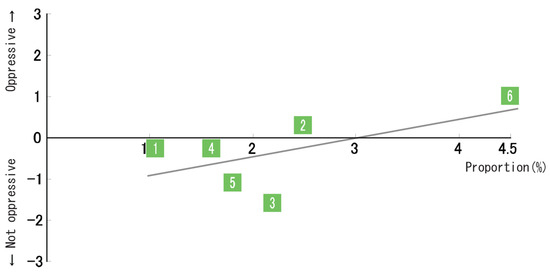
Figure 11.
Correlation between proportion and oppressive feelings (projection advertising signs).
8.4. Relationship between the Oppressive Feeling Factor and Proportion
The correlations between factors and proportions in the 27 kinds of landscapes including wall, rooftop, and projection advertising signs subjected to evaluation are presented in Table 11 and Figure 12 (wall advertising signs), 13 (rooftop advertising signs), and 14 (projection advertising signs). In these cases, it is possible to find the individual positions of each landscape sample, having two axes (No. 1 factor—evaluation and No. 2 factor—capacity). Additionally, the relationship between the No. 1 or No. 2 factors and their proportion can be determined by dividing the proportions in the landscapes into three groups based on their area ratios, from the lowest to highest percentage (i.e., Low, Medium, and High).
Table 11.
Grouping based on proportion levels (outdoor advertising signs).
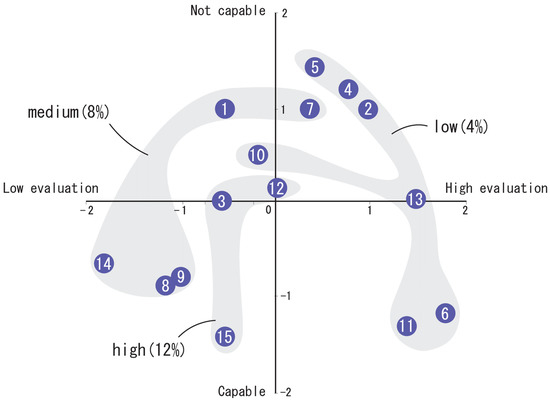
Figure 12.
Scatter diagram based on the proportion levels (wall advertising signs).
Observing Figure 12, which considers wall advertising signs, the Low (Medium) Proportion Group included “Low Evaluation” and “High Capacity.” The High Proportion Group included “Low Evaluation” and both “Low Capacity” and “High Capacity.” For rooftop advertising signs (Figure 13), the Low Proportion Group included both “High Evaluation” and “Low Evaluation” with “Low Capacity.” Meanwhile, the Medium Proportion Group included both high evaluations and proportions, whereas the High Proportion Group included “Low Evaluation” and “High Capacity.” On the other hand, for projection advertising sings (Figure 14), the Low Proportion Group had “Low Evaluation” and “Low Capacity”; whereas the Medium Proportion Group included both “High Evaluation” and “Low Evaluation”, as well as both “High Capacity” and “Low Capacity.” Finally, the High Proportion Group included “Low Evaluation” with neither capacity, for the most part.
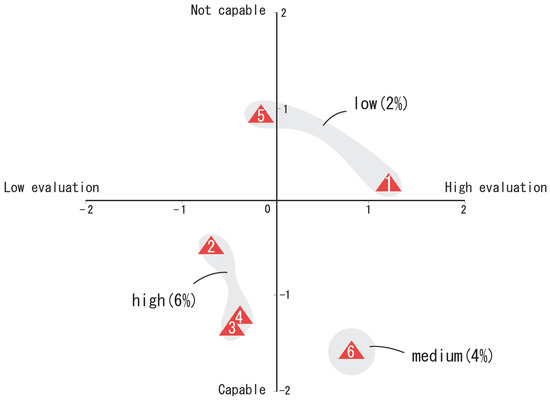
Figure 13.
Scatter diagram based on the proportion levels (rooftop advertising signs).
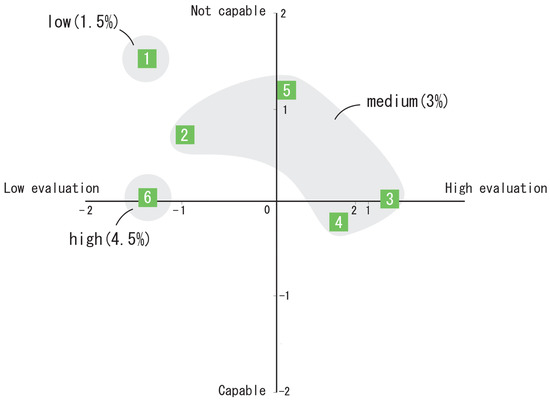
Figure 14.
Scatter diagram based on the proportion levels (projection advertising signs).
In this section, the interpretation of the factor analysis performed in this study is discussed. The No. 1 and 2 factors were defined as evaluation and capacity, respectively. When re-interpreting them as elements associated with a landscape; however, it is possible to consider the evaluation factor as being related to the comfort of the landscape, whereas the capacity factor is related to its impact. In other words, a landscape with a high evaluation can be considered to be highly comfortable; whereas a landscape with high capacity has strong impact.
Next, the results deviating from the tendencies identified from the analysis results should be discussed. For example, the cases of a landscape having a high value of oppressive feeling but low proportion of outdoor advertising signs, or a landscape having a low value of oppressive feeling but high proportion of outdoor advertising signs should be considered and the possibility of the existence of unidentified elements other than the present factors and proportions should be checked for.
In the case involving sample No. 7 in Figure 12, belonging to the Medium (8%) Proportion Group yet resulting in a high evaluation with low oppressive level, the oppressive feeling was considered to have been reduced by the trees planted on both sides of the landscape [10]. Moreover, in the case of sample 10, belonging to a Low Proportion Group yet having a higher oppressive level and low evaluation value, such a result was presumed to be attributable to the height of the building, as well as the tall buildings lining both sides. Sample Nos. 6 and 11 did not provide any oppressive feeling while attaining a high capacity value, even though they belonged to the Low (4%) Proportion Group; this may have been due to the large proportion of building glass in the image. Sample Nos. 1 and 5 in Figure 13 belonged to the same Low Proportion Group, but the former received a high evaluation whereas the latter got a low evaluation; this could have been the result of the rooftop advertising sign having a long horizontal length, making it seem unstable. The landscape of sample No. 1 in Figure 14 was considered to be oppressive and was given a low evaluation score, even though it had a low proportion of 1.5% and the height of the building was considered to stand relatively high on a narrow street. Finally, the landscape of sample No. 2 was the only landscape with a low evaluation in the Medium Proportion Group (3%); the raw materials used for the road and buildings were assumed to have affected the results.
As such, although there were no definite tendencies found against the oppressive feeling, in relation to colors, materials, or distances, it is still possible that some impact actually does exist between them. Therefore, this subject merits further investigation in future studies.
9. Conclusion
In this study, we attempted to identify the relationships between outdoor advertising signs and oppressive feeling through the experimental analysis of landscapes focusing on the visual sense of pressure provided by outdoor advertising signs in an urban landscape. In addition, the cases of both Japanese and foreign nationals were investigated, in order to check for any cultural differences in feeling oppressive pressure.
The results showed that there were a number of correlations between the two populations; as the factors involved were almost identical, we treated the whole sample as a population when performing further analyses.
For most urban landscapes, it was confirmed that the correlation between the proportion of rooftop advertising signs and oppressiveness was positively related; this was in agreement with previous studies, except for in special cases [29].
As for the tendency in the relationship between outdoor advertising signs and oppressive feeling, the oppressive feeling was reduced with an increase in the value of the first factor (Evaluation) in the factor analysis, and vice versa. In addition, the value of the same feeling increased with an increase in the value of the second factor (Capacity), and vice versa.
It was found that there was a positive correlation between oppressiveness and proportion of outdoor advertising signs, such that the former increased when the latter was high or vice versa. However, as pointed out in the consideration, there were some cases that did not follow such a tendency and, therefore, it is necessary to check for correlations between the other elements. Further validation will be performed in future research work.
In this study, a 3D-cyberdome was used for the first time, to our knowledge, for the evaluation of outdoor advertising signs in a downtown area, as a measure to overcome the limitations in the evaluation by offering more scalability. This study makes it possible to move one step closer to identifying the relationships between the proportion of outdoor advertising signs and visual psychological “oppressiveness” in urban landscapes. We intend to further this effort through continuous research from this point. It may be possible to use the visual psychological element referred to as “oppressiveness” felt by humans when witnessing outdoor advertising signs when rigorously defining an “outdoor advertising sign”. The necessity of researching similar elements in detail is currently on the rise. We have found that controlling the placement of outdoor advertising signs based on the idea of visual psychological oppressiveness can heighten the level of comfort in an urban landscape. Finally, this study presented the results obtained from Asian research subjects (Japanese, Korean, and Chinese) using a study area in a Japanese downtown; therefore, we would like to note that these results may vary depending on the subject’s nationality and study area.
Author Contributions
Conceptualization, Y.-W.L. and J.-H.H.; Data curation, Y.-W.L.; Formal analysis, Y.-W.L.; Funding acquisition, J.-H.H.; Investigation, Y.-W.L.; Methodology, Y.-W.L.; Project administration, J.-H.H.; Resources, Y.-W.L.; Software, Y.-W.L. and J.-H.H.; Supervision, J.-H.H.; Validation, Y.-W.L. and J.-H.H.; Visualization, J.-H.H.; Writing—original draft, Y.-W.L. and J.-H.H.; Writing—review and editing, J.-H.H. All authors have read and agreed to the published version of the manuscript.
Funding
This research was supported by the Energy Cloud R&D Program through the National Research Foundation of Korea (NRF) funded by the Ministry of Science, ICT (NRF-2019M3F2A1073385). Also, this work was supported by the National Research Foundation of Korea (NRF) grant funded by the Korea government (MSIT) (No. 2017R1C1B5077157).
Conflicts of Interest
The authors declare no conflict of interest.
References
- Sato, Y. A Study on Visual Optimization and Landscape Control of Urban Signs. Ph.D. Thesis, Kyushu University, Fukuoka, Japan, 1998; pp. 1–32. [Google Scholar]
- Outdoor Advertisement Research Society. Knowledge—Design Edition for Outdoor Advertisement; Gyousei Co., Ltd.: Tokyo, Japan, 2006. [Google Scholar]
- Takeyama, R. Sign Design Notebook; Japan Sign Design Association: Tokyo, Japan, 2005; pp. 1–23. [Google Scholar]
- Amanuma, H. Impression Evaluation of Video Display in Hemisphere Dome Video Display Systems: Verification of Sense of Length and Depth in Cyber Domes. In Proceedings of the 11th Conference of Japan Virtual Reality Conference, Aizu, Japan, 6–9 September 2006; pp. 51–54. [Google Scholar]
- Takei, M.; Ohara, M. A Study on Measurement of Oppressive Feelings 1—Meaning and Test Equipment; Research Report Collection, No. 261; Architectural Institute of Japan (AIJ): Tokyo, Japan, 1977; pp. 105–114. [Google Scholar]
- Takei, M.; Ohara, M. A Study on Measurement of Oppressive Feelings 2—Physical Scale and Responses; Research Report Collection, No. 262; Architectural Institute of Japan (AIJ): Tokyo, Japan, 1977; pp. 103–113. [Google Scholar]
- Takei, M.; Ohara, M. A Study on Measurement of Oppressive Feelings 3—Relationship between the Distance to Buildings and the Building Colors; Research Report Collection, No. 263; Architectural Institute of Japan (AIJ): Tokyo, Japan, 1978; pp. 71–80. [Google Scholar]
- Takei, M.; Ohara, M. A Study on Measurement of Oppressive Feelings 4—Comparison with Tolerance Settings and Shadows; Research Report Collection, No. 310; Architectural Institute of Japan: Tokyo, Japan, 1981; pp. 98–106. [Google Scholar]
- Takei, M.; Fukushima, K. A Study on Effect of Plant Trees Alleviating Oppressive Feeling; Research Report Collection, Architectural Institute of Japan, No. 332; Architectural Institute of Japan (AIJ): Tokyo, Japan, 1983; pp. 102–110. [Google Scholar]
- Architectural Institute of Japan. Conference Lecture Summaries; Architectural Institute of Japan (AIJ): Tokyo, Japan, 2002; pp. 813–814. [Google Scholar]
- Lee, Y.W.; Fuji, K.; Sato, Y. A Study on Perception of Depth in Stereoscopic Image presentations: Extraction of Sensory Property Using 3D Cyber Dome. Art Eng. Soc. J. 2007, 44, 71–78. [Google Scholar]
- Lee, H.-S.; Kang, C.-H. A Study on Landscape Evaluation and Impression Enhancement in City of Changwon. J. Assoc. Korean Photo-Geographers 2017, 27, 131–146. [Google Scholar]
- Byun, K.-H.; Kim, T.-Y. Evaluation on the Sense of Openness and Interest in Seong-An Gil, Cheongju. J. Reg. Assoc. Archit. Inst. Korea 2013, 15, 27–36. [Google Scholar]
- Lee, G.Y.; Kyoung, H.-B. A Study on the Urban-landscape Planning and Evaluating Framework on Urban Level. J. Korea Inst. Spat. Design 2019, 14, 81–89. [Google Scholar]
- Son, W.-P.; Jang, H.-R.; Kang, J.-Y.; Lee, J.-H. The Realization of Scenic Road Utilizing VR Evaluation System for Road Landscape Architecture Design. J. Korea Landsc. Counc. 2012, 4, 85–101. [Google Scholar]
- Choi, H. The Environmental Impact Assessment of at Road Design in the Light of the Sense for the Real from the Virtual Reality. J. Korea Inst. Inf. Commun. Eng. 2006, 10, 1842–1847. [Google Scholar]
- Dolores, H. The Power of Place: Urban Landscapes as Public History; MIT Press: Cambridge, MA, USA, 1997. [Google Scholar]
- Lee, J.; Park, B.-J.; Tsunetsugu, Y.; Kagawa, T.; Miyazaki, Y. Restorative effects of viewing real forest landscapes, based on a comparison with urban landscapes. Scand. J. For. Res. 2009, 24, 227–234. [Google Scholar] [CrossRef]
- Hansen, A.; Machin, D. Researching visual environmental communication. Environ. Commun. 2013, 7, 151–168. [Google Scholar] [CrossRef]
- Nilsendahl, C. A landscape engine for a new generation of open world games. In ACM SIGGRAPH 2015 Talks; ACM: New York, NY, USA, 2015; No.17. [Google Scholar]
- Vanessa, F.-M.; Soto, V.; Hohwald, H.; Frias-Martinez, E. Characterizing urban landscapes using geolocated tweets. In Proceedings of the 2012 International Conference on Privacy, Security, Risk and Trust and 2012 International Confernece on Social Computing, Amsterdam, The Netherlands, 3–5 September 2012; IEEE: Piscataway, NJ, USA, 2012. [Google Scholar]
- Kada, M.; Roettger, S.; Weiss, K.; Ertl, T.; Fritsch, D. Real-time visualisation of urban landscapes using open-source software. In Proceedings of the ACRS, Busan, Korea, 3–7 November 2003. [Google Scholar]
- Lee, Y.-W. Research regarding a method for controlling outdoor advertisements based on oppressiveness. Ph.D. Thesis, Kyushu University, Fukuoka, Japan, 2008; pp. 1–43. [Google Scholar]
- Robertson, G.; Czerwinski, M.; Larson, K.; Robbins, D.C.; Thiel, D.; Van Dantzich, M. Data Mountain: Using Spatial Memory for Document Management. In User Interface Software and Technology (UIST); ACM Press: San Francisco, CA, USA, 1998; pp. 153–162. [Google Scholar]
- Sparacino, F.; DeVaul, R.; Wren, C.; MacNeil, G.; Daveport, G.; Pentland, A. City of News. In Proceedings of the ACM SIGGRAPH 99, Visual Proceedings, Emerging Technologies, Los Angeles, CA, USA, 8–13 August 1999. [Google Scholar]
- Inselberg, A.; Dimsdale, B. Parallel Coordinates: A Tool for Visualizing Multi- Dimensional Geometry. In Proceedings of the IEEE Conference on Visualization, San Francisco, CA, USA, 23–26 October 1990; pp. 361–378. [Google Scholar]
- Derthick, M.; Christel, M.; Hauptmann, A.; Ng, D.; Stevens, S.; Wactlar, H. A Cityscape Visualization of Video Perspectives. In Proceedings of the National Academy of Sciences Arthur M. Sackler Colloquium on Mapping Knowledge Domains, Irvine, CA, USA, 9–11 May 2003; pp. 1–2. [Google Scholar]
- Taeyon, H.; Kyeonghwa, B.; Nozomu, Y.; Jun, M.; Kotaroh, H. A Study of Allowable Value of the Sense of Physical Oppression and the Sense of Openness by Solid Angle: A study on the sense of physical oppression and the sense of openness created in urban spaces Part 3. J. Environ. Eng. 2013, 78, 437–444. (In Japanese) [Google Scholar]
- Hwang, T.; Byun, K.; Yoshizawa, N.; Munakata, J.; Hirate, K. An experimental study on evaluating the indicators of the sense of physial oppression created in urban space. J. Environ. Eng. 2009, 74, 659–666. (In Japanese) [Google Scholar] [CrossRef][Green Version]
- Hidenori, K.; Yuusuke, I.; Yukihiro, K.; Noriyoshi, Y.; Tatuso, O. A study on the oppresive feeling by the very high buildings. J. Environ. Eng. (Trans. AIJ) 2005, 2005, 799–800. (In Japanese) [Google Scholar]
- Kyousei publisher. Knowledge of Outdoor Advertising; Kyousei publisher: Tokyo, Japan, 2019. (In Japanese) [Google Scholar]
- Ball, J.; Capanni, N.; Watt, S. Virtual reality for mutual understanding in landscape planning. Int. J. Soc. Sci. 2008, 2, 78–88. [Google Scholar]
- Bishop, I.D.; Wherrett, J.R.; Miller, D.R. Assessment of path choices on a country walk using a virtual environment. Landsc. Urban Plan. 2001, 52, 225–237. [Google Scholar] [CrossRef]
- Ghadirian, P.; Bishop, I.D. Integration of augmented reality and GIS: A new approach to realistic landscape visualisation. Landsc. Urban Plan. 2008, 86, 226–232. [Google Scholar] [CrossRef]
- Lange, E. We can visualise. Now what? Landsc. Urban Plan. 2011, 100, 403–406. [Google Scholar] [CrossRef]
- Bretar, F.; Chehata, N. Terrain modeling from LiDAR range data in natural landscapes: A predictive and Bayesian framework. IEEE Trans. Geosci. Remote Sens 2010, 48, 1568–1578. [Google Scholar] [CrossRef]
- Portman, M.E. Visualization for planning and management of oceans and coasts. Ocean Coast. Manag. 2014, 98, 176–185. [Google Scholar] [CrossRef]
- Tufte, E.R. Envisioning Information; Graphics Press: Cheshire, CT, USA, 1990. [Google Scholar]
- Bruce, V.; Green, P.R.; Georgeson, M.A. Visual Perception: Physiology, Psychology and Ecology; Psychology Press: Hove, UK, 1996. [Google Scholar]
- Rose, G. (Ed.) Visual Methodologies: An Introduction to Researching with Visual Materials; SAGE Publications Ltd.: Thousand Oaks, CA, USA, 2012. [Google Scholar]
- Yuan, Y. Paving the road for virtual and augmented reality [standards]. IEEE Consum. Electron. Mag. 2017, 7, 117–128. [Google Scholar] [CrossRef]
- Valiela, I. Doing Science: Design, Analysis and Communication of Scientific Research; Oxford University Press: New York, NY, USA, 2009. [Google Scholar]
- Ware, C. Information Visualization: Perception for Design; Elsevier Inc.: Waltham, MA, USA, 2013. [Google Scholar]
- Koutsabasis, P.; Vosinakis, S.; Malisova, K.; Paparounas, N. On the value of virtual worlds for collaborative design. Design Stud. 2012, 33, 357–390. [Google Scholar] [CrossRef]
- Gill, L.; Lange, E.; Morgan, E.; Romano, D. An analysis of usage of different types of visualisation media within a collaborative planning workshop environment. Environ. Plan. B Plan. Des. 2013, 40, 742–754. [Google Scholar] [CrossRef]
- Paar, P. Landscape visualizations: Applications and requirements of 3D visualization software for environmental planning. Comput. Environ. Urban Syst. 2006, 30, 815–839. [Google Scholar] [CrossRef]
- Silvestri, C.; Motro, R.; Maurin, B.; Dresp-Langley, B. Visual spatial learning of complex object morphologies through the interaction with virtual and real-world data. Des. Stud. 2010, 31, 363–381. [Google Scholar] [CrossRef]
- Pietsch, S.M. Computer visualisation in the design control of urban environments: A literature review. Environ. Plan. B 2000, 27, 521–536. [Google Scholar] [CrossRef]
- Millesi, W.; Truppe, M.; Watzinger, F.; Wagner, A.; Enislidis, G.; Wanschitz, F.; Schopper, C.; Ewers, R. Remote stereotactic visualization for image-guided surgery: Technical innovation. J. Cranio-Maxillofac. Surg. 1997, 25, 136–138. [Google Scholar] [CrossRef]
- Rizzo, A.; Reger, G.; Gahm, G.; Difede, J.; Rothbaum, B.O. Virtual reality exposure therapy for combat-related PTSD. In Posttraumatic Stress Disorder: Basic Science and Clinical Practice; Shiromani, P., Keane, T., LeDoux, J.E., Eds.; Humana Press: New York, NY, USA, 2009; pp. 375–399. [Google Scholar]
- Daniel, T.C.; Meitner, M.J. Representational validity of landscape visualizations: The effects of graphical realism on perceived scenic beauty of forest vistas. J. Environ. Psychol. 2001, 21, 61–72. [Google Scholar] [CrossRef]
- Lange, E. Visualization in landscape architecture and planning: Where we have been, where we are now and where we might go from here. In Trends in GIS and Virtualization in Environmental Planning and Design; Buhmann, E., Nothhelfer, U., Pietsch, M., Eds.; Wichmann: Heidelberg, Germany, 2002; pp. 8–18. [Google Scholar]
- Portman, M.E.; Natapov, A.; Fisher-Gewirtzman, D. To go where no man has gone before: Virtual reality in architecture, landscape architecture and environmental planning. Comput. Environ. Urban Syst. 2015, 54, 376–384. [Google Scholar] [CrossRef]
- Kim, Y.-M. A Study on a Control Method for Image in landscape Environment. PhD Thesis, Kyushu University, Fukuoka, Japan, 1997; pp. 1–45. Available online: https://catalog.lib.kyushu-u.ac.jp/opac_detail_md/?reqCode=frombib&lang=1&amode=MD823&opkey=&bibid=2732&start= (accessed on 1 January 2020).
- Jun, M.; Nozomu, Y.; Takaya, K.; Hiroaki, T.; Norimitsu, I.; Wataru, K.; Kotaroh, H. Factors of Oppression and Spaciousness of Townscape Considering the Differnce of the Type of the Street. J. Environ. Eng. (Trans. AIJ) 2008, 627, 687–693. (In Japanese) [Google Scholar]
- Available online: http://www.law.go.kr/%EB%B2%95%EB%A0%B9/%EA%B2%BD%EA%B4%80%EB%B2%95/ (accessed on 29 March 2020). (In Korean).
- Haruka, A.; Hiroshi, H.; Nobuyuki, S.; Kazuya, S.; Lee, Y.-W.; Masaru, S. Impression Evaluation of Virtual Environment on Hemispherical Visual Display System-Analysis of Length and Depth Perception on CyberDome System; The Institute of Image Electronics Engineers of Japan: Tokyo, Japan, 2006; pp. 51–54. (In Japanese) [Google Scholar]
- Haruka, A.; Hiroshi, H.; Nobuyuki, S.; Kazuya, S.; Lee, Y.-W.; Hiroyuki, I.; Masaru, S. Impression Evaluation of Virtual Environment on Hemispherical Visual Display System-Analysis of Interior Space Perception on CyberDome System; The Institute of Image Electronics Engineers of Japan: Tokyo, Japan, 2007; pp. 66–69. (In Japanese) [Google Scholar]
© 2020 by the authors. Licensee MDPI, Basel, Switzerland. This article is an open access article distributed under the terms and conditions of the Creative Commons Attribution (CC BY) license (http://creativecommons.org/licenses/by/4.0/).