Abstract
Seoul, a city in South Korea, experiences high particulate matter (PM) levels well above the recommended standards suggested by the World Health Organization. As concerns about public health and everyday lives are being raised, this study investigates the effects of land use on PM levels in Seoul. Specifically, it attempts to identify which land use types increase or decrease PM10 and PM2.5 levels and compare the effects between high and low seasons using two sets of land use classifications: one coarser and the other finer. A series of partial least regression models identifies that industrial land use increases the PM levels in all cases. It is also reported that residential and commercial land uses associated with lower density increase these levels. Other uses, such as green spaces and road, show mixed or unclear effects. The findings of this study may inform planners and policymakers about how they can refine future land use planning and development practice in cities that face similar challenges.
1. Introduction
Today, ambient air pollution, often recognized by the concentration of particulate matter (PM), carbon dioxide, sulfur oxides, nitrogen oxides, carbon monoxide, and ozone, is one of the most serious risks to human health in many cities and regions. The World Health Organization (WHO) reported that exposure to PM, among many other air pollutants, is estimated to be responsible for 4.2 million premature deaths worldwide per year [1]. Previous studies identified that exposure to a concentration of PM of 10 micrometers or less in diameter (PM10) and PM of 2.5 micrometers (PM2.5) may cause serious cardiovascular and respiratory diseases [2,3,4,5], skin diseases [6], and many types of cancer [7,8,9,10,11,12]. They also report that it has particularly adverse impacts on children [13,14], the elderly [15,16], and pregnant women [17,18].
There have long been natural sources of PM, such as volcano eruptions, wildfires, and decomposition of organic substances. However, anthropogenic sources located in cities, including automobiles, production facilities, thermal power plants, and buildings, as well as indoor cooking, heating, smoking, and even air fresheners or cleaning supplies, have become more influential producers of PM and are threatening the health and the everyday lives of citizens [19,20]. Cities around the world that undergo rapid economic development often confront high PM levels as a key societal challenge. They are usually heavily dependent upon fossil-fuel-based manufacturing industries, energy sources, and transportation systems. These cities also generally lack policies for restricting PM emissions. They are sometimes hesitant to implement policies that may burden local business. These policies include local land use planning that has been utilized as a key facilitator of economic development rather than a measure that protects citizens’ health by establishing development caps on PM-related land uses, providing more green amenities or separating and protecting residential land use from others. For these reasons, major transitions in land use planning in cities are required [1,21,22].
Building on what has been discussed thus far, this study looks into Seoul, South Korea, a city in which many citizens are suffering from high levels of PM in the recent years and explores how land use affects PM10 and PM2.5 levels. It recognizes the wide variance found in Seoul’s PM levels and analyzes whether the effects vary between high seasons, when the PM levels are higher because of the large influx coming from outside the country in addition to local contributions, and low seasons, when the levels are mostly affected by only local sources. The outcome of this study may help us to understand the unidentified relationship between land use and PM levels in Seoul. It may also inform local land use planning and practice as an adaptation measure so as to provide a more livable urban environment and promote public health.
2. Literature Review
Previous research has extensively focused on developing land use regression models to make precise forecasting of air pollution levels over a specific territory or region possible. Studies show that specific land use types make significant contributions of increasing or decreasing PM levels in diverse contexts. The foremost concern is the impacts of industrial land use, which usually accommodate the key sources of air pollution in cities, such as manufacturing facilities, power plants, or large-scale infrastructure [23,24,25,26,27,28]. A number of studies have identified similar impacts of commercial land use on increasing PM levels [29,30]. The vibrancy and the vitality generated by the concentration of people and goods accommodated on commercial lands often results in higher levels of PM. Some studies have reported that residential land use [24,31] or larger population sizes [26] also intensify the concentration of PM. Others have found that the overall building density may also raise the levels [25,32].
On the other hand, interest in the effects of green and blue amenities on reducing PM levels is growing. Researchers argue that larger amounts of vegetation [29] and parks [33] negatively affect the levels. Some suggest the need for adopting diverse types of green infrastructure, such as green roofs, to strengthen mitigation capacities [9,34]. Another study showed that rivers are associated with lower levels of PM [24].
Besides land use, previous research showed that transportation-related sources operate as key contributors that reinforce the PM concentration in cities. Multiple studies argue that larger volumes of traffic on local roads significantly increase PM levels [24,25,35,36,37]. The total lengths of highways and arterials, roads that usually carry large volumes of vehicular traffic, as well as distances to or from them, are also of significant concern [23,27,38,39]. Other studies have identified street density [40] and major transportation infrastructure, such as airports [11] and seaports [41].
A review of empirical studies coming from a range of contexts identified critical challenges. It is evident that there are a few common factors across contexts regarding how certain land use types increase or decrease local PM levels. However, it is also noteworthy that the impacts of land use on local PM levels may considerably differ by cities and regions, as discussed by several precedents [42,43]. The magnitude of each land use effect may vary, and an impactful land use type in a city may not be so useful in others. This suggests the strong need for an empirical investigation of interactions between local land use and PM levels so as to generate place-based solutions that can be applied to real-world practice and policies.
3. Case Context
As the capital city of South Korea, Seoul (37°34′ N 126°58′ E) accommodates around 10 million residents on 605 square kilometers of land. PM10 and PM2.5 levels in the city are high. They have frequently surpassed levels suggested by the guidelines presented by WHO in recent years, as illustrated by Figure 1. The city’s PM10 levels were higher than 50 micrograms per cubic meter, the WHO’s guideline for the daily mean, for 105 days in 2015, 144 days in 2016, and 107 days in 2017. Similarly, the PM2.5 levels exceeded 25 micrograms per cubic meter, another daily guideline of the WHO’s, for 124 days in 2015, 169 days in 2016, and 142 days in 2017. Also, Seoul’s overall PM levels were remarkably higher than those of major cities of the Organisation for Economic Co-operation and Development nations. The annual mean PM10 level of Seoul was 48 micrograms per cubic meter in 2016, while that of Paris was 28, that of London was 23, that of Hong Kong was 34, and that of Melbourne was 19. Likewise, the annual mean PM2.5 level for Seoul was 26 micrograms per cubic meter in 2018, while that of Paris was 16, that of London was 12, that of Hong Kong was 23, and that of Melbourne was 8 [44].
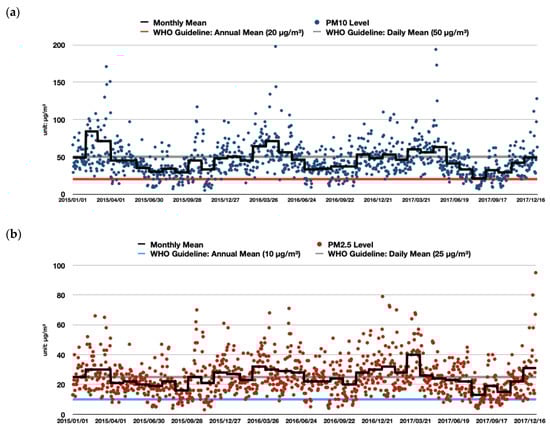
Figure 1.
(a) Daily mean levels of particulate matter of 10 micrometers or less in diameter (PM10) in Seoul from 2015 to 2017 compared with the World Health Organization’s (WHO’s) guidelines on annual and daily means; (b) daily mean levels of PM of 2.5 micrometers or less in diameter (PM2.5) in Seoul from 2015 to 2017, compared with the WHO’s guidelines on annual and daily means. Data source: Seoul Atmospheric Environment Information (http://cleanair.seoul.go.kr/).
Table 1 presents the PM10 and the PM2.5 concentrations contributed by each sector of Seoul from 2016. The largest contribution was made by fugitive dust, which refers to small particles directly suspended from heavy construction operations or unpaved roads in both cases. This was followed by non-road and road transportation sources and combustion from a range of sectors. Up to 75 percent of Seoul’s PM2.5 concentration was generated by chemical reactions of SOx, NOx, ammonia, and non-methane volatile organic compounds [45].

Table 1.
Sector contributions to Seoul’s PM10 and PM2.5 concentrations in 2016.
Another observation about Seoul’s PM levels is the large fluctuations in annual trends. As Figure 1 exhibits, in several months in each year, higher PM10 and PM2.5 levels are yielded than in others. Specifically, these trends make the six-month period from December to May the high season, at least for the three years observed. Meteorological conditions in this season, including the prevailing westerly winds and the atmospheric inversion events, often trap large chunks of air pollutants, most of which generate from heating in Seoul. Notably, the highest PM10 level recorded in the three-year period was 569 micrograms per cubic meter on 23 February 2015, although this is not presented in Figure 1 so as not to dwarf the other readings. The local PM10 concentration was significantly amplified by Asian dust that arises from the inner parts of the Asian continent and visits Seoul in Spring every year. The highest reading for PM2.5 was 95 micrograms per cubic meter, which was observed on 30 December 2017. Local scientists reported that a few neighboring countries contribute up to 82% of the particulate matter concentration in Seoul in the high season and around 30% in the low season [45]. Critics argue that such temporal variabilities increase the difficulty, the uncertainty, and the inconsistency in understanding the PM trends and developing context-based solutions [46].
Seoul’s attempt to combat the high PM levels is unfolding in multiple directions. Many of its policies target transportation, which is known to generate up to 52 percent of local PM production [47]; such policies include restricting high-emission vehicles from entering the city center, enforcing vehicle emissions control, promoting early retirement of old vehicles, and subsidizing purchases of low-emission vehicles. Other policies include monitoring business establishments and construction sites with high emission levels, expanding the local PM monitoring system, fostering public participation at all levels, and building cooperation with other municipal governments nationally and internationally [48]. Despite the wide range of efforts by Seoul’s local government and community, it is difficult to overlook the fact that the vast majority of existing attempts tend to focus on mitigation, which heavily relies on technologies to cut down PM generation at sources, while land use effects in the city, as have been empirically identified by existing studies coming from many contexts, have rarely been studied.
4. Methods
4.1. Data and Variables
To make comparisons between high and low seasons, the response—or dependent—variables of this study included the mean PM10 and PM2.5 levels for all seasons, the high season, and the low season, as shown in Figure 2. This study used PM10 and PM2.5 level data, collected for three years between January 2015 and December 2017, that came from Seoul’s citywide air quality monitoring network, which is one of the densest in the world. Today, the network is composed of 50 monitoring stations—25 district stations, 15 road-side stations, and 10 ambient air stations—and is operated by the Seoul Metropolitan Government. Each station sits on publicly owned land and is programmed to automatically collect and record SO2, NO2, CO, O3, PM10, and PM2.5 levels at the near-ground level at every hour, and it shares its readings online for public use. Data from the 25 district monitoring stations, as presented in Figure 3, are used, because these stations are evenly spread out across the city. They are all installed on roofs of public buildings, such as community centers and district offices, which are usually three to six stories high, to minimize interference from the direct surroundings and to make maintenance efficient. Those from roadside stations, located on major arterial routes of Seoul, were not included in the investigation, since they are excessively affected by the large adjacent traffic volume and may fail to reveal land use impacts. Data on PM10 and PM2.5 levels were averaged into three groups: all seasons as a reference, high season (December to May), and low season (June to November).
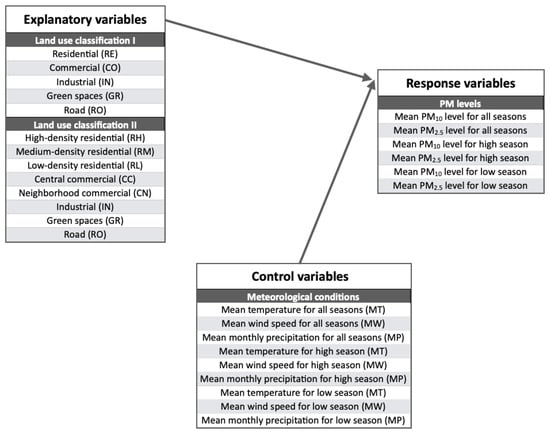
Figure 2.
Explanatory, control, and response variables used in this study.

Figure 3.
Locations and names of 25 district air quality monitoring stations in Seoul.
As for the explanatory—or independent—variables, parcel-level zoning information as of 2017, in the form of geographic information systems (GIS) data, was acquired from the National Geographic Information Institute (NGII), a national agency responsible for regularly updating and sharing South Korea’s nationwide spatial information. Land use types were regrouped into two generalizable classifications. The first classified Seoul’s land use into five types in a relatively broad way: residential (RE), commercial (CO), industrial (IN), green spaces (GR), and road (RO). This classification follows a highly common approach taken by a number of land use regression studies in environmental science fields. The second established a finer classification by incorporating the local zoning ordinances that consider density and further subdivide several land use types from the first classification. Eight types were identified under this classification: high-density residential (RH), medium-density residential (RM), low-density residential (RL), central commercial (CC), neighborhood commercial (CN), industrial (IN), green spaces (GR), and road (RO).
For the investigation, this study focused on the land use conditions in the one kilometer surrounding each district monitoring station. This one-kilometer buffer zone follows a number of studies that investigated the land use effects on air pollution outcomes [26,49,50]. The buffer also reflects planning practice in Seoul, where a planning neighborhood, a basic unit for local land use planning, usually covers a similar amount of land. Figure 4 shows an example of the Mapo district monitoring station and its surrounding land use conditions based on the two land use classifications.

Figure 4.
Surrounding land use conditions for the Mapo district monitoring station based on (a) the first classification with five land use types and (b) the second classification with eight types. The station is located at the center of each circle. The inner and the outer circles indicate 0.5 km and one kilometer from the station, respectively.
Following findings of previous studies [46,51,52,53], several meteorological conditions, such as temperature, wind speed, and precipitation, were included as control variables. Relevant data for each of the 25 districts were acquired from the Korea Meteorological Administration, a public agency responsible for collecting and sharing meteorological information for all cities and regions in South Korea. Table 2 summarizes the descriptive statistics of response, explanatory, and control variables used in this study.
Table 2.
Summary statistics for the 25 district monitoring stations and their surrounding land use conditions.
4.2. Analysis
While a number of studies have applied multiple linear regression models to estimate PM levels with land use conditions [40,54,55], some critics suggest that multicollinearity is frequently observed among land use variables [26,56]. Another favored option is to use spatial regression models when the response variables are spatially autocorrelated by calculating correlation coefficients such as Moran’s I [57,58,59]. However, an initial observation of the response variables used in this study did not identify any existence of spatial autocorrelation. For this reason, this study adopted partial least-squares (PLS) regression as an alternative. This is a robust multivariate regression method that successfully estimates response variables by extracting a set of orthogonal latent variables with the best estimating power from the explanatory variables [60]. It is also known to be well suited to sample sizes that are not large enough compared to the number of explanatory variables [61]. This method is frequently used in studies in environmental science fields that use explanatory variables that yield significant levels of multicollinearity [62,63,64] and is increasingly being applied in land use studies [56,65,66,67,68]. PLS regression models generate the variable importance for projection (VIP) for each explanatory variable as a measure, which presents the contribution of each factor to the response variable. Explanatory variables with VIP values higher than 1.0 are considered to have a high influence on the response variable, and those with VIP values between 0.8 and 1.0 present a moderate influence [69].
To enhance the accuracy of estimation outcomes and minimize any skewness, all variables were log-transformed before being applied to PLS regression models. As for the land use variables, in particular, a value of 1 was added to each variable prior to its transformation to avoid log-transforming zeros.
5. Results
5.1. Land Use Classification I
Table 3 shows the PLS regression estimation results for PM10 levels based on land use classification I for all seasons, the high season, and the low season. In all three cases, residential land use lowered the levels, while industrial land use had significant positive contributions. Commercial land uses and roads presented no significant impacts. The overall explanatory power of the model for the low season as well as the coefficient of industrial land use was larger than that for the high season. The significantly negative impacts of green spaces were found only found in the low season.
Table 3.
Estimation of PM10 levels based on land use classification I using partial least-squares (PLS) regression models.
The estimated results for PM2.5 are presented in Table 4. Industrial land use was found to yield significantly positive impacts, not only in the high season but also in the low season, and green spaces showed significant negative impacts only in the low season. Other land uses showed insignificant or mixed influences. Again, the explanatory power of the model and the coefficient of industrial land use were bigger for the low season. This suggests that there is relatively larger unclarity in the high season.
Table 4.
Estimation of PM2.5 levels based on land use classification I using PLS regression models.
5.2. Land Use Classification II
Table 5, using the finer land use classification II, summarizes the estimated results for PM10 levels. Similar to the previous findings for the other classification, industrial land use was found to significantly increase the levels, while the three residential land uses were shown to decrease them in all three seasons. Among the three residential use types, those with higher density levels were associated with larger negative impacts. The table also identifies that neighborhood commercial land use exhibits a significant positive influence on PM10 levels, while central commercial land use does not. One possible interpretation could be that high-rise buildings separated from each other on residential or commercial land with higher density levels may facilitate better ventilation, thereby hampering the concentration of fine particles compared with that in low-rise buildings on lands with lower density levels. Again, green spaces were shown to have significant negative impacts only in the low season, and the explanatory power of the model for the low season was larger than that for the high season.
Table 5.
Estimation of PM10 levels based on land use classification II using PLS regression models.
Table 6 presents the estimation results for PM2.5. Industrial land use remains a significant positive influencer in all three seasons. Among the three residential land use types, only the high-density residential land was shown to have significant negative impacts in all three seasons. Commercial land uses and green spaces presented mixed results. Again, the explanatory power and the coefficients of industrial and high-density residential land use in the low season were larger than others, making the estimation more efficient.
Table 6.
Estimation of PM2.5 levels based on land use classification II using PLS regression models.
6. Discussion
The PLS regression estimation results trigger further discussion. First, each land use type was found to present differing effects on PM levels with varying levels of significance. Data on industrial land use followed existing knowledge, showing relatively clear impacts on raising both PM10 and PM2.5 levels in most cases. Residential land use in general was found to significantly decrease PM10 levels, and land with higher density levels among the three residential land uses was identified as the most influential. Neighborhood commercial land use showed some significant positive effects. This can be interpreted as being due to high-rise residential or commercial buildings inducing winds around them and setbacks between the buildings, which are wide enough to carry the winds, providing ventilation so as to lower the PM levels. On the other hand, low-rise buildings, which are often separated from each other by shorter distances, hinder ventilation. Somewhat different from findings from a number of previous studies, green spaces significantly reduce PM levels only in the low season, suggesting their limited role in the high season. Also different from general judgement, road failed to demonstrate any significant impacts in all cases.
Second, seasonal differences were evident. Whether predicting PM10 or PM2.5 levels, regression models for the low season presented larger explanatory power, as consistently indicated by the R2 values, and the number of significant predictors identified among the land use variables was greater in any case. This suggests that, during the low season, when the exogenous influences from neighboring countries are minimal, more effective estimation of PM levels based on local land use conditions is possible.
Third, the two land use classifications used in the analysis for estimating PM10 and PM2.5 levels showed clear differences. While there are significant common predictors between the two, such as industrial land use, classification II is capable of unveiling critical influencers, such as high-density residential land. Especially for land use planning purposes, the finer second classification may provide more precise results and more efficient predictions for Seoul.
Fourth, another observed difference between the two land use classifications in estimating PM10 and PM2.5 levels is the varying impacts of the land use types. With land use classification I, the impact of statistically significant land use types, such as residential and industrial land uses, is generally larger for PM2.5 than for PM10. However, with land use classification II, it is difficult to say which is larger in general. The impact of high-density residential land use on PM10 is generally smaller than that on PM2.5, and the impact of industrial land use on PM10 is slightly larger than that on PM2.5. Data on other land uses yielded mixed results. These data suggested that the coarser classification I may exaggerate differences in the land use impacts, while the impacts identified with the finer classification II may be more precise.
Fifth, wind speeds, although not markedly explained previously, were found to considerably lower PM10 levels in some cases and PM2.5 levels in all cases, while the impacts of temperature and humidity were relatively limited. Land use planning and development practice that promoted higher wind speeds may play critical roles. Additionally, this could be a solution that could be applied to all land use types.
Lastly, the regression models reflect Seoul’s planning and development practice, which allows and fosters a high level of diversity in actual use and building types within each land use zone [70,71,72]. For example, the incorporation of housing units and retail shops on industrial land is allowed to shorten commuting distances and vitalize employment centers after work. The resulting R2 values are relatively smaller than those presented by several other studies that looked into similar issues in other contexts. However, the values are, in fact, similar to or larger than those obtained by local researchers in many other land use regression studies based in Seoul [56,73,74].
7. Implications and Concluding Remarks
In conclusion, this study highlights the critical impacts of land use on PM levels in Seoul, South Korea. It identified that industrial land use increases the levels of PM, while high-density residential use decreases them in general. Impacts of other uses remain limited or mixed. Additionally, the impacts differ by season as well as by the specific land use types used for analysis.
Findings suggest several policy implications that can be applied to Seoul’s land use planning and development practice and may inform Seoul Plan 2040 (https://www.2040seoulplan.com/), a new comprehensive plan of the city that is currently being drafted. First, there is a stronger need to control industrial land use. As its contribution was clearly identified, stronger mitigation strategies, such as promoting ventilation or separating industrial land use from other uses, may be enforced. Second, while high-rise towers on high-density residential lands show outstanding performance in terms of lowering PM levels than others, residential uses with lower density levels should receive more attention. Their usual setting, which is characterized by dense arrays of buildings, often traps air flow and requires major improvement. Third, the limited performance of green spaces in lowering PM levels proposes new tasks. This suggests that the current green spaces in Seoul may not be capable of lowering PM levels and that plants with higher purification capabilities could be used, but low temperatures in the high PM season may restrain their performance. Lastly, it is evident that there are seasonal differences in Seoul’s PM that are affected by local land use conditions. The tailoring of policies and plans for each season is necessary.
This study has several shortcomings. The sample size may not have been large enough to produce generalizable findings. Traffic volume information was not considered when estimating PM levels due to the absence of reliable data. The regression models used did not incorporate other influences, such as the topography and the socio-economic conditions of Seoul.
However, this study makes key contributions to literature and practice. It is one of the few studies to empirically examine the relationship between land use and PM levels in Seoul, a city that experiences high concentrations of air pollutants and that requires urgent solutions. Place-based guidance and implications specifically for Seoul’s local land use planning practice have been generated. This study suggests that further exploration of new relationships at various levels should be made, and the authors hope to provide lessons to other cities that may face similar challenges in the near future.
Funding
This work was supported by the Ministry of Education of the Republic of Korea and the National Research Foundation of Korea (NRF-2018S1A3A2075332) and the Korea Agency for Infrastructure Technology Advancement (KAIA) grant funded by the Ministry of Land, Infrastructure and Transport (Grant 20TBIP-C144203-03).
Acknowledgments
The author thanks Sungyeol Choi for his kind assistance.
Conflicts of Interest
The author declares no conflict of interest.
References
- World Health Organization. Ambient Air Pollution: A Global Assessment of Exposure and Burden of Disease; World Health Organization: Geneva, Switzerland, 2016. [Google Scholar]
- Sicard, P.; Lesne, O.; Alexandre, N.; Mangin, A.; Collomp, R. Air quality trends and potential health effects—Development of an aggregate risk index. Atmos. Environ. 2011, 45, 1145–1153. [Google Scholar] [CrossRef]
- Kim, K.-H.; Kabir, E.; Kabir, S. A review on the human health impact of airborne particulate matter. Environ. Int. 2015, 74, 136–143. [Google Scholar] [CrossRef] [PubMed]
- Zhang, L.; Chen, X.; Xue, X.; Sun, M.; Han, B.; Li, C.; Ma, J.; Yu, H.; Sun, Z.; Zhao, L.; et al. Long-term exposure to high particulate matter pollution and cardiovascular mortality: A 12-year cohort study in four cities in northern China. Environ. Int. 2014, 62, 41–47. [Google Scholar] [CrossRef]
- Haikerwal, A.; Akram, M.; Del Monaco, A.; Smith, K.; Sim, M.R.; Meyer, M.; Tonkin, A.M.; Abramson, M.J.; Dennekamp, M. Impact of Fine Particulate Matter (PM2.5) Exposure During Wildfires on Cardiovascular Health Outcomes. J. Am. Heart Assoc. 2015, 4, e001653. [Google Scholar] [CrossRef]
- Kim, K.E.; Cho, D.; Park, H.J. Air pollution and skin diseases: Adverse effects of airborne particulate matter on various skin diseases. Life Sci. 2016, 152, 126–134. [Google Scholar] [CrossRef]
- Hamra, G.B.; Guha, N.; Cohen, A.; Laden, F.; Nielsen, R.; Samet, J.M.; Vineis, P.; Forastiere, F.; Saldiva, P.; Yorifuji, T.; et al. Outdoor Particulate Matter Exposure and Lung Cancer: A Systematic Review and Meta-Analysis. Environ. Health Perspect. 2014, 122, 906–911. [Google Scholar] [CrossRef]
- Robin, P.C.; Hart, J.E.; Yanosky, J.D.; Spiegelman, D.; Wang, M.; Fisher, J.A.; Hong, B.; Laden, F. Particulate Matter Air Pollution Exposure, Distance to Road, and Incident Lung Cancer in the Nurses’ Health Study Cohort. Environ. Health Perspect. 2014, 122, 926–932. [Google Scholar]
- Valavanidis, A.; Vlachogianni, T.; Fiotakis, K.; Loridas, S. Pulmonary Oxidative Stress, Inflammation and Cancer: Respirable Particulate Matter, Fibrous Dusts and Ozone as Major Causes of Lung Carcinogenesis through Reactive Oxygen Species Mechanisms. Int. J. Environ. Res. Public Health 2013, 10, 3886–3907. [Google Scholar] [CrossRef]
- Hu, H.; Dailey, A.B.; Kan, H.; Xu, X. The effect of atmospheric particulate matter on survival of breast cancer among US females. Breast Cancer Res Treat 2013, 139, 217–226. [Google Scholar] [CrossRef]
- Ansari, M.; Ehrampoush, M.H. Meteorological correlates and AirQ+ health risk assessment of ambient fine particulate matter in Tehran, Iran. Environ. Res. 2019, 170, 141–150. [Google Scholar] [CrossRef]
- Hung, L.-J.; Chan, T.-F.; Wu, C.-H.; Chiu, H.-F.; Yang, C.-Y. Traffic Air Pollution and Risk of Death from Ovarian Cancer in Taiwan: Fine Particulate Matter (PM2.5) as a Proxy Marker. J. Toxicol. Environ. Health Part A 2012, 75, 174–182. [Google Scholar] [CrossRef] [PubMed]
- Roy, A.; Hu, W.; Wei, F.; Korn, L.; Chapman, R.S.; Zhang, J. (Jim) Ambient particulate matter and lung function growth in Chinese children. Epidemiology 2012, 23, 464–472. [Google Scholar] [CrossRef]
- Jedrychowski, W.A.; Perera, F.P.; Spengler, J.D.; Mroz, E.; Stigter, L.; Flak, E.; Majewska, R.; Klimaszewska-Rembiasz, M.; Jacek, R. Intrauterine exposure to fine particulate matter as a risk factor for increased susceptibility to acute broncho-pulmonary infections in early childhood. Int. J. Hyg. Environ. Health 2013, 216, 395–401. [Google Scholar] [CrossRef] [PubMed]
- Karottki, D.G.; Spilak, M.; Frederiksen, M.; Jovanovic Andersen, Z.; Madsen, A.M.; Ketzel, M.; Massling, A.; Gunnarsen, L.; Møller, P.; Loft, S. Indoor and Outdoor Exposure to Ultrafine, Fine and Microbiologically Derived Particulate Matter Related to Cardiovascular and Respiratory Effects in a Panel of Elderly Urban Citizens. Int. J. Environ. Res. Public Health 2015, 12, 1667–1686. [Google Scholar] [CrossRef] [PubMed]
- Fossati, S.; Baccarelli, A.; Zanobetti, A.; Hoxha, M.; Vokonas, P.S.; Wright, R.O.; Schwartz, J. Ambient particulate air pollution and microRNAs in elderly men. Epidemiology 2014, 25, 68–78. [Google Scholar] [CrossRef] [PubMed]
- Zhu, X.; Liu, Y.; Chen, Y.; Yao, C.; Che, Z.; Cao, J. Maternal exposure to fine particulate matter (PM2.5) and pregnancy outcomes: A meta-analysis. Env. Sci Pollut Res 2015, 22, 3383–3396. [Google Scholar] [CrossRef]
- Sapkota, A.; Chelikowsky, A.P.; Nachman, K.E.; Cohen, A.J.; Ritz, B. Exposure to particulate matter and adverse birth outcomes: A comprehensive review and meta-analysis. Air Qual. Atmos. Health 2012, 5, 369–381. [Google Scholar] [CrossRef]
- Moussiopoulos, N. Air Quality in Cities; Springer Science & Business Media: Boston, NY, USA, 2013; ISBN 978-3-662-05217-4. [Google Scholar]
- Nam, K.-M.; Li, M.; Wang, Y.; Wong, K.K.H. Spatio-temporal boundary effects on pollution-health costs estimation: The case of PM2.5 pollution in Hong Kong. Int. J. Urban Sci. 2019, 23, 498–518. [Google Scholar] [CrossRef]
- Júnior, W.J.R.; Roig, H.L.; Koutrakis, P. A novel land use approach for assessment of human health: The relationship between urban structure types and cardiorespiratory disease risk. Environ. Int. 2015, 85, 334–342. [Google Scholar] [CrossRef] [PubMed]
- Honachefsky, W.B. Ecologically Based Municipal Land Use Planning; CRC Press: London, UK, 2019; ISBN 978-1-351-45392-9. [Google Scholar]
- Liu, C.; Henderson, B.H.; Wang, D.; Yang, X.; Peng, Z. A land use regression application into assessing spatial variation of intra-urban fine particulate matter (PM2.5) and nitrogen dioxide (NO2) concentrations in City of Shanghai, China. Sci. Total Environ. 2016, 565, 607–615. [Google Scholar] [CrossRef] [PubMed]
- Lee, J.-H.; Wu, C.-F.; Hoek, G.; de Hoogh, K.; Beelen, R.; Brunekreef, B.; Chan, C.-C. LUR models for particulate matters in the Taipei metropolis with high densities of roads and strong activities of industry, commerce and construction. Sci. Total Environ. 2015, 514, 178–184. [Google Scholar] [CrossRef]
- Wolf, K.; Cyrys, J.; Harciníková, T.; Gu, J.; Kusch, T.; Hampel, R.; Schneider, A.; Peters, A. Land use regression modeling of ultrafine particles, ozone, nitrogen oxides and markers of particulate matter pollution in Augsburg, Germany. Sci. Total Environ. 2017, 579, 1531–1540. [Google Scholar] [CrossRef] [PubMed]
- Ross, Z.; Jerrett, M.; Ito, K.; Tempalski, B.; Thurston, G.D. A land use regression for predicting fine particulate matter concentrations in the New York City region. Atmos. Environ. 2007, 41, 2255–2269. [Google Scholar] [CrossRef]
- Moore, D.K.; Jerrett, M.; Mack, W.J.; Künzli, N. A land use regression model for predicting ambient fine particulate matter across Los Angeles, CA. J. Environ. Monit. 2007, 9, 246–252. [Google Scholar] [CrossRef] [PubMed]
- Gulliver, J.; Morley, D.; Dunster, C.; McCrea, A.; van Nunen, E.; Tsai, M.-Y.; Probst-Hensch, N.; Eeftens, M.; Imboden, M.; Ducret-Stich, R.; et al. Land use regression models for the oxidative potential of fine particles (PM2.5) in five European areas. Environ. Res. 2018, 160, 247–255. [Google Scholar] [CrossRef] [PubMed]
- Wu, C.-D.; Chen, Y.-C.; Pan, W.-C.; Zeng, Y.-T.; Chen, M.-J.; Guo, Y.L.; Lung, S.-C.C. Land-use regression with long-term satellite-based greenness index and culture-specific sources to model PM2.5 spatial-temporal variability. Environ. Pollut. 2017, 224, 148–157. [Google Scholar] [CrossRef] [PubMed]
- Yang, H.; Chen, W.; Liang, Z. Impact of Land Use on PM2.5 Pollution in a Representative City of Middle China. Int. J. Environ. Res. Public Health 2017, 14, 462. [Google Scholar] [CrossRef]
- Henderson, S.B.; Beckerman, B.; Jerrett, M.; Brauer, M. Application of Land Use Regression to Estimate Long-Term Concentrations of Traffic-Related Nitrogen Oxides and Fine Particulate Matter. Environ. Sci. Technol. 2007, 41, 2422–2428. [Google Scholar] [CrossRef]
- Urso, P.; Cattaneo, A.; Garramone, G.; Peruzzo, C.; Cavallo, D.M.; Carrer, P. Identification of particulate matter determinants in residential homes. Build. Environ. 2015, 86, 61–69. [Google Scholar] [CrossRef]
- Yu, H.-L.; Wang, C.-H.; Liu, M.-C.; Kuo, Y.-M. Estimation of Fine Particulate Matter in Taipei Using Landuse Regression and Bayesian Maximum Entropy Methods. Int. J. Environ. Res. Public Health 2011, 8, 2153–2169. [Google Scholar] [CrossRef]
- Currie, B.A.; Bass, B. Estimates of air pollution mitigation with green plants and green roofs using the UFORE model. Urban Ecosyst 2008, 11, 409–422. [Google Scholar] [CrossRef]
- Charron, A.; Harrison, R.M. Fine (PM2.5) and Coarse (PM2.5-10) Particulate Matter on A Heavily Trafficked London Highway: Sources and Processes. Environ. Sci. Technol. 2005, 39, 7768–7776. [Google Scholar] [CrossRef]
- Pant, P.; Harrison, R.M. Estimation of the contribution of road traffic emissions to particulate matter concentrations from field measurements: A review. Atmos. Environ. 2013, 77, 78–97. [Google Scholar] [CrossRef]
- Wåhlin, P.; Berkowicz, R.; Palmgren, F. Characterisation of traffic-generated particulate matter in Copenhagen. Atmos. Environ. 2006, 40, 2151–2159. [Google Scholar] [CrossRef]
- Huang, L.; Zhang, C.; Bi, J. Development of land use regression models for PM2.5, SO2, NO2 and O3 in Nanjing, China. Environ. Res. 2017, 158, 542–552. [Google Scholar] [CrossRef]
- Hafezi, M.H.; Daisy, N.S.; Liu, L.; Millward, H. Modelling transport-related pollution emissions for the synthetic baseline population of a large Canadian university. Int. J. Urban Sci. 2019, 23, 519–533. [Google Scholar] [CrossRef]
- Amini, H.; Taghavi-Shahri, S.M.; Henderson, S.B.; Naddafi, K.; Nabizadeh, R.; Yunesian, M. Land use regression models to estimate the annual and seasonal spatial variability of sulfur dioxide and particulate matter in Tehran, Iran. Sci. Total Environ. 2014, 488–489, 343–353. [Google Scholar] [CrossRef] [PubMed]
- Hall, P.V. Seaports, Urban Sustainability, and Paradigm Shift. J. Urban Technol. 2007, 14, 87–101. [Google Scholar] [CrossRef]
- Hoek, G.; Beelen, R.; de Hoogh, K.; Vienneau, D.; Gulliver, J.; Fischer, P.; Briggs, D. A review of land-use regression models to assess spatial variation of outdoor air pollution. Atmos. Environ. 2008, 42, 7561–7578. [Google Scholar] [CrossRef]
- Ryan, P.H.; LeMasters, G.K. A Review of Land-use Regression Models for Characterizing Intraurban Air Pollution Exposure. Inhal. Toxicol. 2007, 19, 127–133. [Google Scholar] [CrossRef]
- World Health Organization WHO Global Ambient Air Quality Database (update 2018). Available online: http://www.who.int/airpollution/data/cities/en/ (accessed on 9 February 2020).
- Ministry of Environment Comprehensive Plan for Managing Particulate Matter (2020–2024). 2019. Available online: https://www.me.go.kr/home/file/readDownloadFile.do?fileId=168738&fileSeq=5 (accessed on 9 February 2020).
- Kim, H.C.; Kim, S.; Kim, B.-U.; Jin, C.-S.; Hong, S.; Park, R.; Son, S.-W.; Bae, C.; Bae, M.; Song, C.-K.; et al. Recent increase of surface particulate matter concentrations in the Seoul Metropolitan Area, Korea. Sci. Rep. 2017, 7, 1–7. [Google Scholar] [CrossRef] [PubMed]
- Seoul Metropolitan Government Reducing PM2.5 by 20 percent. Available online: https://www.seoulsolution.kr/ko/content/3514 (accessed on 11 February 2020).
- Seoul Metropolitan Government Air Quality Strategies. Available online: https://bluesky.seoul.go.kr/bluesky_notice/policy_all/inter_cooper (accessed on 11 February 2020).
- Kim, Y.; Guldmann, J.-M. Land-use regression panel models of NO2 concentrations in Seoul, Korea. Atmos. Environ. 2015, 107, 364–373. [Google Scholar] [CrossRef]
- Adam-Poupart, A.; Brand, A.; Fournier, M.; Jerrett, M. Smargiassi Spatiotemporal Modeling of Ozone Levels in Quebec (Canada): A Comparison of Kriging, Land-Use Regression (LUR), and Combined Bayesian Maximum Entropy–LUR Approaches. Environ. Health Perspect. 2014, 122, 970–976. [Google Scholar] [CrossRef] [PubMed]
- Tai, A.P.K.; Mickley, L.J.; Jacob, D.J. Correlations between fine particulate matter (PM2.5) and meteorological variables in the United States: Implications for the sensitivity of PM2.5 to climate change. Atmos. Environ. 2010, 44, 3976–3984. [Google Scholar] [CrossRef]
- Galindo, N.; Varea, M.; Gil-Moltó, J.; Yubero, E.; Nicolás, J. The Influence of Meteorology on Particulate Matter Concentrations at an Urban Mediterranean Location. Water Air Soil Pollut 2011, 215, 365–372. [Google Scholar] [CrossRef]
- Yáñez, M.A.; Baettig, R.; Cornejo, J.; Zamudio, F.; Guajardo, J.; Fica, R. Urban airborne matter in central and southern Chile: Effects of meteorological conditions on fine and coarse particulate matter. Atmos. Environ. 2017, 161, 221–234. [Google Scholar] [CrossRef]
- Zou, B.; Luo, Y.; Wan, N.; Zheng, Z.; Sternberg, T.; Liao, Y. Performance comparison of LUR and OK in PM 2.5 concentration mapping: A multidimensional perspective. Sci. Rep. 2015, 5, 1–7. [Google Scholar] [CrossRef]
- Mukerjee, S.; Willis, R.D.; Walker, J.T.; Hammond, D.; Norris, G.A.; Smith, L.A.; Welch, D.P.; Peters, T.M. Seasonal effects in land use regression models for nitrogen dioxide, coarse particulate matter, and gaseous ammonia in Cleveland, Ohio. Atmos. Pollut. Res. 2012, 3, 352–361. [Google Scholar] [CrossRef]
- Kim, H.; Kim, S.-N. The Seasonal and Diurnal Influence of Surrounding Land Use on Temperature: Findings from Seoul, South Korea. Sustainability 2017, 9, 1443. [Google Scholar] [CrossRef]
- Kwon, M.Y.; Lee, J.S.; Park, S. The effect of outdoor air pollutants and greenness on allergic rhinitis incidence rates: A cross-sectional study in Seoul, Korea. Int. J. Sustain. Dev. World Ecol. 2019, 26, 258–267. [Google Scholar] [CrossRef]
- Her, J.; Park, S.; Lee, J.S. The Effects of Bus Ridership on Airborne Particulate Matter (PM10) Concentrations. Sustainability 2016, 8, 636. [Google Scholar] [CrossRef]
- Zhou, C.; Chen, J.; Wang, S. Examining the effects of socioeconomic development on fine particulate matter (PM2.5) in China’s cities using spatial regression and the geographical detector technique. Sci. Total Environ. 2018, 619–620, 436–445. [Google Scholar] [CrossRef] [PubMed]
- Abdi, H. Partial least square regression (PLS regression). In Encyclopedia for Research Methods for the Social Sciences; SAGE Publications, Inc.: Thousand Oaks, CA, USA, 2003; pp. 792–805. [Google Scholar]
- Carrascal, L.M.; Galván, I.; Gordo, O. Partial least squares regression as an alternative to current regression methods used in ecology. Oikos 2009, 118, 681–690. [Google Scholar] [CrossRef]
- Sampson, P.D.; Richards, M.; Szpiro, A.A.; Bergen, S.; Sheppard, L.; Larson, T.V.; Kaufman, J.D. A regionalized national universal kriging model using Partial Least Squares regression for estimating annual PM2.5 concentrations in epidemiology. Atmos. Environ. 2013, 75, 383–392. [Google Scholar] [CrossRef] [PubMed]
- Yan, B.; Fang, N.F.; Zhang, P.C.; Shi, Z.H. Impacts of land use change on watershed streamflow and sediment yield: An assessment using hydrologic modelling and partial least squares regression. J. Hydrol. 2013, 484, 26–37. [Google Scholar] [CrossRef]
- Woldesenbet, T.A.; Elagib, N.A.; Ribbe, L.; Heinrich, J. Hydrological responses to land use/cover changes in the source region of the Upper Blue Nile Basin, Ethiopia. Sci. Total Environ. 2017, 575, 724–741. [Google Scholar] [CrossRef]
- Shawul, A.A.; Chakma, S.; Melesse, A.M. The response of water balance components to land cover change based on hydrologic modeling and partial least squares regression (PLSR) analysis in the Upper Awash Basin. J. Hydrol. Reg. Stud. 2019, 26, 100640. [Google Scholar] [CrossRef]
- Young, M.T.; Bechle, M.J.; Sampson, P.D.; Szpiro, A.A.; Marshall, J.D.; Sheppard, L.; Kaufman, J.D. Satellite-Based NO2 and Model Validation in a National Prediction Model Based on Universal Kriging and Land-Use Regression. Environ. Sci. Technol. 2016, 50, 3686–3694. [Google Scholar] [CrossRef]
- Xu, H.; Bechle, M.J.; Wang, M.; Szpiro, A.A.; Vedal, S.; Bai, Y.; Marshall, J.D. National PM2.5 and NO2 exposure models for China based on land use regression, satellite measurements, and universal kriging. Sci. Total Environ. 2019, 655, 423–433. [Google Scholar] [CrossRef]
- Liu, H.-L.; Shen, Y.-S. The Impact of Green Space Changes on Air Pollution and Microclimates: A Case Study of the Taipei Metropolitan Area. Sustainability 2014, 6, 8827–8855. [Google Scholar] [CrossRef]
- Wold, S. Exponentially weighted moving principal components analysis and projections to latent structures. Chemom. Intell. Lab. Syst. 1994, 23, 149–161. [Google Scholar] [CrossRef]
- Sung, H.; Lee, S.; Cheon, S. Operationalizing Jane Jacobs’s Urban Design Theory: Empirical Verification from the Great City of Seoul, Korea. J. Plan. Educ. Res. 2015, 35, 117–130. [Google Scholar] [CrossRef]
- Jeon, C.; Choi, M. Historical Review on the Characteristics of Specialized and Mixed Land Uses of Korean Zoning System: From Chosun Planning Ordinace of 1934 to City Planning Law of 1962. J. Korea Plan. Assoc. 2018, 53, 5–18. [Google Scholar] [CrossRef]
- Sung, H.; Go, D.; Choi, C.; Cheon, S.; Park, S. Effects of street-level physical environment and zoning on walking activity in Seoul, Korea. Land Use Policy 2015, 49, 152–160. [Google Scholar] [CrossRef]
- Kim, Y. An Analysis of Traffic Flows and Land-Use on Urban Air Pollution Concentrations Using Geographic Information System. J. Transp. Res. 2017, 24, 67–81. [Google Scholar]
- Lee, J.; Leem, J.; Kim, H.; Hwang, S.; Jung, D.; Park, M.; Kim, J.; Lee, J.; Park, N.; Kang, S. Land Use Regression Model for Assessing Exposure and Impacts of Air Pollutants in School Children. J. Korean Soc. Atmos. Environ. 2012, 28, 571–580. [Google Scholar] [CrossRef]


© 2020 by the author. Licensee MDPI, Basel, Switzerland. This article is an open access article distributed under the terms and conditions of the Creative Commons Attribution (CC BY) license (http://creativecommons.org/licenses/by/4.0/).