Abstract
Land use/cover change (LUCC) strongly regulates ecosystem carbon storage and provides a critical entry point for carbon-oriented territorial spatial governance. However, balancing carbon sequestration, food security, urban expansion, and ecological protection remains challenging in Southwest China’s Ecological Security Barrier Zone (ESBZ). In this study, we coupled the Patch-generating Land Use Simulation (PLUS) model with the Integrated Valuation of Ecosystem Services and Tradeoffs (InVEST) carbon module to reconstruct LUCC and carbon-storage dynamics during 1999–2024 and to project land-use patterns and carbon storage in 2049 under four scenarios: Natural Development (NDS), Urban Development (UDS), Cultivated land Protection (CPS), and Ecological Protection (EPS). Unlike most existing PLUS–InVEST studies focused on cities, watersheds, or single provinces, this study targets a national ecological security barrier and integrates land-use evolution, carbon-storage responses, scenario trade-offs, and zoning-oriented governance into one analytical framework. It therefore provides spatially explicit evidence not only for carbon-oriented land management but also for interprovincial ecological compensation and coordinated ecological security governance in ecologically fragile regions. The 2024 land system was dominated by forest land (56.40%), cultivated land (25.47%), and grassland (16.09%). From 1999 to 2024, forest land expanded by 1.966 × 10⁴ km2, whereas cultivated land and grassland decreased by 9.738 × 10³ km2 and 1.874 × 10⁴ km2, respectively; 92.65% of construction-land expansion originated from cultivated land conversion. Correspondingly, total carbon storage followed a “fluctuation–decline–recovery” trajectory, decreasing from 3.833 × 10¹⁰ t in 1999 to 3.820 × 10¹⁰ t in 2014, before rebounding to 3.831 × 10¹⁰ t in 2024. Pronounced provincial heterogeneity was observed: Sichuan and Yunnan jointly contributed about 76% of regional carbon storage, while Chongqing and Guizhou remained relatively low. By 2049, EPS produced the highest carbon storage (3.854 × 10¹⁰ t), whereas CPS, UDS, and NDS all led to lower values than in 2024. These contrasts indicate that the four scenarios do not represent a simple ranking of “better” or “worse”, but rather different trade-offs among carbon sinks, cultivated land protection, urban development, and regional equity. Overall, the results support province-differentiated, zoning-based land governance and highlight the need to coordinate ecological protection, cultivated-land conservation, urban growth control, and interprovincial ecological compensation to enhance carbon sequestration and safeguard ecological security in the ESBZ.
1. Introduction
Global warming has transcended its status as a discrete environmental concern to become a systemic crisis profoundly threatening human welfare and development trajectories [1,2]. Anthropogenic CO2 emissions—driven primarily by fossil fuel combustion—are propelling the climate system toward extreme thermal states, destabilizing the global carbon budget and amplifying ecosystem risks [3,4]. This destabilization not only alters ecosystem structure and function but also undermines the delivery of critical services, including carbon sequestration, water retention, and climate regulation [5,6]. In response, the Paris Agreement established binding targets for temperature control and net-zero emissions, defining the scientific and policy boundaries essential for mitigation [1,2]. Within this framework, terrestrial ecosystems serve as vital “natural buffers” through vegetation and soil carbon sequestration; these services constitute a cornerstone for both climate change mitigation and the synergistic enhancement of ecosystem functions [7,8]. Concurrently, rapid land-system transformation has emerged as a primary driver of global change, significantly restructuring habitats, carbon pools, and productivity [9,10,11]. In China, a dual dynamic is evident: while national-scale vegetation “greening” and land management have substantially bolstered carbon sinks [12], rapid urbanization has precipitated the expansion of construction land and the reorganization of ecological spaces, thereby reshaping regional source-sink dynamics [13,14]. Consequently, optimizing the balance between emission reduction and sink enhancement at the territorial scale—amidst the parallel progression of ecological restoration and urbanization—remains a critical imperative for understanding coupled human–natural systems and informing spatial governance [8,15,16,17,18]
Extensive assessments and simulations of ecosystem carbon storage have spanned global, regional, watershed, and urban scales, systematically elucidating the impacts of land use change on carbon dynamics [4,9]. Traditional methodologies—underpinned by forest inventories, plot surveys, and empirical coefficient frameworks—have been instrumental in establishing carbon storage baselines. However, these approaches are often constrained by coarse spatial resolution and limited scenario comparability, hindering their ability to capture fine-scale spatiotemporal responses and variations driven by LUCC [15,19]. With the advancement of ecosystem service modeling, the InVEST model has emerged as a pivotal tool for assessment. By assigning carbon density parameters to specific land-use types, InVEST characterizes spatial carbon patterns and their evolution under LUCC at the grid scale, enabling trade-off analyses alongside biodiversity, production, and human well-being [8,20]. Consequently, InVEST-based frameworks have been widely deployed to quantify the potential shocks of urban expansion on regional carbon pools and to inform decision-making regarding multi-scenario spatial governance and ecological compensation [14,15].
To further this understanding, researchers have coupled InVEST with land-use change models such as CLUE-S, CA-Markov, and PLUS. This integration has established a critical paradigm for scenario analysis, enabling the prediction of land-use evolution and corresponding carbon storage responses under diverse policy or developmental trajectories [21,22,23]. However, traditional models often struggle to faithfully reproduce the spatial details of land-use evolution, exhibiting limitations in simulating patch growth processes, landscape connectivity, and the complex interactions of multiple driving factors [21,22]. Addressing these deficiencies, the PLUS model incorporates a specific patch-generating expansion strategy and data-driven factor mining. This approach superiorly characterizes the spatial competition and expansion of land-use patches, demonstrating enhanced accuracy and interpretability in multi-scenario simulations [24]. Recently, the coupled PLUS–InVEST framework has gained traction across urban agglomerations, watersheds, and resource-dependent regions. In this synergy, PLUS improves the spatial reliability of future land-use pattern simulations, while InVEST provides a unified platform for carbon storage assessment. Together, they allow for the coherent tracking of the coupled evolution of “land patterns and carbon storage” within a consistent scenario system [25,26,27,28,29]. Over the past two years, land-use prediction research has rapidly advanced from traditional land-cover transfer modeling to a new paradigm of coupled simulations integrating climate change, socio-economic scenarios, and ecosystem services. At the national scale, Guo et al. [30] developed an integrated LUH2–PLUS–InVEST framework for the synergistic projection of land-use patterns and carbon storage in China under SSP-RCP scenarios. This shift indicates an evolution from singular spatial pattern simulations to joint assessments encompassing structural forecasting, spatial allocation, and ecological impacts. Concurrently, the application of the PLUS model coupled with SSP-RCP scenarios to coal-resource-based cities by Li et al. [31] highlights land-use projection as a critical tool for balancing urban expansion, cropland conservation, and ecological security. At regional and applied scales, recent studies have enhanced the capacity to capture multi-scale dynamics, complex terrains, and policy constraints. For instance, Wu et al. [32] utilized the PLUS–InVEST framework to simulate the spatiotemporal evolution of land use and carbon storage in Dalian across various scenarios. Expanding to the urban agglomeration scale, Hao Wu et al. [33] introduced CMIP6 climate scenarios and a multi-scale optimization perspective, driving the field from basic scenario comparisons to comprehensive optimization analyses under climate constraints. Furthermore, Wu and Wang [16,32] confirmed the PLUS–InVEST framework’s robust applicability for assessing land-use changes and carbon storage responses in complex karst mountainous cities. Ultimately, research by Zhang et al. [25] in Hohhot substantiates that this coupled framework possesses strong replicability and robust explanatory power for evaluating policy scenarios.
Building upon this theoretical and methodological foundation, this study focuses on the ESBZ—a region of strategic significance for national ecological security—to investigate the spatiotemporal responses of ecosystem carbon storage to land-use change and multi-scenario development. Encompassing Sichuan, Chongqing, Yunnan, and Guizhou, this region serves as a critical headwater conservation zone for major basins like the Yangtze and Pearl Rivers and represents a global biodiversity hotspot. It is simultaneously characterized by ecological fragility and a high concentration of major ecological engineering projects. Long-term ecological restoration initiatives have significantly influenced regional carbon pools and ecosystem services, particularly regarding the remediation of degraded sloping cultivated land and vegetation recovery [34,35,36]. Concurrently, intensive development and rapid urbanization within this complex terrain continue to encroach upon limited high-quality ecological spaces, exacerbating the conflict between ecological conservation, economic development, and carbon sequestration [13,14]. To address these challenges, we applied a coupled PLUS–InVEST framework to systematically delineate the spatiotemporal evolution of ecosystem carbon storage within the ESBZ since 1999. Furthermore, we simulated the land-use patterns and corresponding carbon storage responses for 2049 under four distinct scenarios: Natural Development, Urban Development, Ecological Protection, and Cultivated land Protection. The spatial optimization strategy proposed herein is rooted in China’s territorial spatial planning system, embodying a governance logic that synergistically manages ecological conservation redlines, permanent basic cultivated land, and urban development boundaries. By focusing on the ESBZ, a comprehensive national-level region characterized by complex terrain, ecological fragility, and stringent policy constraints, this study broadens the application scope of the existing PLUS–InVEST framework for regional-scale carbon storage assessments. Our findings provide spatially explicit scientific evidence to inform territorial spatial planning, the layout of ecological restoration projects, and low-carbon development pathways. Moreover, this study offers a transferable methodological paradigm for achieving high-quality regional development under ecological security constraints.
2. Materials and Methods
2.1. Study Area
Located in the hinterland of Southwest China (approx. 21–34° N, 97–110° E), the ESBZ encompasses Sichuan, Yunnan, Guizhou, and Chongqing (Figure 1), covering a total area of approximately 1.13 × 10⁶ km2. This region functions as a vital ecological barrier for the upper Yangtze River and a critical zone for water conservation and biodiversity protection [37,38]. The region exhibits highly complex topography, situated within the transitional belt from the Qinghai–Tibet Plateau to the lower-elevation eastern plains. This transition creates a distinct gradient pattern ranging from “alpine gorges to plateau hills and basin plains.” Specifically, the western and southwestern margins are dominated by the eastern edge of the Qinghai–Tibet Plateau and the Hengduan Mountains, featuring significant elevational relief. The central region is defined by the Sichuan Basin, while the southeast is characterized by the extensive Yunnan–Guizhou Plateau and Karst hills [37,38,39]. Climatologically, the area is dominated by monsoon-controlled subtropical and plateau-mountain climates. Orographic uplift and elevational disparities drive pronounced vertical differentiation and regional variation. While precipitation is generally abundant, it exhibits strong seasonal and spatial heterogeneity [38,40]. Driven by the synergy of natural gradients and ecological engineering, the region hosts diverse ecosystem types. Predominant vegetation includes evergreen broad-leaved forests, coniferous forests, mixed coniferous–broad-leaved forests, and alpine shrub–meadows. Notably, recent years have witnessed a significant trend of vegetative “greening” and ecological quality recovery across much of the landscape [38,39,40].
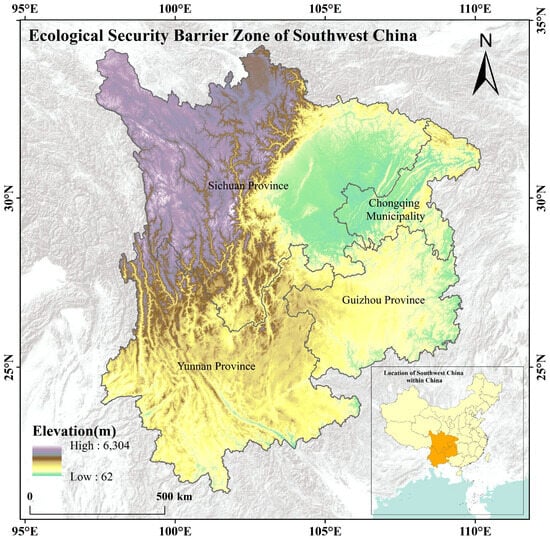
Figure 1.
Study area overview.
2.2. Data Sources and Processing
2.2.1. Land Use Data
Land-use data for the ESBZ (Yunnan, Sichuan, Guizhou, and Chongqing) spanning the period 1999–2024 were derived from the dataset constructed by Yang and Huang (2023) [41] (https://zenodo.org/record/8176941, accessed on 10 May 2025), with a spatial resolution of 300 m × 300 m. This dataset underwent rigorous standardization in accordance with the Current Land Use Classification (GB/T 21010-2017 [42]). To precisely characterize the dynamic evolution of land use across the region, we harmonized diverse land-use types into six primary categories: cultivated land, forest land, grassland, water area, construction land, unused land. While this classification scheme may simplify specific categories—such as wetlands, which possess distinct carbon cycling functions—their limited spatial distribution within the study area and their incorporation into the “Water” category render their impact on the overall carbon storage assessment negligible. Moreover, this classification framework has been widely adopted in related fields, ensuring procedural standardization and the cross-regional comparability of results. The primary objective of this standardized scheme is to streamline subsequent analyses while maintaining consistency across all spatiotemporal dimensions.
2.2.2. Driver Data
To simulate land-use dynamics within the study area, we selected 14 driving factors, grounding our choice in regional land-use characteristics and established literature (Figure 2, Table 1). The socio-economic category comprises six variables: Gross Domestic Product (GDP), population density, and distance to railway, road, county-level settlements, and river. The climate and environmental category encompasses eight variables: Digital Elevation Model (DEM), slope, slope direction, soil organic matter content, soil pH, soil sand content, mean annual temperature, and annual precipitation. Climatic data (e.g., precipitation and temperature) were generated via Anusplin interpolation, while topographic attributes (slope and slope direction) were derived directly from the DEM. Socio-economic metrics—specifically distance to infrastructure and settlements—were computed using the Euclidean Distance tool in ArcGIS 10.8, based on data sourced from OpenStreetMap (OSM) and the National Bureau of Statistics. The 14 driving factors utilized in this study were systematically selected based on empirical precedents, regional geographical characteristics, and data availability. Given that the LEAS module of the PLUS model relies on a random forest algorithm, which is inherently robust against multicollinearity, a separate multicollinearity diagnostic was omitted as a preliminary screening step.
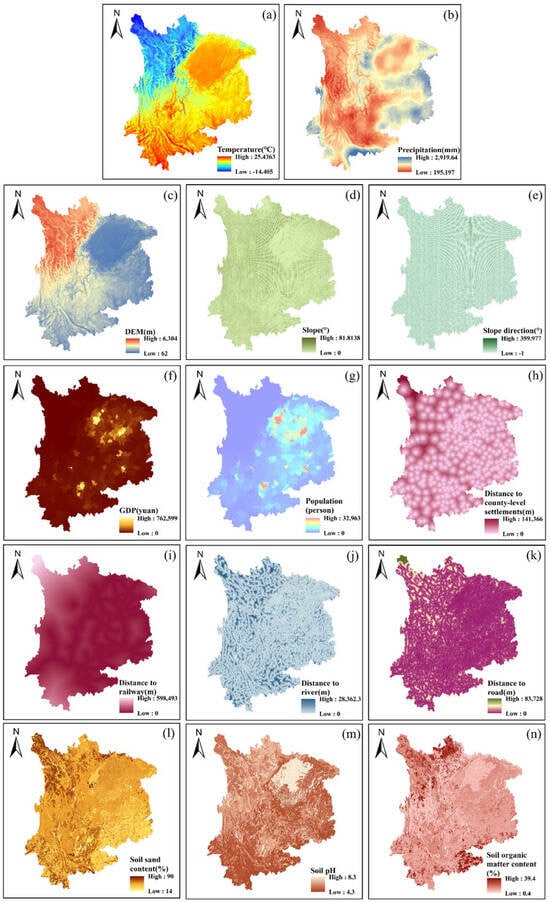
Figure 2.
Main driving factors of land use change in ESBZ. (a) Temperature, (b) Precipitation, (c) DEM, (d) Slope, (e) Slope direction, (f) GDP, (g) Population, (h) Distance to county-level settlements, (i) Distance to railway, (j) Distance to river, (k) Distance to road, (l) Soil sand content, (m) Soil pH, (n) Soil organic matter content.

Table 1.
The driving factors of simulated land-use change.
2.3. Research Methods
2.3.1. PLUS Model
The PLUS model has emerged as a widely adopted patch-generating Cellular Automata (CA) framework for land use and land cover scenario simulation. By integrating the Land Expansion Analysis Strategy (LEAS) to extract conversion rules and a CA model based on Multi-type Random Patch Seeds (CARS) to simulate patch dynamics, PLUS excels in reproducing landscape patterns and enhancing simulation accuracy [24]. In standard applications, researchers typically employ Markov Chains—based on historical transition matrices—to project future demands for various land categories. Subsequently, the LEAS–CARS module executes spatial allocation under specific driving factors and scenario constraints, thereby supporting multi-scenario landscape deduction and policy assessment [43,44]. Specifically, LEAS identifies expansion units by overlaying land-use data from two distinct periods to extract transition statistics. By coupling this with non-parametric learning algorithms such as Random Forest, it characterizes the non-linear relationships between driving factors and land expansion, estimating growth probabilities and revealing critical conversion mechanisms [24]. Random Forest offers robust capabilities for evaluating variable importance within high-dimensional, collinear, and non-linear contexts [45,46]. Consequently, it has been successfully applied to identify core drivers of urban land-use change and quantify their relative contributions [47]. Building on this foundation, PLUS automatically generates patch-level simulation outputs under defined constraints and spatial parameters. This capability has led to its extensive application in multi-regional and multi-scale scenario simulations and ecological effect assessments [27,48].
2.3.2. Accuracy Verification
Following parameter calibration using historical datasets from 1999 and 2024, the PLUS model was employed to simulate the 2024 land-use scenario. Comparative validation against actual 2024 observations yielded a Kappa coefficient of 0.85, the FoM value was 0.20, and an overall accuracy of 0.91. These robust metrics substantiate the model’s high reliability and applicability for projecting future LUCC dynamics within the study area. The detailed methodological workflow is presented in Figure 3.
Figure 3.
Flow chart of correlation analysis.
2.3.3. Setting of Multi-Scenario Transition Matrix
To systematically characterize the potential evolutionary pathways of land-use transition in the ESBZ through 2049, we constructed four representative scenarios grounded in distinct developmental orientations. These scenarios elucidate the potential divergence in land-use patterns under varying trajectories and policy preferences.
NDS: Grounded in the evolutionary inertia of land-use dynamics from 1999 to 2024, this scenario assumes an absence of intensified future interventions, thereby sustaining the historical continuity of land-use transition probabilities. It serves as a baseline scenario to identify the natural evolutionary trends of regional land use and carbon storage.
UDS: Driven by the prevailing context of sustained urbanization, infrastructure expansion, and escalating demands for construction land, this scenario assumes a prioritization of future development. Specifically, it applies a moderate increase to the probabilities of various land types transitioning into construction land, while simultaneously reducing the probability of construction land reverting to other classifications. The primary objective is to delineate the risks associated with the compression of ecological space and subsequent alterations in carbon storage under high-intensity development. Here, transition probabilities from cultivated land, forest land, grassland, water area, and unused land to construction land were upregulated by 30%, 25%, 25%, 10%, and 20%, respectively. Concurrently, conversions from construction land to cultivated land, forest, and grassland were down regulated by 40% to emphasize the net expansion of built-up areas.
CPS: Guided by policy directives encompassing food security, cultivated land protection redlines, and permanent basic cultivated land management, this scenario posits a future emphasis on the stabilization and replenishment of cultivated land. Specifically, it restricts the conversion of cultivated land to non-agricultural and non-grain purposes while moderately elevating the probability of other land categories transitioning into cultivated land. The objective is to elucidate the trade-offs between cultivated land protection and carbon storage dynamics. Probabilities of converting forest land, grassland, water area, construction land, and unused land to cultivated land were increased by 15%, 15%, 10%, 20%, and 25%, respectively. Furthermore, outflows from cultivated land to construction land, forest land, and grassland were reduced by 30% to mitigate the risks of conversion to non-agricultural or non-grain production purposes.
EPS: Contextualized within the frameworks of ecological civilization, the “Dual Carbon” goals, ecological conservation redlines, and ecological restoration initiatives, this scenario prioritizes the safeguarding of ecological space. Specifically, it facilitates the conversion of cultivated land and unused land into forest land and grassland, while strictly constraining the degradation of ecological land into construction land. The objective is to evaluate the potential for regional carbon sink enhancement and to identify spatial optimization pathways under an ecology-first paradigm. In this scenario, transition probabilities from cultivated land and unused land to forest and grassland were both enhanced by 30%. Conversely, conversions from grassland and water area to construction land were reduced by 40%, while forest-to-construction and forest-to-cultivated land transitions were lowered by 40% and 20%, respectively. Additionally, construction land-to-cultivated land conversion was increased by 10%, collectively reinforcing the expansion of ecological spaces and constraining construction intensity in ecologically sensitive areas.
Importantly, the four scenarios established in this study—NDS, UDS, CPS, and EPS—function as policy-driven exploratory scenarios. They are primarily designed to compare the potential responses of land-use patterns and carbon storage under divergent development pathways, rather than to serve as deterministic predictions of the land-use state in 2049. Future land-use dynamics remain subject to multiple uncertainties, including policy shifts, economic growth rates, urbanization trajectories, and climate change. Consequently, this study emphasizes identifying the relative discrepancies, directional shifts, and spatial heterogeneity across different scenarios, thereby providing a reference framework for regional land-use optimization and carbon management.
In the PLUS model, the neighborhood factor weights according to the actual situation are shown in the table below (Table 2). The cost matrix indicates whether the conversion of land use types is allowed. We set the corresponding value to 1 when the conversion is allowed, while setting it to 0 means that the conversion is forbidden [49,50]. The cost matrix of the scenarios is set out in Table 3. In addition, The patch generation threshold was set to 0.5, and the patch seed generation threshold was set to 0.0001. A 3 × 3 neighborhood was used in the CA simulation. The iterative allocation process continued until the projected land-use demand was satisfied.
Table 2.
Neighborhood factor weight.
Table 3.
Conversion cost matrix of land use types under different scenarios.
2.3.4. InVEST Model
By assessing ecosystem service dynamics under diverse land-use scenarios, the InVEST model establishes a rigorous scientific foundation for decision-makers to balance anthropogenic benefits against their environmental costs [51]. Specifically, the model’s Carbon Storage and Sequestration module quantifies the carbon sequestration potential of terrestrial ecosystems by synthesizing data from four key carbon pools: aboveground biomass, belowground biomass, soil organic carbon, and dead organic matter. Within this framework, carbon density is defined as the quantity of carbon stored per unit area, and the total regional carbon storage is derived using the following equation:
In this equation, Cj denotes the carbon density of land use type j. The terms Cj-above, Cj-below, Cj-soil, and Cj-dead correspond to the carbon densities of aboveground biomass, belowground biomass, soil carbon, and dead organic carbon, respectively. Furthermore, Sj signifies the area of land use type j, while Ctotal represents the total carbon storage.
Carbon density is substantially influenced by climatic conditions, particularly temperature and precipitation [52]. Consequently, we corrected the carbon densities for aboveground biomass, belowground biomass, and soil within the study area by applying the formulas proposed by Tang et al. (2018) [53], as expressed below:
In the equations, CST and CBT denote the biomass carbon density and soil carbon density, respectively, derived from mean annual temperature (t·hm−2). Similarly, CSP represents the biomass and soil carbon densities derived from annual precipitation (t·hm−2). The variable P signifies the annual precipitation (mm), while t indicates the mean annual temperature (°C).
In the equations, KSP and KBP denote the precipitation-based correction coefficients for soil and biomass carbon densities, respectively. CSP1 and CSP2 represent soil carbon densities derived from annual precipitation at the ESBZ and national scales, while CBP1 and CBP2 refer to the corresponding biomass carbon densities. Similarly, KST and KBT signify the temperature-based correction coefficients for soil and biomass carbon densities. CST1 and CST2 correspond to soil carbon densities derived from mean annual temperature at the regional and national scales, whereas CBT1 and CBT2 denote the respective biomass carbon densities. Furthermore, KS and KB represent the overall correction coefficients for soil and biomass carbon densities. Dead organic carbon density was parameterized following Wan et al. (2024) [54]; the final adjusted carbon density values are listed in Table 4.
Table 4.
Carbon density of each land use type in ESBZ (t·hm−2).
3. Results and Analysis
3.1. Land Use Change Patterns in the ESBZ from 1999 to 2024
3.1.1. Changes in Land Use Area
From 1999 to 2024, the land-use composition in the ESBZ was dominated by cultivated land, forest land, and grassland, which collectively accounted for approximately 97.95% of the total regional area (Figure 4, Table 5). Specifically, forest land constituted the largest share (56.38%), followed by cultivated land (25.49%) and grassland (16.07%). The remaining categories occupied minor proportions, with water area, construction land, and unused land comprising approximately 0.63%, 0.84%, and 0.56%, respectively. In terms of areal dynamics, the three dominant land-use types exhibited the most pronounced shifts. Forest land experienced the most significant expansion, with a net increase of 1.966 × 10⁴ km2, whereas grassland and cultivated land underwent net reductions of 1.874 × 10⁴ km2 and 9.738 × 10³ km2, respectively, corresponding to single dynamic degrees of 0.32%, −0.94%, and −0.33% for the 1999–2024 period. Cultivated land exhibited a fluctuating downward trend throughout the study period, with phasic dynamic degrees of 0.05%, −0.11%, 0.13%, −0.33%, and −0.07%. Conversely, forest land displayed a trajectory of fluctuating growth, with phasic dynamic degrees recording −0.01%, 0.09%, −0.04%, 0.17%, and 0.11%. Grassland, however, underwent continuous contraction, indicated by sequential phasic dynamic degrees of −0.12%, −0.20%, −0.23%, −0.15%, and −0.27%. Among other categories, water area followed a trajectory of “initial expansion followed by retraction,” with phasic dynamic degrees of 0.41%, 1.16%, 0.79%, −0.02%, and −0.86%. Notably, construction land exhibited the most rapid relative expansion, accumulating a net increase of 6.442 × 10³ km2 by 2024. This corresponds to a single dynamic degree of 20.63%, underscoring the potent driving effect of urbanization on reshaping the landscape pattern. Unused land also demonstrated a marginal increase, expanding by 1.492 × 10³ km2 with a dynamic degree of 3.04%.
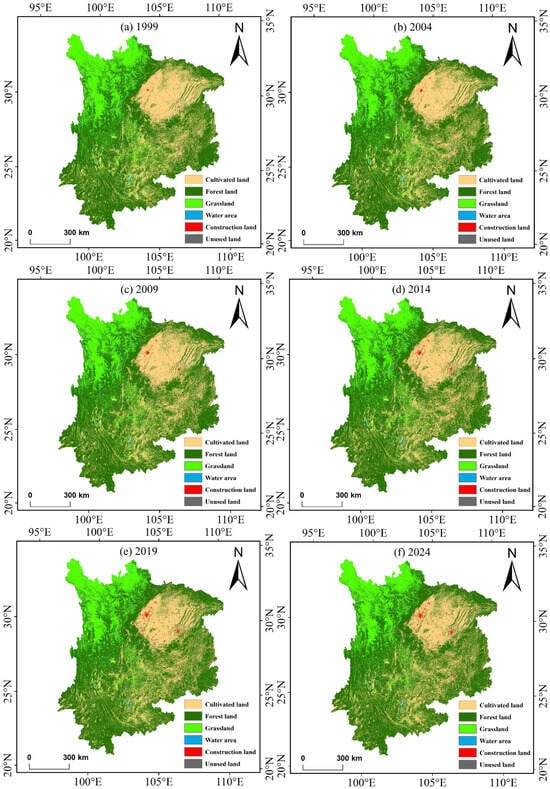
Figure 4.
Distribution of land use types: (a) 1999, (b) 2004, (c) 2009, (d) 2014, (e) 2019, (f) 2024.
Table 5.
Land use/cover area changes and single dynamic degree.
Analyzed at the regional scale, the land-use structure within Sichuan Province underwent substantial reconfiguration between 1999 and 2024. Cultivated land area contracted from 1.206 × 10⁵ km2 to 1.101 × 10⁵ km2, a net reduction of 1.055 × 10⁴ km2 (−8.74%), reducing its areal share from 24.83% to 22.66%. This category exhibited continuous shrinkage, with the most precipitous decline occurring during the 2014–2019 period (−4.880 × 10³ km2). Conversely, forest land expanded from 1.896 × 10⁵ km2 to 2.031 × 10⁵ km2, achieving a net gain of 1.345 × 10⁴ km2 and elevating its proportion from 39.04% to 41.80%. The largest increment occurred between 2014 and 2019 (+4.942 × 10³ km2), indicating a distinct trend of ecological space expansion. Grassland generally displayed a consistent downward trend, decreasing from 1.664 × 10⁵ km2 to 1.589 × 10⁵ km2 (a net loss of 7.493 × 10³ km2), causing its share to drop from 34.25% to 32.70%. Construction land demonstrated the most dramatic expansion, surging from 1.783 × 10³ km2 to 4.845 × 10³ km2. This cumulative increase of 3.063 × 10³ km2 (+171.77%) raised its share from 0.37% to 1.00%. Water area showed a slight overall increase but was characterized by significant volatility, following a pattern of “initial growth followed by decline.” Finally, unused land increased from 4.412 × 10³ km2 to 5.832 × 10³ km2, representing a net growth of 1.420 × 10³ km2 (+32.19%).
Land use patterns in Yunnan Province evolved through a distinct configuration characterized by the stable dominance of forest land, fluctuating growth in cultivated land, continuous contraction of grassland, and marked expansion of construction land. Specifically, forest land consistently maintained absolute predominance; its area increased from 2.704 × 10⁵ km2 to 2.726 × 10⁵ km2, a net gain of 2.186 × 10³ km2, raising its proportion slightly from 70.60% to 71.17%. This trajectory exhibited phasic fluctuations within an overall trend of stable growth. Cultivated land expanded from 8.027 × 10⁴ km2 to 8.523 × 10⁴ km2, a net increase of 4.963 × 10³ km2 (+6.18%), yet displayed significant volatility: a decline of 1.497 × 10³ km2 (2004–2009) was followed by a recovery of 3.169 × 10³ km2 (2009–2014) and further growth of 2.465 × 10³ km2 (2019–2024). In contrast, grassland receded from 2.929 × 10⁴ km2 to 2.080 × 10⁴ km2, a net reduction of 8.493 × 10³ km2 (−28.99%), causing its proportion to drop from 7.65% to 5.43%. Decreases occurred across all intervals, with the sharpest decline (−2.489 × 10³ km2) observed between 2019 and 2024, indicating a persistent and intensifying contraction. Concurrently, the water area generally increased by 3.229 × 10² km2, despite a downturn in 2019–2024. Notably, construction land underwent rapid expansion, growing from 4.941 × 10² km2 to 1.477 × 10³ km2—a net gain of 9.829 × 10² km2 (+198.93%)—with its proportion rising from 0.13% to 0.39% amid continuous growth across all phases, while unused land showed a slight overall increase, keeping a largely stable proportion.
In Guizhou Province, cultivated land expanded slightly from 5.723 × 10⁴ km2 to 5.749 × 10⁴ km2, with its proportion rising marginally from 32.52% to 32.67%. However, this trajectory followed an “increase-then-decrease” pattern: the area grew continuously between 1999 and 2014, peaking at 6.177 × 10⁴ km2 in 2014, before declining significantly from 2014 to 2024. Forest land exhibited overall expansion, increasing from 1.138 × 10⁵ km2 to 1.148 × 10⁵ km2 (a net gain of 0.86%). Its evolution was characterized by “initial contraction followed by recovery”: the area contracted to 1.101 × 10⁵ km2 during 1999–2009 but increased rapidly after 2014, with a notable accumulation of 4.543 × 10³ km2 between 2014 and 2024. Grassland experienced the most pronounced contraction, shrinking from 4.179 × 10³ km2 to 1.595 × 10³ km2—a net reduction of 61.82%. Its share of the total area fell from 2.37% to 0.91%, reflecting a consistent downward trend. The water area generally increased, albeit with distinct fluctuations, growing from 4.025 × 10² km2 to 6.377 × 10² km2 (a net increase of 58.43%). It reached a phase peak of 6.654 × 10² km2 in 2019 before receding slightly. Construction land demonstrated remarkable expansion intensity, surging from 3.691 × 10² km2 to 1.473 × 10³ km2. This represents a cumulative increase of 1.103 × 10³ km2 (+299.00%), lifting its proportion from 0.21% to 0.84%. Growth persisted across all stages, with the largest increment occurring between 2014 and 2019. Although unused land showed an overall increase, its proportion remained negligible.
Land use evolution in Chongqing Municipality was characterized by a distinct pattern of steady forest expansion, continuous compression of cultivated land, substantial grassland shrinkage, and rapid growth of construction land. In 1999, cultivated land (3.890 × 10⁴ km2, 47.20%) and forest land (4.204 × 10⁴ km2, 51.01%) constituted the dominant categories. Together, they accounted for over 98% of the total area, leaving negligible shares for other land types. By 2024, cultivated land had declined to 3.425 × 10⁴ km2—a relative decrease of 11.97%—dropping its share to 41.55%. Conversely, forest land expanded to 4.529 × 10⁴ km2, a net gain of 3.245 × 10³ km2, raising its proportion to 54.94%. Grassland contracted by approximately 68.97%, with its share shrinking from 0.24% to a mere 0.08%, indicating a persistent retreating trend throughout the study period. The water area showed a slow, fluctuating increase, rising from 7.969 × 10² km2 to 1.037 × 10³ km2 (a net rise of 30.13%) and lifting its proportion from 0.97% to 1.26%. Construction land recorded the most dramatic expansion, surging from 4.820 × 10² km2 in 1999 to 1.792 × 10³ km2 in 2024. This net increase of 1.310 × 10³ km2 (+271.82%) elevated its proportion from 0.58% to 2.17%, highlighting the profound impact of urbanization and infrastructure development in reshaping the land use landscape. Unused land remained negligible in both area and proportion, exerting limited influence on the overall configuration.
3.1.2. Land Use Transition Analysis
Between 1999 and 2024, the total land use transfer area in the ESBZ amounted to 1.413 × 10⁵ km2, representing 12.5% of the total regional area (Figure 5, Table 6). Cultivated land experienced an outflow of 6.289 × 10⁴ km2, exhibiting a pronounced directional bias: 78.65% converted to forest land, 9.07% to grassland, and 10.12% to construction land, with negligible transfers to other categories. The outflow from forest land totaled 4.623 × 10⁴ km2 and was highly concentrated, with 92.42% reverting to cultivated land and 7.02% shifting to grassland; other transfers were insignificant. Grassland outflow reached 2.915 × 10⁴ km2, primarily flowing into forest land (55.90%; 1.629 × 10⁴ km2) and cultivated land (33.46%; 9.754 × 10³ km2), while 8.02% transitioned to unused land. Construction land saw a minor outflow of 4.278 × 10² km2, 87.12% of which converted to the water area. The outflow from the water area was 1.577 × 10³ km2, distributed mainly between cultivated land (39.31%) and grassland (36.24%). Finally, unused land outflow was 1.032 × 10³ km2, with 85.70% converting to grassland; shares for other destinations remained below 10%. From the inflow perspective, forest land received 6.589 × 10⁴ km2, with 75.07% originating from cultivated land. This proportion aligns closely with the core objectives of the “Grain for Green” program, underscoring the policy as the dominant driver of forest expansion in the ESBZ. Simultaneously, construction land received an inflow of 6.870 × 10³ km2, 92.65% of which was derived from cultivated land, indicating that the occupation of cultivated land for urbanization is the primary source of construction land expansion.
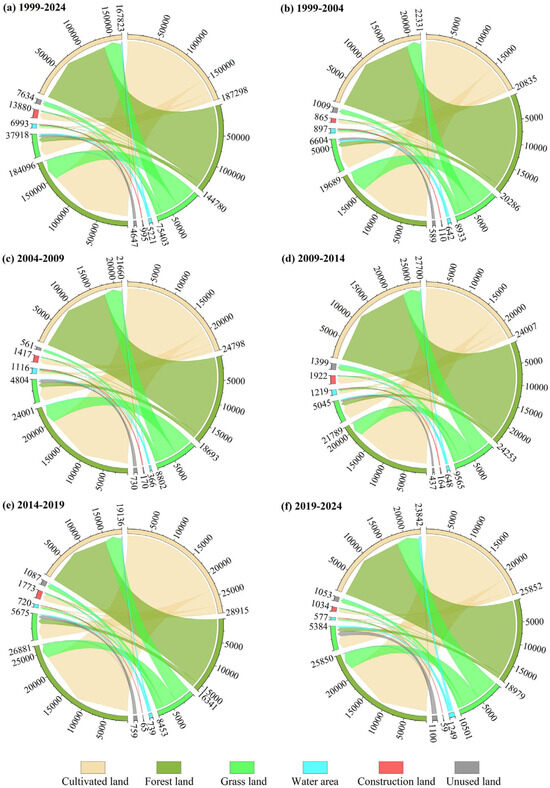
Figure 5.
Chart of land use transfer matrix in each period: (a) 1999–2024, (b) 1999–2004, (c) 2004–2009, (d) 2009–2014, (e) 2014–2019, (f) 2019–2024.
Table 6.
Land use/cover transfer matrix in ESBZ (km2).
The period from 1999 to 2004 marked the foundational phase, during which cultivated land served as the core supply source with an outflow of 2.084 × 10⁴ km2. Specifically, the transfer of 1.500 × 10⁴ km2 to forest land highlighted the initial implementation of the “Grain for Green” program, while the conversion of 7.540 × 10² km2 to construction land signaled the onset of urbanization encroachment (Figure 6a). The 2004–2009 interval functioned as the trend intensification phase, reinforcing the trajectory established in the previous period. Cultivated land outflow rose to 2.450 × 10⁴ km2, with transfers to forest land expanding further (1.998 × 10⁴ km2; Figure 6b), reflecting intensified efforts in the “Grain for Green” initiative. Concurrently, the inflow to construction land increased to 1.416 × 10³ km2, indicating a significant acceleration in urbanization. In contrast, the inflow to unused land dropped from 1.008 × 10³ km2 to 5.618 × 10² km2, suggesting an initial contraction of its stock. The years 2009–2014 represented a supplementary adjustment phase. While the outflow trends of cultivated land to forest and construction land persisted (Figure 6c), cultivated land inflow peaked at 2.770 × 10⁴ km2, sustained primarily by conversions from forest land. Although construction land inflow continued to grow, the deceleration in its growth rate signaled a subtle reconfiguration of resource allocation. The period 2014–2019 emerged as a phase of prominent contradictions. Cultivated land outflow reached a temporal maximum of 2.892 × 10⁴ km2, with transfers to forest and construction land remaining the dominant directions (Figure 6d). Forest land inflow hit a new high of 2.688 × 10⁴ km2, demonstrating a reinforced commitment to ecological restoration. The outflow from unused land doubled compared to the previous period, with 96.71% converting to grassland, thereby continuing an eco-friendly development pattern. Meanwhile, a slight decline in construction land inflow reflected an initial adjustment in the pace of urbanization. Finally, 2019–2024 served as the rhythm optimization phase, where core trends persisted with modulated intensity. Both the outflow (2.585 × 10⁴ km2) and inflow (2.384 × 10⁴ km2) of cultivated land receded from their peaks (Figure 6e), indicating a bidirectional convergence between protection and loss. Forest land inflow remained substantial, sustaining the momentum of ecological restoration. Crucially, the marked decline in construction land inflow signified a staged transition in urbanization from “acceleration” to “quality-oriented development.”
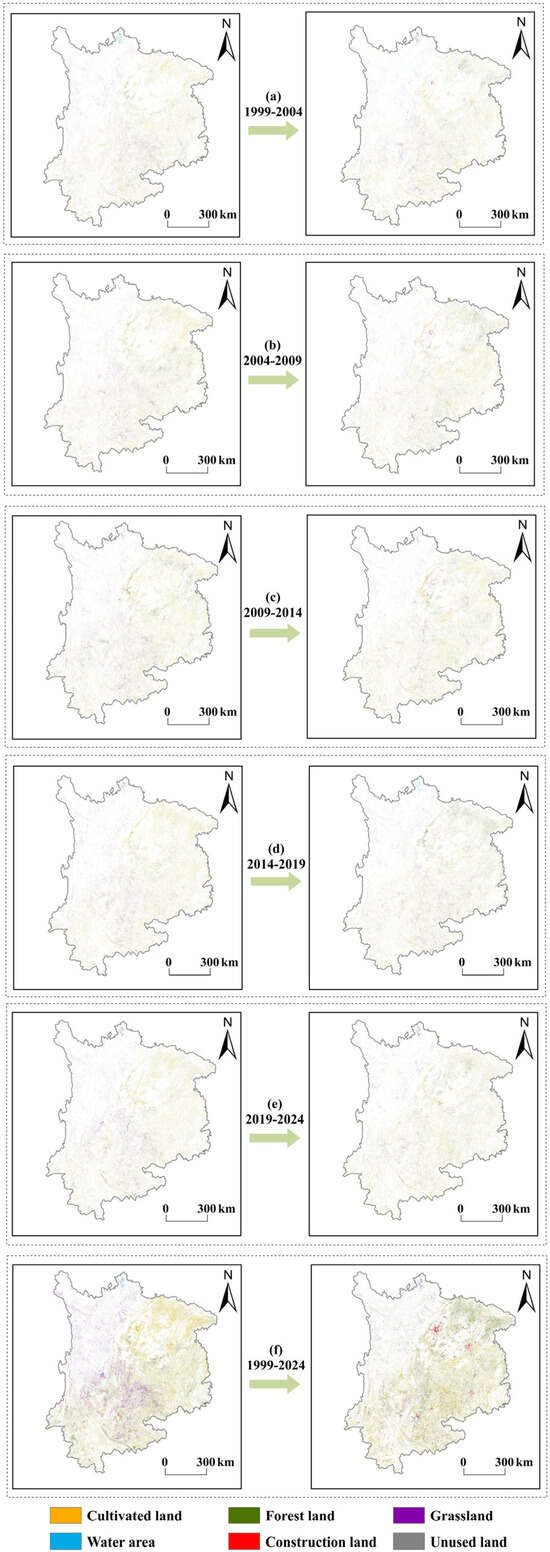
Figure 6.
Spatial patterns of LUCC in each period.(a) 1999–2004, (b) 2004–2009, (c) 2009–2014, (d) 2014–2019, (e) 2019–2024, (f) 1999–2024.
3.2. Projection of Future Land Use Under Diverse Scenarios
Building upon historical land use data (1999–2024) for the ESBZ, this study utilized the PLUS model to project spatial land use patterns for the year 2049 across four distinct scenarios (Figure 7). The specific dynamics of change occurring between 2024 and 2049 are detailed in Table 7.
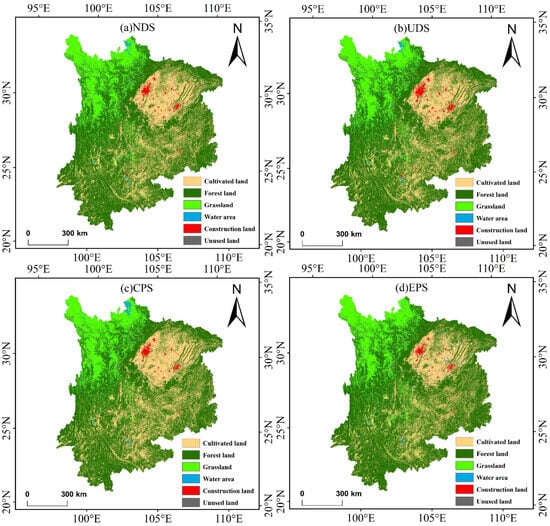
Figure 7.
Distribution of land use types under the four scenarios in 2040: (a) NDS, (b) UDS, (c) CPS, (d) EPS.
Table 7.
Projected areas and corresponding percentages of land use change under four scenarios over the next 25 years (to 2049).
With 2024 serving as the baseline, the total land use area in the ESBZ was approximately 1.127 × 10⁶ km2. The composition was dominated by forest land (6.358 × 10⁵ km2; 56.40%), cultivated land (2.871 × 10⁵ km2; 25.47%), and grassland (1.813 × 10⁵ km2; 16.09%), while the water area, construction land, and unused land collectively accounted for less than 2.1%. Across the four scenarios projected for 2049, the total regional area remained conserved, with changes manifesting primarily as inter-category conversions. Under the NDS (Figure 8a), cultivated land and grassland declined by 2.02% and 8.07%, respectively. Conversely, forest land expanded by 1.384 × 10⁴ km2 (+2.18%), and construction land surged to 1.395 × 10⁴ km2 (+45.56%), reaching a proportion of 1.24%. Provincially, the extremes of change were concentrated in Sichuan Province, which recorded the largest net increase in forest land (8.868 × 10³ km2) and the steepest decline in grassland (9.702 × 10³ km2). In this scenario, forest expansion and grassland contraction emerged as the core transformations, reflecting the combined influence of natural succession and mild anthropogenic activity.
Figure 8.
Spatial patterns of LUCC under the four scenarios in 2049.(a) NDS, (b) UDS, (c) CPS, (d) EPS.
Under the UDS (Figure 8b), construction expansion was further amplified. Construction land reached 1.660 × 10⁴ km2—a net increase of 7.013 × 10³ km2 (+73.15%)—accounting for 1.47% of the total area. Concurrently, cultivated land and grassland contracted to 2.791 × 10⁵ km2 (−2.77%) and 1.666 × 10⁵ km2 (−8.13%), respectively, while forest land retained a modest growth of 2.10%. Most notably, Chongqing Municipality exhibited the most dramatic shift, with construction land escalating from 1.792 × 10³ km2 to 3.366 × 10³ km2 (+87.81%). In Sichuan Province, the reduction in grassland (8.243 × 10³ km2) and the expansion of forest land (7.676 × 10³ km2) represented the most significant regional decline and accumulation, respectively. These dynamics reflect the encroachment of land demand—driven by the Chengdu-Chongqing urban agglomeration and transportation corridors—upon cultivated land and grassland. However, the sustained growth of forest land suggests that ecological constraints remain effective.
The CPS (Figure 8c) is characterized by a distinct strategy of “quantity preservation and proportional increase.” Under this scenario, cultivated land expanded to 3.104 × 10⁵ km2 (+8.14%), capturing 27.54% of the total area. In contrast, forest land and grassland declined to 6.257 × 10⁵ km2 (−1.58%) and 1.637 × 10⁵ km2 (−9.73%), respectively. Although construction land continued to grow, its expansion was moderated, reaching 1.174 × 10⁴ km2 (+22.42%). At the provincial level, Yunnan recorded the most substantial gains in cultivated land (1.539 × 10⁴ km2) and the steepest reductions in grassland (9.317 × 10³ km2). Notably, construction land in Yunnan and Guizhou provinces decreased by 4.198 × 10² km2 and 6.272 × 10² km2, respectively. These dynamics indicate that, constrained by mechanisms such as “permanent basic cultivated land” protection, the “requisition-compensation balance,” and land consolidation, cultivated land expansion is driven primarily by conversions from grassland and forest land, accompanied by stricter controls on construction land.
Under the EPS (Figure 8d), the dominant trajectory shifted toward “forest expansion and cultivated land compression.” Forest land ascended to 6.759 × 10⁵ km2, a net gain of 4.018 × 10⁴ km2 (+6.32%), comprising 59.96% of the total area. Conversely, cultivated land and grassland declined to 2.539 × 10⁵ km2 (−11.55%) and 1.691 × 10⁵ km2 (−6.73%), respectively, while construction land increased to 1.306 × 10⁴ km2 (+36.25%). Regionally, Sichuan Province recorded the largest variations across the entire domain, with a net forest gain of 2.107 × 10⁴ km2 and a cultivated land loss of 1.494 × 10⁴ km2. These results suggest that under assumptions prioritizing “ecological red lines” and the “Grain for Green” program, cultivated land reverts more readily to forest. However, due to rigid demand from population and industrial agglomerations, construction land continued to expand—albeit at a rate significantly lower than in the urban development scenario—even under strict ecological constraints.
3.3. Dynamic Characteristics of Carbon Storage in ESBZ
3.3.1. Temporal Variability of Carbon Storage
Between 1999 and 2024, regional carbon storage in the ESBZ exhibited a multi-stage evolutionary trajectory characterized by “fluctuating adjustment, phasic decline, and gradual recovery” (Table 8). Regionally, carbon storage initiated at 3.833 × 10¹⁰ t in 1999, dipping slightly to 3.830 × 10¹⁰ t in 2004 (a reduction of 3.588 × 10⁷ t) and maintaining relative stability through 2009. A marked decline occurred in 2014, reaching 3.820 × 10¹⁰ t (a decrease of 9.338 × 10⁷ t relative to 2009). Subsequently, storage rebounded to 3.825 × 10¹⁰ t in 2019 (+4.924 × 10⁷ t vs. 2014) and further to 3.831 × 10¹⁰ t in 2024, nearly recovering to the initial 1999 baseline. At the provincial level, carbon storage dynamics exhibited distinct regional heterogeneity. Chongqing Municipality followed a fluctuating downward trend from 1999 to 2014, declining from 2.764 × 10⁹ t to 2.747 × 10⁹ t. This was followed by a gradual recovery, reaching 2.758 × 10⁹ t in 2024—an increase of 1.142 × 10⁷ t over 2014. Yunnan Province maintained a stable range around 1.357 × 10¹⁰ t tons. With a fluctuation amplitude of only 1.414 × 10⁷ t between 1999 and 2024, it emerged as the most stable zone for carbon storage within the ESBZ. Sichuan Province experienced a decline from 1.582 × 10¹⁰ t to 1.578 × 10¹⁰ t (−4.140 × 10⁷ t) during 1999–2014. However, it demonstrated a continuous recovery from 2014 to 2024, reaching 1.585 × 10¹⁰ t (+6.327 × 10⁷ t vs. 2014), distinguishing it as the region with the most significant recovery magnitude. Guizhou Province displayed a fluctuating decline from 6.163 × 10⁹ t to 6.114 × 10⁹ t (1999–2014), followed by a gradual recovery to 6.141 × 10⁹ t in 2024, essentially restoring carbon storage to 2004 levels.
Table 8.
Provincial Carbon Storage in 1999, 2004, 2009, 2014, 2019 and 2024 (109 t).
Under the NDS (Table 9), the projected carbon storage for the ESBZ in 2049 is 3.828 × 10¹⁰ t—a decrease of approximately 2.978 × 10⁷ t relative to the 2024 actual value. This figure occupies an intermediate position among the four scenarios, reflecting the baseline trajectory of carbon storage evolution in the absence of additional anthropogenic intervention. In the CPS, carbon storage is projected to decline to 3.812 × 10¹⁰ t, a reduction of roughly 1.942 × 10⁸ t compared to the 2024 observation (3.831 × 10¹⁰ t). This significant loss is primarily attributed to the target-driven expansion of cultivated land, which encroaches upon carbon-dense forest and grassland ecosystems. This displacement directly diminishes the scale of regional carbon carriers, triggering substantial carbon losses. Furthermore, physical soil disturbance during reclamation accelerates the decomposition of soil organic matter, thereby exacerbating carbon depletion. Conversely, under the EPS, carbon storage ascends to 3.854 × 10¹⁰ t, an increase of approximately 2.303 × 10⁸ t over the 2024 baseline. Representing the highest level among the scenarios, this gain underscores the substantive positive regulatory effect of ecological protection measures on regional carbon sequestration. Finally, under the UDS, carbon storage is projected at 3.822 × 10¹⁰ t, a decrease of about 8.986 × 10⁷ t relative to 2024. The core driver of this decline is the rapid sprawl of built-up areas, which displaces surrounding forest and grassland. This replacement directly reduces the proportion of carbon sink lands, while land hardening and native vegetation removal during development further weaken local carbon fixation capacities.
Table 9.
Provincial Carbon Storage under Four Scenarios in 2049 (109 t).
Fundamentally, the NDS, UDS, CPS, and EPS do not constitute a simplistic hierarchy of merit; rather, they represent four distinct land-use trajectories driven by divergent developmental orientations: baseline continuity, prioritized urban expansion, prioritized food security, and prioritized ecological conservation, respectively. Among these, the NDS reflects a baseline trend of a marginal decline in regional carbon storage in the absence of additional interventions. The UDS illustrates the sustained encroachment of construction-land expansion upon forest land, grassland, and cultivated land spaces; although its associated carbon loss is lower than that of the CPS, it potentially exacerbates the appropriation of cultivated land, spatial sprawl, and urban–rural developmental imbalances. While the CPS is conducive to stabilizing the quantity of cultivated land and food production space, it achieves cultivated land replenishment at the expense of forest land and grassland, thereby precipitating the most substantial decline in regional carbon storage. Conversely, the EPS achieves the highest carbon storage; however, the concurrent reduction in cultivated land implies that, in the absence of refined spatial zoning and supporting compensation mechanisms, it may exert potential adverse impacts on food security, the incomes of certain agricultural stakeholders, and balanced urban–rural development. Consequently, the comparative analysis of these four scenarios aims not to identify a singular “optimal” pathway, but to elucidate the multi-objective trade-off boundaries among carbon sink enhancement, cultivated land protection, urban development, and regional equity within the ESBZ.
3.3.2. Spatial Distribution Patterns of Carbon Storage in ESBZ
Carbon storage in the ESBZ exhibits a distinct spatial gradient, characterized by “high values in Sichuan and Yunnan, and low values in Chongqing and Guizhou” (Figure 9). Yunnan and Sichuan provinces constitute the high-value zones, relying on vast ecological lands—primarily forests and grasslands—as core carbon carriers. Between 1999 and 2024, the average annual carbon storage stabilized at approximately 1.357 × 10¹⁰ t in Yunnan and 1.582 × 10¹⁰ t in Sichuan. Together, these two provinces underpin roughly 76% of the total regional carbon stock. Conversely, Chongqing Municipality and Guizhou Province represent low-value zones. Constrained by topography and land use structures, these areas feature relatively high proportions of cultivated and construction land alongside limited ecological land. During the same period, average annual carbon storage was approximately 2.759 × 10⁹ t for Chongqing and 6.134 × 10⁹ t for Guizhou. In terms of regional contribution, Yunnan and Sichuan serve as the foundational pillars of the ESBZ’s carbon storage, driven by their extensive ecological land cover. In contrast, the Chongqing-Guizhou region, restricted by terrain and land composition, consistently occupies the lower range of the carbon storage spectrum.
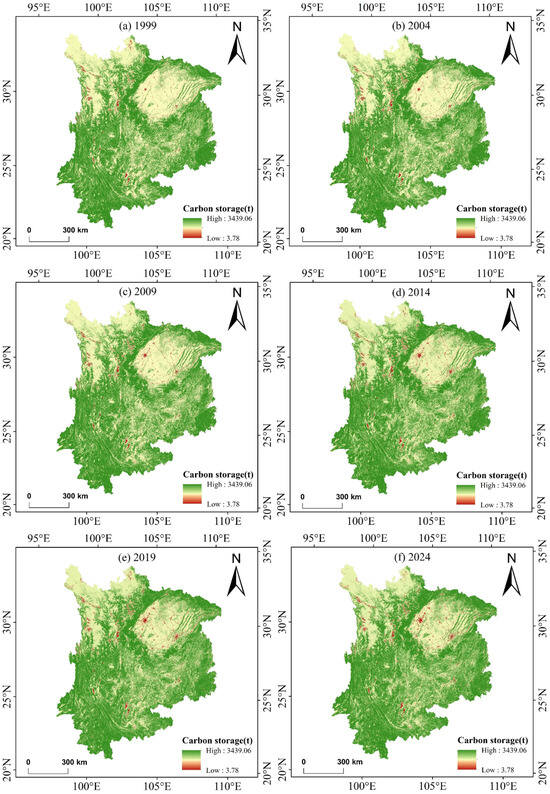
Figure 9.
Spatial distribution of carbon storage in ESBZ: (a) 1999, (b) 2004, (c) 2009, (d) 2014, (e) 2019, (f) 2024.
Under the NDS (Figure 10a), provincial carbon storage remained in a state of minor fluctuation and overall stability, showing no significant upward or downward trends. Carbon storage in Sichuan was 1.580 × 10¹⁰ t (a decrease of 4.974 × 10⁷ t vs. 2024), while Yunnan (1.358 × 10¹⁰ t), Guizhou (6.155 × 10⁹ t), and Chongqing (2.747 × 10⁹ t) all maintained fluctuation amplitudes within 1.775 × 10⁷ t relative to 2024. This pattern reflects the natural equilibrium of the regional ecosystem carbon cycle in the absence of additional anthropogenic intervention. Here, changes are regulated primarily by natural processes—such as vegetation growth and soil carbon dynamics—with fluctuations remaining within the ecosystem’s self-regulatory capacity. Under the UDS (Figure 10b), a divergent pattern emerged: “decline in Chongqing-Sichuan, stability in Yunnan-Guizhou.” Chongqing recorded the region’s largest relative decline, falling to 2.735 × 10⁹ t (−2.303 × 10⁷ t vs. 2024), while Sichuan dropped to 1.574 × 10¹⁰ t (−1.023 × 10⁸ t). In contrast, Yunnan (1.358 × 10¹⁰ t) and Guizhou (6.160 × 10⁹ t) remained stable, with fluctuations below 2.000 × 10⁷ t. This disparity stems from the regional concentration of urban expansion. The more pronounced urban sprawl in Chongqing and Sichuan exerted a stronger substitution effect on surrounding ecological lands, whereas the lower intensity of urban development in Yunnan and Guizhou resulted in minimal disturbance to carbon storage. In the CPS (Figure 10c), all provinces exhibited varying degrees of carbon deficits, with no regions showing growth. Sichuan experienced the most pronounced decline, dropping to 1.569 × 10¹⁰ t—a reduction of 1.580 × 10⁸ t from 2024. Guizhou followed with 6.138 × 10⁹ t (a decrease of 3.608 × 10⁷ t), while Chongqing and Yunnan declined to 2.745 × 10⁹ t (−1.272 × 10⁷ t) and 1.355 × 10¹⁰ t (−1.987 × 10⁷ t), respectively. This universal deficit is attributed to the systemic encroachment of cultivated land expansion upon carbon sinks like forests and grasslands. As key zones for cultivated land protection, Sichuan and Guizhou suffered more extensive reductions in ecological land, leading to disproportionately high carbon losses. Under the EPS (Figure 10d), Sichuan’s carbon storage climbed to 1.595 × 10¹⁰ t, an increase of 1.012 × 10⁸ t, marking the largest gain in the region. Guizhou reached 6.199 × 10⁹ t, adding 5.762 × 10⁷ t. Yunnan and Chongqing rose to 1.364 × 10¹⁰ t (+7.600 × 10⁷ t) and 2.754 × 10⁹ t (+4.462 × 10⁶ t), respectively. Notably, Sichuan and Chongqing—regions that suffered significant losses under the cultivated land protection and urban development scenarios—demonstrated the most robust carbon sink recovery under ecological protection. This region-wide growth substantiates the carbon enhancement efficacy of ecological restoration projects. Furthermore, as a core carbon storage zone, the implementation of protection measures in Sichuan proved critical to the aggregate gains of the entire ESBZ. Crucially, the simulation outcomes of the four scenarios reflect the relative response trends of regional land use and carbon storage dynamics under varying combinations of policy constraints. Consequently, their interpretation centers on comparing divergent future development trajectories within the ESBZ and their implications for spatial optimization, rather than serving as deterministic forecasts of actual future conditions.
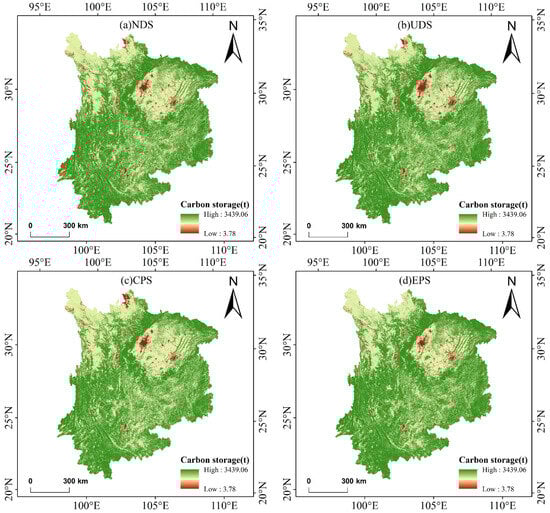
Figure 10.
Spatial distribution of carbon storage in four scenarios 2049: (a) NDS, (b) UDS, (c) CPS, (d) EPS.
4. Discussion
4.1. Analysis of Driving Forces of Land Use Change in the ESBZ
Situated within the critical ecological security barrier zone of the upper Yangtze and Pearl River basins, the ESBZ is characterized by complex topography and pronounced vertical zonality, which engender a typical “alpine–canyon–basin” gradient differentiation in land use. The natural landscape establishes a spatial “basemap” for diverse land categories through topographic accessibility and ecological suitability, significantly modulating the direction and intensity of transitions among cultivated land, forest land, and grassland [55]. Concurrently, in the ecologically fragile Karst mountainous areas, the superposition of karst geomorphology and hydrothermal conditions renders land use hypersensitive to natural constraints. Furthermore, the evolution of rocky desertification—driven by the interplay of land use and population pressure—reinforces the “locking effect” of this “natural substrate” on ecological land patterns [56].
Superimposed on this natural substrate, the formation of regional growth poles and urban agglomerations since the Reform and Opening-up has intensified the demand for land for urban expansion and infrastructure development, driven by the spatial agglomeration of population and industries. On a national scale, the expansion of construction land is predominantly governed by socioeconomic factors, exhibiting distinct spatial patterns of agglomeration and spillover [55]. Regarding the mechanism of conversion from cultivated land to construction land, multi-scale factors collectively shape the spatial selectivity of land occupation. On one hand, cultivated land loss induced by urban expansion demonstrates pronounced peri-urban characteristics, with cultivated land in urban fringes being highly susceptible to rapid conversion [57]. On the other hand, hierarchical socioeconomic and policy variables jointly elucidate the variations in construction land expansion and cultivated land conversion within hotspots, reflecting the constraining and amplifying effects of the “macro-institutions—local growth—land use behavior” chain on land transitions [58]. Furthermore, policy-oriented spatial carriers, such as development zones, can significantly alter the intensity and efficiency of urban land expansion in the short term. This reinforces the capacity of population-industry agglomerations to absorb construction land, driving land use spillover along transportation corridors and basin-valley belts.
Analyzed by land category (Figure 11), the dynamics of cultivated land are characterized by the coexistence of “demand-driven intensification” and “encroachment by urban expansion.” Driven by population agglomeration and market demand, intensive cultivation is more readily maintained or reinforced in basins, river valleys, and gentle terraces. Conversely, the superposition of mountainous terrain and labor outmigration—interacting with household scale-management decisions and off-farm employment opportunities—significantly elevates the probability of abandonment on marginal cultivated lands. Consequently, the stability of cultivated land becomes “locked” into regions characterized by low-to-mid elevations, high mechanization potential, and superior accessibility [59]. The evolution of forest land and grassland more distinctly embodies a pattern of “joint shaping by policy and nature.” Ecological engineering initiatives such as the “Grain for Green” program have generated significant carbon sink gains and land cover transformations on a national scale; however, their regional manifestations depend on the coupled patterns of topographic-climatic suitability and the intensity of anthropogenic activity [60]. In western China, such policies also induce identifiable trade-offs between grain supply and land system structure, thereby influencing the long-term configurational relationship between cultivated land and forest land [61]. In the Southwest Karst region, ecological engineering contributes significantly to vegetation dynamics, exhibiting a differentiated dominance relationship with climatic drivers across various geomorphological units. This implies that the expansion and quality improvement of forest and grass ecological lands predominantly occur within naturally suitable zones, modulated by the intensity of project implementation and management [62].
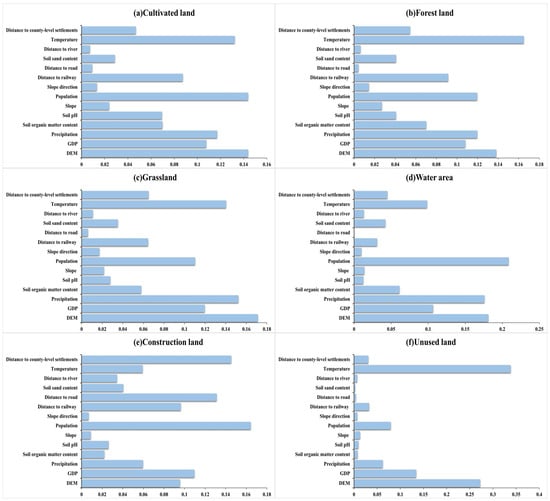
Figure 11.
Contribution of driving factors: (a) Cultivated land, (b) Forest land, (c) Grassland, (d) Water area, (e) Construction land, (f) Unused land.
The dynamics of the water area and unused land can be interpreted as the combined outcome of anthropogenic engineering and ecological governance constrained by natural topography. Topography dictates the “skeleton” of river valley systems and reservoir siting, whereas demands for water supply, flood control, and irrigation in population centers often alter local surface water configurations via hydraulic projects, thereby enhancing the artificial attributes of the water area. It is imperative to note that while water areas have been integrated into the carbon storage assessment framework, their influence on the regional carbon cycle extends far beyond direct carbon storage. Hydrological cycling, soil moisture dynamics, and groundwater conditions can, by modulating vegetation growth, soil organic matter decomposition, and carbon migration processes, indirectly shape the regional carbon source-sink patterns [63,64,65,66,67]. In Karst mountainous regions, escalated land use intensity and population pressure can trigger a phasic shift in the dominant drivers of rocky desertification, consequently altering the potential and direction of transitions between unused land (e.g., bare land, exposed karst) and forest/grassland [56]. From the perspective of ecological governance, comprehensive control of rocky desertification—while enhancing regional ecological functions—may induce new ecological trade-offs (e.g., regarding habitat and biodiversity). This implies that converting unused land to ecological land necessitates zonal optimization balancing “restoration intensity–ecological risk–spatial suitability” [63]. In summary, land use change in this region represents a process of selective reshaping by demographic and economic activities within the constraints of the natural landscape. Natural factors delineate the spatial “basemap” and convertible boundaries of land categories, whereas urbanization, engineering development, and ecological projects drive the redistribution of land types within suitable zones, thereby profoundly influencing the spatiotemporal patterns and regulatory space of regional ecosystem carbon storage [55,64,65,66,67].
4.2. Impacts of LUCC Dynamics on Carbon Storage Changes
An integrated analysis of carbon storage data and land use transfer processes reveals a significant quantitative correlation between land use type conversion and total regional carbon storage in the ESBZ. This correlation serves as the core driver underlying carbon storage fluctuations during 1999–2024 and scenario differentiation in 2049. Between 1999 and 2024, the impact of land use conversion on carbon storage was characterized by a pattern of “loss dominance with localized gains.” Specifically, the average regional carbon density stood at 340.06 t·hm−2 in 1999 (Table 10). However, transitions from high-carbon-density to low-carbon-density land types—such as cultivated land to construction land, grassland to unused land, and forest land to cultivated land/grassland—directly depressed the regional average. Consequently, the density dropped to 339.74 t·hm−2 in 2004, remained suppressed after slight fluctuations in 2009, and further declined to 338.90 t·hm−2 in 2014. This continuous decrease in average carbon density corresponded to the fluctuating decline in carbon storage observed in regions such as Chongqing and Guizhou, ultimately resulting in a net reduction of 1.284 × 10⁸ t in the ESBZ’s total carbon storage from 1999 to 2014. Post-2014, the gradual recovery of ecological land drove a rebound in average carbon density, which rose to 339.35 t·hm−2 in 2019 and reached 339.88 t·hm−2 in 2024. As the density approximated the initial 1999 baseline, the total regional carbon storage concomitantly approached its initial levels.
Table 10.
Carbon density per unit area in ESBZ (t·hm−2).
Scaling down to the provincial level, Table 10 reveals a persistent and stable spatial heterogeneity in the average carbon density across Yunnan, Guizhou, Chongqing, and Sichuan. This demonstrates that the carbon storage pattern within the ESBZ is governed not merely by fluctuations in total area but is profoundly shaped by the structural composition of land use and the stability of ecological spaces within each province. Overall, Yunnan exhibits a consistently high average carbon density with minimal fluctuation, indicating a stable ecological spatial pattern dominated by forest land; consequently, high-carbon-density ecological land plays a commanding role in sustaining the region’s carbon storage. In contrast, the average carbon density in Guizhou demonstrates heightened sensitivity, reflecting the amplified response of ecologically fragile karst regions to land-use disturbances and ecological degradation. Chongqing manifests a comparatively low average carbon density with a fluctuating downward trajectory, signifying the sustained encroachment of urban expansion and construction land development upon high-carbon-density ecological spaces. Although Sichuan boasts a substantial total carbon storage capacity, it lacks a dominant average carbon density. This indicates that its high carbon storage relies heavily on the vast expanse of its ecological land area, rather than an inherent advantage in per-unit-area carbon density. Evidently, the genesis of these inter-provincial disparities in carbon density is fundamentally attributable to variations in both the compositional structure and the stability of forest land, grassland, cultivated land, and construction land. This underscores that interpretations of regional carbon storage spatial patterns must transcend mere total volumetric changes; it is imperative to integrate shifts in average carbon density to accurately identify the divergent mechanisms underpinning carbon sink maintenance across different regions.
Under the diverse development scenarios projected for 2049, the divergent orientations of land use conversion directly dictated the evolutionary trends of carbon storage. In the UDS, the increased conversion of cultivated land to construction land in Chongqing Municipality led to a reduction in total regional carbon storage of 2.303 × 10⁷ t compared to 2024. In the CPS, the expansion of cultivated land in Sichuan Province resulted in a decrease of 1.580 × 10⁸ t in total regional carbon storage relative to 2024. Conversely, under the EPS, the orientation of land use conversion was reversed. The restoration and expansion of high-carbon-density lands emerged as core characteristics, driving enhancements in carbon sequestration capacity in regions such as Sichuan and Yunnan. This ultimately achieved a net regional increase of 2.303 × 10⁸ t over 2024 levels. In summary, the dynamic evolution of carbon storage in the ESBZ is intrinsically the result of a dynamic trade-off between high-carbon and low-carbon land types during land use conversion. The expansion of low-carbon-density land serves as the core driver of carbon loss, whereas the restoration and expansion of high-carbon-density land constitute the critical pathway for carbon gain. This pattern provides a clear direction for enhancing regional carbon sequestration functions through land use regulation.
4.3. Study Limitations
By coupling the PLUS and InVEST models, this study integrates dynamic simulations of land use change with ecosystem carbon storage assessments in the ESBZ, effectively leveraging the strengths of both approaches. The PLUS model specializes in the spatially explicit simulation of land use dynamics, thereby overcoming the limitations of traditional Markov chain models, which often suffer from low spatial resolution and inadequate consideration of ecological mechanisms [24,68]. Simultaneously, the InVEST model provides precise carbon storage calculations based on ecosystem service assessment mechanisms, addressing the inability of conventional static analysis methods to simulate future scenario variations [14,69]. The coupling of these models integrates the drivers of land pattern evolution with ecological process mechanisms. This synthesis renders carbon storage assessment both dynamic and ecologically rational, enabling more accurate projections of regional carbon storage under diverse future scenarios [14,32,70]. Notwithstanding the demonstrated advantages of the combined PLUS–InVEST framework, several limitations warrant attention. First, the carbon density parameters used for estimation were derived primarily from literature rather than field surveys within the study area. This reliance may introduce regional representativeness bias, as it fails to capture variations in carbon density driven by local heterogeneity in climate, soil, and topography, potentially affecting the accuracy of the assessment [69,71,72]. Second, the relatively coarse spatial resolution of the land use data may obscure fine-scale ecological processes and detailed land changes. Coarse-grained rasters risk masking subtle patch-level variations, leading to potential deviations in the simulated spatial patterns [73,74]. Third, the model does not explicitly incorporate specific ecological engineering measures, such as afforestation and the “Grain for Green” program. Consequently, it is difficult to quantify the individual contributions of different projects to carbon storage changes. Although ecological protection and restoration initiatives are widely implemented in the region, their carbon sink effects were not independently evaluated, leaving the attribution of carbon storage dynamics incompletely resolved [32,70]. Notably, the ESBZ is characterized by pronounced topographical relief, diverse climate types, and a highly heterogeneous land use pattern. This complex heterogeneity poses severe challenges to simulation accuracy; the current framework may struggle to fully capture the integrated effects of multi-scale and multi-factor interactions, potentially introducing additional uncertainty by underestimating local process influences [70]. Furthermore, inherent uncertainties persist within the future scenario simulations presented in this study. These uncertainties primarily stem from variations in the intensity of policy implementation, fluctuations in the rates of economic growth and urbanization, and the potential impacts of future climate change on land-use demands and ecosystem carbon storage. Although this study incorporates both natural environmental and socio-economic drivers and calibrates carbon density parameters to enhance regional adaptability, it has yet to explicitly couple future climate scenarios with shifting policy intensities. Consequently, the omission of these variables could compromise the accuracy of the carbon storage simulations and the overall reliability of the scenario projections [58,63]. Moreover, the comparative analysis of the four future scenarios predominantly focuses on land-use patterns and their corresponding carbon storage responses, without integrating broader socio-economic metrics such as agricultural yields, household incomes, and the urban–rural development divide. Therefore, the NDS, UDS, CPS, and EPS are most appropriately utilized as reference scenarios to delineate land-use trade-offs under varying policy orientations; they cannot serve as direct substitutes for comprehensive policy evaluations targeted at food security, livelihood welfare, and regional equity.
Based on the aforementioned limitations, future research can be improved in the following aspects. First, high-resolution remote sensing, UAV monitoring, and ground plot surveys should be integrated to acquire more accurate regional carbon density data. Optimizing carbon pool parameters through these multi-source data will enhance the precision of carbon storage assessments [71,72,74,75]. Second, adopting land use data with higher spatial resolution and introducing intelligent interpretation technologies, such as deep learning, can improve land use simulation accuracy and refine the characterization of patch-scale changes [76,77]. Third, establishing an ecological engineering database to incorporate different project types into model scenarios is essential. Supplemented by methods such as factor analysis or Geographically Weighted Regression (GWR), this approach would enable the quantitative evaluation of the impacts of various engineering measures on carbon storage dynamics [32,78]. Fourth, future research should endeavor to construct a multi-objective synergistic evaluation framework that integrates carbon storage, food security, income welfare, and spatial equity, thereby enhancing the policy explanatory power of the scenario simulations. Such efforts will help identify the carbon sink benefits of diverse ecological interventions, providing a scientific basis for differentiated ecological protection strategies. In conclusion, refining methods and data to address these limitations will enhance simulation accuracy and reveal the spatiotemporal dynamics of carbon storage in the ESBZ more comprehensively. Ultimately, this will provide robust scientific support for regional carbon neutrality goals and ecological security strategies.
4.4. Policy Implications
Compared with existing research on ecological barrier zones, the land-use and carbon storage responses within the ESBZ demonstrate more pronounced features of composite governance. Previous studies indicate that within the Sichuan-Yunnan ecological barrier, multi-scenario simulations primarily emphasize the efficacy of land-use optimization in enhancing ecosystem services [79]. In the karst regions of southern China, ecological conservation scenarios prove beneficial in mitigating carbon storage depletion; however, inherent regional vulnerabilities perpetuate stark trade-offs between construction land expansion and ecological restoration [80]. Similarly, in the Qilian Mountains ecological barrier, an ecology-first orientation is more conducive to sustaining regional carbon storage and its associated ecological values [81], extending further into discussions on ecological compensation standards and conservation strategies [82]. Consistent with these findings, our study corroborates that the ecological protection scenario is optimal for bolstering regional carbon sink functions. However, unlike research predominantly focused on individual mountain ranges, single national parks, or isolated ecologically fragile zones, the ESBZ spans multiple provincial administrative units—Yunnan, Guizhou, Sichuan, and Chongqing. Consequently, it is subject to a confluence of multiplex constraints, encompassing cultivated land protection, urban expansion, karst vulnerability, and cross-provincial governance. Therefore, its policy imperative extends beyond mere ecological conservation; it centrally hinges upon differentiated provincial regulation predicated on ecological conservation redlines, cross-provincial ecological compensation and carbon revenue sharing, and hierarchical constraints on land-use intensity.
Between 1999 and 2024, forest land within the ESBZ experienced a net increase of 1.966 × 10⁴ km2, whereas cultivated land and grassland saw net decreases of 9.738 × 10³ km2 and 1.874 × 10⁴ km2, respectively. Concurrently, 92.65% of construction land expansion originated from the conversion of cultivated land. This indicates that regional land-use dynamics are not an isolated ecological process, but rather the cumulative result of interactions among ecological conservation, food security, urban expansion, and regional development. The four future scenarios further elucidate these multi-objective trade-offs. The NDS represents a baseline pathway characterized by a gradual decline in carbon storage under the continuation of current developmental inertia. The UDS demonstrates that prioritizing urban expansion, while meeting construction demands, is likely to continuously compress cultivated land and ecological spaces, thereby exacerbating the risks of regional developmental imbalance. The CPS illustrates that a singular emphasis on stabilizing the quantity of cultivated land, though beneficial for safeguarding food production space, may undermine the region’s carbon sink capacity by encroaching upon forest land and grassland. Conversely, the EPS highlights the significant efficacy of an ecology-first orientation in enhancing carbon storage; however, without the support of optimized cultivated land layout, agricultural compensation, and livelihood transitions, it may pose potential implications for food security, household incomes, and regional equity. Therefore, land-use optimization in the ESBZ should not regard any single scenario as a universally applicable solution. Instead, utilizing these four scenarios as references, it should seek spatial synergy and balanced governance among carbon sink enhancement, cultivated land protection, urban development, and social equity.
Building upon this foundation, spatial optimization must emphasize differentiated regulation. As regions with high concentrations of population, industry, and construction activities, Sichuan and Chongqing should focus on curbing urban sprawl along the Chengdu-Chongqing corridor. They should prioritize urban renewal, unlocking the potential of existing land stock, and promoting intensive land use to substitute new construction land expansion, thereby alleviating the continuous appropriation of cultivated land and the pressure on surrounding forest land and grassland carbon pools. Relying on its high proportion of forest land, Yunnan should consolidate its existing ecological baseline. While strengthening ecological conservation redlines and biodiversity protection, it should focus on halting the continuous shrinkage of grassland, synergistically advancing carbon sink enhancement and ecological security maintenance. In light of the fragile ecological baseline and high degradation risk in its karst regions, Guizhou should intensify rocky desertification control and degraded land restoration. Priority should be given to restoring forest land and grassland carbon pools to enhance regional ecological resilience, while concurrently addressing the developmental constraints and livelihood needs of vulnerable mountainous areas. Integrating the ecological functional patterns and ecological conservation redlines of the ESBZ, Sichuan should prominently feature the redline units located in the Western Sichuan Plateau and the crucial water conservation areas in the upper reaches of the Yangtze River. Yunnan should prioritize the alpine gorges of Northwest Yunnan, critical biodiversity hotspots, and the peripheral areas of key national parks. Guizhou should focus on rocky-desertification-sensitive areas and key soil and water conservation zones, while Chongqing should highlight the ecological barrier zones in its northeast and southeast, alongside the “Four Mountains” of its main urban area.
Considering that Sichuan and Yunnan collectively contribute approximately 76% of the region’s carbon storage, while Chongqing and Guizhou face intense urban expansion pressures and ecological restoration mandates respectively, a pronounced spatial mismatch of “carbon sink supply—developmental constraints—conservation costs” exists within the region. Consequently, future carbon-oriented governance in the ESBZ should not be confined merely to the provincial spatial optimization level but must further establish cross-provincial ecological compensation and carbon revenue-sharing mechanisms. Specifically, within the existing framework of ecological protection compensation systems, metrics such as carbon storage scale, carbon sink increments, ecological conservation costs, developmental opportunity costs, and the paying capacity of beneficiary regions could be incorporated as bases for cross-provincial compensation accounting. This would provide sustained compensatory support to regions bearing the primary functions of ecological conservation and carbon sink supply. Concurrently, it is crucial to explore the integration of natural forest protection, the return of cultivated land to forest land and grassland, rocky desertification control, and key ecological restoration projects with carbon sink value realization mechanisms. This approach would empower ecologically advantaged regions to translate ecological product values and carbon revenues into sustainable development capacities, thereby mitigating the structural imbalance where “high-carbon-sink regions bear heavy conservation burdens but receive disproportionately low direct benefits.” Such institutional arrangements already possess a pragmatic policy foundation at the national level, exemplified by the “Regulations on Ecological Protection Compensation” implemented in 2024 and the “Guiding Opinions on Further Improving the Horizontal Ecological Protection Compensation Mechanism” issued in 2025. These provide a clear institutional window and policy basis for the ESBZ—particularly for Sichuan, Yunnan, and Chongqing, which are integral to the ecological security pattern of the upper Yangtze River—to advance cross-provincial ecological compensation, carbon revenue sharing, and regional synergistic governance.
Regarding the control of land-use intensity, a system of zoned and hierarchical rigid constraints must be established. For areas within ecological conservation redlines, new industrial, mining, and large-scale real estate developments should be strictly restricted, permitting only ecological restoration, essential infrastructure, and livelihood-security projects. For ecological buffer and synergistic management zones on the periphery of the redlines, emphasis should be placed on restricting the disordered conversion of forest land, grassland, and wetlands into construction land and low-efficiency orchards, thereby preventing peripheral development from continuously encroaching upon core ecological spaces. For areas within urban development boundaries, priority must be given to urban renewal, the redevelopment of inefficient land, and tapping the potential of existing construction land. Particularly in urban agglomerations such as the Chengdu-Chongqing corridor, Central Guizhou, and Central Yunnan, metrics including the growth rate of new construction land, the conversion rate of cultivated land, the net loss rate of forest land and grassland, and the carbon loss per unit of new construction land should be incorporated into local annual performance evaluations to establish a binding mechanism. Only through this combined governance framework of “redline control—compensation incentives—intensity constraints” can the overall carbon sink capacity of the ESBZ be more effectively elevated, simultaneously strengthening its comprehensive supportive role for national ecological security and coordinated regional development. It must be noted that this study has not yet conducted further calculations of cross-provincial compensation standards or simulations of carbon revenue allocation ratios. Consequently, the aforementioned discussion primarily serves as a mechanistic deduction based on the heterogeneity of provincial carbon storage results; future quantitative research remains necessary, integrating fiscal transfer payments, ecological engineering costs, and carbon market prices.
5. Conclusions
Based on the coupled PLUS–InVEST framework, this study systematically analyzed land-use dynamics and their impacts on ecosystem carbon storage within the ESBZ from 1999 to 2024. The results indicate that the overall land-use evolution in the study area was characterized by the concurrent recovery of forest land and the expansion of construction land, with the latter primarily appropriating cultivated land. Despite significant land-use transitions, regional carbon storage remained relatively stable overall, exhibiting a phased pattern of initial decline followed by subsequent recovery. Evidently, carbon storage dynamics within the ESBZ are not the result of the simple augmentation or reduction of a single land category; rather, they represent a comprehensive response to land-system restructuring driven by the synergistic interactions of ecological conservation, cultivated land requisition-compensation, and urban expansion.
Future scenario simulations reveal pronounced disparities in carbon storage responses across the four scenarios by 2049. The NDS, reflecting a baseline pathway devoid of additional interventions, projects a marginal decline in carbon storage. Under the UDS, the encroachment of construction land expansion upon ecological spaces precipitates a further reduction in regional carbon storage. Although the CPS is conducive to stabilizing the quantity of cultivated land, this is primarily achieved through the appropriation of forest land and grassland, thereby incurring the most substantial carbon loss. Conversely, guided by ecological conservation and restoration, the EPS attains the highest carbon storage. Overall, the NDS, UDS, CPS, and EPS do not constitute a simplistic hierarchy of merit; instead, they represent four distinct development trajectories prioritizing baseline continuity, urban expansion, food security, and ecological conservation, respectively. Their comparison elucidates the multi-objective trade-offs inherent in the regional land system among carbon sink enhancement, cultivated land protection, and spatial development.
In terms of spatial heterogeneity, Sichuan and Yunnan serve as the core supporting areas for carbon storage within the study region, whereas levels in Chongqing and Guizhou are comparatively lower. Consequently, future land-use governance must adhere to principles of spatial optimization and differentiated regulation: the Chengdu-Chongqing corridor should strictly curb urban sprawl, promoting urban renewal and intensive land use; Yunnan should consolidate its forest land-dominated spatial pattern and halt the continuous shrinkage of grassland; and Guizhou should intensify ecological restoration and degraded land management within its fragile karst regions. Simultaneously, it is imperative to establish cross-provincial ecological compensation and carbon revenue-sharing mechanisms. Integrating ecological engineering performance evaluations and carbon monitoring and accounting with territorial spatial use controls will ultimately elevate the overall carbon sink capacity and the level of synergistic regional governance within the ESBZ.
Author Contributions
Conceptualization, M.P., Y.D., and H.L. (Hu Li 2); methodology, M.P., Y.D., and D.J.; software, M.P., D.J., M.Z., and M.D.; validation, M.P., Y.Y., H.W., T.X., J.L., and X.L.; formal analysis, M.P., J.L., and Y.Y.; investigation, M.P., Y.Y., Y.D., H.W., T.X., J.L., and D.J.; resources, M.P., Y.D., H.W., and H.L. (Hu Li 2); data curation, M.P., Y.D., T.X. and M.D.; writing—original draft preparation, M.P., Y.Y., J.L., and D.J.; writing—review and editing, M.P., Y.Y., H.W., T.X., J.L., H.L. (Hu Li 2), and Y.Y.; visualization, M.P., H.L. (Hu Li 1), and M.Z.; supervision, Y.D.; project administration, M.P.; funding acquisition, M.P. All authors have read and agreed to the published version of the manuscript.
Funding
This research was supported by the State Key Laboratory of Oil and Gas Reservoir Geology and Exploitation (No. CDUT-PLC2024014), the Opening Fund of the Sichuan Key Provincial Research Base of Intelligent Tourism (No. ZHYR24-01), and the Open Fund of the Sichuan Oil and Gas Development Research Center (No. 2024SY005).
Data Availability Statement
Data are available from the first author (Minghong Peng) upon a reasonable request.
Conflicts of Interest
The authors declare no conflicts of interest.
References
- Schleussner, C.-F.; Rogelj, J.; Schaeffer, M.; Lissner, T.; Licker, R.; Fischer, E.M.; Knutti, R.; Levermann, A.; Frieler, K.; Hare, W. Science and policy characteristics of the Paris Agreement temperature goal. Nat. Clim. Change 2016, 6, 827–835. [Google Scholar] [CrossRef]
- Rogelj, J.; den Elzen, M.; Höhne, N.; Fransen, T.; Fekete, H.; Winkler, H.; Schaeffer, R.; Sha, F.; Riahi, K.; Meinshausen, M. Paris Agreement climate proposals need a boost to keep warming well below 2 °C. Nature 2016, 534, 631–639. [Google Scholar] [CrossRef] [PubMed]
- Friedlingstein, P.; O’Sullivan, M.; Jones, M.W.; Andrew, R.M.; Hauck, J.; Olsen, A.; Peters, G.P.; Peters, W.; Pongratz, J.; Sitch, S.; et al. Global Carbon Budget 2020. Earth Syst. Sci. Data 2020, 12, 3269–3340. [Google Scholar] [CrossRef]
- Houghton, R.A.; House, J.I.; Pongratz, J.; van der Werf, G.R.; DeFries, R.S.; Hansen, M.C.; Le Quéré, C.; Ramankutty, N. Carbon emissions from land use and land-cover change. Biogeosciences 2012, 9, 5125–5142. [Google Scholar] [CrossRef]
- Bonan, G.B. Forests and climate change: Forcings, feedbacks, and the climate benefits of forests. Science 2008, 320, 1444–1449. [Google Scholar] [CrossRef]
- Pan, Y.; Birdsey, R.A.; Fang, J.; Houghton, R.; Kauppi, P.E.; Kurz, W.A.; Phillips, O.L.; Shvidenko, A.; Lewis, S.L.; Canadell, J.G.; et al. A large and persistent carbon sink in the world’s forests. Science 2011, 333, 988–993. [Google Scholar] [CrossRef]
- Griscom, B.W.; Adams, J.; Ellis, P.W.; Houghton, R.A.; Lomax, G.; Miteva, D.A.; Schlesinger, W.H.; Shoch, D.; Siikamäki, J.V.; Smith, P.; et al. Natural climate solutions. Proc. Natl. Acad. Sci. USA 2017, 114, 11645–11650. [Google Scholar] [CrossRef]
- Guerry, A.D.; Polasky, S.; Lubchenco, J.; Chaplin-Kramer, R.; Daily, G.C.; Griffin, R.; Ruckelshaus, M.; Bate-man, I.J.; Duraiappah, A.; Elmqvist, T.; et al. Natural capital and ecosystem ser-vices informing decisions: From promise to practice. Proc. Natl. Acad. Sci. USA 2015, 112, 7348–7355. [Google Scholar] [CrossRef]
- Foley, J.A.; DeFries, R.; Asner, G.P.; Barford, C.; Bonan, G.; Carpenter, S.R.; Chapin, F.S.; Coe, M.T.; Daily, G.C.; Gibbs, H.K.; et al. Global consequences of land use. Science 2005, 309, 570–574. [Google Scholar] [CrossRef]
- Rockström, J.; Steffen, W.; Noone, K.; Persson, Å.; Chapin, F.S.; Lambin, E.; Lenton, T.M.; Scheffer, M.; Folke, C.; Schellnhuber, H.J.; et al. A safe operating space for humanity. Nature 2009, 461, 472–475. [Google Scholar] [CrossRef]
- Steffen, W.; Richardson, K.; Rockström, J.; Cornell, S.E.; Fetzer, I.; Bennett, E.M.; Biggs, R.; Carpenter, S.R.; de Vries, W.; de Wit, C.A.; et al. Planetary boundaries: Guiding human development on a changing planet. Science 2015, 347, 1259855. [Google Scholar] [CrossRef] [PubMed]
- Chen, C.; Park, T.; Wang, X.; Piao, S.; Xu, B.; Chaturvedi, R.K.; Fuchs, R.; Brovkin, V.; Ciais, P.; Fensholt, R.; et al. China and India lead in greening of the world through land-use management. Nat. Sustain. 2019, 2, 122–129. [Google Scholar] [CrossRef] [PubMed]
- Seto, K.C.; Güneralp, B.; Hutyra, L.R. Global forecasts of urban expansion to 2030 and direct impacts on biodiversity and carbon pools. Proc. Natl. Acad. Sci. USA 2012, 109, 16083–16088. [Google Scholar] [CrossRef] [PubMed]
- He, C.; Zhang, D.; Huang, Q.; Zhao, Y. Assessing the potential impacts of urban expansion on regional carbon storage by linking the LUSD-urban and InVEST models. Environ. Model. Softw. 2016, 75, 44–58. [Google Scholar] [CrossRef]
- Gao, J.; Wang, L. Embedding spatiotemporal changes in carbon storage into urban agglomeration eco-system management—A case study of the Yangtze River Delta, China. J. Clean. Prod. 2019, 237, 117764. [Google Scholar] [CrossRef]
- Wang, W.; Deng, Y.; Dang, H.; Hai, Y.; Chen, H.; Chen, J.; Zhang, M. Spatiotemporal Patterns and Driving Factors of Vegetation Carbon Sinks at the County Scale in the Chengdu-Chongqing Economic Circle. J. Geo-Energy Environ. 2025, 1, 46–60. [Google Scholar] [CrossRef]
- Li, H. Uniting Geo-Energy and Environment Science for a Sustainable Future. J. Geo-Energy Environ. 2025, 1, 1–7. [Google Scholar] [CrossRef]
- Deng, Y.; Chen, H.; Hai, Y. Land Use Changes and Future Land Use Scenario Simulations of the China–Pakistan Economic Corridor under the Belt and Road Initiative. Sustainability 2024, 16, 8842. [Google Scholar] [CrossRef]
- Baccini, A.; Goetz, S.J.; Walker, W.S.; Laporte, N.T.; Sun, M.; Sulla-Menashe, D.; Hackler, J.; Beck, P.S.A.; Dubayah, R.; Friedl, M.A.; et al. Estimated carbon dioxide emissions from tropical deforestation improved by carbon-density maps. Nat. Clim. Change 2012, 2, 182–185. [Google Scholar] [CrossRef]
- Nelson, E.; Mendoza, G.; Regetz, J.; Polasky, S.; Tallis, H.; Cameron, D.R.; Chan, K.M.A.; Daily, G.C.; Goldstein, J.; Kareiva, P.M.; et al. Modeling multiple ecosystem services, biodiversity conservation, commodity production, and tradeoffs at landscape scales. Front. Ecol. Environ. 2009, 7, 4–11. [Google Scholar] [CrossRef]
- Verburg, P.H.; Soepboer, W.; Veldkamp, A.; Limpiada, R.; Espaldon, V.; Mastura, S.S.A. Modeling the spatial dynamics of regional land use: The CLUE-S model. Environ. Manag. 2002, 30, 391–405. [Google Scholar] [CrossRef] [PubMed]
- Liu, X.; Liang, X.; Li, X.; Xu, X.; Ou, J.; Chen, Y.; Li, S.; Wang, S.; Pei, F. A future land use simulation model (FLUS) for simulating multiple land use scenarios by coupling human and natural effects. Landsc. Urban Plan. 2017, 168, 94–116. [Google Scholar] [CrossRef]
- Liang, Y.; Liu, L.; Huang, J. Integrating the SD-CLUE-S and InVEST models into assessment of oasis carbon storage in northwestern China. PLoS ONE 2017, 12, e0172494. [Google Scholar] [CrossRef] [PubMed]
- Liang, X.; Guan, Q.; Clarke, K.C.; Liu, S.; Wang, B.; Yao, Y. Understanding the drivers of sustainable land expansion using a patch-generating land use simulation (PLUS) model: A case study in Wuhan, China. Comput. Environ. Urban Syst. 2021, 85, 101569. [Google Scholar] [CrossRef]
- Zhang, J.; Cao, P.; Roosli, R. Assessing land use and carbon storage changes using PLUS and InVEST models: A multi-scenario simulation in Hohhot. Environ. Sustain. Indic. 2025, 26, 100655. [Google Scholar] [CrossRef]
- Yang, S.; Li, L.; Zhu, R.; Luo, C.; Lu, X.; Sun, M.; Xu, B. Assessing land-use changes and carbon storage: A case study of the Jialing River Basin, China. Sci. Rep. 2024, 14, 15984. [Google Scholar] [CrossRef]
- Zhang, S.; Zhong, Q.; Cheng, D.; Xu, C.; Chang, Y.; Lin, Y.; Li, B. Landscape ecological risk projection based on the PLUS model under the localized shared socioeconomic pathways in the Fujian Delta region. Ecol. Indic. 2022, 136, 108642. [Google Scholar] [CrossRef]
- Peng, M.; Yang, Y.; Deng, Y.; Jize, D.; Chen, H.; Hai, Y.; Liu, G.; Wang, H.; Xie, T.; Li, H.; et al. The impact of the Grain-for-Green Programme on carbon storage in the Upper Yangtze River Basin based on the PLUS-InVEST model. Carbon Balance Manag. 2025, 20, 24. [Google Scholar] [CrossRef]
- Deng, Y.; Yao, S.; Hou, M.; Zhang, T.; Lu, Y.; Gong, Z.; Wang, Y. The Impact of the Grain for Green Project on Ecosystem Carbon Storage Services: A Case Study of Zichang County in the Loess Plateau Hilly Gully Region. J. Nat. Resour. 2020, 35, 826–844. [Google Scholar]
- Guo, W.; Teng, Y.; Li, J.; Yan, Y.; Zhao, C.; Li, Y.; Li, X. A new assessment framework to forecast land use and carbon storage under different SSP-RCP scenarios in China. Sci. Total Environ. 2024, 912, 169088. [Google Scholar] [CrossRef]
- Li, S.; Cao, Y.; Liu, J.; Wang, S. Simulating land use change for sustainable land management in China’s coal resource-based cities under different scenarios. Sci. Total Environ. 2024, 916, 170126. [Google Scholar] [CrossRef]
- Wu, Q.; Wang, L.; Wang, T.; Ruan, Z.; Du, P. Spatial–temporal evolution analysis of multi-scenario land use and carbon storage based on PLUS-InVEST model: A case study in Dalian, China. Ecol. Indic. 2024, 166, 112448. [Google Scholar] [CrossRef]
- Wu, H.; Yang, Y.; Li, W. Spatial optimization of land use and carbon storage prediction in urban agglomerations under climate change: Different scenarios and multiscale perspectives of CMIP6. Sustain. Cities Soc. 2024, 116, 105920. [Google Scholar] [CrossRef]
- Deng, L.; Shangguan, Z.P.; Sweeney, S. Grain for Green driven land use change and carbon sequestration on the Loess Plateau, China. Sci. Rep. 2014, 4, 7039. [Google Scholar] [CrossRef] [PubMed]
- Deng, L.; Wang, K.B.; Chen, M.L.; Shangguan, Z.P.; Sweeney, S. Soil organic carbon storage capacity positively related to forest succession on the Loess Plateau, China. Catena 2013, 110, 1–7. [Google Scholar] [CrossRef]
- Li, H.; Wu, Y.; Liu, S.; Zhao, W.; Xiao, J.; Winowiecki, L.A.; Vågen, T.-G.; Xu, J.; Yin, X.; Wang, F.; et al. The Grain-for-Green project offsets warming-induced soil organic carbon loss and increases soil carbon stock in Chinese Loess Plateau. Sci. Total Environ. 2022, 837, 155469. [Google Scholar] [CrossRef]
- Liu, G.; Dai, E.; Xu, X.; Wu, W.; Xiang, A. Quantitative assessment of regional debris-flow risk: A case study in Southwest China. Sustainability 2018, 10, 2223. [Google Scholar] [CrossRef]
- Zhu, Y.; Jia, P.; Liu, Y. Spatiotemporal evolution effects of habitat quality with the conservation policies in the Upper Yangtze River, China. Sci. Rep. 2025, 15, 5972. [Google Scholar] [CrossRef]
- Qi, G.; Cong, N.; Luo, M.; Qiu, T.; Rong, L.; Ren, P.; Xiao, J. Contribution of climatic change and human activities to vegetation dynamics over southwest China during 2000–2020. Remote Sens. 2024, 16, 3361. [Google Scholar] [CrossRef]
- Cai, H.; Yang, X.; Wang, K.; Xiao, L. Is forest restoration in the southwest China Karst promoted mainly by climate change or human-induced factors? Remote Sens. 2014, 6, 9895–9910. [Google Scholar] [CrossRef]
- Yang, J.; Huang, X. The 30 m annual land cover datasets and its dynamics in China from 1985 to 2022. Earth Syst. Sci. Data 2023, 13, 3907–3925. [Google Scholar] [CrossRef]
- GB/T 21010-2017; Current Land Use Classification. China Standards Press: Beijing, China, 2017.
- Lu, C.; Qi, X.; Zheng, Z.; Jia, K. PLUS-model based multi-scenario land space simulation of the Lower Yellow River Region and its ecological effects. Sustainability 2022, 14, 6942. [Google Scholar] [CrossRef]
- Marey, A.; Wang, L.; Goubran, S.; Gaur, A.; Lu, H.; Leroyer, S.; Belair, S. Forecasting urban land use dynamics through patch-generating land use simulation and Markov chain integration: A multi-scenario predictive framework. Sustainability 2024, 16, 10255. [Google Scholar] [CrossRef]
- Breiman, L. Random forests. Mach. Learn. 2001, 45, 5–32. [Google Scholar] [CrossRef]
- Gounaridis, D.; Chorianopoulos, I.; Symeonakis, E.; Koukoulas, S. A Random Forest-Cellular Automata modelling approach to explore future land use/cover change in Attica (Greece), under different socio-economic realities and scales. Sci. Total Environ. 2019, 646, 320–335. [Google Scholar] [CrossRef]
- Wu, H.; Lin, A.; Xing, X.; Song, D.; Li, Y. Identifying core driving factors of urban land use change from global land cover products and POI data using the random forest method. Int. J. Appl. Earth Obs. Geoinf. 2021, 103, 102475. [Google Scholar] [CrossRef]
- Liu, J.; Liu, B.; Wu, L.; Miao, H.; Liu, J.; Jiang, K.; Ding, H.; Gao, W.; Liu, T. Prediction of land use for the next 30 years using the PLUS model’s multi-scenario simulation in Guizhou Province, China. Sci. Rep. 2024, 14, 13143. [Google Scholar] [CrossRef]
- Zhao, X.; Rao, Z.; Lin, J.; Zhang, X. Scenario forecasting of carbon neutrality by combining the LEAP model and future land-use simulation: An empirical study of Shenzhen, China. Sustain. Cities Soc. 2025, 125, 106367. [Google Scholar] [CrossRef]
- Geng, Y.; Hu, Z.; Guo, W.; Zhong, A.; Li, Q. Study on Carbon Storage Evolution and Scenario Response Under Multi-Pathway Drivers in High-Groundwater-Level Coal Resource-Based Cities: A Case Study of Three Cities in Shandong, China. Land 2025, 14, 2001. [Google Scholar] [CrossRef]
- Clerici, N.; Cote-Navarro, F.; Escobedo, F.J.; Rubiano, K.; Camilo Villegas, J. Spatio-temporal and cumulative effects of land use-land cover and climate change on two ecosystem services in the Colombian Andes. Sci. Total Environ 2019, 685, 1181–1192. [Google Scholar] [CrossRef]
- Alam, S.A.; Starr, M.; Clark, B.J. Tree biomass and soil organic carbon densities across the Sudanese woodland savannah: A regional carbon sequestration study. J. Arid. Environ. 2013, 89, 67–76. [Google Scholar] [CrossRef]
- Tang, X.; Zhao, X.; Bai, Y.; Tang, Z.; Wang, W.; Zhao, Y.; Wan, H.; Xie, Z.; Shi, X.; Wu, B.; et al. Carbon pools in China’s terrestrial eco-systems: New estimates based on an intensive field survey. Proc. Natl. Acad. Sci. USA 2018, 115, 4021–4026. [Google Scholar] [CrossRef] [PubMed]
- Wan, X.; Ji, G.X.; Chen, W.Q.; Zhang, Y.L.; Huang, J.C.; Guo, Y.L.; Chen, Y.N. Simulation and prediction of spatiotemporal evolution of ecosystem carbon storage in the Yangtze River basin based on the PLUS-InVEST model. J. Agric. Resour. Environ. 2024, 42, 518. [Google Scholar]
- Zhou, Y.; Li, X.; Liu, Y. Land use change and driving factors in rural China during the period 1995–2015. Land Use Policy 2020, 99, 105048. [Google Scholar] [CrossRef]
- Guo, B.; Yang, F.; Fan, Y.; Zang, W. The dominant driving factors of rocky desertification and their variations in typical mountainous karst areas of Southwest China in the context of global change. Catena 2023, 220, 106674. [Google Scholar] [CrossRef]
- Wang, C.; Gao, Q.; Wang, X.; Yu, M. Spatially differentiated trends in urbanization, agricultural land abandonment and reclamation, and woodland recovery in Northern China. Sci. Rep. 2016, 6, 37658. [Google Scholar] [CrossRef]
- Jiang, L.; Deng, X.; Seto, K.C. Multi-level modeling of urban expansion and cultivated land conversion for urban hotspot counties in China. Landsc. Urban Plan. 2012, 108, 131–139. [Google Scholar] [CrossRef]
- Yan, J.; Yang, Z.; Li, Z.; Li, X.; Xin, L.; Sun, L. Drivers of cultivated land abandonment in mountainous areas: A household decision model on farming scale in Southwest China. Land Use Policy 2016, 57, 459–469. [Google Scholar] [CrossRef]
- Deng, L.; Liu, S.; Kim, D.G.; Peng, C.; Sweeney, S.; Shangguan, Z. Past and future carbon sequestration benefits of China’s grain for green program. Glob. Environ. Change 2017, 47, 13–20. [Google Scholar] [CrossRef]
- Feng, Z.; Yang, Y.; Zhang, Y.; Zhang, P.; Li, Y. Grain-for-green policy and its impacts on grain supply in West China. Land Use Policy 2005, 22, 301–312. [Google Scholar] [CrossRef]
- Zhang, X.; Yue, Y.; Tong, X.; Wang, K.; Qi, X.; Deng, C.; Brandt, M. Eco-engineering controls vegetation trends in southwest China karst. Sci. Total Environ. 2021, 770, 145160. [Google Scholar] [CrossRef] [PubMed]
- Zhang, Q.; Zhang, G.; Zhang, X.; Liu, D.; Fang, R.; Dong, N.; Wu, H.; Li, S. Future of Carbon Storage in the Yangtze River Basin, China under Alternative Climate and Land-Use Pathways. Ecosyst. Health Sustain. 2023, 9, 0085. [Google Scholar] [CrossRef]
- Hao, Y.; Mao, J.; Bachmann, C.M.; Hoffman, F.M.; Koren, G.; Chen, H.; Tian, H.; Liu, J.; Tao, J.; Tang, J.; et al. Soil moisture controls over carbon sequestration and greenhouse gas emissions: A review. npj Clim. Atmos. Sci. 2025, 8, 16. [Google Scholar] [CrossRef]
- Ruehr, S.; Girotto, M.; Verfaillie, J.G.; Baldocchi, D.; Cabon, A.; Keenan, T.F. Ecosystem groundwater use enhances carbon assimilation and tree growth in a semi-arid Oak Savanna. Agric. For. Meteorol. 2023, 342, 109725. [Google Scholar] [CrossRef]
- Shao, M.; Wu, J.; Liu, Z.; Zeng, S.; Abdul, R.M.; Sun, H.; Zhou, E.; He, H.; Yan, J.; Shi, L.; et al. Coupled water-carbon cycling in karst regions: A review of processes and modeling. J. Hydrol. 2026, 664, 134374. [Google Scholar] [CrossRef]
- Li, C.; Wang, Y.; Yi, Y.; Wang, X.; Santos, C.A.G.; Liu, Q. A review of reservoir carbon cycling: Key processes, influencing factors and research methods. Ecol. Indic. 2024, 166, 112511. [Google Scholar] [CrossRef]
- Guan, D.; Li, H.; Inohae, T.; Su, W.; Nagaie, T.; Hokao, K. Modeling urban land use change by the inte-gration of cellular automaton and Markov model. Ecol. Model. 2011, 222, 3761–3772. [Google Scholar] [CrossRef]
- Wang, R.Y.; Mo, X.; Ji, H.; Zhu, Z.; Wang, Y.S.; Bao, Z.; Li, T. Comparison of the CASA and InVEST models’ effects for estimating spatiotemporal differences in carbon storage of green spaces in megacities. Sci. Rep. 2024, 14, 5456. [Google Scholar] [CrossRef]
- Van Vliet, J.; Bregt, A.K.; Brown, D.G.; van Delden, H.; Heckbert, S.; Verburg, P.H. A review of current calibration and validation practices in land-change modeling. Environ. Model. Softw. 2016, 82, 174–182. [Google Scholar] [CrossRef]
- Smith, P.; Soussana, J.F.; Angers, D.; Schipper, L.; Chenu, C.; Rasse, D.P.; Batjes, N.H.; van Egmond, F.; McNeill, S.; Kuhnert, M.; et al. How to measure, report and verify soil carbon change to realize the potential of soil carbon sequestration for atmospheric greenhouse gas removal. Glob. Change Biol. 2020, 26, 219–241. [Google Scholar] [CrossRef]
- Hengl, T.; Mendes de Jesus, J.; Heuvelink, G.B.; Ruiperez Gonzalez, M.; Kilibarda, M.; Blagotić, A.; Shangguan, W.; Wright, M.N.; Geng, X.; Bauer-Marschallinger, B.; et al. SoilGrids250m: Global gridded soil information based on machine learning. PLoS ONE 2017, 12, e0169748. [Google Scholar] [CrossRef]
- Pontius, R.G., Jr.; Boersma, W.; Castella, J.C.; Clarke, K.; de Nijs, T.; Dietzel, C.; Duan, Z.; Fotsing, E.; Goldstein, N.; Kok, K.; et al. Com-paring the input, output, and validation maps for several models of land change. Ann. Reg. Sci. 2008, 42, 11–37. [Google Scholar] [CrossRef]
- Dandois, J.P.; Ellis, E.C. High spatial resolution three-dimensional mapping of vegetation spectral dynamics using computer vision. Remote Sens. Environ. 2013, 136, 259–276. [Google Scholar] [CrossRef]
- O’Neill, B.C.; Kriegler, E.; Riahi, K.; Ebi, K.L.; Hallegatte, S.; Carter, T.R.; Mathur, R.; Van Vuuren, D.P. A new scenario framework for climate change research: The concept of shared socioeconomic pathways. Clim. Change 2014, 122, 387–400. [Google Scholar] [CrossRef]
- Zhu, X.X.; Tuia, D.; Mou, L.; Xia, G.S.; Zhang, L.; Xu, F.; Fraundorfer, F. Deep learning in remote sensing: A comprehensive review and list of resources. IEEE Geosci. Remote Sens. Mag. 2017, 5, 8–36. [Google Scholar] [CrossRef]
- Vali, A.; Comai, S.; Matteucci, M. Deep learning for land use and land cover classification based on hyperspectral and multispectral earth observation data: A review. Remote Sens. 2020, 12, 2495. [Google Scholar] [CrossRef]
- Brunsdon, C.; Fotheringham, A.S.; Charlton, M.E. Geographically weighted regression: A method for exploring spatial nonstationarity. Geogr. Anal. 1996, 28, 281–298. [Google Scholar] [CrossRef]
- Li, C.; Wu, Y.; Gao, B.; Zheng, K.; Wu, Y.; Li, C. Multi-scenario simulation of ecosystem service value for optimization of land use in the Sichuan-Yunnan ecological barrier, China. Ecol. Indic. 2021, 132, 108328. [Google Scholar] [CrossRef]
- Du, S.; Zhou, Z.; Huang, D.; Zhang, F.; Deng, F.; Yang, Y. The Response of Carbon Stocks to Land Use/Cover Change and a Vulnerability Multi-Scenario Analysis of the Karst Region in Southern China Based on PLUS-InVEST. Forests 2023, 14, 2307. [Google Scholar] [CrossRef]
- Lei, X.; Zhou, Y.; Huo, P. Impacts of multi-scenario land use change on carbon storage and its economic value in the Qilian Mountains Region, China. J. Nat. Conserv. 2025, 88, 127042. [Google Scholar] [CrossRef]
- Zhang, B.; Feng, Q.; Lu, Z.; Li, Z.; Zhang, B.; Cheng, W. Ecosystem service value and ecological compensation in Qilian Mountain National Park: Implications for ecological conservation strategies. Ecol. Indic. 2024, 167, 112661. [Google Scholar] [CrossRef]


Disclaimer/Publisher’s Note: The statements, opinions and data contained in all publications are solely those of the individual author(s) and contributor(s) and not of MDPI and/or the editor(s). MDPI and/or the editor(s) disclaim responsibility for any injury to people or property resulting from any ideas, methods, instructions or products referred to in the content. |
© 2026 by the authors. Licensee MDPI, Basel, Switzerland. This article is an open access article distributed under the terms and conditions of the Creative Commons Attribution (CC BY) license.