Abstract
The small towns influenced by the long-term impact of the industrial and mining industries have formed distinctive spatial morphology. A systematic exploration of their spatial form characteristics can make up for the deficiencies of the existing research on spatial form, enrich the theory of urban spatial form, and provide theoretical support for the planning practice of such special towns. Therefore, this paper constructs a theoretical framework of structure–region–boundary and uses methods such as space syntax, shape index, and compactness to comprehensively analyze the spatial morphology gene types of 28 small industrial and mining towns in terms of structure, region, and boundary, and draw the corresponding gene maps. The research results show that in terms of structural genes, the transportation structure of small towns can be classified into grid, branch-shaped, and hybrid types; the relationship between mountains and towns can be categorized as mountain-encircled, mountain-fringed, mountain-adjacent, and no-mountain types; and the relationship between water and towns can be divided into simple intersection, intersection along the short side, intersection along the long side, compound intersection, and no-river types. The common types are grid, mountain-encircled, and no rivers. In terms of regional genes, the texture of small towns can be classified as self-organized, planned, and hybrid types; the public space of streets can be divided into high, medium, and low according to accessibility; the form of industrial and mining processing areas can be classified as terminal, marginal, independent, and central types. Among these, the hybrid, low-accessibility, and terminal types are the most common. In terms of boundary genes, the boundary morphology of most industrial and mining small towns is finger-shaped and uniform.
1. Introduction
Under the backdrop of rapid urbanization in China, a large number of small industrial and mining towns have emerged due to industrial production and mineral resource development [1,2]. Their locations are often restricted by the distribution of mineral resources. To better exploit and utilize mineral resources, these small towns need to develop industrial and mining industries and build corresponding production areas, living areas, and supporting infrastructure, etc., which has a long-term impact on their spatial morphology [3,4]. However, due to long-term mining, the number of small industrial and mining towns facing depletion of mineral resources is gradually increasing, which has led to the continuous decline of the industrial and mining sectors in these small towns. Adjusting the industrial structure and optimizing the urban planning layout are effective measures to revitalize these small towns [5,6]. In recent years, China has issued a series of policies concerning the optimization of regional spatial morphologies [7,8]. For instance, the report of the 20th National Congress of the Communist Party of China proposed to plan and build a new energy system and promote the coordinated development of regional economic layout. The National New-Type Urbanization Plan (2021–2035) put forward the need to optimize the spatial layout and form structure of urbanization. The Development Plan for Revitalizing Special-Type Regions during the 14th Five-Year Plan period emphasized guiding the transformation and upgrading of independent industrial mining areas and coal mining subsidence areas. Meanwhile, some small towns in industrial and mining areas have also improved the overall living conditions of the towns by building public facilities, improving infrastructure, and treating the environment in the mining areas. Through the exploration of the relevant content of the spatial form of industrial and mining small towns, theoretical support can be provided for the formulation of policies and spatial planning layout of such small towns, which has practical significance.
Industrial and mining small towns, as a distinct category of small urban settlements, exhibit spatial morphologies shaped by a combination of industrial activities and topographical conditions [9,10]. Compared with ordinary small towns, their spatial morphologies tend to be more complex and exhibit particularity, which makes the types of spatial morphologies of industrial and mining small towns have certain theoretical value. However, the theoretical research on industrial and mining small towns mainly focuses on environmental pollution [11,12,13] and governance [14,15], mine area restoration [16,17,18], land use [19,20], planning strategies [21,22], sustainable development [23,24], and redevelopment [25,26], etc. There are a few studies on its spatial morphology. Meanwhile, the current research on the spatial form genes of settlements mainly includes: Keran Cao et al. [27], who analyzed and studied the landscape genes of villages from six different dimensions: environmental layout, landscape features, architectural landscape, material culture, behavioral culture, and spiritual culture. Chen Daijun et al. [28] explored the spatial spectrum of village settlements from aspects such as the spatial distribution of settlements, boundaries, and environment, and the land use structure of settlements. Jiade Wu et al. [29] analyzed the spatial characteristics of settlements along the Miaojiang Border Wall and the Miaojiang Corridor from different perspectives. Zhang Xuefei et al. [30] carried out a multi-dimensional quantitative assessment of village spatial genes. Yuhao Huang et al. [31] took the Yubei Village in the Nanxi River Basin as the research object and explored the spatial genes of small settlements from multiple perspectives. Sun Jianqiao and Shao Long [32] explored the urban landscape genes of Harbin, China, from aspects such as landscape pattern, street texture, architectural style, and culture. Zhao Wanmin et al. [33] took mountainous historical towns as the research object and explored their spatial maps. These research objects were mainly small settlements such as villages [34]. These studies show that existing research on the spatial morphology of larger-scale industrial and mining regions is still insufficient. Thus, exploring the spatial morphological gene map of industrial and mining small towns in China helps to enrich the theoretical research in related fields. This paper mainly refers to and draws on the research on the above-mentioned spatial genes of villages.
Therefore, this paper takes 28 small industrial and mining towns as the research objects, constructs a theoretical framework of structure–region–boundary, and then systematically analyzes the types of spatial form genes of small industrial and mining towns by using methods such as space syntax, shape index, compactness, and typology, and draws their spatial form gene maps (Figure 1), to reveal the characteristics of spatial form genes of small industrial and mining towns, enrich the relevant theories of small town spatial form, and provide certain theoretical support for their spatial planning and layout.
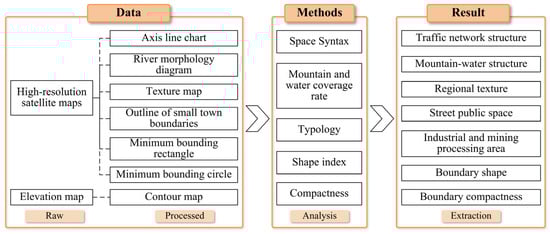
Figure 1.
Research structure framework. Note: The four keywords in the light orange area at the bottom of the figure correspond in sequence to the research process as follows: raw data, processed data, analysis methods, and gene type extraction results.
2. Materials and Methods
2.1. Data Source
This article initially screened industrial and mining enterprises and small towns around mining areas. Then, based on a careful consideration of the balance of sample spatial distribution and various topographic and geomorphic factors, 28 industrial and mining small towns were ultimately determined as research samples (Appendix A Table A1, Figure 2). The research area was defined as the core area of the small town, specifically delineated by the obvious blank area outside the built-up area as the boundary. These research areas are adjacent to open-pit mining areas and have relatively developed transportation conditions.
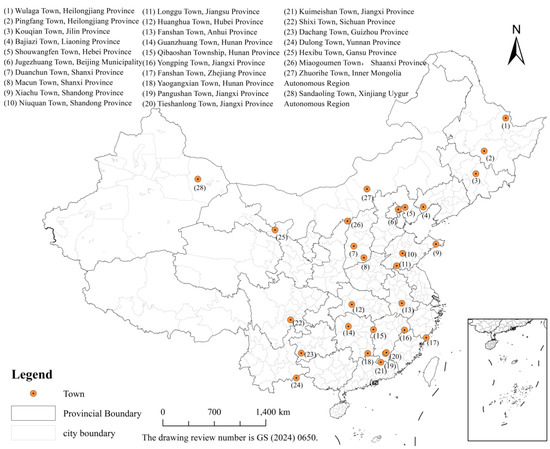
Figure 2.
Distribution of sample mining and industrial towns. Note: Drawn by ArcMap 10.8 software.
At the same time, this paper needs high-resolution satellite images, elevation maps, and Chinese administrative division maps when studying the spatial morphology genes of small industrial and mining towns. Among them, the high-resolution satellite images were obtained by importing the map API data of the National Geographic Information Public Service Platform website (http://lbs.tianditu.gov.cn/home.html) into the QGIS Desktop 3.40.7 software, then delineating the scope of the small towns and downloading the high-resolution satellite images of the small towns. Importing high-resolution satellite images into Autodesk Civil 3D 2024 software, on the one hand, allows for the creation of axial models for spatial syntax analysis based on principles such as the least and longest, and topological consistency. When conducting analysis in the Depthmap10 software, it is necessary to check if the Node Count map is entirely green. If not, the axial model should be inspected and modified. On the other hand, based on the image background map, texture maps of industrial and mining small towns, river maps, and their boundaries can be drawn. The elevation map comes from the FABDEM V1-2 elevation map data released by Neal et al. on the University of Bristol website (https://data.bris.ac.uk/data/dataset/s5hqmjcdj8yo2ibzi9b4ew3sn), accessed on 26 October 2025. The downloaded elevation map is imported into the QGIS Desktop 3.40.7 software, and the contour lines of the research scope of each small town can be analyzed. In addition, the base map (China administrative division map) of the distribution map of industrial and mining towns comes from the website of the National Geographic Information Public Service Platform (https://cloudcenter.tianditu.gov.cn/administrativeDivision), accessed on 11 May 2025.
2.2. Research Theory
This paper draws on the research of scholar Qi Kang in the theory of spatial morphology. In his book Urban Architecture, he described the urban spatial structure from five aspects: “core”, “skin”, “group”, “frame”, and “axis” [35]. However, since small towns belong to small settlements, some of the contents used to describe the urban spatial structure are not applicable, such as the contents of the “axis” and “core” parts. Through the adjustment and combination of the contents, this paper finally constructs a theoretical framework comprising three aspects: structure (frame), region (group), and boundary (skin) to comprehensively describe the spatial morphology genes of industrial and mining towns (Figure 3). The specific contents are as follows:
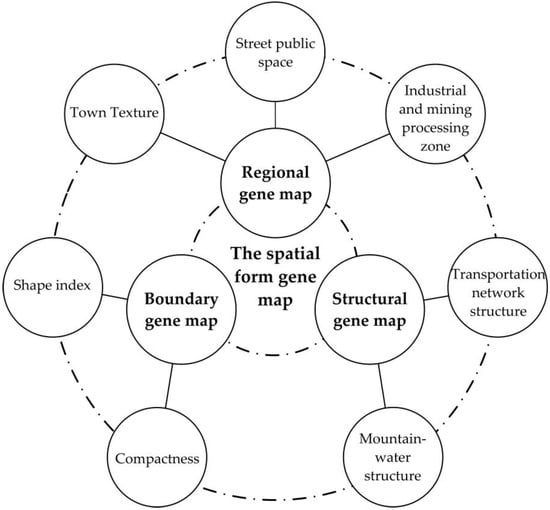
Figure 3.
Theoretical Framework of Spatial Morphology Gene Map of Small Industrial and Mining Towns.
- Structural genes: the spatial structure of industrial and mining towns is represented by the study of traffic network structure and mountain-water structure.
- Regional genes: the texture, street public space, and industrial and mining processing area of small towns are analyzed and summarized.
- Boundary genes: Based on the boundaries of the study area drawn, the research is conducted from two aspects: the shape and compactness of the boundaries.
2.3. Methods
This study adopts the analytical method of combining qualitative and quantitative analysis. The main qualitative method is the typological method, which specifically analyzes and sorts out the data, compares them with each other, and finally summarizes them into various types [36,37,38]. This method is used in this paper to study the transportation network structure, the mountain-water structure, the texture of towns, industrial and mining processing areas, etc. The quantitative methods mainly include spatial syntax, shape index, and compactness, etc. The following is a detailed description of these methods.
2.3.1. Space Syntax
In the early 1980s, Bill Hillier et al. [39] at the Bartlett School of Architecture, University College London, introduced the concept of space syntax, a theoretical framework focused on analyzing spatial configurations and their interrelationships. Specifically, it studies the spatial structure through quantitative methods such as integration, choice, and intelligibility [40], and can be applied to multiple scales and levels such as architecture, villages, towns, and landscapes [41,42].
Integration can be categorized into global and local integration, where global integration reflects the degree of accessibility or connectivity of a road or spatial node to all other spaces within the overall spatial system. Local integration refers to the connection between streets or node spaces within a specified radius and other spaces. Integration reflects the convenience of space, and the size of the integration value is positively correlated with the convenience of space. The integration degree formula [43] of node is shown in Equation (1):
In Formula (1), denotes the total number of spatial nodes, while refers to the mean depth value associated with node .
Choice is used to measure the number of times a space is passed through in the shortest path between two nodes, which can reflect the permeability of the space. It is often used in the analysis of street traffic efficiency. The better the choice, the stronger the attractiveness of the space. The calculation Formula (2) of the choice of node is as follows [44]:
In Formula (2), represents the number of shortest paths between segment and segment k that contain , while represents the number of all shortest paths between segment and segment .
Intelligibility serves as a measure to assess the level of coherence between local and global spatial structures within a region, indicating how well the local layout aligns with the overall spatial configuration. The higher the intelligibility, the easier the spatial structure is to identify and perceive. It is generally believed that when , the spatial intelligibility is poor, when , the spatial intelligibility is good, and when reaches 0.7 or more, the spatial intelligibility is considered to be excellent [45]. The intelligibility of small towns can be graphically represented by plotting the relationship between local and global integration on a scatter diagram. The calculation Formula (3) of intelligibility is as follows [46,47]:
In Formula (3), denotes the local integration level of axis ; refers to the mean local integration value across the entire spatial system; indicates the global integration degree of space ; stands for the total number of axes within the space; and represents the average global integration value for the whole configuration.
2.3.2. Mountain and Water Coverage Rate
The coverage rates of mountains and water are calculated based on the perimeter of the smallest rectangle that can enclose a town. The mountain coverage rate refers to the cumulative length of the mountainous area that meets the slope requirements and overlaps with the rectangular boundary, divided by the perimeter. If the mountain is completely within the rectangle, the projection length on the rectangular boundary is used for calculation. The water coverage rate is the proportion of the total length of the shorter side of the intersection between rivers and the smallest enclosing rectangle to the perimeter of the rectangle. This method of calculating the mountain and water structure has the advantages of being direct, simple, operable, and suitable for this study. The calculation data of mountain coverage rate and water coverage rate can not only serve as an auxiliary basis for the classification of the types of relationships between small towns and mountains and between small towns and rivers but also be used to determine the range of mountain or water coverage rate for the gene types of the relationship between mountains and small towns and the relationship between rivers and small towns. The calculation formulas for mountain and water coverage rates are as follows:
In Equation (4), Q represents the coverage rate of mountains and water, L represents the total length of the parts of the smallest circumscribed rectangle of the mountain or river covering the small town, and represents the perimeter of the circumscribed rectangle of the small town’s boundary. The criterion for determining a mountain is as follows: In areas with significant terrain undulation, a slope greater than 25% is adopted, such as mountainous areas and some plateau regions; for areas with less terrain undulation, a slope greater than 10% is adopted, such as plains, hills, and some plateau areas.
2.3.3. Compactness
The concept of “compact city” was first proposed in the 1970s, and later it was widely used in planning practice and research in various countries or regions [48,49]. Considering the characteristics of the research data in this paper, we choose to start from the overall external outline of the industrial and mining towns, draw on Cole’s research on compactness [50], and analyze the compactness characteristics of the towns by selecting Formula (5).
In Formula (5), denotes the area of the given region, while represents the area of the smallest circle that can fully enclose the region.
2.3.4. Shape Index
The shape index was first proposed by McGarigal & Marks in 1995 and later widely used in the study of the boundary shape of towns and villages, which is suitable for the study of the boundary shape of the study area of industrial and mining towns in this paper. The shape index is represented by , and its calculation formula [51] is as follows:
In Formula (6), is the perimeter of the contour of the study area, and is the ratio of the length to the width of the circumscribed rectangle of the contour of the area.
2.3.5. Variance Inflation Factor
The variance inflation factor (VIF) method is used to evaluate the linear relationship among indicator variables and can be applied to analyze the collinearity of indicator variables and eliminate some highly correlated indicators. When VIF > 10, it indicates that there is collinearity among the indicators; 5 ≤ VIF ≤ 10: there is weak collinearity among the indicators; VIF < 5, there is no collinearity among the indicators. Its calculation formula [52,53,54] is as follows:
In Formula (7), is the R-square of a linear regression model of a certain independent variable on other independent variables, and is the variance inflation factor of indicator .
3. Results
This paper adopts a research method that combines quantitative and qualitative approaches to conduct a systematic analysis of the structure, regional, and boundary gene types of industrial and mining small towns. Among them, the spatial syntax is commonly used to analyze the traffic structure gene [55], and the integration degree and choice degree analysis diagram is used to summarize and generalize; the mountain-water structure gene is mainly divided by summarizing the topographic map and river map and combining the calculated mountain coverage rate and water coverage rate data to assist in the completion of the classification of mountain and water structure gene types. The gene classification of small-town texture and industrial and mining processing areas is mainly based on the characteristics of the corresponding texture maps. The genetic types of street public space and boundary shapes are classified based on the comprehensibility and shape index data calculated, with reference to the general classification thresholds adopted in relevant literature. For the analysis of boundary compactness, this study used the One-Sample Kolmogorov–Smirnov (K-S) test in IBM SPSS Statistics 27 to examine the normal distribution of the data. The classification of compactness data was then completed based on the interval in the normal distribution pattern. In addition, to avoid the problem of excessive collinearity in the gene types used for quantitative analysis, this paper employs the variance inflation factor to conduct a collinearity test on the mountain-water structure, street public space, boundary shape, and compactness (Table 1). The research results show that the variance inflation factor of all gene indicators does not exceed 5, indicating that there is no collinearity problem among the selected gene indicators, and subsequent research can be carried out.

Table 1.
Results of Variance Inflation Factor Analysis.
3.1. Structural Gene Map
3.1.1. Traffic Network Structure
Through the research on the data of selectivity and integration of small towns (Figure 4 and Figure 5, Appendix A Figure A1 and Figure A2), it can be concluded that Longgu Town, Hexi Bao Town, Kouqian Town, and Jugezhuang Town have performed well in terms of integration and choice, while Zhurihe Town, Miaogoumen Town, and Dulong Town have performed poorly in these aspects. At the same time, it can also be seen that most small towns have 1–2 main roads with better integration and choice degrees, which are the main thoroughfares in these small towns. By comprehensively analyzing the results of the degree of choice and integration and combining them with the image maps of small towns, the structural form types of the transportation network in small towns can be analyzed. The analysis results show that, based on the combination relationship of the main road forms, small towns can be classified into grid type, branch-shaped type, and hybrid type horizontally. Meanwhile, according to the number of streets with the highest integration and selection degrees (shown in red), they can be classified into single-master, dual-master, and multi-master types vertically.
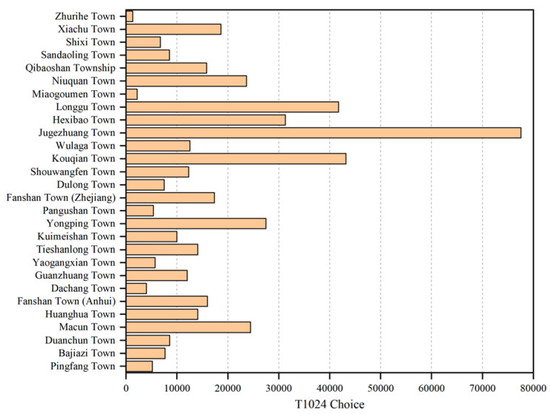
Figure 4.
Analysis results of choice degree. Note: The values in the figure are calculated by the Depthmap10 software.
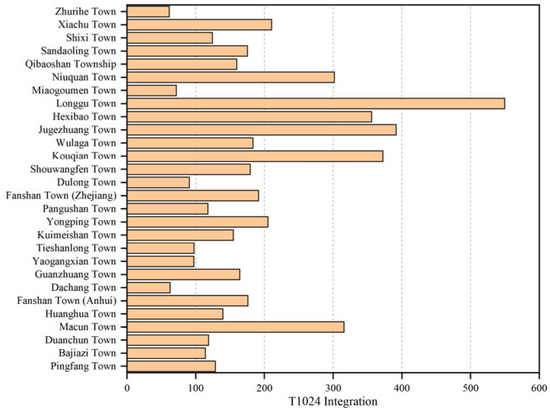
Figure 5.
Integration degree analysis results. Note: Same notes as Figure 4.
3.1.2. Mountain-Water Structure
Based on the calculation results of mountain coverage and the elevation map (Figure 6 and Figure 7, Appendix A Table A2), it is found that the relationship between mountains and small towns mainly manifests as proximity, mainly with low mountain coverage (0 < mountain coverage < 0.32); encirclement, mainly with medium mountain coverage (0.32 < mountain coverage < 0.48); enclosure, mainly with high mountain coverage (0.48 < mountain coverage); and the absence of mountains or hills nearby, mainly with no mountain coverage (mountain coverage = 0). Further summarizing the relationship between these small towns and mountains can be classified as mountain-adjacent town type, mountain-fringed town type, and mountain-encircled town type. In addition, some towns are located on flat terrain with no obvious mountains or hills around them, so the relationship between these towns and mountains is classified as no mountain types.
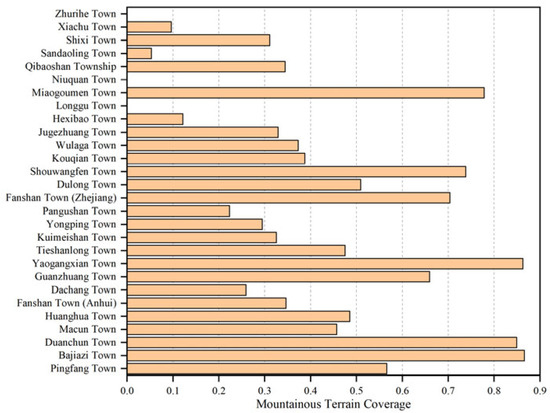
Figure 6.
Analysis results of the mountain coverage rate. Note: Topographic maps were compiled using Autodesk Civil 3D 2024 software, with relevant data on mountain coverage ratio extracted; for some small towns in the maps, no corresponding bar is presented, which indicates a mountain coverage ratio of 0 in the corresponding area.
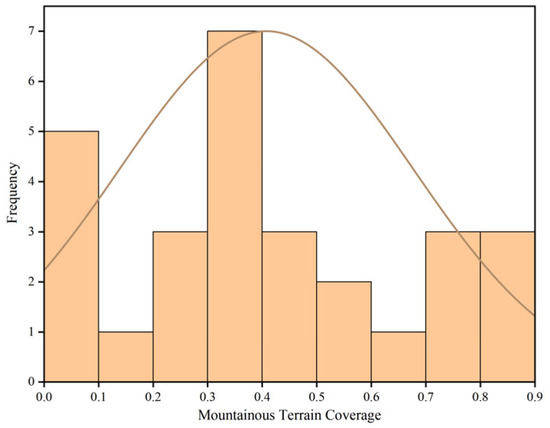
Figure 7.
Sample size of mountain coverage rate. Note: This graph is a histogram with a curve; the bars represent the frequency of data in the corresponding intervals, and the curve is the fitted normal distribution probability density curve.
Based on the results of the water coverage ratio calculation table and the river maps (Figure 8 and Figure 9, and Appendix A Table A3), it is found that the relationship between rivers with low water coverage ratio (water coverage ratio) and small towns mainly manifests in three types: simple intersection with the two adjacent sides of the minimum circumscribed rectangle, intersection along the short side direction of the minimum circumscribed rectangle, and intersection along the long side direction of the minimum circumscribed rectangle. This paper further summarizes the relationship between water and small towns as three types: simple intersection, intersection along the long side direction, and intersection along the short side direction. For rivers with a high water coverage ratio (water coverage ratio), the relationship between them and small towns is characterized by compound intersection with the minimum bounding rectangle. This compound intersection can be classified into combinations of the three types: simple intersection, intersection along the long side direction, and intersection along the short side direction. According to the specific shape of the river, the compound intersection can be further subdivided into simple + intersection along the long side direction, a simple + intersection along the short side direction, and a double intersection along the short side direction. Additionally, for some towns, there are no rivers within their minimum bounding rectangles (water coverage ratio = 0), and this relationship is determined as the no-river type.
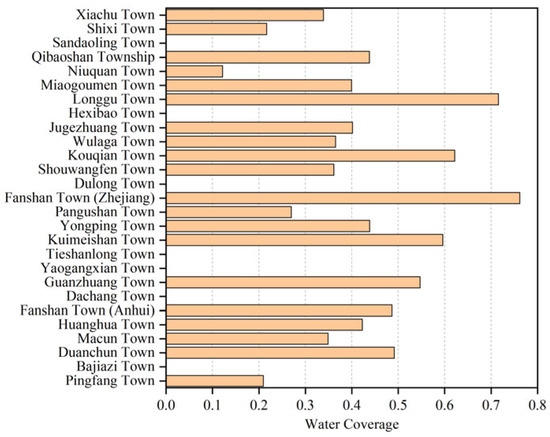
Figure 8.
Analysis results of the water coverage rate. Note: River maps were compiled using Autodesk Civil 3D 2024 software, with relevant data on water coverage ratio extracted; for some small towns in the maps, no corresponding bar is presented, which indicates no river distribution within the minimum circumscribed rectangle of the corresponding town.
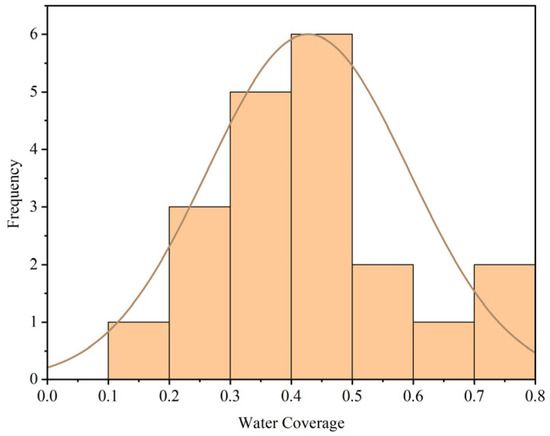
Figure 9.
Sample size of water coverage rate. Note: Same notes as Figure 7.
3.1.3. Structural Gene Mapping
To better present the analysis results of the traffic grid gene type and the mountain-water structure gene type, this paper has drawn the corresponding gene maps of the above two types (Figure 10). Among them, the traffic grid gene map is expressed by patterns composed of lines of different thicknesses (representing roads) based on the analysis results of its gene types. The mountain-water structure gene map is divided into two parts: the relationship between mountains and small towns, which is expressed by the positional relationship between patterns composed of multiple rectangles (representing industrial and mining small towns) and contour lines (representing terrain slope); the relationship between rivers and small towns, which is expressed by the intersection relationship between rectangles (representing industrial and mining small towns) and blue line segments (representing rivers).
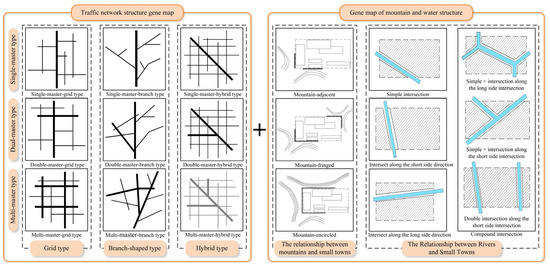
Figure 10.
Map of structural genes. Note: The sub-diagrams in the figure were drawn using CAD 2019 software and then integrated with Microsoft Visio 2021 software.
3.2. Regional Gene Map
3.2.1. Town Texture
By observing and analyzing the texture diagrams of industrial and mining small towns (Appendix A Figure A3), it is found that the texture of small towns shows both self-organization and planning. Meanwhile, the texture of some small towns does not have obvious self-organization or planning, but rather a coexistence of these two types within the small towns, presenting a mixed state. Therefore, based on the summary and analysis of the texture diagrams of small towns, the texture morphological gene types of small towns can be determined as three types: self-organizing type, planning type, and hybrid type. Among them, the self-organizing type refers to some small towns that have the characteristics of dispersion, irregular organization, and random spatial and building scales, maintaining some of the original natural state. The planning type indicates that some small towns show obvious planning features in the overall texture; although there are differences in building volumes, the layout is orderly and staggered, presenting the significant characteristics of modern systematic planning. The mixed type indicates that the structure and layout of small towns are relatively clear, but the building units within the area are still staggered and disorderly, or only a few residential areas show relatively obvious planning and design features.
3.2.2. Street Public Space
Through the analysis of the intelligibility within an 800-m radius of small industrial and mining towns (Figure 11 and Figure 12, and Appendix A Figure A4), it can be found that Dachang Town, Yaogangxian Town, Kuimei Mountain Town, and Dulong Town have excellent intelligibility, while Xiachu Town, Niuquan Town, Hexi Bao Town, and Macheng Town have very poor intelligibility. When , there are 17 samples of small industrial and mining towns; when , there are 7 samples of small towns; when , there are 4 samples of small towns. These indicate that the accessibility of most streets in small industrial and mining towns is relatively poor. According to the classification of comprehensibility levels, the types of street public space genes can be divided into low, medium, and high accessibility.
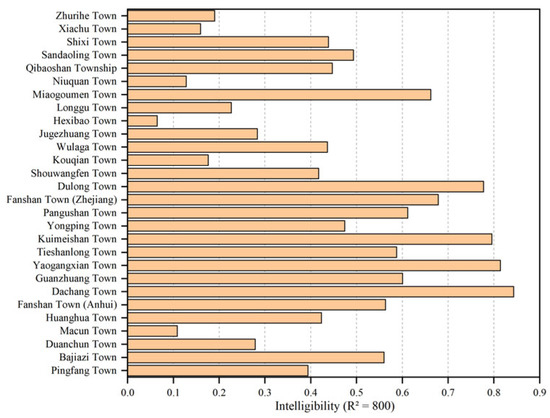
Figure 11.
Results of intelligibility analysis. Note: Same notes as Figure 4.
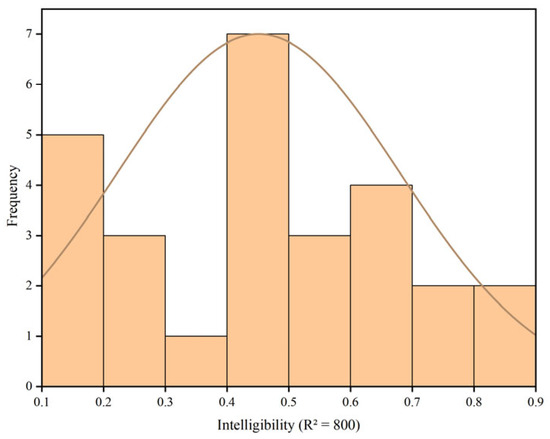
Figure 12.
Sample size in each interval of intelligibility. Note: Same notes as Figure 7.
3.2.3. Industrial and Mining Processing Zone
Unlike ordinary small towns, an important function of industrial and mining small towns is to serve the extraction and processing of mineral resources. Therefore, it is necessary to analyze the location of the industrial and mining processing zones in small towns and their relationship with the surrounding open-pit mines. This paper compares the spatial location of industrial and mining areas in the sample of small towns in industrial and mining areas (Appendix A Figure A3) and finds that the spatial location morphology of industrial and mining areas can be divided into terminal type, borderline type, independent type, and central type. Among them, the terminal type indicates that the industrial and mining processing zones are located at the end of small towns; the borderline type indicates that the industrial and mining processing area is mainly located at the edge of the small town; the independent type indicates that the industrial and mining processing area is far from the main town area, isolated outside the small town, and connected by roads; and the central type indicates that the industrial and mining processing area is close to the town center and has a close connection with the town center. Furthermore, by observing the image maps of industrial and mining small towns and the spatial relationship between industrial and mining processing zones and open-pit mines, it can be found that the peripheries of terminal, borderline, and independent industrial and mining processing areas often have obvious open-pit mines, while no obvious traces of mines are found around most of the central industrial and mining processing areas.
3.2.4. Regional Gene Mapping
This article presents the analysis results of three types of genes: texture genes, street public space genes, and industrial and mining processing area genes, by drawing their respective gene maps (Figure 13). Among them, the texture gene map is represented by the partial texture map of some industrial and mining small town research samples based on the analysis results of their gene types. The street public space gene map is represented by the partial axial model map of some research samples based on the analysis results of its gene types. The industrial and mining processing area gene map is represented by the positional relationship between rectangular frames (representing industrial and mining small towns) and elliptical areas (representing industrial and mining processing areas) based on the analysis results of its gene types.
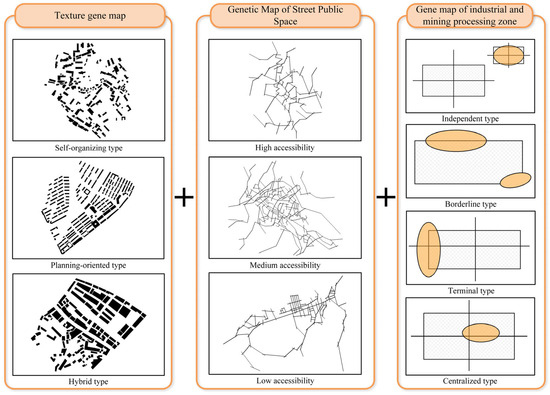
Figure 13.
Regional gene map. Note: Same notes as Figure 10.
3.3. Boundary Gene Map
3.3.1. Boundary Shape
Through the analysis of the shape index (Figure 14 and Figure 15, Table 2), it was found that the shape index of Bajizi Town, Shouwangmen Town, Niuquan Town, and Pangushan Town performed well, while that of Zhurihe Town and Shixi Town was very poor. According to the boundary morphology determination criteria of industrial and mining small towns based on and values [56], it was found that when , there were 17 small towns. Among them, when , the boundary morphology of 3 small towns presented a finger-like type with a clustering tendency; when , the boundary morphology of 5 small towns was finger-shaped; when , the spatial boundary morphology of 9 small towns was a banded finger-like. When , there were 11 small towns. Among them, when , the boundary morphology of 2 small towns was cluster-like; when , the boundary morphology of 5 small towns exhibited a cluster-like with a banded tendency; when , the spatial boundary morphology of 4 small towns was band-like. Therefore, the boundary morphological gene types of industrial and mining small towns can be described as clustered finger-like form (), finger-like form (), elongated finger-like form (), cluster form (), elongated cluster form (), and linear form ().
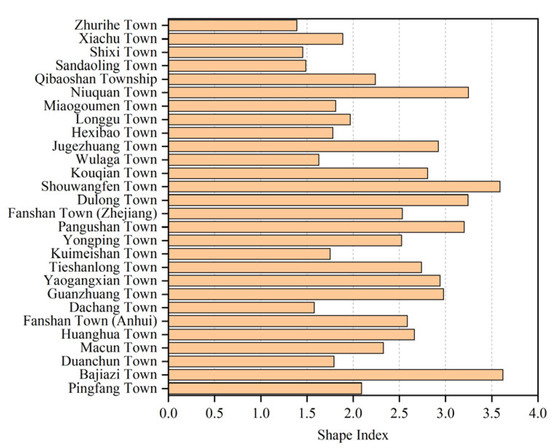
Figure 14.
Calculation Results of the Shape Index of Small Towns. Note: The values in the figure were calculated based on the data of the boundary contours, minimum circumscribed circles and minimum circumscribed rectangles of the study samples; the boundary contours of the samples were delineated in Autodesk Civil 3D 2024, and after being imported into ArcMap 10.8, the target minimum circumscribed circles and rectangles were obtained through analysis using the Minimum Bounding Geometry tool.
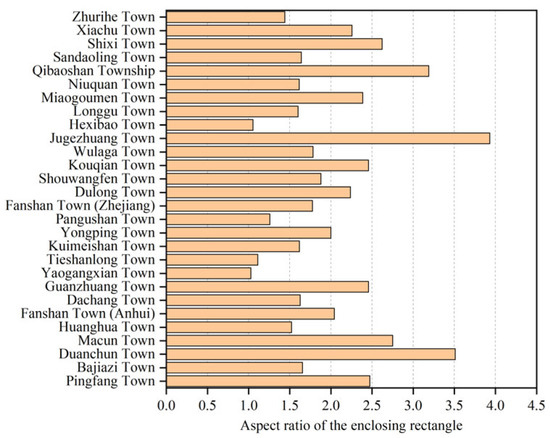
Figure 15.
Calculation results of the length-to-width ratio of the minimum bounding rectangle. Note: Same notes as Figure 14.
Table 2.
Criteria for Determining the Morphology of Small-Town Boundaries.
3.3.2. Boundary Compactness
According to the calculation results (Table 3, Figure 16 and Figure 17), the average value of the compactness index () is 0.2595, with the maximum value being 0.5370 and the minimum value being 0.1002. The sample follows a normal distribution, with = 0.1368 and = 0.3821. These indicate that when , there are 2 small towns showing low compactness, when , there are 20 small towns showing medium compactness, and when , there are 6 small towns showing high compactness. Based on the spatial layout characteristics of small towns, this paper ultimately classifies the spatial compactness of small towns into compact type, uniform type, and loose type.
Table 3.
Key Data Parameters of Compactness.
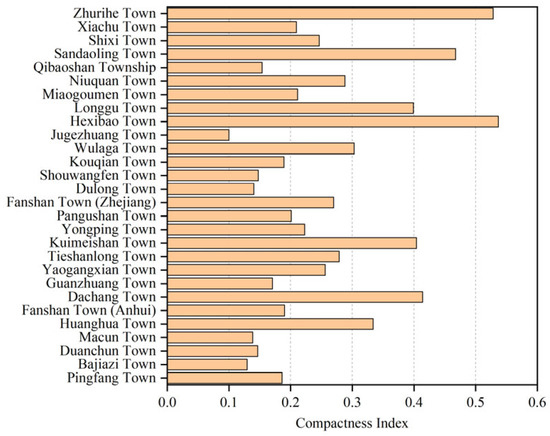
Figure 16.
Calculation results of compactness in small towns. Note: Same notes as Figure 14.
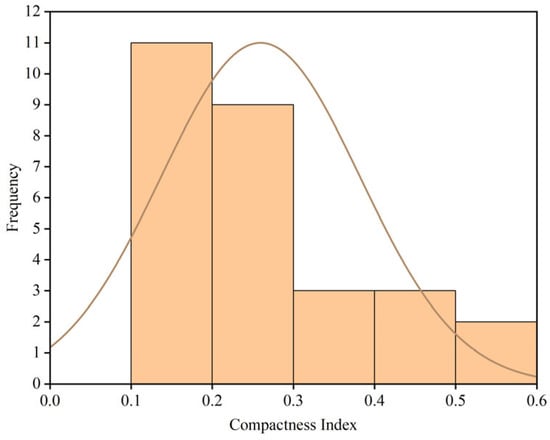
Figure 17.
Sample size in each compactness interval. Note: Same notes as Figure 7.
3.3.3. Boundary Gene Mapping
To better present the analysis results of the shape gene type and the compactness gene type, this paper has drawn the corresponding maps of these two gene types (Figure 18). Among them, the shape gene map is based on the analysis results of the gene type, expressed by the boundary maps and dotted lines of some samples of industrial and mining small towns. The compactness gene map, on the other hand, is based on the analysis results of the compactness type, represented by filling in some squares on the grid.
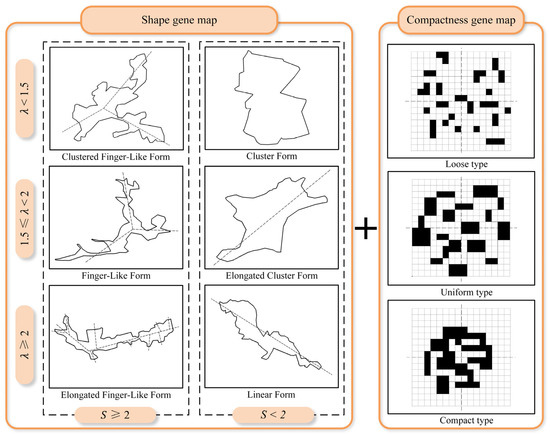
Figure 18.
Boundary gene map. Note: Same notes as Figure 10.
3.4. Robustness Test
After conducting quantitative analysis, the reliability of the data analysis can be enhanced through robustness tests. In this study, the classification thresholds for street accessibility and boundary morphology mainly refer to the settings of other scholars’ research. The classification of the relationship between mountains and small towns and the relationship between water and small towns is derived from the summary of topographic maps and river maps. Mountain coverage rate and water coverage rate only play an auxiliary role, so there is no need to conduct robustness tests on the thresholds of these four indicators. The robustness test of boundary compactness adopts the method of randomly eliminating 5% of the samples (2 samples). As shown in Table 4, the research results indicate that the variation range of the value and the value is not significant, which can be regarded as robust.
Table 4.
Robustness test of boundary compactness.
3.5. Overall Spatial Morphology Gene Map of Small Industrial and Mining Towns
To better represent the spatial morphology gene maps of each industrial and mining small town at the structural, regional, and boundary levels, the gene types of seven aspects, including transportation structure, mountain–water structure, small town texture, street public space, industrial and mining processing area, boundary shape, and compactness, are summarized and encoded (Table 5). From A to G, each represents a specific secondary gene map, and a and b represent the relationship between mountains and small towns and the relationship between rivers and small towns, respectively, and the specific numbers represent different spatial morphology gene types.
Table 5.
Gene Map Composition and Coding.
This article uses the “Chord Diagram” tool in OriginPro 2025 software to draw the gene maps of each industrial and mining small town in terms of structure, region, and boundary. According to Figure 19, it can be found that the spatial morphology gene types of industrial and mining small towns are more likely to exhibit grid-like street structures, mountain-encircled type mountain–town relationships, no-river type water–town relationships, hybrid type urban texture, low accessibility of street public space, terminal type industrial and mining processing areas, elongated cluster form type boundary shapes, and uniform type boundary compactness.

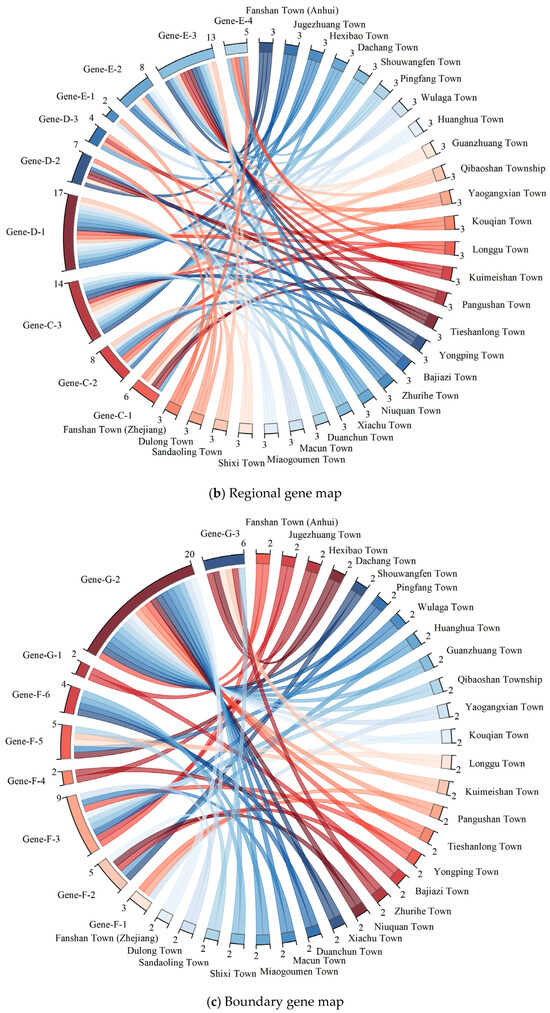
Figure 19.
Gene map of the spatial morphology of small industrial and mining towns. Note: This figure is a Chord Diagram. For the right half of the annulus, the layers are arranged sequentially from outside to inside as follows: research samples of industrial and mining towns, and the number of genes studied. For the left half of the annulus, the layers are arranged sequentially from outside to inside as: gene types, and the number of samples covered by each gene type. The connecting lines within the hollow area of the annulus represent the corresponding correlation between the research samples and gene types.
4. Discussion
This paper employs methods such as space syntax, compactness, shape index, and typology to qualitatively and quantitatively analyze the gene types of the spatial form of industrial and mining small towns from the aspects of structure, region, and boundary, and then maps them out.
4.1. Qualitative Summary and Classification of Spatial Morphological Gene Types
The typological method was employed to summarize the morphological genes of small town textures and industrial and mining processing zones. Among them, the texture gene characteristics of small industrial and mining towns are similar to those of general small towns. The locations of industrial and mining processing zones in various small towns and their surrounding mining areas, to a certain extent, indicate that terminal-type, borderline-type, and independent-type small towns often process nearby-mined minerals, while most central-type industrial and mining small towns have developed industries and process minerals mined from distant areas within the small towns. Then, the integration degree and choice degree of space syntax were applied to assess the types of traffic structure genes, which is different from the research of Zheng Wenjun et al. on traditional villages in the Lijiang River Basin, where street forms were classified into three types: tree-like, free-form, and network-like. Xi Chen and Xuebin Liu [47] utilized GIS technology and the integration degree in space syntax to quantitatively analyze the urban morphological structure. In this paper, the grid type, branch type, and mixed type of small-town streets were summarized through integration degree and choice degree diagrams. Furthermore, use topographic maps and mountain coverage rate indicators to summarize the relationship between mountains and small towns—mountain-fringed type, mountain-encircled type, and mountain-adjacent type. This is like the research of Cheng Junjie et al. In their study on the spatial gene map of the village settlement pattern, they found that there are four types of relationships between mountains and villages: mountain adjacent to village, mountain encircling village, mountain surrounding village, and village and mountain separated [57].
4.2. Quantitative Analysis and Interpretation of Spatial Morphological Gene Types
The legibility in space syntax is utilized to assess the accessibility of public street spaces. It is found that most industrial and mining small towns suffer from poor street accessibility. This finding is inconsistent with the study of Wang Ziyue and Liu Lei [58], who analyzed the micro-level accessibility of the Wenefeng Ancient Street area in Hechuan using the legibility analysis in space syntax and found that the legibility of the street block was relatively high. Three potential reasons account for this discrepancy: First, the planning of these small towns is oriented towards industrial and mining production, with a lack of systematic planning for human settlement and living areas. Second, most industrial and mining small towns have adopted the development model of “production alongside construction”, which has resulted in the fragmentation of the street network. Third, the topographical constraints of mountains and hills, combined with factors such as the abandonment of partial areas triggered by industrial decline, have further exacerbated the decline in street legibility and connectivity.
By applying shape index and compactness, this paper determines the boundary morphology of small industrial and mining towns through the shape index and the aspect ratio of the minimum circumscribed rectangle λ. The main types are cluster-shaped () and finger-shaped (). Among them, most small industrial and mining towns are finger-shaped, indicating that the boundaries of most small towns are complex and present complex finger-like shapes. This description of settlement boundary morphology has been used by many scholars [59]. Relevant studies include Yuhao Huang et al. [31], who found that the main forms of traditional settlement morphology are linear and cluster-shaped, tending to be linear and finger-shaped, and tending to be cluster-shaped. Quan Zhu and Shuang Liu [60] also found that the main forms of the boundaries of traditional mountain villages are cluster-shaped and linear. Meanwhile, the proportion of small towns in the finger-shaped industrial and mining small towns that show a linear tendency is over half. This might be due to reasons such as terrain, which causes the spatial morphology of the small towns to present a distinct linear pattern, making it necessary for the small towns to rely on simple and powerful transportation arteries as the framework to connect the functional zones of the town. The results of the compactness calculation show that most of the small towns in industrial and mining areas are in the middle range of these values. This indicates that the layout of most of these small towns is restricted by factors such as terrain, making their shapes rarely circular and their boundaries rarely simple and smooth. This is different from the research results of Li Xin and Wang Xianwen. In their study on the spatial form characteristics of county-level administrative regions in Henan Province, China, they found that the spatial aggregation of some counties and cities was relatively low [61].
In quantitative analysis, software such as ArcGIS and QGIS was adopted to obtain high-resolution images, minimum bounding rectangles, and minimum bounding circles, laying the foundation for the analysis of the spatial form genealogy of industrial and mining small towns. Relevant studies include Amalia Nită et al. [62], who constructed a spatial location model based on GIS technology to analyze the changes in the supply and demand relationship of tourism in the Oltina Geopark. Daniela Mihaela Măceseanu et al. [63] used ArcGIS 10.7.2 software to analyze the dynamic changes in land use and assess the natural endowment of the watershed.
4.3. Limitations and Prospects of the Research
This study also has its limitations. It mainly focuses on the macroscopic spatial morphology of industrial and mining small towns from the three aspects of structure, region, and boundary, and there is still room for improvement and in-depth exploration. In future research, studies on the micro-level, such as buildings in small towns, can be added. Secondly, there are deficiencies in the application of the research on the mountain-water structure gene map of small towns in this study. It pays too much attention to the coverage of mountains and water on the minimum bounding rectangle and easily neglects the possible changes of mountains and water within the minimum bounding rectangle. In the future, more precise and comprehensive methods can be used to analyze the relationship between mountains, rivers, and small towns. In addition, the accuracy of the drawing of the base map in this paper still has room for improvement. Finally, this paper uses high-resolution remote sensing images (with the base map coordinate reference system EPSG:3857 and the WGS 84 geodetic coordinate system EPSG:6326 as the reference, with the highest accuracy of 2 m) as the base map. This base map is imported into Autodesk Civil 3D 2024 software, and the plan views of streets, buildings, etc., are drawn with it as a reference (with a scale of 1:1000). The accuracy still has room for improvement. In the future, the drawing accuracy can be further enhanced through collaborative operations with software such as ArcGIS. In addition, this study is based on cross-sectional data and lacks consideration of the development and evolution of the spatial form of industrial and mining small towns over time. In future research, panel data can be used to study the spatio-temporal changes of the spatial form genes of industrial and mining small towns.
5. Conclusions
This study takes 28 small industrial and mining towns as the research objects and explores the spatial form gene map of industrial and mining small towns through a variety of quantitative and qualitative analysis methods. This research can make up for the deficiency of related studies on the spatial form of industrial and mining small towns in China and enrich the theoretical research on the spatial form of industrial and mining towns. Meanwhile, this study systematically explores the gene characteristics of the spatial form of industrial and mining small towns from three dimensions: structure, region, and boundary, which can provide theoretical support for the optimization of the spatial structure and planning practice of industrial and mining small towns in China. The specific theoretical achievements of this research are as follows:
- In the analysis of structural gene maps, the horizontal classification of the traffic street structure gene types in small towns can be divided into grid, branch-shaped, and hybrid types, while the vertical classification can be divided into single-master, dual-master, and multi-master types. Among them, the proportion of small towns with grid-type street structures is the largest. The spatial relationship between mountains and small towns in the mountain–water structure can be divided into four types: mountain-encircled, mountain-adjacent, mountain-fringed, and no-mountain types. The relationship between rivers and small towns can mainly be classified into five types: simple intersection, intersection along the long side direction, intersection along the short side direction, compound intersection, and no-river types. Mountain-encircled type (mountain-town relationship) and no-river type (water-town relationship) are the main types of small towns.
- In the analysis of regional gene maps, the texture of small towns can be summarized and classified into three types at a macro level: self-organized, planned, and hybrid. According to the degree of intelligibility, the gene types of street public spaces can be divided into three categories: high accessibility, medium accessibility, and low accessibility. Street public spaces in most industrial and mining small towns exhibit poor accessibility. The morphological gene types of industrial and mining processing zones can be classified into terminal, borderline, independent, and central types. Among them, the peripheries of terminal, borderline, and independent industrial and mining processing areas often have obvious open-pit mines. The hybrid type (town texture), low accessibility (street public space), and terminal type (industrial and mining processing area) are the main gene types of small towns.
- In the analysis of boundary gene maps, the morphological gene types of industrial and mining small towns’ boundaries can be classified as follows: when , they are classified as cluster form type (), elongated cluster form type (), and linear form type (); when , they are classified as clustered finger-like form type (), finger-like form type (), and elongated finger-like form type (). The gene types of boundary compactness can be divided into compact type (), uniform type (), and loose type (). The elongated finger-like form type (boundary morphology) and uniform type (boundary compactness) are the main gene types exhibited by small towns.
Author Contributions
Q.L.: Conceptualization, Writing—review and editing, Supervision, Funding acquisition. L.Y.: Conceptualization, Writing—original draft, Investigation. Z.X.: Conceptualization, Investigation, Data Curation. T.G.: Investigation, Formal Analysis, Project Administration. All authors have read and agreed to the published version of the manuscript.
Funding
This research was supported by the National Natural Science Foundation of China (Grant Nos. 52578013, 52178036); the Anhui Province Philosophy and Social Sciences Planning Project (Grant No. AHSKY2022D134); and the Hefei University of Technology Philosophy and Social Sciences Cultivation Program (Grant No. JS2025ZSPY0098).
Data Availability Statement
The data of this study can be obtained from the corresponding author upon reasonable request.
Conflicts of Interest
Author Zhaomin Xu was employed by the company Anhui Provincial Tendering Group Co., Ltd. The remaining authors declare that the research was conducted in the absence of any commercial or financial relationships that could be construed as a potential conflict of interest.
Appendix A


Figure A1.
Display of integration degree analysis results in space syntax. Note: From blue to red, it indicates that the degree of integration gradually increases.
Figure A1.
Display of integration degree analysis results in space syntax. Note: From blue to red, it indicates that the degree of integration gradually increases.


Figure A2.
Display of the choice analysis results in space syntax. Note: From blue to red, it indicates that the degree of selection gradually increases.
Figure A2.
Display of the choice analysis results in space syntax. Note: From blue to red, it indicates that the degree of selection gradually increases.


Figure A3.
Texture map of small industrial and mining towns. Note: Different colors are used in the figure to represent different areas. The orange area indicates the industrial and mining processing zone, the black area represents the general area, and the red circle indicates the open-pit mining area.


Figure A4.
Intelligibility analysis results in space syntax. Note: The figure shows a scatter plot of T1024 Integration-T1024 Integration R800 metrics. R2 represents the comprehensibility value, and the color changes from blue to red, indicating the continuous increase in the integration value.
Figure A4.
Intelligibility analysis results in space syntax. Note: The figure shows a scatter plot of T1024 Integration-T1024 Integration R800 metrics. R2 represents the comprehensibility value, and the color changes from blue to red, indicating the continuous increase in the integration value.


Table A1.
Basic Information of Small Industrial and Mining Towns.
Table A1.
Basic Information of Small Industrial and Mining Towns.
| Regions | Small Towns | Surrounding Mineral Resources | Relief |
|---|---|---|---|
| Heilongjiang Province | Wulaga Town | Wulaga Gold Deposit | Hills |
| Pingfang Town | Songjiang Copper Deposit | Mountains and hills | |
| Jilin Province | Kouqian Town | Xinhua Construction Stone Deposit | Hills |
| Liaoning Province | Bajiazi Town | Bajiazi Lead-Zinc Deposit | Hills |
| Hebei Province | Shouwangfen Town | Shouwangfen Copper-Iron Deposit | Mountains and hills |
| Shanxi Province | Duanchun Town | Tianju Xinyuan Coal Open-pit Mine | Plateau and hills |
| Macun Town | Limestone Mineralized Belt; Iron Occurrence | Hills | |
| Hubei Province | Huanghua Town | Caijiawan Mining Area; Niejiahe Mining Area | Hills |
| Anhui Province | Fanshan Town | Fanshan Alunite Deposit | Plains and hills |
| Guizhou Province | Dachang Town | Qinglong Antimony Deposit | Mountains and hills |
| Hunan Province | Guanzhuang Town | Woxi Mining and Metallurgical Complex; Yongping Copper Mine | Hills |
| Yaogangxian Town | Wolframite Ore District; Yuxin Polymetallic Deposit | Mountains and hills | |
| Qibaoshan Township | Qibaoshan Pyrite Deposit | Plains and hills | |
| Jiangxi Province | Tieshanlong Town | Tieshanlong Tungsten Deposit | Mountains and hills |
| Kuimeishan Town | Kuimeishan Tungsten Deposit | Mountains and hills | |
| Yongping Town | Hebei Mining Area | Hills | |
| Pangushan Town | Pangushan Tungsten Mining District | Mountains and hills | |
| Zhejiang Province | Fanshan Town | Fanshan Deposit | Hills |
| Yunnan Province | Dulong Town | Dulong Tin-Zinc Polymetallic Deposit | Mountains and hills |
| Shandong Province | Xiachu Town | Waizhuang Gold Mining Area | Hills |
| Niuquan Town | Duguanzhuang Iron Ore Mining Area | Plains | |
| Sichuan Province | Shixi Town | Qianwei Bashi Coal Independent Mining Industrial Area | Hills |
| Xinjiang Uygur Autonomous Region | Sandaoling Town | Sandaoling Mining Area | Plateau |
| Shaanxi Province | Miaogoumen Town | Anshan Coal Mine | Plateau |
| Gansu Province | Hebaibao Town | Honggedagou Dolomite Deposit; Dongdashan Iron Deposit | Mountains |
| Beijing Municipality | Jugezhuang Town | Iron Mine | Plains and hills |
| Jiangsu Province | Longgu Town | Longdong Coal Mine | Plains |
| Inner Mongolia Autonomous Region | Zhurihe Town | Zhurihe Town Construction Basalt Quarry; Beiliutumiao Polymetallic Deposit | Plateau (gentle slope) |
Table A2.
Research Results on the Relationship between Mountains and Small Industrial and Mining Towns.
Table A2.
Research Results on the Relationship between Mountains and Small Industrial and Mining Towns.
| Scope | Small Towns | Mountain Coverage Rate | Type | Topographic Map |
|---|---|---|---|---|
| Mountain coverage rate = 0 | Longgu Town | 0 | No mountains |  |
| Niuquan Town | 0 | No mountains |  | |
| Zhurihe Town | 0 | No mountains |  | |
| 0 < Mountain coverage rate < 0.32 | Sandaoling Town | 0.0529 | Mountain-adjacent |  |
| Xiachu Town | 0.0965 | Mountain-adjacent |  | |
| Hexibao Town | 0.1216 | Mountain-fringed |  | |
| Pangushan Town | 0.2233 | Mountain-adjacent |  | |
| Dachang Town | 0.2591 | Mountain-adjacent |  | |
| Yongping Town | 0.2948 | Mountain-adjacent |  | |
| Shixi Town | 0.3108 | Mountain-adjacent |  | |
| 0.32 < mountain coverage rate < 0.48 | Kuimeishan Town | 0.3257 | Mountain-fringed |  |
| Jugezhuang Town | 0.3294 | Mountain-fringed |  | |
| Qibaoshan Township | 0.3445 | Mountain-fringed |  | |
| Fanshan Town (Anhui) | 0.3464 | Mountain-adjacent |  | |
| Wulaga Town | 0.3730 | Mountain-fringed |  | |
| Kouqian Town | 0.3875 | Mountain-encircled |  | |
| Macun Town | 0.4568 | Mountain-fringed |  | |
| Tieshanlong Town | 0.4752 | Mountain-fringed |  | |
| The mountain coverage rate is greater than 0.48. | Huanghua Town | 0.4856 | Mountain-encircled |  |
| Dulong Town | 0.5091 | Mountain-encircled |  | |
| Pingfang Town | 0.5663 | Mountain-encircled |  | |
| Guanzhuang Town | 0.6593 | Mountain-encircled |  | |
| Fanshan Town (Zhejiang) | 0.7038 | Mountain-encircled |  | |
| Shouwangfen Town | 0.7384 | Mountain-encircled |  | |
| Miaogoumen Town | 0.7782 | Mountain-encircled |  | |
| Duanchun Town | 0.8494 | Mountain-encircled |  | |
| Yaogangxian Town | 0.8629 | Mountain-encircled |  | |
| Bajiazi Town | 0.8659 | Mountain-encircled |  |
Note: In the topographic map, the thick red line indicates the length of the overlapping side of the mountain and the minimum circumscribed rectangle or the projection length of the mountain on the minimum circumscribed rectangle.
Table A3.
Research Results on the Relationship between Rivers and Small Industrial and Mining Towns.
Table A3.
Research Results on the Relationship between Rivers and Small Industrial and Mining Towns.
| Scope | Small Towns | Water Coverage Rate | Type | River Map |
|---|---|---|---|---|
| Water coverage rate = 0 | Bajiazi Town | 0 | No river | - |
| Dachang Town | 0 | No river | - | |
| Yaogangxian Town | 0 | No river | - | |
| Tieshanlong Town | 0 | No river | - | |
| Dulong Town | 0 | No river | - | |
| Hexibao Town | 0 | No river | - | |
| Sandaoling Town | 0 | No river | - | |
| Zhurihe Town | 0 | No river | - | |
| Water coverage rate < 0.5 | Niuquan Town | 0.1219 | Simple intersection |  |
| Pingfang Town | 0.2097 | Intersection along the short side direction |  | |
| Shixi Town | 0.2168 | Simple intersection |  | |
| Pangushan Town | 0.2699 | Simple intersection |  | |
| Xiachu Town | 0.3392 | Intersection along the short side direction |  | |
| Macun Town | 0.3491 | Simple intersection |  | |
| Shouwangfen Town | 0.3615 | Intersection along the long side direction |  | |
| Wulaga Town | 0.3650 | Simple intersection |  | |
| Miaogoumen Town | 0.3996 | Intersection along the long side direction |  | |
| Jugezhuang Town | 0.4015 | Simple intersection |  | |
| Huanghua Town | 0.4227 | Simple intersection |  | |
| Qibaoshan Township | 0.4382 | Intersection along the long side direction |  | |
| Yongping Town | 0.4386 | Compound intersection |  | |
| Fanshan Town (Anhui) | 0.4865 | Intersection along the long side direction |  | |
| Duanchun Town | 0.4918 | Intersection along the long side direction |  | |
| The water coverage rate is greater than 0.5. | Guanzhuang Town | 0.5471 | Compound intersection |  |
| Kuimeishan Town | 0.5959 | Compound intersection |  | |
| Kouqian Town | 0.6220 | Compound intersection |  | |
| Longgu Town | 0.7160 | Compound intersection |  | |
| Fanshan Town (Zhejiang) | 0.7621 | Compound intersection |  |
Note: In the river map, the thick red line indicates the length of the shorter side of the two-line segments formed by the intersection of the river and the minimum circumscribed rectangle.
References
- Wu, H.; Hao, Y.; Weng, J.-H. How Does Energy Consumption Affect China’s Urbanization? New Evidence from Dynamic Threshold Panel Models. Energy Policy 2019, 127, 24–38. [Google Scholar] [CrossRef]
- Zhang, Z.; Sun, X.; Yu, X.; Xiao, R. Decoupling Urban Development and Ecological Changes: A Case Study of Shanghai–Hangzhou Bay Urban Agglomeration. J. Urban Plann. Dev. 2024, 150, 5024010. [Google Scholar] [CrossRef]
- Zhang, J.; Fu, M.; Tao, J.; Huang, Y.; Hassani, F.P.; Bai, Z. Response of Ecological Storage and Conservation to Land Use Transformation: A Case Study of a Mining Town in China. Ecol. Model. 2010, 221, 1427–1439. [Google Scholar] [CrossRef]
- Devenin, V.; Bianchi, C. Characterizing a Mining Space: Analysis from Case Studies in Chile and Australia. Resour. Policy 2019, 63, 101402. [Google Scholar] [CrossRef]
- Kitheka, B.M.; Baldwin, E.D.; Powell, R.B. Grey to Green: Tracing the Path to Environmental Transformation and Regeneration of a Major Industrial City. Cities 2021, 108, 102987. [Google Scholar] [CrossRef]
- Zhou, Y.; Liu, Y.; Niu, J. Role of Mineral-Based Industrialization in Promoting Economic Growth: Implications for Achieving Environmental Sustainability and Social Equity. Resour. Policy 2024, 88, 104396. [Google Scholar] [CrossRef]
- Liu, Y.; Zhou, Y. Territory Spatial Planning and National Governance System in China. Land Use Policy 2021, 102, 105288. [Google Scholar] [CrossRef]
- Li, H.; Long, R.; Chen, H. Economic Transition Policies in Chinese Resource-Based Cities: An Overview of Government Efforts. Energy Policy 2013, 55, 251–260. [Google Scholar] [CrossRef]
- Pei, S.; Wang, J.; Wang, W. The Impact of Terrain on the Planar Spatial Morphology of Mountain Settlements Studied Using Fractal Dimensions. Appl. Sci. 2025, 15, 3046. [Google Scholar] [CrossRef]
- Xi, C.; Qian, T.; Chi, Y.; Chen, J.; Wang, J. Relationship between Settlements and Topographical Factors: An Example from Sichuan Province, China. J. Mt. Sci. 2018, 15, 2043–2054. [Google Scholar] [CrossRef]
- Kristensen, L.J.; Taylor, M.P. Unravelling a ‘Miner’s Myth’ That Environmental Contamination in Mining Towns Is Naturally Occurring. Environ. Geochem. Health 2016, 38, 1015–1027. [Google Scholar] [CrossRef] [PubMed]
- Monaci, F.; Ancora, S.; Paoli, L.; Loppi, S.; Franzaring, J. Air Quality in Post-Mining Towns: Tracking Potentially Toxic Elements Using Tree Leaves. Environ. Geochem. Health 2023, 45, 843–859. [Google Scholar] [CrossRef]
- Qi, C.; Xu, M.; Liu, J.; Li, C.; Yang, B.; Jin, Z.; Liang, S.; Guo, B. Source Analysis and Contribution Estimation of Heavy Metal Contamination in Agricultural Soils in an Industrial Town in the Yangtze River Delta, China. Minerals 2024, 14, 279. [Google Scholar] [CrossRef]
- Wang, S.; Cao, Y.; Li, S.; Liu, X.; He, J.; Guan, Y.; Bai, Z. Zonal Gaming and Overall Enhancement of Ecosystem Services: A Case from the Compound Area of Mine-City and Agriculture-Forestry-Grass in Loess Region, China. Ecol. Eng. 2025, 212, 107513. [Google Scholar] [CrossRef]
- Wang, S.; Cao, Y.; Li, S.; Bai, Z. Temporal-Spatial Evolution and Driving Mechanism of Ecosystem Service in Coal-Based Towns in Loess Region, China. Ecol. Indic. 2024, 160, 111805. [Google Scholar] [CrossRef]
- Venkateswarlu, K.; Nirola, R.; Kuppusamy, S.; Thavamani, P.; Naidu, R.; Megharaj, M. Abandoned Metalliferous Mines: Ecological Impacts and Potential Approaches for Reclamation. Rev. Environ. Sci. Bio/Technol. 2016, 15, 327–354. [Google Scholar] [CrossRef]
- Hu, X.-F.; Jiang, Y.; Shu, Y.; Hu, X.; Liu, L.; Luo, F. Effects of Mining Wastewater Discharges on Heavy Metal Pollution and Soil Enzyme Activity of the Paddy Fields. J. Geochem. Explor. 2014, 147, 139–150. [Google Scholar] [CrossRef]
- Yuan, D.; Dong, J. Research on Ecological Restoration and Its Impact on Society in Coal Resource-Based Areas: Lessons from the Ruhr Area in Germany and the Liulin Area in China. Geoforum 2024, 154, 104038. [Google Scholar] [CrossRef]
- Song, Z.; Yang, X.; Zhang, H.; Gao, Z.; Ge, Y. How Does Coal Mining Affect Land Use in Townships? A Perspective of Land Use Transition. J. Clean. Prod. 2024, 475, 143662. [Google Scholar] [CrossRef]
- Sonter, L.J.; Moran, C.J.; Barrett, D.J.; Soares-Filho, B.S. Processes of Land Use Change in Mining Regions. J. Clean. Prod. 2014, 84, 494–501. [Google Scholar] [CrossRef]
- Mao, Z. Planning Strategies for Mountain Small Towns with Industrial and Mining Characteristics under the Concept of Ecological Protection: A Case Study of Huanghua Town, Yichang City. Planners 2019, 35, 10–13+22. (In Chinese) [Google Scholar]
- Yu, H.; Luo, C.; Ni, J. Identifying Land Reuse Suitability and Transformation Strategies towards Green Development in a Post-Mining Area: A Case of Qijiang, Chongqing, China. Ecol. Indic. 2024, 159, 111646. [Google Scholar] [CrossRef]
- Geng, H.; Zhang, K.; Zhang, H. Research on Sustainable Development of Resource-Based Small Industrial and Mining Cities—A Case Study of Yangquanqu Town, Xiaoyi, Shanxi Province, China. Procedia Eng. 2011, 21, 633–640. [Google Scholar] [CrossRef]
- Sun, X.; Shao, H.; Liang, S.; Zhou, Y.; Dai, X.; Liu, M.; Tao, R.; Guo, Z.; Xin, Q. Tracking Sustainable Development in Mining Towns: A Novel Framework Integrating Socioeconomic and Eco-Environmental Perspectives through Coupling Coordination Degree. Environ. Impact Assess. Rev. 2024, 109, 107641. [Google Scholar] [CrossRef]
- Marot, N.; Harfst, J. Post-Mining Potentials and Redevelopment of Former Mining Regions in Central Europe—Case Studies from Germany and Slovenia. Acta Geogr. Slov. 2012, 52, 99–110. [Google Scholar] [CrossRef]
- Marot, N.; Harfst, J. Post-Mining Landscapes and Their Endogenous Development Potential for Small- and Medium-Sized Towns: Examples from Central Europe. Extr. Ind. Soc. 2021, 8, 168–175. [Google Scholar] [CrossRef]
- Cao, K.; Liu, Y.; Cao, Y.; Wang, J.; Tian, Y. Construction and Characteristic Analysis of Landscape Gene Maps of Traditional Villages Along Ancient Qin-Shu Roads, Western China. Herit. Sci. 2024, 12, 37. [Google Scholar] [CrossRef]
- Chen, D.; Yang, J.; Shi, Y. Construction of Spatial Pedigree of Rural Settlements Based on Space Gene. Chin. Landsc. Archit. 2022, 38, 115–120. (In Chinese) [Google Scholar] [CrossRef]
- Wu, J.; Li, Z.; Zhong, Q.; Xie, L. Spatial Morphological Characteristics of Traditional Settlements: A Comparative Study Along the Miaojiang Border Wall and Miaojiang Corridor in Hunan, China. Ain Shams Eng. J. 2024, 15, 103071. [Google Scholar] [CrossRef]
- Zhang, X.; Zhou, L.; Zhou, T. Quantitative Analysis of Spatial Gene in Traditional Villages: A Case Study of Korean Traditional Villages in Northeast China. J. Asian Archit. Build. Eng. 2025, 24, 2577–2588. [Google Scholar] [CrossRef]
- Huang, Y.; Ye, Z.; Zhang, Q.; Chen, Y.; Wu, W. Space Gene Quantification and Mapping of Traditional Settlements in Jiangnan Water Town: Evidence from Yubei Village in the Nanxi River Basin. Buildings 2025, 15, 2571. [Google Scholar] [CrossRef]
- Sun, J.; Shao, L. Interpretation of Historic Urban Landscape Genes: A Case Study of Harbin, China. Land 2024, 13, 1988. [Google Scholar] [CrossRef]
- Zhao, W.; Liao, X.; Wang, H. Analysis of Mountain Morphological Genes: Cognition and Practice of Spatial Map Method of Historical Town Protection. Planners 2021, 37, 50–57. (In Chinese) [Google Scholar]
- Wan, J.; Guo, X.; Wen, Z.; Zhang, X. The Construction and Analysis of a Spatial Gene Map of Marginal Villages in Southern Sichuan. Buildings 2025, 15, 2628. [Google Scholar] [CrossRef]
- Qi, K. Urban Architecture; Southeast University Press: Nanjing, China, 2001. (In Chinese) [Google Scholar]
- Du, Y.; Cardoso, R.V.; Rocco, R. The Challenges of High-Quality Development in Chinese Secondary Cities: A Typological Exploration. Sustain. Cities Soc. 2024, 103, 105266. [Google Scholar] [CrossRef]
- AlSadaty, A. A Typological Approach to Maintain Character in Historic Urban Areas. Urban Des. Int. 2022, 27, 198–210. [Google Scholar] [CrossRef]
- Chen, F.; Romice, O. Preserving the Cultural Identity of Chinese Cities in Urban Design Through a Typomorphological Approach. Urban Des. Int. 2009, 14, 36–54. [Google Scholar] [CrossRef]
- Yamu, C.; Van Nes, A.; Garau, C. Bill Hillier’s Legacy: Space Syntax—A Synopsis of Basic Concepts, Measures, and Empirical Application. Sustainability 2021, 13, 3394. [Google Scholar] [CrossRef]
- Luo, W.; Gu, H.; Tao, W. Research Progress of Space Syntax in Geography at Home and Abroad. World Geogr. Res. 2024, 34, 182–196. (In Chinese) [Google Scholar]
- Meng, D.; Zhang, J. The Evolution of Space Syntax over the Past Two Decades: Evidence from China. J. Asian Archit. Build. Eng. 2025, 24, 4606–4624. [Google Scholar] [CrossRef]
- Mohamed, A.A.; Van Der Laag Yamu, C. Space Syntax Has Come of Age: A Bibliometric Review from 1976 to 2023. J. Plan. Lit. 2024, 39, 203–217. [Google Scholar] [CrossRef]
- Xu, Y.; Rollo, J.; Esteban, Y. Evaluating Experiential Qualities of Historical Streets in Nanxun Canal Town through a Space Syntax Approach. Buildings 2021, 11, 544. [Google Scholar] [CrossRef]
- Atakara, C.; Allahmoradi, M. Investigating the Urban Spatial Growth by Using Space Syntax and GIS—A Case Study of Famagusta City. ISPRS Int. J. Geo-Inf. 2021, 10, 638. [Google Scholar] [CrossRef]
- Zhang, Z.; Yang, Q.; Wang, L.; Su, K. Exploring the Multi-scale Spatial Evolution of Tourist Towns in Mountainous Areas by Spatial Syntax Method: A Case Study of Zhenyuan Ancient Town, China. J. Mt. Sci. 2019, 37, 551–563. (In Chinese) [Google Scholar] [CrossRef]
- Peng, P.; Fu, Y.; Zhou, X.; Wu, S.; Zhao, J.; Zhang, Y. Quantitative Research on the Degree of Disorder of Traditional Settlements: A Case Study of Liangjia Village, Jingxing, Hebei Province. Herit. Sci. 2024, 12, 109. [Google Scholar] [CrossRef]
- Chen, X.; Liu, X. Quantitative Analysis of Urban Spatial Morphology Based on GIS Regionalization and Spatial Syntax. J. Indian Soc. Remote Sens. 2023, 51, 1855–1864. [Google Scholar] [CrossRef]
- Li, L. The Compact Strategy of the EU Countries: Examples from the UK and Netherlands. Int. Urban Plan. 2008, 23, 106–116. (In Chinese) [Google Scholar]
- Breheny, M. Urban Compaction: Feasible and Acceptable? Cities 1997, 14, 209–217. [Google Scholar] [CrossRef]
- Lan, T.; Tang, L.; Xu, Z.; Jia, Y. Knowledge Graph Analysis of Urban Spatial Compactness Research Based on Bibliometrics. Acta Ecol. Sin. 2022, 42, 1645–1654. (In Chinese) [Google Scholar]
- Liu, J.; Song, Q.; Wang, X. Spatial Morphology Evolution of Rural Settlements in the Lower Yellow River Plain: The Case of Menggang Town in Changyuan City, China. Land 2023, 12, 1122. [Google Scholar] [CrossRef]
- Gao, R.; Guan, Y.; He, X.; Wang, J.; Fan, D.; Ma, Y.; Luo, F.; Liu, S. Multi-Factor Driving Force Analysis of Soil Salinization in Desert–Oasis Regions Using Satellite Data. Water 2026, 18, 133. [Google Scholar] [CrossRef]
- Xuan, D.; Jiang, X.; Fang, Y. Can Globalization and the Green Economy Hedge Natural Resources? Functions of Population Growth and Financial Development in BRICS Countries. Resour. Policy 2023, 82, 103414. [Google Scholar] [CrossRef]
- Zhang, H.; Sun, X.; Dong, K.; Sui, L.; Wang, M.; Hong, Q. Green Innovation in Regional Logistics: Level Evaluation and Spatial Analysis. Int. J. Environ. Res. Public Health 2022, 20, 735. [Google Scholar] [CrossRef] [PubMed]
- Gao, W.; Jia, M.; Zhao, M.; Gao, Y.; Meng, H. Review of Progress and Quantitative Measurement Methods of Research on Street Space. Urban Plan. 2022, 46, 106–114. (In Chinese) [Google Scholar]
- Lin, Z.; Liang, Y.; Liu, X. Study on Spatial Form Evolution of Traditional Villages in Jiuguan under the Influence of Historic Transportation Network. Herit. Sci. 2024, 12, 29. [Google Scholar] [CrossRef]
- Cheng, J.; Yan, Y.; Hu, X.; Wei, Q.; Li, H. Research on the Construction of Spatial Gene Map of Settlement Pattern of Traditional Villages in Anhui Province. Planners 2022, 38, 65–71. (In Chinese) [Google Scholar]
- Wang, Z.; Liu, L. A Study of the Spatial Morphological Changes of City and Unprotected Historic Block from the Perspective of Spatial Syntax—A Case Study of Wenfeng Ancient Street in Hechuan. J. Southwest Univ. (Nat. Sci.) 2020, 42, 142–150. (In Chinese) [Google Scholar] [CrossRef]
- Yang, X. Advances in Quantitative Research Methodologies for the Spatial Layout of Rural Settlement in Recent 20 Years. Int. Urban Plan. 2020, 35, 72–80. (In Chinese) [Google Scholar] [CrossRef]
- Zhu, Q.; Liu, S. Spatial Morphological Characteristics and Evolution of Traditional Villages in the Mountainous Area of Southwest Zhejiang. ISPRS Int. J. Geo-Inf. 2023, 12, 317. [Google Scholar] [CrossRef]
- Li, X.; Wang, X. Spatial morphological character analysis and optimization of county-level administrative region in Henan Province. Eng. Surv. Mapp. 2018, 27, 69–76. (In Chinese) [Google Scholar] [CrossRef]
- Niță, A.; Drăguleasa, I.-A. Choreme-Based Spatial Analysis and Tourism Assessment in the Oltenia de Sub Munte Geopark, Romania. ISPRS Int. J. Geo-Inf. 2025, 14, 444. [Google Scholar] [CrossRef]
- Măceșeanu, D.M.; Crețan, R.; Drăguleasa, I.-A.; Niță, A.; Făgăraș, M. The Use of GIS Techniques for Land Use in a South Carpathian River Basin—Case Study: Pesceana River Basin, Romania. Sustainability 2026, 18, 1134. [Google Scholar] [CrossRef]


Disclaimer/Publisher’s Note: The statements, opinions and data contained in all publications are solely those of the individual author(s) and contributor(s) and not of MDPI and/or the editor(s). MDPI and/or the editor(s) disclaim responsibility for any injury to people or property resulting from any ideas, methods, instructions or products referred to in the content. |
© 2026 by the authors. Licensee MDPI, Basel, Switzerland. This article is an open access article distributed under the terms and conditions of the Creative Commons Attribution (CC BY) license.