Article

Supply-Demand Mismatch of Urban Commercial Land and Its Impact Mechanism in Gansu Province Based on an Explainable Machine Learning Model
1
Gansu Kaiyuan Survey, Planning, Design and Consulting Co., Ltd., Lanzhou 730000, China
2
Spatial Planning Center, Yangtze Delta Region Institute of Tsinghua University (Zhejiang), Jiaxing 314006, China
3
School of Natural Resources and Surveying, Nanning Normal University, Nanning 530001, China
*
Authors to whom correspondence should be addressed.
Land 2026, 15(2), 351; https://doi.org/10.3390/land15020351
Submission received: 19 January 2026 / Revised: 13 February 2026 / Accepted: 19 February 2026 / Published: 21 February 2026

Abstract

As the global urban economy accelerates its transition from an “industrial economy” to a “service economy”, consumption has replaced investment as the core engine driving economic development. Commercial land serves as the physical foundation for consumer activities and plays a vital role in boosting urban economic vitality, enhancing residents’ quality of life, and promoting regional sustainable development when appropriately allocated. This study constructs a technical framework for analyzing the mismatch between commercial land supply and residential consumption demand, along with its impact mechanism, based on the integrated application of the multidisciplinary quantitative models such as the Boston Consulting Group Matrix (BCGM), Exploratory Spatial Data Analysis (ESDA), Decoupling Model (DM), and Explainable Machine Learning (EML). It conducts empirical research across 87 county-level cities in Gansu Province. The findings reveal that commercial land supply and consumption demand exhibit dynamic diversification, with prominent regional disparities and spatial autocorrelation characteristics. Commercial land in Gansu faces a severe mismatch, with demand exceeding supply and supply exceeding demand occurring simultaneously, and the former holding absolute dominance. The formation of mismatched relationships is influenced by many factors, exhibiting significant path nonlinearity, spatial non-stationarity, and relational interactivity. It is suggested that strategies of planning zoning and regional coordination be developed for mismatch governance, and differentiated management measures be implemented based on local conditions. This will provide a scientific basis for commercial territorial space planning and consumption policy design.

1. Introduction

1.1. Research Background

As industrialization and urbanization progress into the mid-to-late stages, the global urban economy is rapidly transitioning from an “industrial economy” to a “service economy”, with the service sector dominating and consumption replacing investment as the primary engine of economic growth [1,2]. Urban functions are evolving from production hubs to centers of consumption and daily life, making the shaping and optimization of consumption spaces a key dimension of a city’s competitiveness [3,4]. As the core physical carrier supporting diverse consumer services including retail, dining, culture, leisure, and experiential offerings, commercial land fundamentally determines the accessibility, richness, and quality of consumer services through its supply scale, spatial layout, business format structure, and utilization efficiency. This directly impacts the vitality, potential realization, and upgrading process of the consumer market.
Numerous scholarly studies have found that the adjustment of urban land supply is relatively slow, while changes in economic development demand are relatively rapid, leading to widespread mismatch (surplus or shortage) between the two [5]. In practical development, the” systematic mismatch” between commercial land supply and consumer demand is also a widespread phenomenon [6]. Commercial land expansion presents a dual challenge: in some urban areas, excessive development has led to “commercial hollowing-out” and “weak consumption”, creating an inefficient “space without consumption” scenario; meanwhile, in many small towns, inadequate supply restricts access to high-quality commercial spaces and services, resulting in a “demand without carriers” dilemma that hampers balanced consumption growth. This structural contradiction leads to wasteful land use and inefficient investment, fundamentally dampening residents’ willingness to upgrade consumption, thereby hindering the generation of urban vitality and the establishment of a virtuous economic cycle. The Ministry of Commerce and four other departments jointly issued the Action Plan for Enhancing Urban Commercial Quality, requiring the optimization of commercial land layouts and the construction of a well-rounded urban commercial system to provide spatial support for boosting consumption. Against this backdrop, studying the relationship between urban commercial land use and boosting consumption to reveal their interaction mechanisms will be of significant theoretical importance and policy value for optimizing commercial land allocation and unleashing consumption potential [7].
The innovation of this study at the scientific level primarily lies in constructing a dynamic adaptation analysis framework between commercial land supply and residential consumption demand while revealing the nonlinear driving mechanisms behind their mismatch. Most studies available focus on exploring the correlation between commercial land and industrial added value, often approaching land use and supply issues solely from an economic perspective. This study transcends such limitations by redefining commercial land as ecological infrastructure supporting residential consumption, thereby breaking free from the traditional “land finance”-oriented mindset and expanding the research perspective from a singular economic dimension to an integrated economic–social system. It is a shift aligning with the dual attributes of consumption as both an economic development and social livelihood indicator while providing a novel scientific basis for the coordinated formulation of commercial spatial planning and consumption policies.

1.2. The Literature Review

As a crucial component of urban spatial structure, commercial land has long been a central research topic in economic geography and urban planning, with its theoretical origins traceable to Christaller’s Central Place Theory [8]. The theory systematically elucidates the market principles governing the scale, functions, and spatial distribution of commercial facilities, laying the foundation for commercial spatial analysis. Subsequent studies have built a multidimensional research system that covers commercial land demand, development, pricing, spatial analysis, and environmental impact through continuous expansion based on this framework [9]. With the increasing emphasis on “enhancing quality and efficiency” in national territorial spatial planning, commercial land—as the key carrier connecting land resource allocation with the realization of urban functions—holds a consistently significant position in research. When rationally allocated, it will directly promote urban economic vitality, residents’ quality of life, and regional sustainable development.
Research topics indicate that existing studies primarily focus on quantitative modeling of commercial land demand, development type selection, spatiotemporal evolution characteristics, and their influencing factors. Ustaoglu [10] constructed static and dynamic models using French regional data to quantify commercial land demand, identifying location characteristics, infrastructure, and socioeconomic factors as key driving variables. Silva [11] proposed an estimation method based on “land use intensity”, offering a novel approach for predicting commercial land demand at a continental scale. Sun [12] found that the growth of commercial land in Beijing was closely correlated with the number of enterprises, surrounding construction land, and improvements in accessibility. Zhao [13] discovered that urban commercial land in China shows a “J”-shaped growth pattern, with pronounced spatial agglomeration characteristics. Wen discovered a positive correlation between the number of nodes in urban rail transit networks, their clustering coefficient, and commercial land prices. Kim [14] further demonstrated that newly constructed subway lines have a greater impact on commercial land prices than residential land, with more pronounced geographical effects. Wang [15] demonstrated that the operation of high-speed rail significantly affects the transaction volume of commercial land, and the frequency of train operation has a prominent effect on transaction prices. Kosow [16] proposed that commercial land management in Germany requires a policy mix to balance the three major objectives of cooperation, land control, and economic development. Zhang [17] found that the decoupling relationship between the expansion of urban service industry land and economic growth in China is jointly influenced by factors such as permanent population and value-added of the secondary industry.
In addition, some scholars have examined the factors influencing commercial land prices and their fluctuations, including location, transportation, policy, and environment. Byun [18] found that commercial land prices exhibit a nonlinear relationship with walkability, which is moderated by land use intensity and zoning alignment. Lee [19] confirmed that the operation of the Daejeon subway in South Korea significantly enhances the value of surrounding commercial land, with this effect diminishing markedly as distance increases. Nichols [20] found that fluctuations in commercial land prices far exceeded those of residential and commercial property prices, while Cheng [21] demonstrated the critical role of land location and government policies on commercial land leasing prices. In addition, the externalities of commercial land development on the surrounding environment—particularly neighborhood safety, traffic flow, and property values—have also attracted attention from some scholars. For instance, Sohn [22] found that grocery stores, restaurants, and offices in Seattle contribute to enhanced neighborhood safety, while higher residential burglary rates in areas with dense shopping centers confirm the heterogeneous effects of commercial land use mixes. Izanloo [23] demonstrated a significant correlation between commercial land uses and traffic flow in Bojanoord, with route syntax playing a prominent role in influencing trip frequency. Yang [24] found an inverted-U relationship between commercial land concentration and residential property values in Seoul, where excessive clustering led to negative impacts from noise and congestion. Langer [25] confirmed that the expansion of commercial land in Bavaria is boosting urban tax revenues, but significant disparities persist between urban and rural areas.
Existing studies are primarily based on regression analysis, spatial analysis, cellular automata (CA), and data envelopment analysis (DEA). Regression analysis is widely used, as seen in the study by Ustaoglu [9] who used static and dynamic regression models to quantify land use demand. Gingerich [26] employed multinomial and nested logit models to analyze commercial land development type selection, revealing linear relationships and main effects among variables. In recent years, spatial analysis methods have begun to play an increasingly significant role. Wang [27] identified dynamic patterns in Beijing’s commercial land use based on K-means clustering of geotagged social media data and POIs. Garang [28] analyzed the spatiotemporal non-stationarity of commercial land prices using geographically weighted regression and time-weighted regression models. Additionally, Colaço [29] employed the CA model to simulate commercial land expansion, Wen [30] utilized the method of complex networks to examine the impact of urban rail transit networks on commercial land value, and Zhang [31] adopted the DEA model to evaluate commercial land efficiency. These novel methodologies introduced have provided effective tools for the dynamic evolution and benefit optimization of commercial land.

1.3. Research Gap

The existing literature has made substantial advances in key areas including demand forecasting, supply mechanisms, spatial identification, price impacts, and environmental effects of commercial land, offering crucial foundations for urban commercial land planning and the design of commercial space governance policies. However, current studies rarely systematically explore the dynamic adaptation relationship between commercial land and consumption development, particularly lacking quantitative identification and driving analysis of their “mismatch” mechanisms. There remains room for improvement in future research:
First, there is a disconnect between the “production side” and the “consumption side” in existing studies, leaving the linkages between commercial land use and consumption stimulation as an academic “black box” that remains to be unraveled. Most studies either treat commercial land as a production factor to explore its economic output efficiency or regard it as a built environment element to analyze its socio-physical impacts. For example, Lu’s empirical research on Beijing suggests that the overall change in urban density during the process of center to periphery is still a physical projection of economic development [32]. Although some findings have touched upon the connection between commercial land supply and economic demand, most equate “demand” with the productive needs of enterprises or developers rather than the service-oriented demands of end consumers [33,34].
Second, traditional research methods neglect the analysis of nonlinear mechanisms, interactive relationships, and spatial effects among factors, thereby limiting the practicality and precision of translating research findings into policy design. Commercial land mismatch results from the combined effects of multiple factors (economic, social, institutional, spatial), where the roles and relationships of different factors may involve complex nonlinear mechanisms (e.g., threshold effects) and interactive effects (e.g., synergistic or antagonistic effects), exhibiting spatial nonstationarity and variability. However, existing studies primarily rely on linear models and traditional statistical frameworks, and most fail to incorporate spatial effects, particularly spatial correlation, into their analytical frameworks. This omission may introduce biases between analytical outcomes and real-world conditions, hindering the precise identification of the driving mechanisms behind the mismatch between commercial land use and consumption growth. Consequently, this limitation restricts the direct applicability of such research in national spatial planning and industrial development policy formulation.

2. Materials and Methods

2.1. Study Area

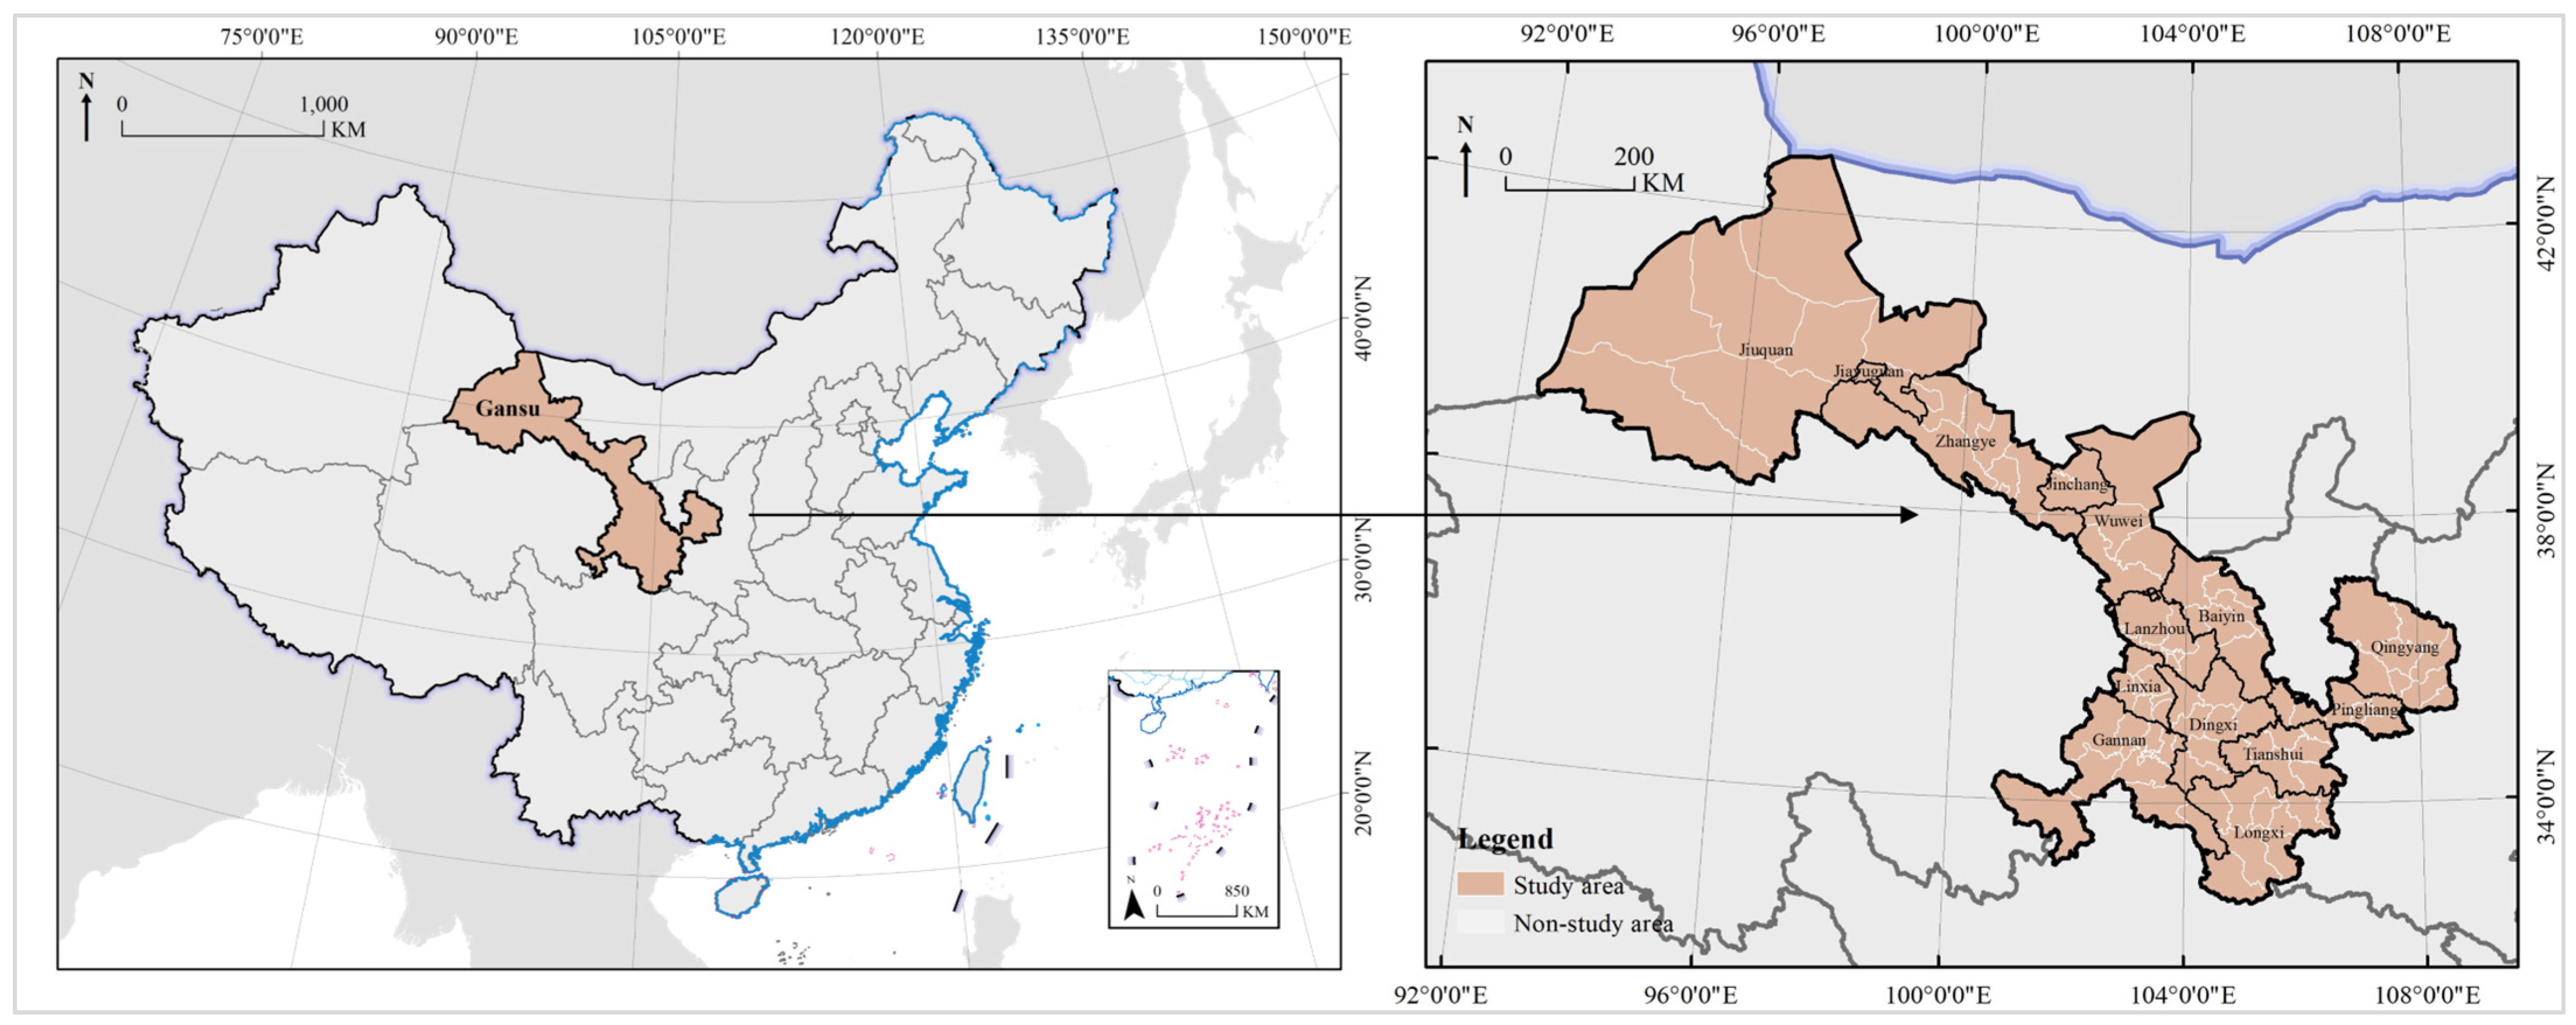
The research area covers the entire region of Gansu Province, including 64 counties, 5 county-level cities, 17 municipal districts, and 1 city without districts (Jiayuguan). It comprises a total of 87 county-level administrative divisions, and as this study is focused on commercial land in counties, they are collectively referred to as counties in the following text (Figure 1). Gansu Province is located in the inland northwest, with a significant gap in socio-economic development compared to the eastern coastal regions. Compared to the developed regions in the east, Gansu faces more pronounced challenges in the allocation of commercial land at the county level. The mismatch between supply and demand—characterized by both excessive expansion and inefficient underutilization of commercial land in counties—is a typical feature of underdeveloped regions in the west. In recent years, Gansu Province has rolled out a series of policies to boost commerce and consumption, which provides a distinct policy backdrop and practical concerns for this study, highlighting its real-world relevance. For instance, the Implementation Opinions of the General Office of the Gansu Provincial People’s Government on Accelerating Circulation Development and Promoting Commercial Consumption clearly proposes to “optimize the layout of commercial land, reasonably guarantee the demand for convenient commercial facilities, support the transformation and upgrading of existing commercial facilities, and improve the urban–rural commercial network”. And the Implementation Plan for the Action Plan to Improve the Modern Commercial Circulation System and Promote High-Quality Development of Wholesale and Retail Industries in Gansu Province further emphasizes the need to “revitalize existing commercial land resources, drive innovation in commercial formats and integration with consumption scenarios, and enhance the commercial service capabilities of counties”. The core concepts and specific measures of these policies align closely with the focus of this study on the match between commercial land allocation and consumption stimulation.

2.2. Research Methods

2.2.1. Research Question and Theoretical Framework

China’s “15th Five-Year Plan” mandates local governments to implement an integrated land supply model that balances stock and incremental resources, enforcing differentiated and refined spatial zoning and categorical use controls across territorial spaces. This study focuses on Gansu Province, using official land survey and statistical data to meet practical needs and fill research gaps. It uses spatial econometric models (e.g., BCGM, ESDA) and explainable machine learning to quantify the spatiotemporal characteristics, mismatches, and driving mechanisms of commercial land supply and social consumer demand in county-level areas. The aim is to provide scientific evidence for optimizing commercial space allocation and precisely stimulating consumption. This study addresses the following issues and makes the following academic contributions:
(1)
What are the regular patterns in the spatiotemporal evolution of commercial land supply and residential consumption demand? This study innovatively incorporates BCGM and ESDA to analyze their spatiotemporal dynamics across both temporal and spatial dimensions. It comprehensively maps the baseline of commercial land supply and residential consumption demand, laying the foundation for establishing a new management model that integrates both existing and incremental commercial land resources.
(2)
What is the dynamic relationship between commercial land supply and residential consumption demand? This paper introduces a decoupling model to establish an integrated analytical framework for both, precisely diagnosing mismatch types across different county-level cities and providing a basis for differentiated planning of commercial territorial spatial zoning and classification.
(3)
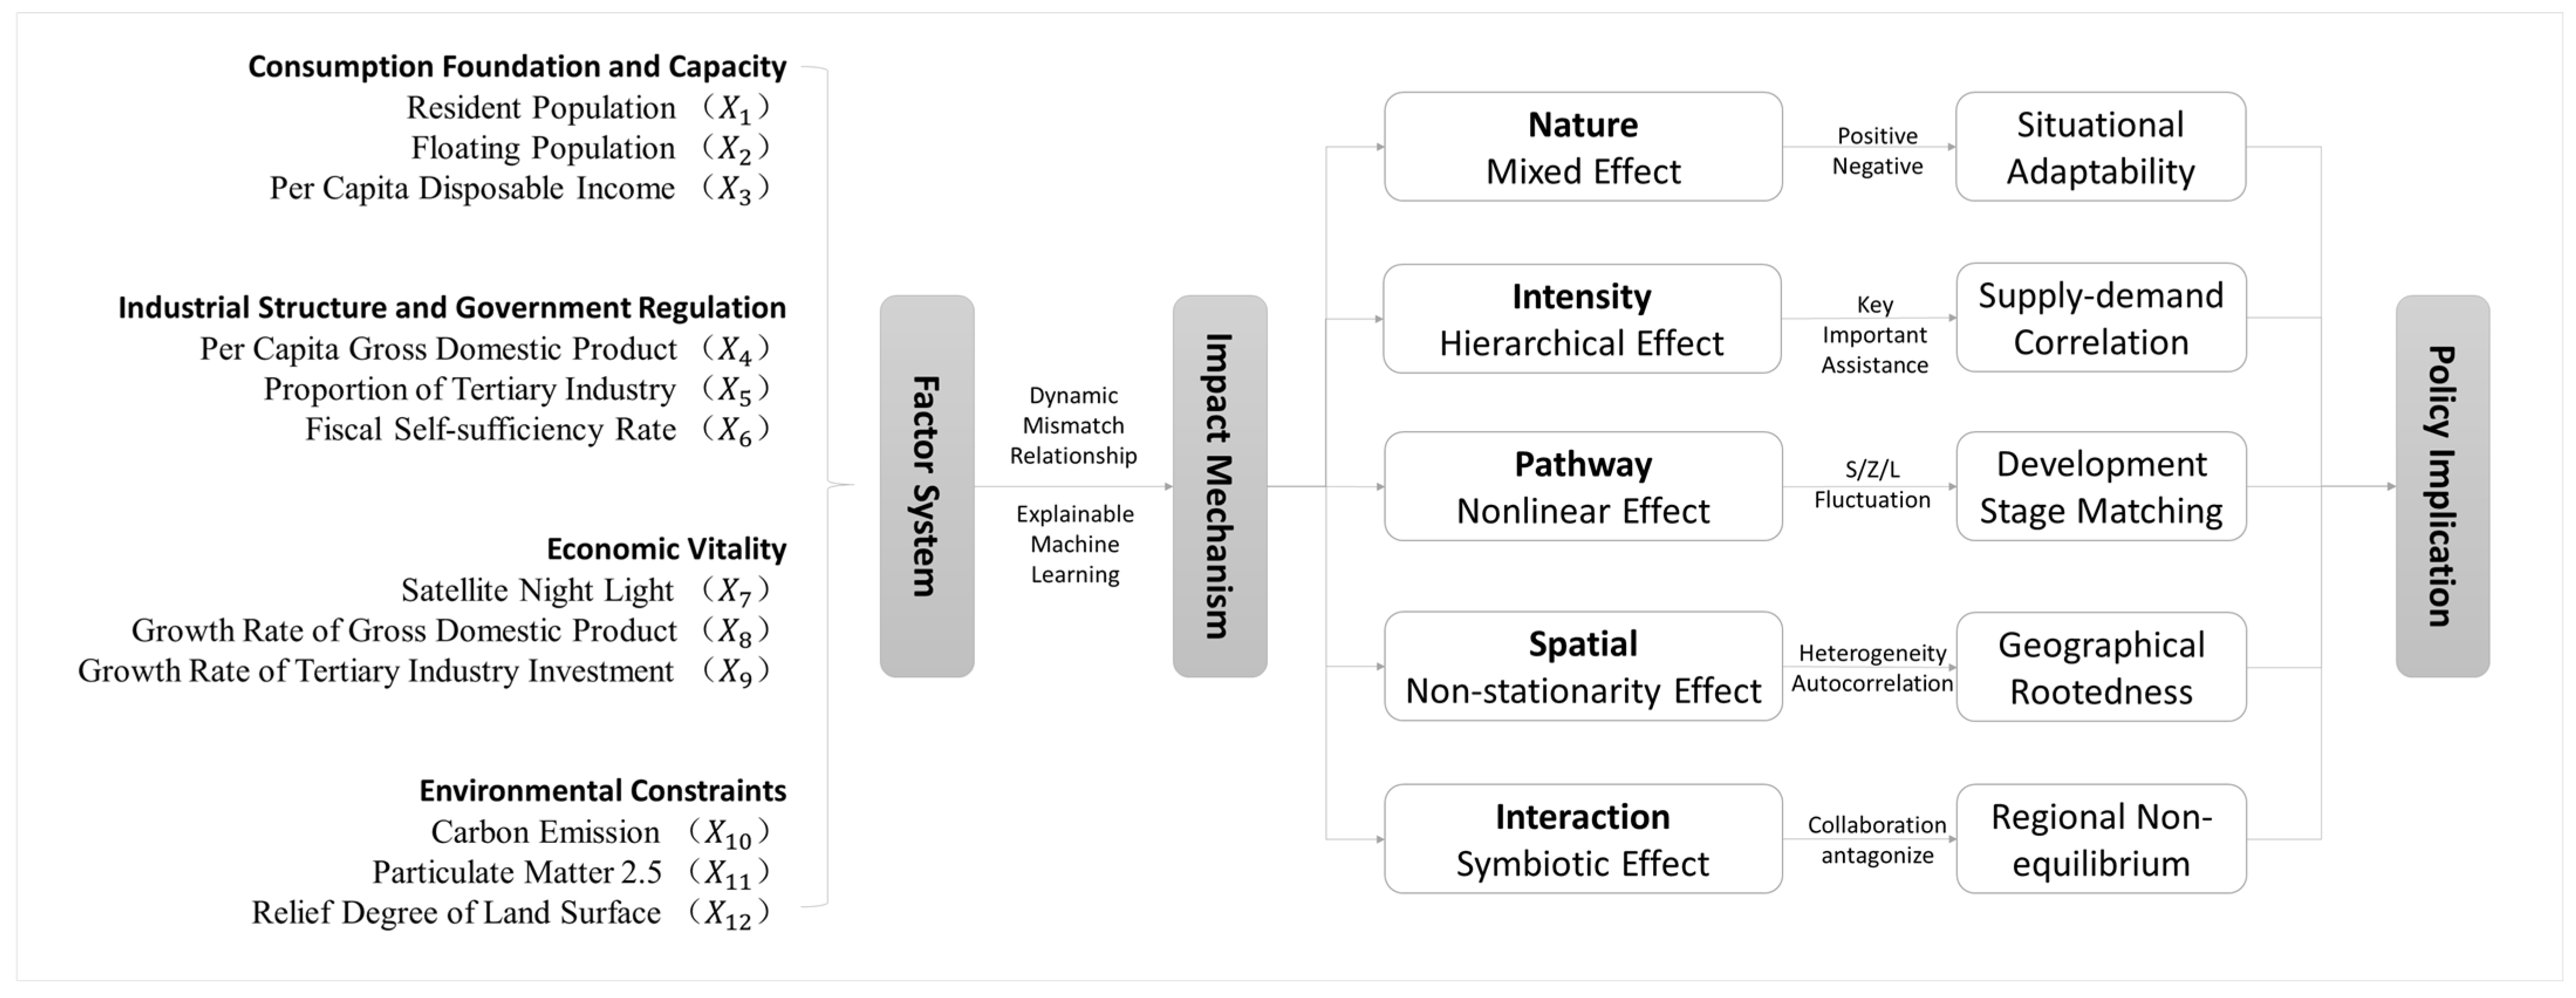
What are the driving mechanisms behind the mismatch between commercial land supply and residential consumption demand? This study constructs a factor system encompassing multiple dimensions, including population consumption capacity, industrial structure and government regulation, economic vitality, and environmental constraints. By applying explainable machine learning nonlinear algorithms, it precisely measures the nature and intensity of multi-factor influences, captures spatial effects and interactive relationships among factors, and enables decision-makers to better understand the underlying logic behind the mismatch between commercial land supply and residential consumption demand.
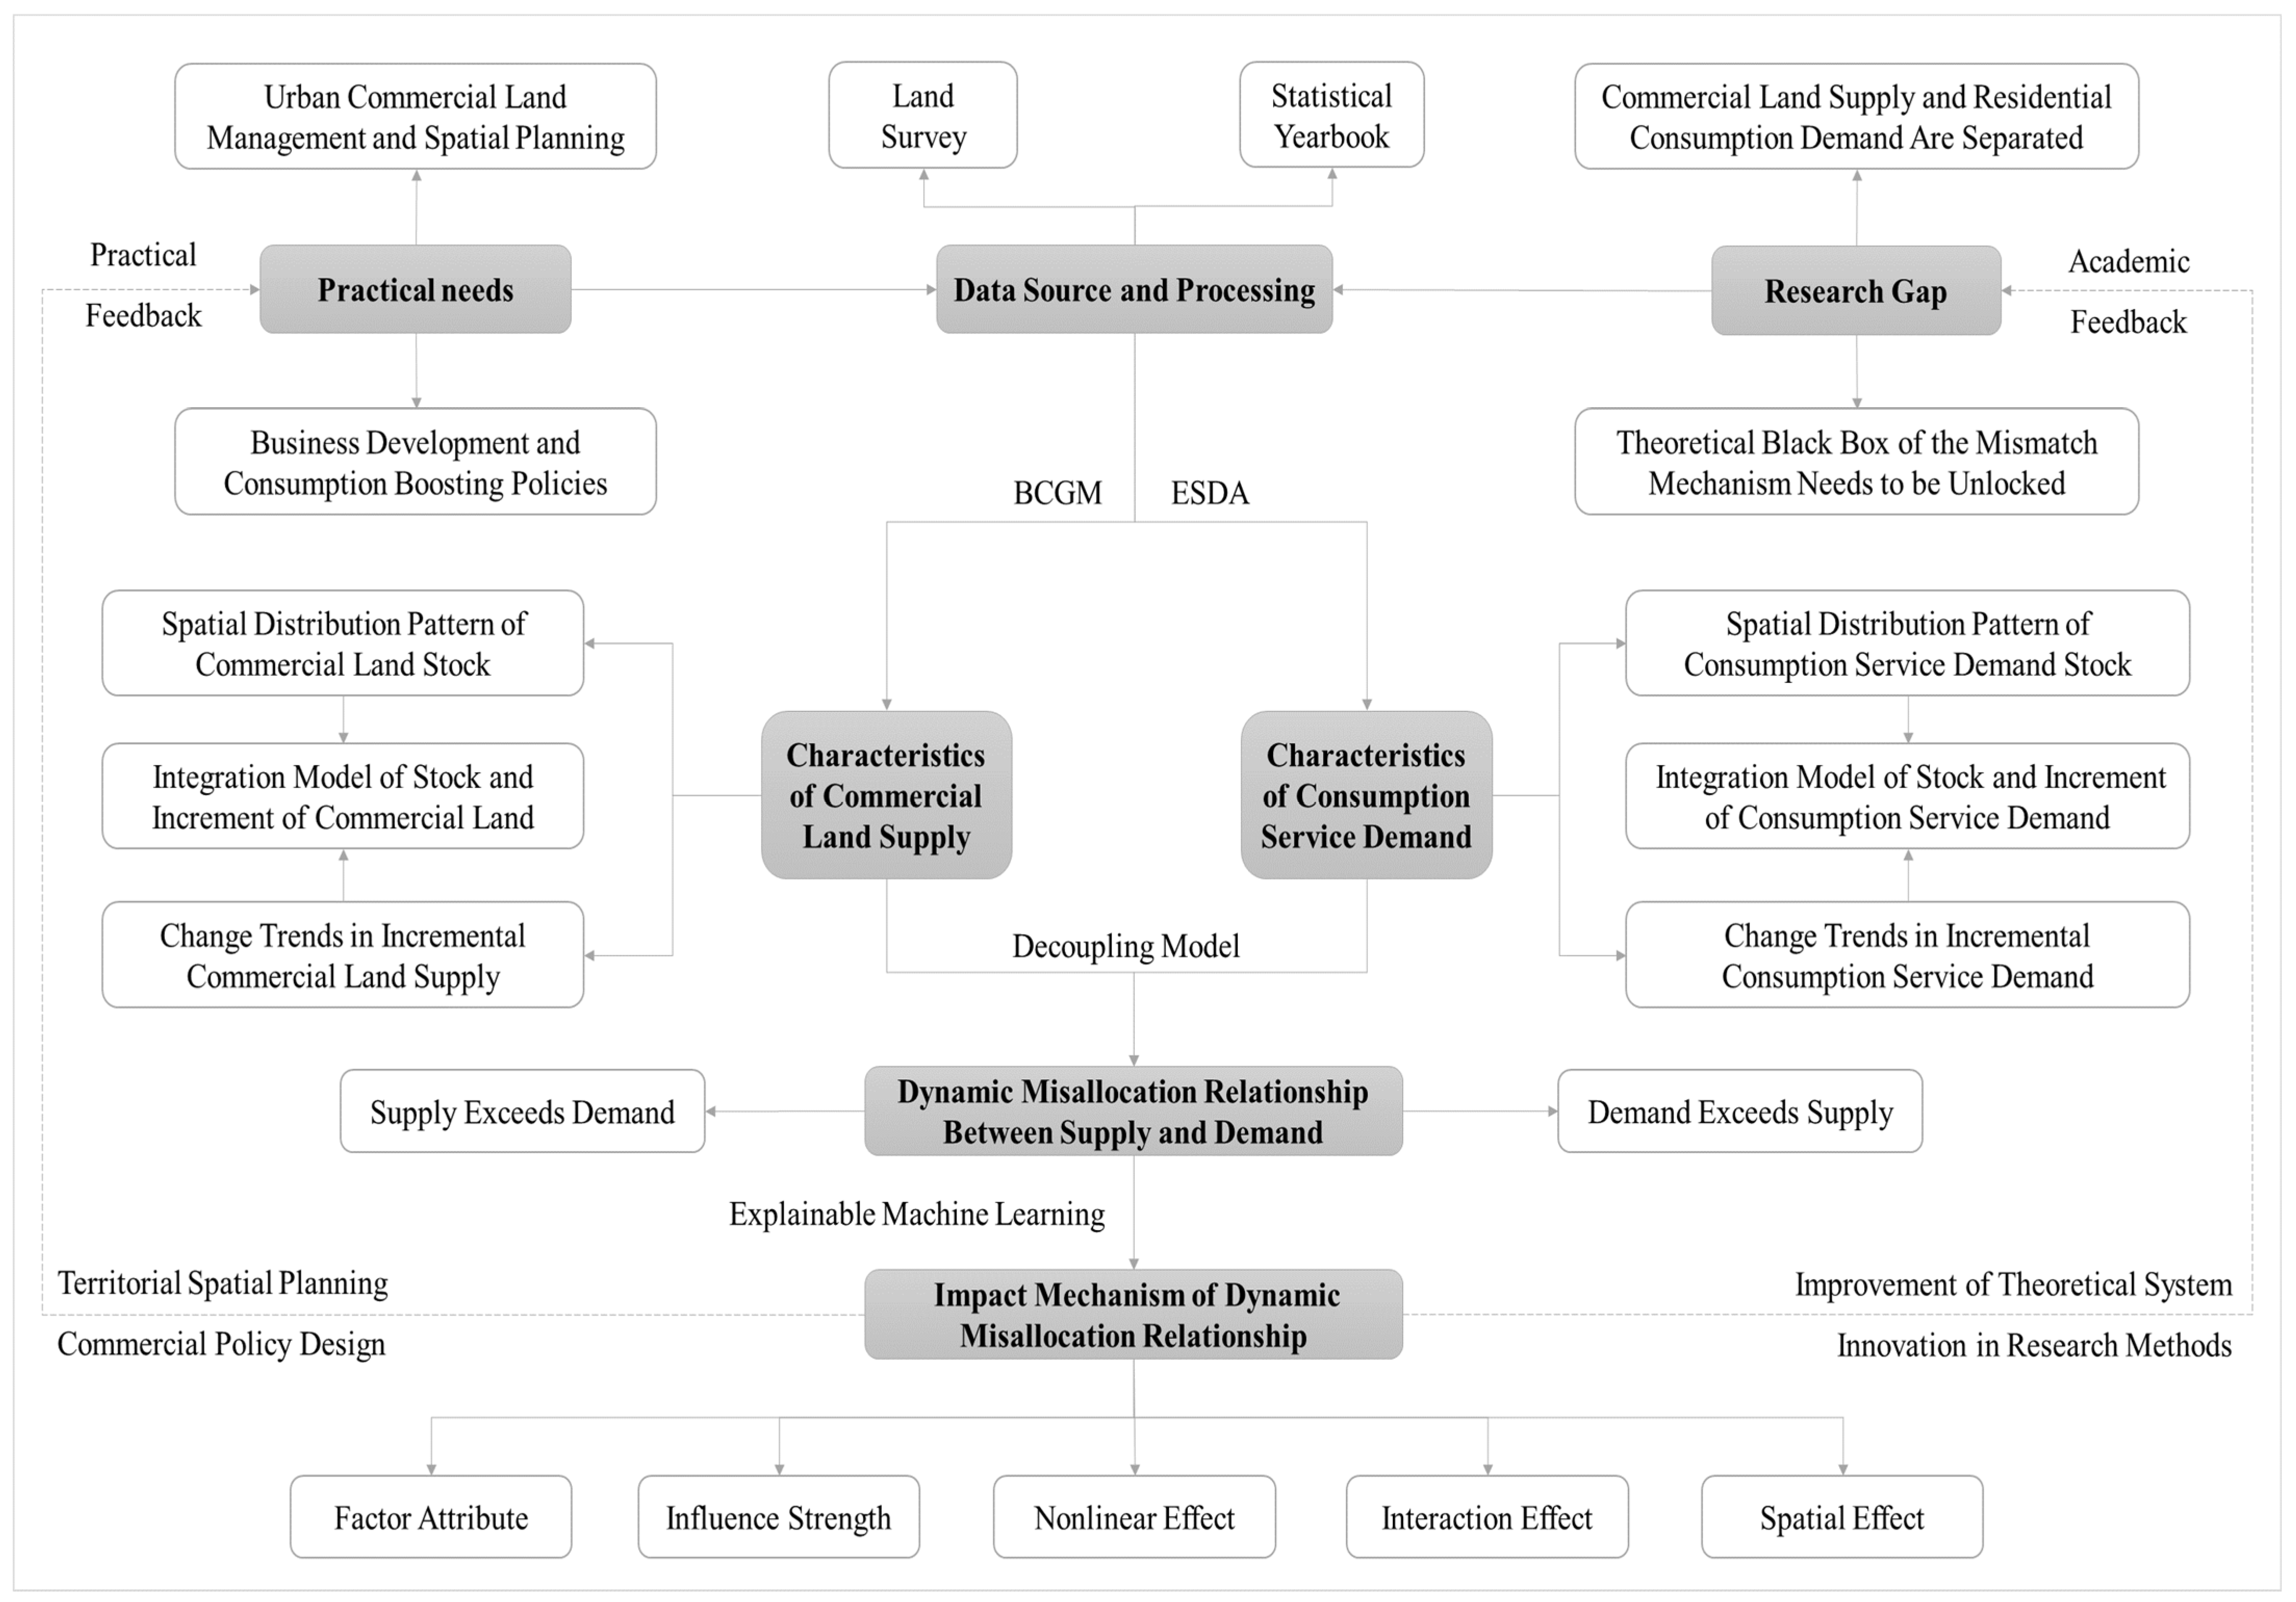
The BCGM, ESDA, decoupling model, and explainable machine learning nonlinear algorithms selected for this study progressively address the core research questions while complementing each other. The model choices align with research needs, demonstrating both scientific rigor and innovation. The BCGM and ESDA models primarily analyze the spatiotemporal evolution characteristics of commercial land supply and residential consumption demand. By integrating dual temporal-spatial dimensions, they overcome the limitations of single-dimensional analysis, accurately capturing their spatiotemporal dynamics to clarify current conditions for subsequent research. The decoupling model builds upon the preceding spatiotemporal analysis, focusing on the dynamic relationship between commercial land supply and consumer service demand. It precisely diagnoses mismatched types across different counties, addressing the shortcoming of treating the two factors separately in spatiotemporal feature analysis, and provides a basis for evaluating the rationality of land resource allocation efficiency. Explainable machine learning focuses on elucidating the driving mechanisms behind mismatches, precisely measuring the nature, intensity, pathways, interactions, and spatial effects of multiple factors, thereby enhancing the exploration of mismatch causes. To address the three scientific questions, different econometric models perform distinct yet complementary roles, forming a closed-loop analytical chain integrating “status analysis—relationship diagnosis—cause exploration” to ensure the scientific rigor and accuracy of the results (Figure 2).

2.2.2. Boston Consulting Group Matrix: BCGM

BCGM stands as one of the most iconic analytical tools in global strategic management. By examining two core dimensions, that is, “market growth rate” and “relative market share”, it categorizes a company’s business or products into four distinct quadrants to present a clear strategic roadmap for corporate decision making [35]. In this study, the Boston Matrix is innovatively applied to deconstruct the spatiotemporal dynamics between commercial land supply and consumer demand at the county level in Gansu Province. Its core value lies in providing a structured, visual, and dual-dimensional analytical framework that integrates static comparison with dynamic trends by the Boston Matrix. Zoning methods currently used largely overlook the temporal dimension, resulting in outcomes that often reflect only the spatial variation in regional variables at a single time node rather than their spatiotemporal characteristics throughout the entire evolutionary process. Traditional regionalization typically focuses on “a certain moment”, implicitly assuming that similarity in attributes at one time point justifies classification into the same region, essentially constituting state-oriented geographical regionalization. However, in reality, commercial land use and consumption are continuously evolving processes. Therefore, this study constructs a new framework for process-oriented geographical regionalization by incorporating change rates from 2019 to 2023. Traditional single-indicator ranking or time series analysis has encountered challenges when simultaneously capturing the comprehensive performance of a region in terms of “existing scale foundation” and “future growth momentum”, a gap precisely addressed. Through BCGM, regionalization is no longer a static segmentation but a geographical process that integrates both temporal and spatial dimensions, significantly enhancing the alignment between analytical results and reality. Plotting relative shares ( R S ) on the horizontal axis essentially enables a comparative analysis of regional competitiveness among counties within Gansu Province based on the scale of commercial land or consumer market inventory. Plotting the average annual growth rate ( G R ) on the vertical axis provides a depiction of the developmental trends across various counties in the corresponding fields mentioned above. By combining these two dimensions and using their medians as thresholds, four typical “stock-increment” combination types are identified: high-scale–high-speed, high-scale–low-speed, low-scale–high-speed, and low-scale–low-speed. This enables a refined stratification of all 87 counties, laying a solid analytical foundation for differentiated policy design. With Y i representing the stock of commercial land or resident consumption in county i, Y i m a x representing the maximum value in Gansu Province, Y i b a s e and Y i e n d representing the stocks of county i in 2019 and 2023, respectively, RS and GR are calculated as follows [36]:
R S = Y i Y i m a x × 100 %
G R = Y i e n d Y i b a s e t 1 × 100 %

2.2.3. Exploratory Spatial Data Analysis: ESDA

This study characterizes the spatial correlation features of commercial land use and consumption in counties of Gansu Province using the ESDA model, providing a basis for driving mechanism analysis and policy design. Global Moran’s I is used to determine the spatial autocorrelation characteristics of variables in Gansu Province, including positive autocorrelation (greater than zero), negative correlation (less than zero), and random distribution (equal to zero). Local spatial autocorrelation is calculated via Global Moran’s I and visualized using LISA maps. HH refers to plateau areas, where the elevation is the same as the surrounding terrain. HL refers to high mountain areas, where the elevation is higher than the surrounding terrain. LH refers to valley areas, where the elevation is lower than the surrounding terrain. LL refers to plain areas, where the elevation is the same as the surrounding terrain. The equation [37] for calculation of Global and Local Moran’s I is:
G l o b a l   M o r a n s   I = n S 0 × i = 1 n j = 1 n W i j ( y i y ¯ ) ( y j y ¯ ) i = 1 n ( y i y ¯ ) 2 ,   S 0 = i = 1 n j = 1 n = W i j
L o c a l   M o r a n s   I i = Z i i = 1 n W i j Z j
where n is the number of administrative divisions in Gansu Province (87); y i and y j are the observed variable values for counties i and j ; y ¯ is their mean value; W i j in global spatial autocorrelation represents the spatial weight matrix, while in local spatial autocorrelation it denotes the row-standardized values of spatial weights; S 0 is the sum of the spatial weight matrix; and Z i and Z j are the standardized values of the observed variables for counties i and j , respectively.

2.2.4. Decoupling Model: DM

The Tapio decoupling model was used to analyze the mismatch between commercial land supply and residential consumption demand, and it is a dynamic nonlinear econometric model. We calculated the decoupling index ( ε ), commercial land growth rate ( α ), and consumption growth rate ( β ) using the model, as shown in (5) to (7) [38]. By comparing the three parameters, using 0.8 and 1.2 as ε classification thresholds, the decoupling types are categorized into 3 classes and 8 subclasses (Figure 3). The first class is “demand exceeds supply (decoupling)”, which includes three subclasses: strong decoupling, weak decoupling, and recessive decoupling. It represents the difficulty of commercial land supply to meet demand and may become a spatial obstacle to boosting and upgrading consumption. The second class is “supply–demand balance (coupling)”, comprising two subclasses: expansive coupling and recessive coupling, reflecting their synchronized movement. The third class is “supply exceeds demand (negative decoupling)”, consisting of three subclasses: strong, weak, and expansive negative decoupling. It signifies that the supply of commercial land far outstrips demand, with extensive land inputs failing to effectively translate into consumption growth [39,40]. Once the relationship between commercial land supply and consumption falls into a state of supply exceeding demand, it indicates low efficiency in land use and even the occurrence of resource waste.
ε = α β
α = Y i e n d Y i b a s e n 1
β = Y i e n d Y i b a s e n 1

2.2.5. Explainable Machine Learning: EML

SHAP (Shapley Additive Explanations) is an explainable machine learning method based on the Shapley value principle from game theory. Its core lies in decomposing model predictions into contribution values of each input feature, quantifying the positive/negative influence and strength of individual features on the prediction outcome, while balancing both global model prediction logic and local sample interpretation [41]. The SHAP algorithm explains model decision making by calculating each feature’s contribution (i.e., Shapley value) to the model output, thereby enhancing the credibility of mechanism interpretation. Unlike traditional machine learning models that only output prediction results, SHAP quantifies the specific contribution of each factor, clearly demonstrating “how a factor influences mismatches”, thereby overcoming the limitations of “black-box” models and providing verifiable empirical evidence for mechanism analysis [42]. The analysis process consists of three steps. The first step is to use Deep Explainer to calculate the SHAP value of the influencing factor. Each feature of every data point is assigned a SHAP value to quantitatively describe how that feature affects the prediction results. Each predicted value must satisfy Equation (8). The second step is to calculate the mean absolute value of the global SHAP for each feature using Equation (9) to compare the importance of the features. The third step is to conduct a spatial analysis of the SHAP values to reveal the spatial effects of the factors.
Y m = Y b a s e + f X m 1 + f X m 2 + + f X m h
C h ¯ = 1 n m = 1 n | f X m h |
where m is the number of machine learning samples, n is the total sample size, h is the specific feature of the mth sample. Y b a s e is the baseline value of the entire model, typically the mean of the target variable for all samples; f X m h is the SHAP value of the mth feature for the hth sample, i.e., its contribution to the predicted value Y m . When f X m h > 0, it indicates that the feature exerts a positive effect on the prediction. C h ¯ is the mean of the absolute values of the global SHAP values for feature h.
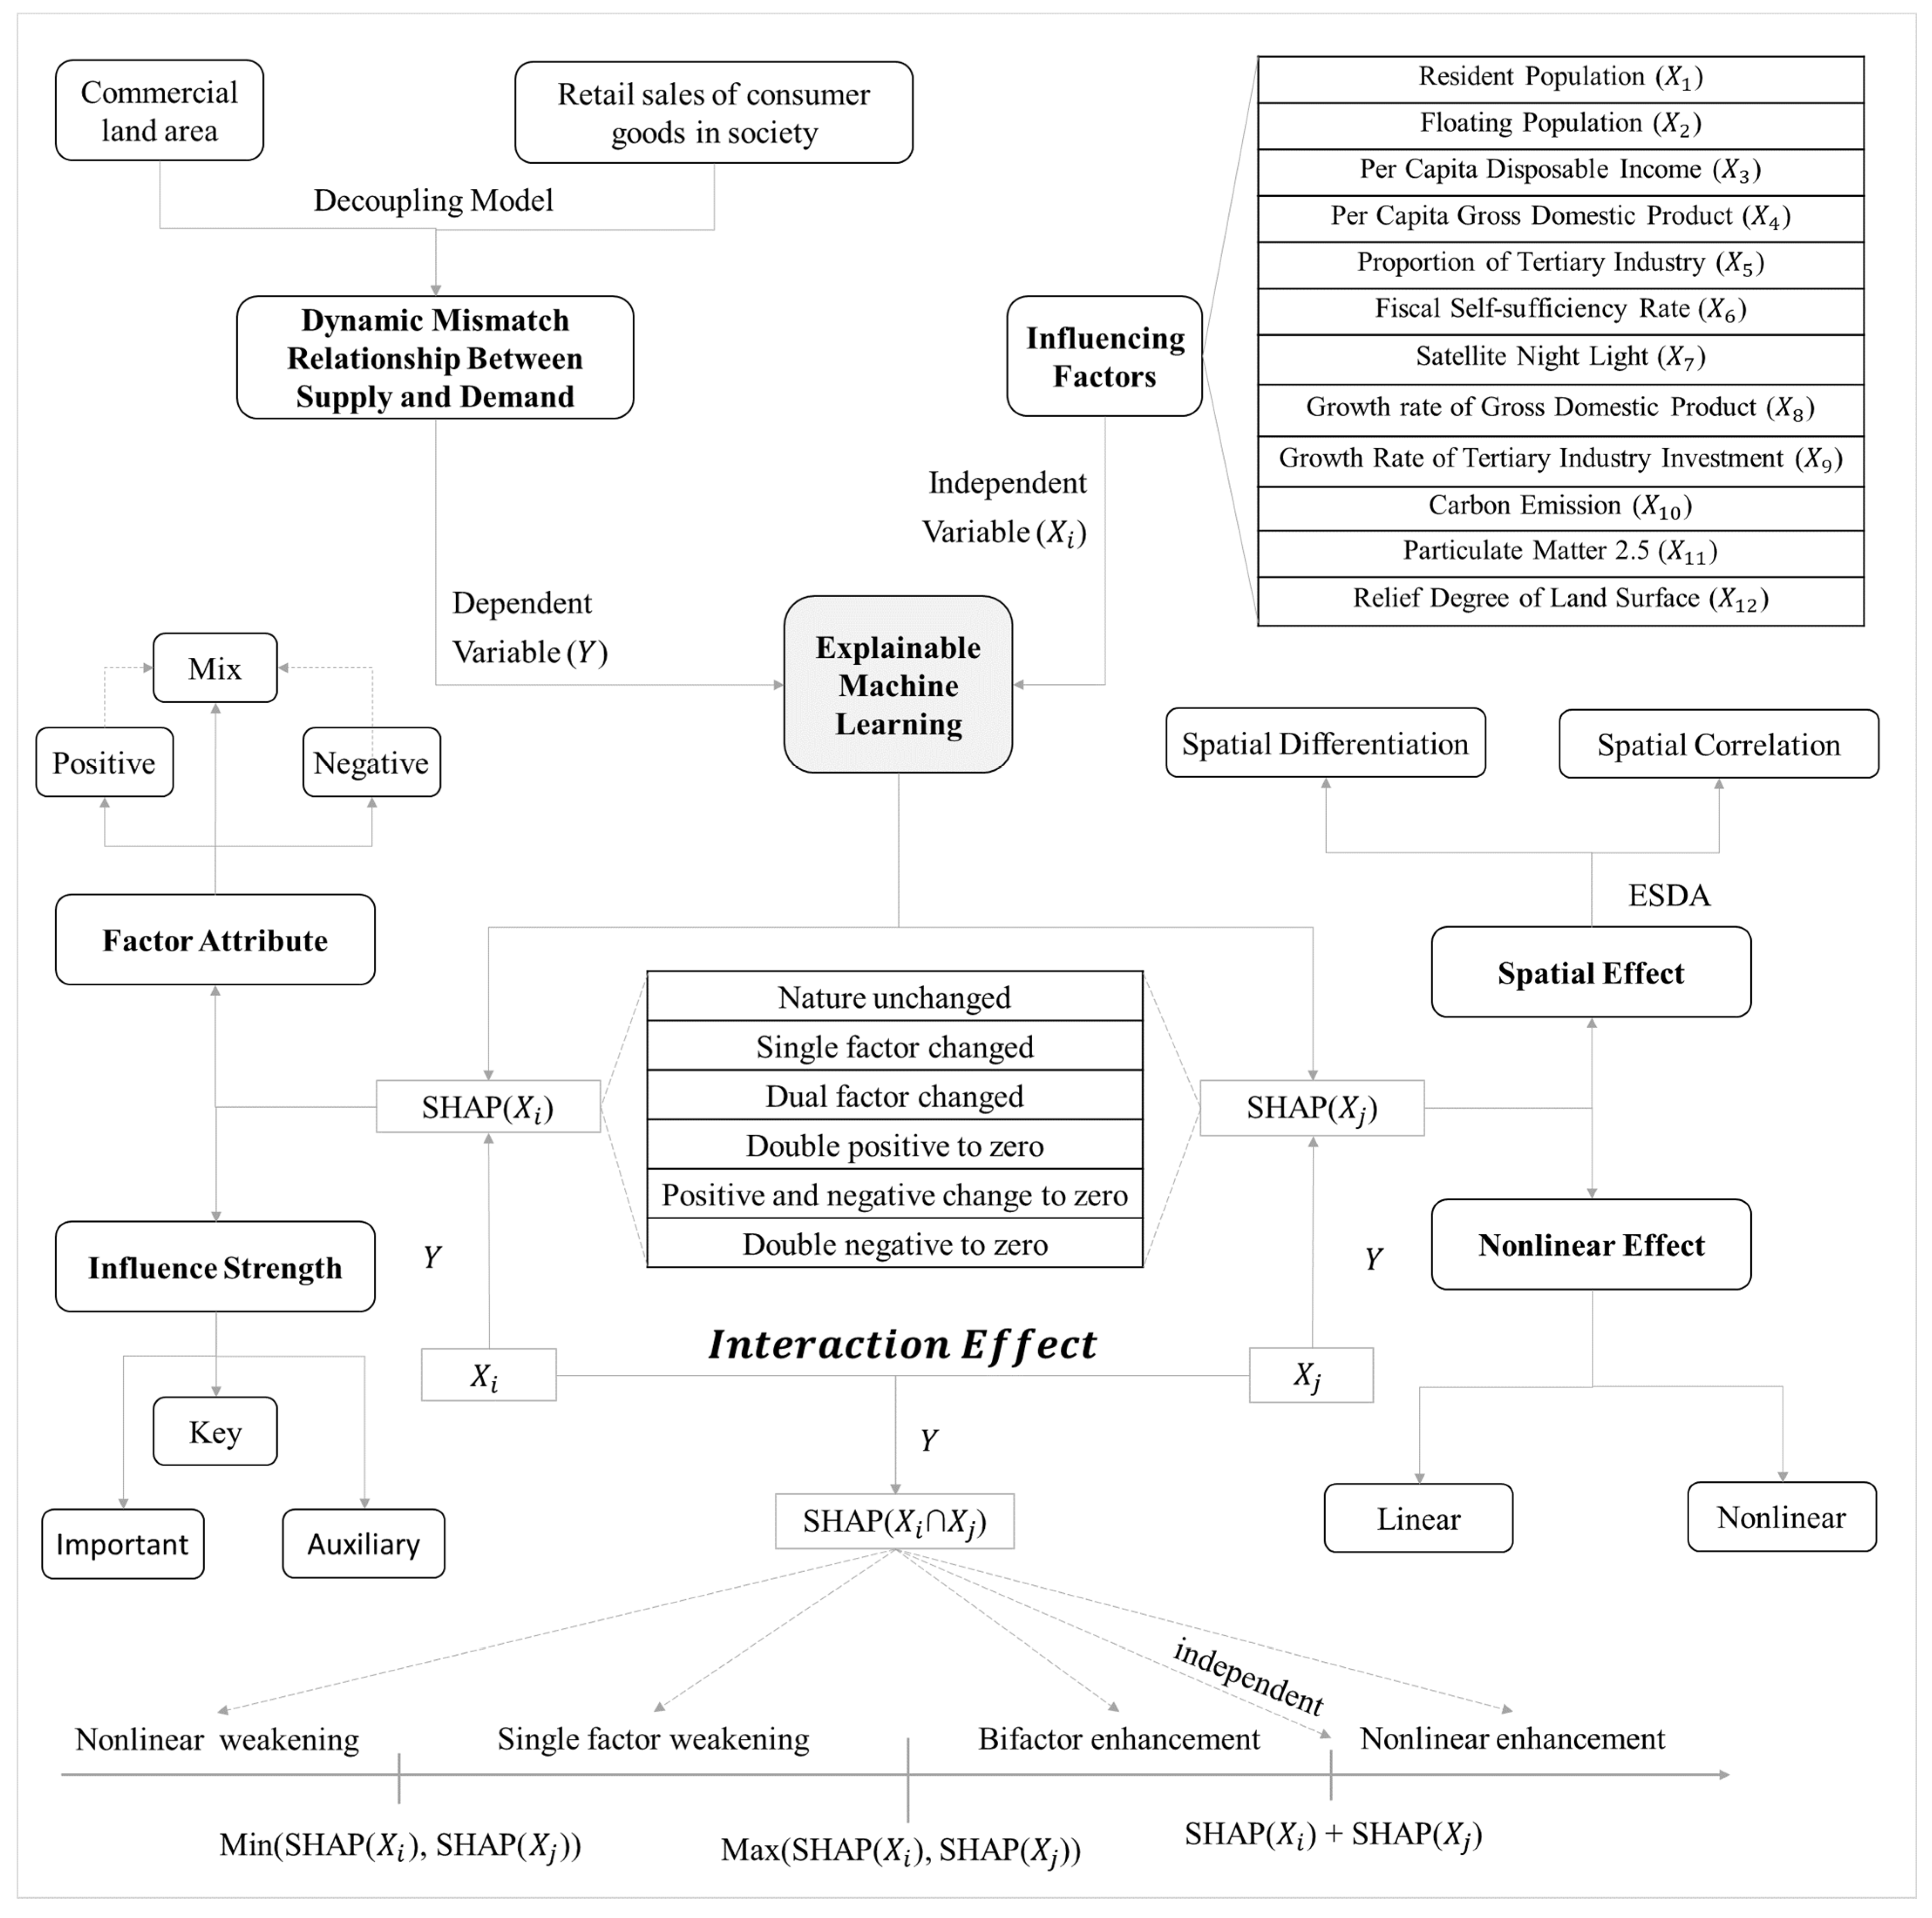
Let the SHAP coefficients of factors i and j be S H A P ( X i ) and S H A P ( X j ) , respectively, and the SHAP value for their paired interaction be S H A P ( X i X j ) . If S H A P ( X i ) is less than zero, it indicates a negative inhibitory effect; otherwise, it demonstrates a positive promotional effect. If S H A P ( X i ) is both positive and negative across different regions, it is marked as a mixed effect, while a value of zero indicates no effect. According to the ranking of the absolute value of S H A P ( X i ) , the direct influence of factors is classified into three levels: key, important, and auxiliary. We determine the factor interaction pathways based on the scatter plot of S H A P ( X i ) , including both linear and nonlinear relationships. Spatial analysis of S H A P ( X i ) includes spatial heterogeneity (coefficient of variation) and spatial correlation (Moran’s I). By comparing these three SHAP values, the changes in effect direction induced by interactions are categorized into six types. For example, when S H A P ( X i ) ,   S H A P ( X j ) and S H A P ( X i X j ) are all positive or negative, the interaction effect result is judged as nature unchanged. By comparing the relationship between Min ( S H A P ( X i ) , S H A P ( X j ) ), Max ( S H A P ( X i ) , S H A P ( X j ) ), and S H A P ( X i ) + S H A P ( X j ) , the strength of interaction effects is divided into five levels (Figure 3). The interaction effect focuses on the nature and intensity changes in factor effects, and combines statistical analysis of interaction relationships in different regions to clarify the characteristics of these interactions. This study has 12 independent variables, resulting in a total of 66 factor pairs. This study included 87 county towns, resulting in a total of 5742 interaction effect values.

2.3. Indicator System and Data Source

Commercial land is measured by its usable area, reflecting the supply capacity of commercial space, whereas consumer demand is represented by total retail sales of consumer goods in society, capturing residents’ consumption needs rather than enterprise-driven production activities. These two constitute the basic analytical variables of this study and serve as the origin for subsequent analysis. The dependent variable represents the type of mismatch between commercial land supply and residential consumption demand, based on the results of the decoupling model calculations. The independent variables include 12 indicators, classified into 4 groups (Table 1). The first group focuses on consumption foundation and capacity, directly measuring the demand-side fundamentals of consumer services, including permanent residents, floating population, and household income. Their scale and purchasing power serve as the primary basis for determining the rational allocation scale and hierarchy of commercial land [43]. The second group focuses on industrial structure and government regulation, examining the influence of industrial systems and local government capacity. It includes industrialization level, service sector proportion, and fiscal self-sufficiency rate, aiming to analyze the economic foundation and institutional environment underpinning commercial land allocation [44]. The third group emphasizes economic vitality, encompassing nighttime economy, service economy, and service investment growth rate. It aims to capture short-term dynamics and market expectations within the regional economy, reflecting the influence of county-level economic potential and market activity [45]. The fourth group highlights environmental constraints, including carbon emissions, air pollution, and topography, representing the influence of natural geographical conditions and ecological pressures. These constitute the physical boundaries and sustainability constraints for commercial land expansion [46]. Data on urban commercial land is sourced from the third national land resource survey, while most data on resident consumption and influencing factors is derived from the Gansu Statistical Yearbook. Floating population data is derived from adjustments to the Construction Statistical Yearbook and census data. Satellite night light data originates from the Chinese Research Data Services Platform. Carbon emission data is sourced from EDGAR (Electronic Data Gathering, Analysis, and Retrieval System). Particulate matter 2.5 data is sourced from the National Tibetan Plateau Data Center, while relief degree of land surface data is sourced from the Institute of Geographic Sciences and Natural Resources Research, Chinese Academy of Sciences [47].

3. Results

3.1. Characteristics of Commercial Land Supply

3.1.1. Spatial Distribution Pattern of Commercial Land Stock

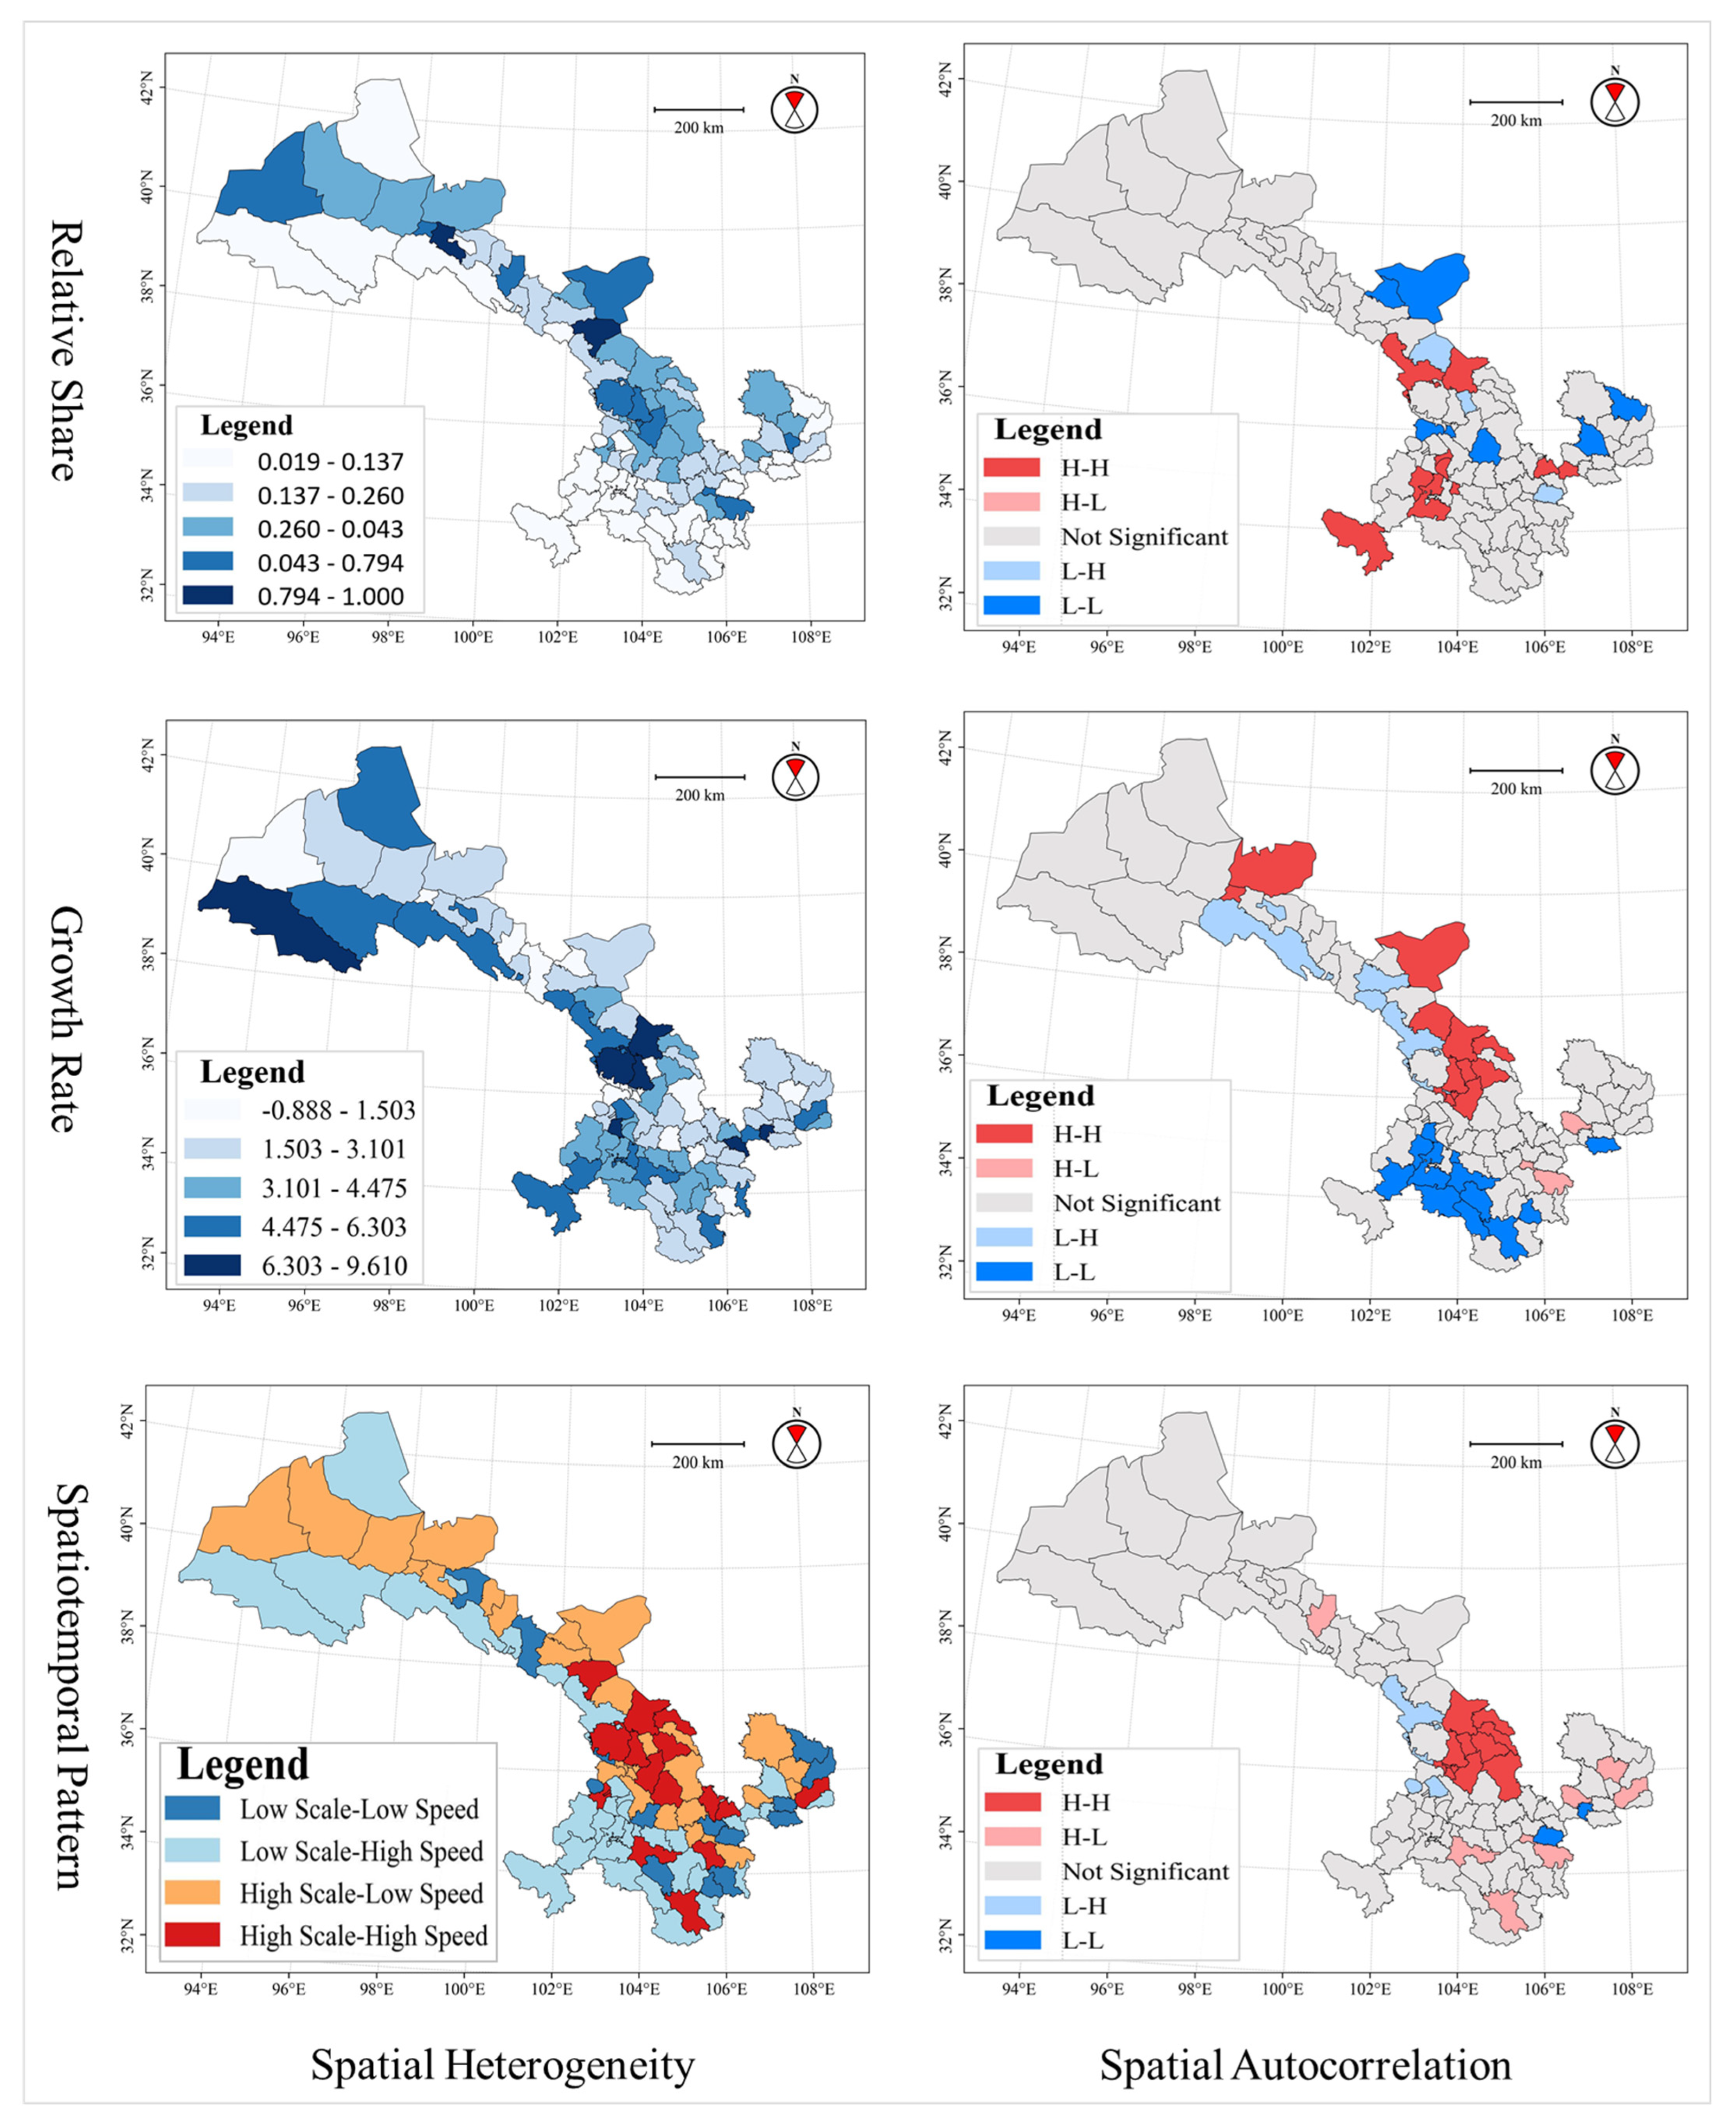
The relative shares (hereafter referred to as RS) of 87 county-level cities in Gansu Province for 2023 were calculated to analyze the regional competitive landscape of commercial land allocation. The average RS value was 0.24, with Suzhou having the highest value and Liangdang the lowest (0.02). The Lower Quartile, Median, and Upper Quartile are 0.10, 0.18, and 0.32, respectively. The coefficient of variation for RS was 0.81, far exceeding 0.36, indicating significant spatial heterogeneity in commercial land inventory, with substantial disparities among different counties [48,49]. Using the natural break algorithm for spatial clustering analysis with GIS, the commercial land stock of 87 counties is categorized into five levels. High and higher levels are concentrated in the Lanzhou-Baiyin Integrated Development Zone and the Hexi Corridor urban belt region, while low and lower levels are predominantly clustered in the Gannan-Longnan area and the peripheral regions of the Hexi Corridor (Table 2 and Figure 4).
Moran’s I is 0.16 (p = 0.01, Z = 2.45), indicating a significant positive spatial autocorrelation in the distribution of commercial land stock across counties in Gansu Province. Commercial land supply in similar counties within Gansu Province tends to cluster spatially, exhibiting pronounced geographic “club” characteristics. First, counties with higher commercial land stock are surrounded by others that also tend to have higher levels, forming a commercial supply plateau area (HH). The regions include Chengguan, Qilihe, Xigu, Gaolan, Yuzhong, Jiayuguan, Baiyin, Jingyuan, Jingtai, Minqin, Gulang, and Jinta, predominantly clustered in the Lanzhou-Baiyin integrated development zone in central Gansu. Second, counties with lower commercial land stock are similarly surrounded by others with lower levels, forming a commercial supply plain area (LL), including Lingtai, Minxian, Wudu, Chengxian, Tanchang, Hezheng, Hezuo, Zhuoni, Zhouqu, Diebu, and Luqu. Most of them are concentrated in the southern minority-inhabited regions of Gansu Province. Third, Anning, Honggu, Yongchang, Tianzhu, and Sunan are lowland valley regions (LH), while Maiji and Kongtong are categorized as polarized high mountain areas (HL).

3.1.2. Change Trends in Incremental Commercial Land Supply

We calculated the average annual growth rate (hereafter referred to as GR) for 87 counties in Gansu Province from 2019 to 2023 to analyze trends in commercial land allocation. The average GR was 3.22, with Zhangjiachuan having the highest and Chengguan the lowest (−0.89), showing negative growth. The Lower Quartile, Median, and Upper Quartile are 1.85, 2.73, and 4.18, respectively. The coefficient of variation for RS was 0.65, far exceeding 0.36, indicating significant spatial heterogeneity in the increment of commercial land. Spatial clustering analysis using the natural break algorithm reveals that counties with high and higher growth rates are primarily distributed in the peripheral areas of southwestern Gansu Province, including the Hexi Corridor urban belt, the provincial capital metropolitan area, and the ethnic minority-populated regions in southern Gansu. Counties with low and lower growth rates are predominantly clustered in the southeastern Gansu urban belt and the northeastern periphery of the Hexi Corridor urban belt.
Moran’s I is 0.11 (p = 0.05, Z = 1.65), indicating that the incremental allocation of commercial land in Gansu Province also exhibits a significant positive spatial autocorrelation. The spatial correlation and geographic distribution clustering (club-like patterns) of new commercial land are generally lower than those of existing land. First, the highland areas (HH) include Jingtai, Tianzhu, Zhuanglang, Huating, Kangle, Guanghe, Hezuo, Zhuoni, and Maqu, mostly clustered around the provincial capital metropolitan area and Dingxi City and its surroundings. Second, the plain areas (LL) include Qilihe, Jinchuan, Minqin, Huachi, Zhenyuan, Anding, and Yongjing, all located in the central to eastern part of Gansu Province but geographically dispersed. Third, Baiyin, Qingshui, and Gulang are low-lying valley areas (LH), with no appearance of polarized high mountain areas (HL) (Table 2 and Figure 4).

3.1.3. Integration Model of Stock and Increment of Commercial Land

The median relative shares of stock and increment of commercial land are 0.18 and 2.73, respectively. Based on these thresholds, 87 counties are classified into four categories, forming an olive-shaped stable structure (small at both ends and large in the middle). Fifteen counties are classified as high-scale–high-speed areas, including Yongdeng, Gaolan, Yuzhong, Jingyuan, Jingtai, Qinzhou, Liangzhou, Zhuanglang, Jingning, Ningxian, Anding, Minxian, Wudu, and Linxia. Most of them cluster in the provincial capital metropolitan area, with a small portion scattered in the urban belt of southeastern Gansu. Twenty-nine counties fall under the high-scale–low-speed category, including Chengguan, Qilihe, Xigu, Anning, Jiayuguan, Jinchuan, Yongchang, Baiyin, Pingchuan, Huining, Maiji, Gangu, Minqin, Gulang, Ganzhou, Linze, Kongtong, Suzhou, Jinta, Guazhou, Yumen, Dunhuang, Xifeng, Qingcheng, Huanxian, Tongwei, Longxi, Lintao, and Yongjing. Most of them cluster in a belt-like formation along the Hexi Corridor, with those in the eastern segment located in the central part and those in the western segment situated on the northwestern side. In addition, they form two small cluster agglomerations in the northeast of the urban belt along the Yellow River and the northern section of the urban belt in southeastern Gansu. Twenty-nine counties fall under the low-scale–high-speed category, including Wushan, Zhangjiachuan, Tianzhu, Sunan, Minle, Chongxin, Huating, Subei, Akesai, Zhengning, Zhenyuan, Zhangxian, Wenxian, Kangxian, Xihe, Lixian, Liangdang, Kangle, Guanghe, Hezheng, Dongxiang, Hezuo, Lintan, Zhuoni, Zhouqu, Diebu, Maqu, and Luqu, Xiahe. They are concentrated in a continuous belt along the southwestern edge of Gansu Province. Fourteen counties are low-scale–low-speed areas, including Honggu, Qingshui, Qinan, Gaotai, Shandan, Jingchuan, Lingtai, Huachi, Heshui, Weiyuan, Chengxian, Tanchang, Huixian, and Jishishan. They are dispersed across the province but concentrated in the southeastern urban belt of Gansu. Moran’s I is 0.05 (p = 0.18, Z = 0.92), indicating that the allocation of commercial land in Gansu Province integrating stock and increment does not have significant spatial autocorrelation. The highland region (HH) encompasses Chengguan, Qilihe, Xigu, Anning, Gaolan, Yuzhong, Baiyin, Pingchuan, Jingyuan, Huining, and Jingtai, all clustered within the Lanzhou-Baiyin integrated development zone (Table 2 and Figure 4).

3.2. Characteristics of Consumption Service Demand

3.2.1. Spatial Distribution Pattern of Consumption Service Demand Stock

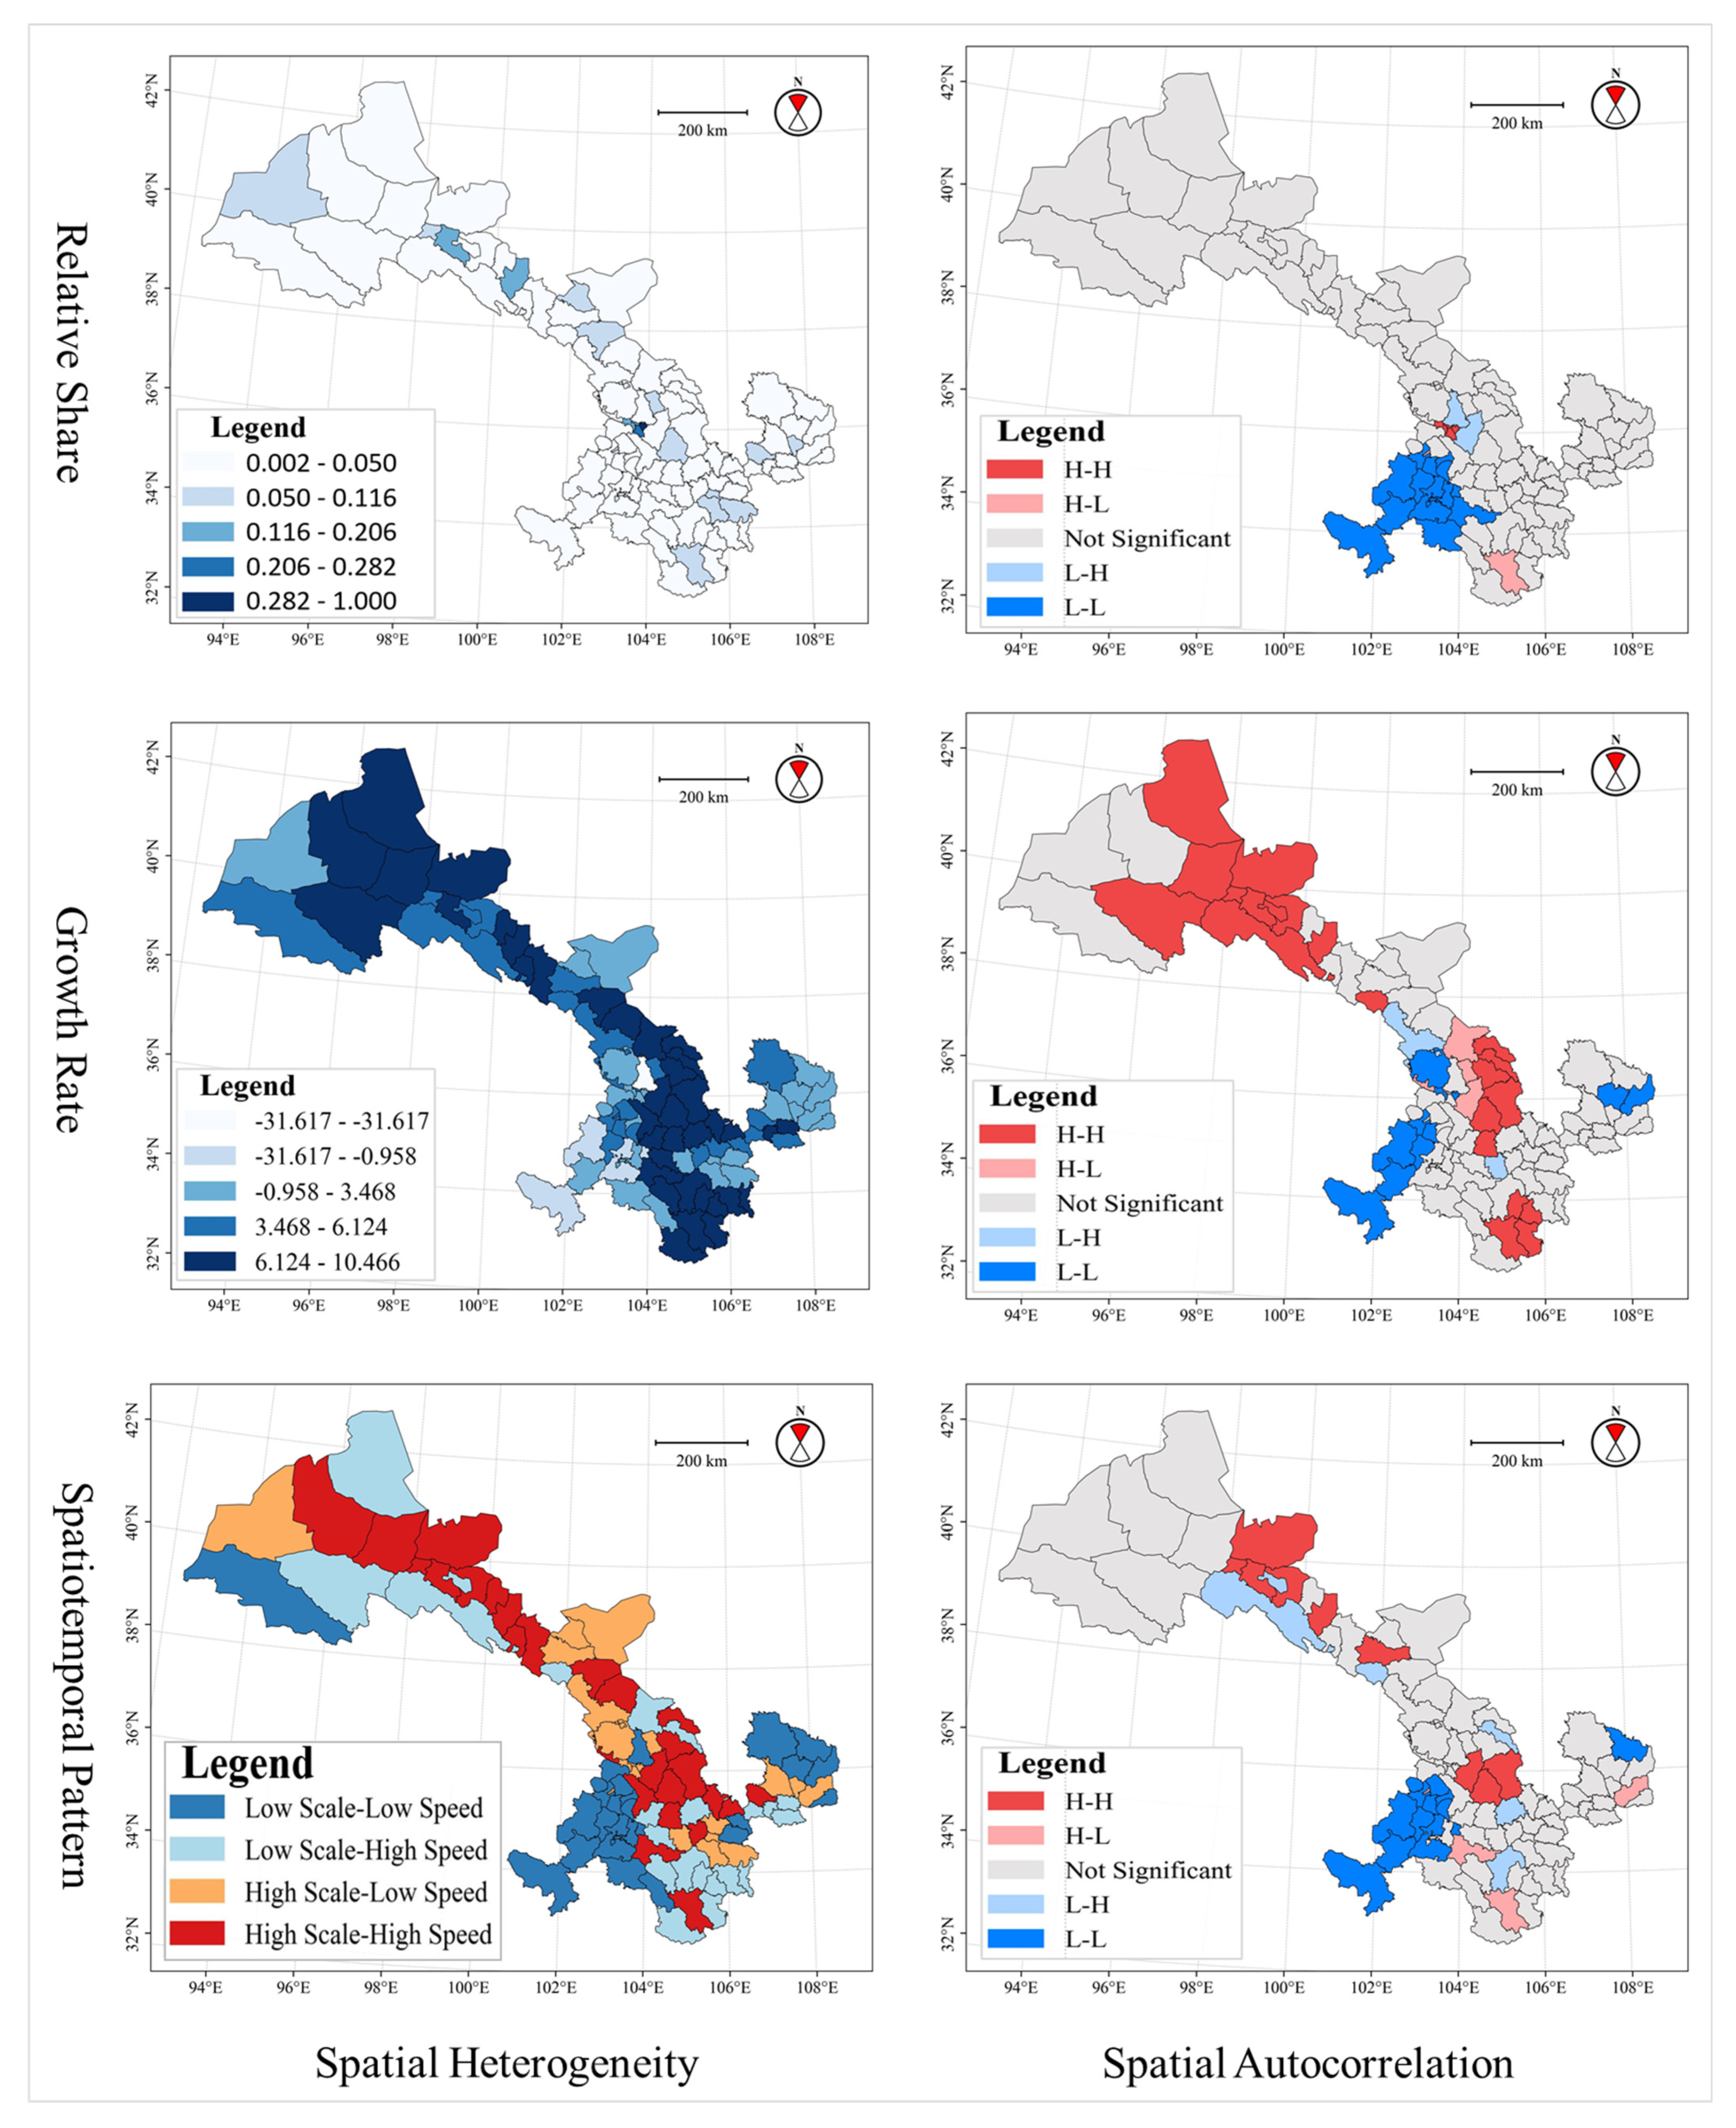
In 2023, the average RS for consumption stock across 87 counties in Gansu Province was 0.05, with Chengguan recording the highest value and Liangdang the lowest (0.00). The Lower Quartile, Median, and Upper Quartile are 0.01, 0.02, and 0.04, respectively. The coefficient of variation for RS was 2.25, indicating that consumer stock exhibits not only significant spatial heterogeneity but also a level substantially higher than that of commercial land. Spatial clustering analysis reveals that counties rated as high or higher are extremely rare, and they are all concentrated in provincial capital metropolitan areas. Counties at the medium level are also scarce, all located in the central cities of the Hexi Corridor urban belt. There are numerous counties classified as low and lower tiers. Moran’s I is 0.17 (p = 0.00, Z = 4.29), indicating that the consumption stock in Gansu Province also exhibits significant positive spatial autocorrelation. The highland region (HH) includes Chengguan, Qilihe, Xigu, and Anning, all clustered within the provincial capital metropolitan area. Next, the plain areas (LL) include Minxian, Linxia, Kangle, Guanghe, Hezheng, Hezuo, Lintan, Zhuoni, Diebu, Maqu, Luqu, and Xiahe. They cluster in groups within Gannan Tibetan Autonomous Prefecture and its surrounding areas. Furthermore, Wudu and Linxia are polarized high mountain areas (HL), while Gaolan and Yuzhong are low-lying valley areas (LH), located at the periphery of the provincial capital’s metropolitan area (Table 2 and Figure 5).

3.2.2. Change Trends in Incremental Consumption Service Demand

From 2019 to 2023, the average RS of consumption increment across 87 counties in Gansu Province was 4.78, with Jinta recording the highest value and Gaolan the lowest (−31.62). The Lower Quartile, Median, and Upper Quartile are 3.18, 4.95, and 7.57, respectively. The coefficient of variation for RS was 1.00, indicating that consumption increments also exhibit significant spatial heterogeneity, though at a level far below that of the stock. Spatial clustering analysis reveals that counties with high and higher growth rates form three agglomeration zones. A large agglomeration belt extends along the Jinchang-Wuwei-Baiyin-Lanzhou-Dingxi-Longnan corridor, while two cluster agglomeration zones emerge within the Hexi Corridor urban belt. Counties with low and lower growth are predominantly concentrated in ethnic minority autonomous regions and resource-intensive urban areas, including Gannan, Qingyang, Tianshui, and their surrounding regions. Moran’s I is 0.13 (p = 0.01, Z = 2.67), indicating that the consumption increment in Gansu Province also has significant positive spatial autocorrelation. Compared to existing stock, incremental development exhibits lower spatial correlation but superior spatial clustering patterns. Seventeen counties are classified as highland areas (HH), including Jiayuguan, Pingchuan, Jingyuan, Huining, Ganzhou, Sunan, Gaotai, Suzhou, Jinta, Subei, Yumen, Anding, Longxi, Wudu, Chengxian, Kangxian, and Xihe. A large-scale agglomeration area is formed in the Jiayuguan-Jiuquan metropolitan region, a medium-sized agglomeration area on the eastern side of the Lanzhou-Baiyin integrated development zone, and a small-scale agglomeration area in Longnan. Eleven counties are plain areas (LL), including Chengguan, Xigu, Yongdeng, Qingcheng, Heshui, Linxia, Hezheng, Hezuo, Maqu, Luqu, and Xiahe, mostly clustered in a belt shape in Gannan Tibetan Autonomous Prefecture and its surrounding areas. Anning, Honggu, Yuzhong, Baiyin, and Jingtai are classified as polarized high mountain areas (HL), while Wushan and Tianzhu are low-lying valley areas (LH). Their numbers are relatively small, with most located in the peripheral zones of the urban belt along the Yellow River (Table 2 and Figure 5).

3.2.3. Integration Model of Stock and Increment of Consumption Service Demand

The median relative shares of consumption stock and increment are 0.02 and 4.95, respectively. Using these as thresholds, the 87 counties exhibit a dumbbell-shaped distribution pattern (large at both ends, small in the middle). Twenty-five counties fall under the high-scale, high-speed category, including Honggu, Yuzhong, Jiayuguan, Jingyuan, Huining, Gangu, Liangzhou, Gulang, Ganzhou, Minle, Linze, Gaotai, Shandan, Kongtong, Zhuanglang, Jingning, Suzhou, Jinta, Guazhou, Yumen, Anding, Longxi, Lintao, Minxian, and Wudu. Some are clustered along the towns of the Hexi Corridor, while others form clusters within the provincial capital’s metropolitan area and its eastern periphery. Nineteen counties fall under the high-scale, low-speed category, including Chengguan, Qilihe, Xigu, Anning, Yongdeng, Jinchuan, Yongchang, Baiyin, Qinzhou, Maiji, Qinan, Wushan, Minqin, Tianzhu, Dunhuang, Xifeng, Ningxian, Zhenyuan, and Linxia. Most of them cluster around Jinchang, Wuwei, Tianshui, and Qingyang. Nineteen counties fall under the low-scale, high-speed category, including Pingchuan, Jingtai, Sunan, Jingchuan, Lingtai, Chongxin, Huating, Subei, Tongwei, Weiyuan, Zhangxian, Chengxian, Wenxian, Tanchang, Kangxian, Xihe, Lixian, Huixian, and Liangdang. Most of these counties cluster at the southern end of the urban belt in southeastern Gansu. Twenty-four counties are categorized as low-scale, low-speed, including Gaolan, Qingshui, Zhangjiachuan, Akesai, Qingcheng, Huanxian, Huachi, Heshui, Zhengning, Linxia, Kangle, Yongjing, Guanghe, Hezheng, Dongxiang, Jishishan, Hezuo, Lintan, Zhuoni, Zhouqu, Diebu, Maqu, Luqu, and Xiahe. Most of them gather in the Gannan ethnic minority settlement area, with a smaller portion clustering in the resource-based city of Qingyang. Moran’s I is 0.34 (p = 0.00, Z = 4.87), indicating a significant positive spatial autocorrelation in the integration of stock increment consumption demand in Gansu Province. Nine counties are classified as highland areas (HH), including Yuzhong, Jiayuguan, Yongchang, Huining, Ganzhou, Gaotai, Suzhou, Jinta, and Anding, mostly clustered in Jinchang and Lanzhou. Twelve counties are plain areas (LL), including Huachi, Linxia, Kangle, Guanghe, Hezheng, Dongxiang, Jishishan, Hezuo, Zhuoni, Maqu, Luqu, and Xiahe, mostly concentrated in the Gannan Tibetan Autonomous Prefecture and its surrounding areas. Ningxian, Minxian, Wudu, and Linxia are polarized high mountain areas (HL), while Pingchuan, Sunan, Tongwei, and Lixian are low-lying valley areas (LH). They are few in number and geographically dispersed (Table 2 and Figure 5).

3.3. Dynamic Mismatch Relationship Between Supply and Demand

3.3.1. Decoupling Index and Type Analysis

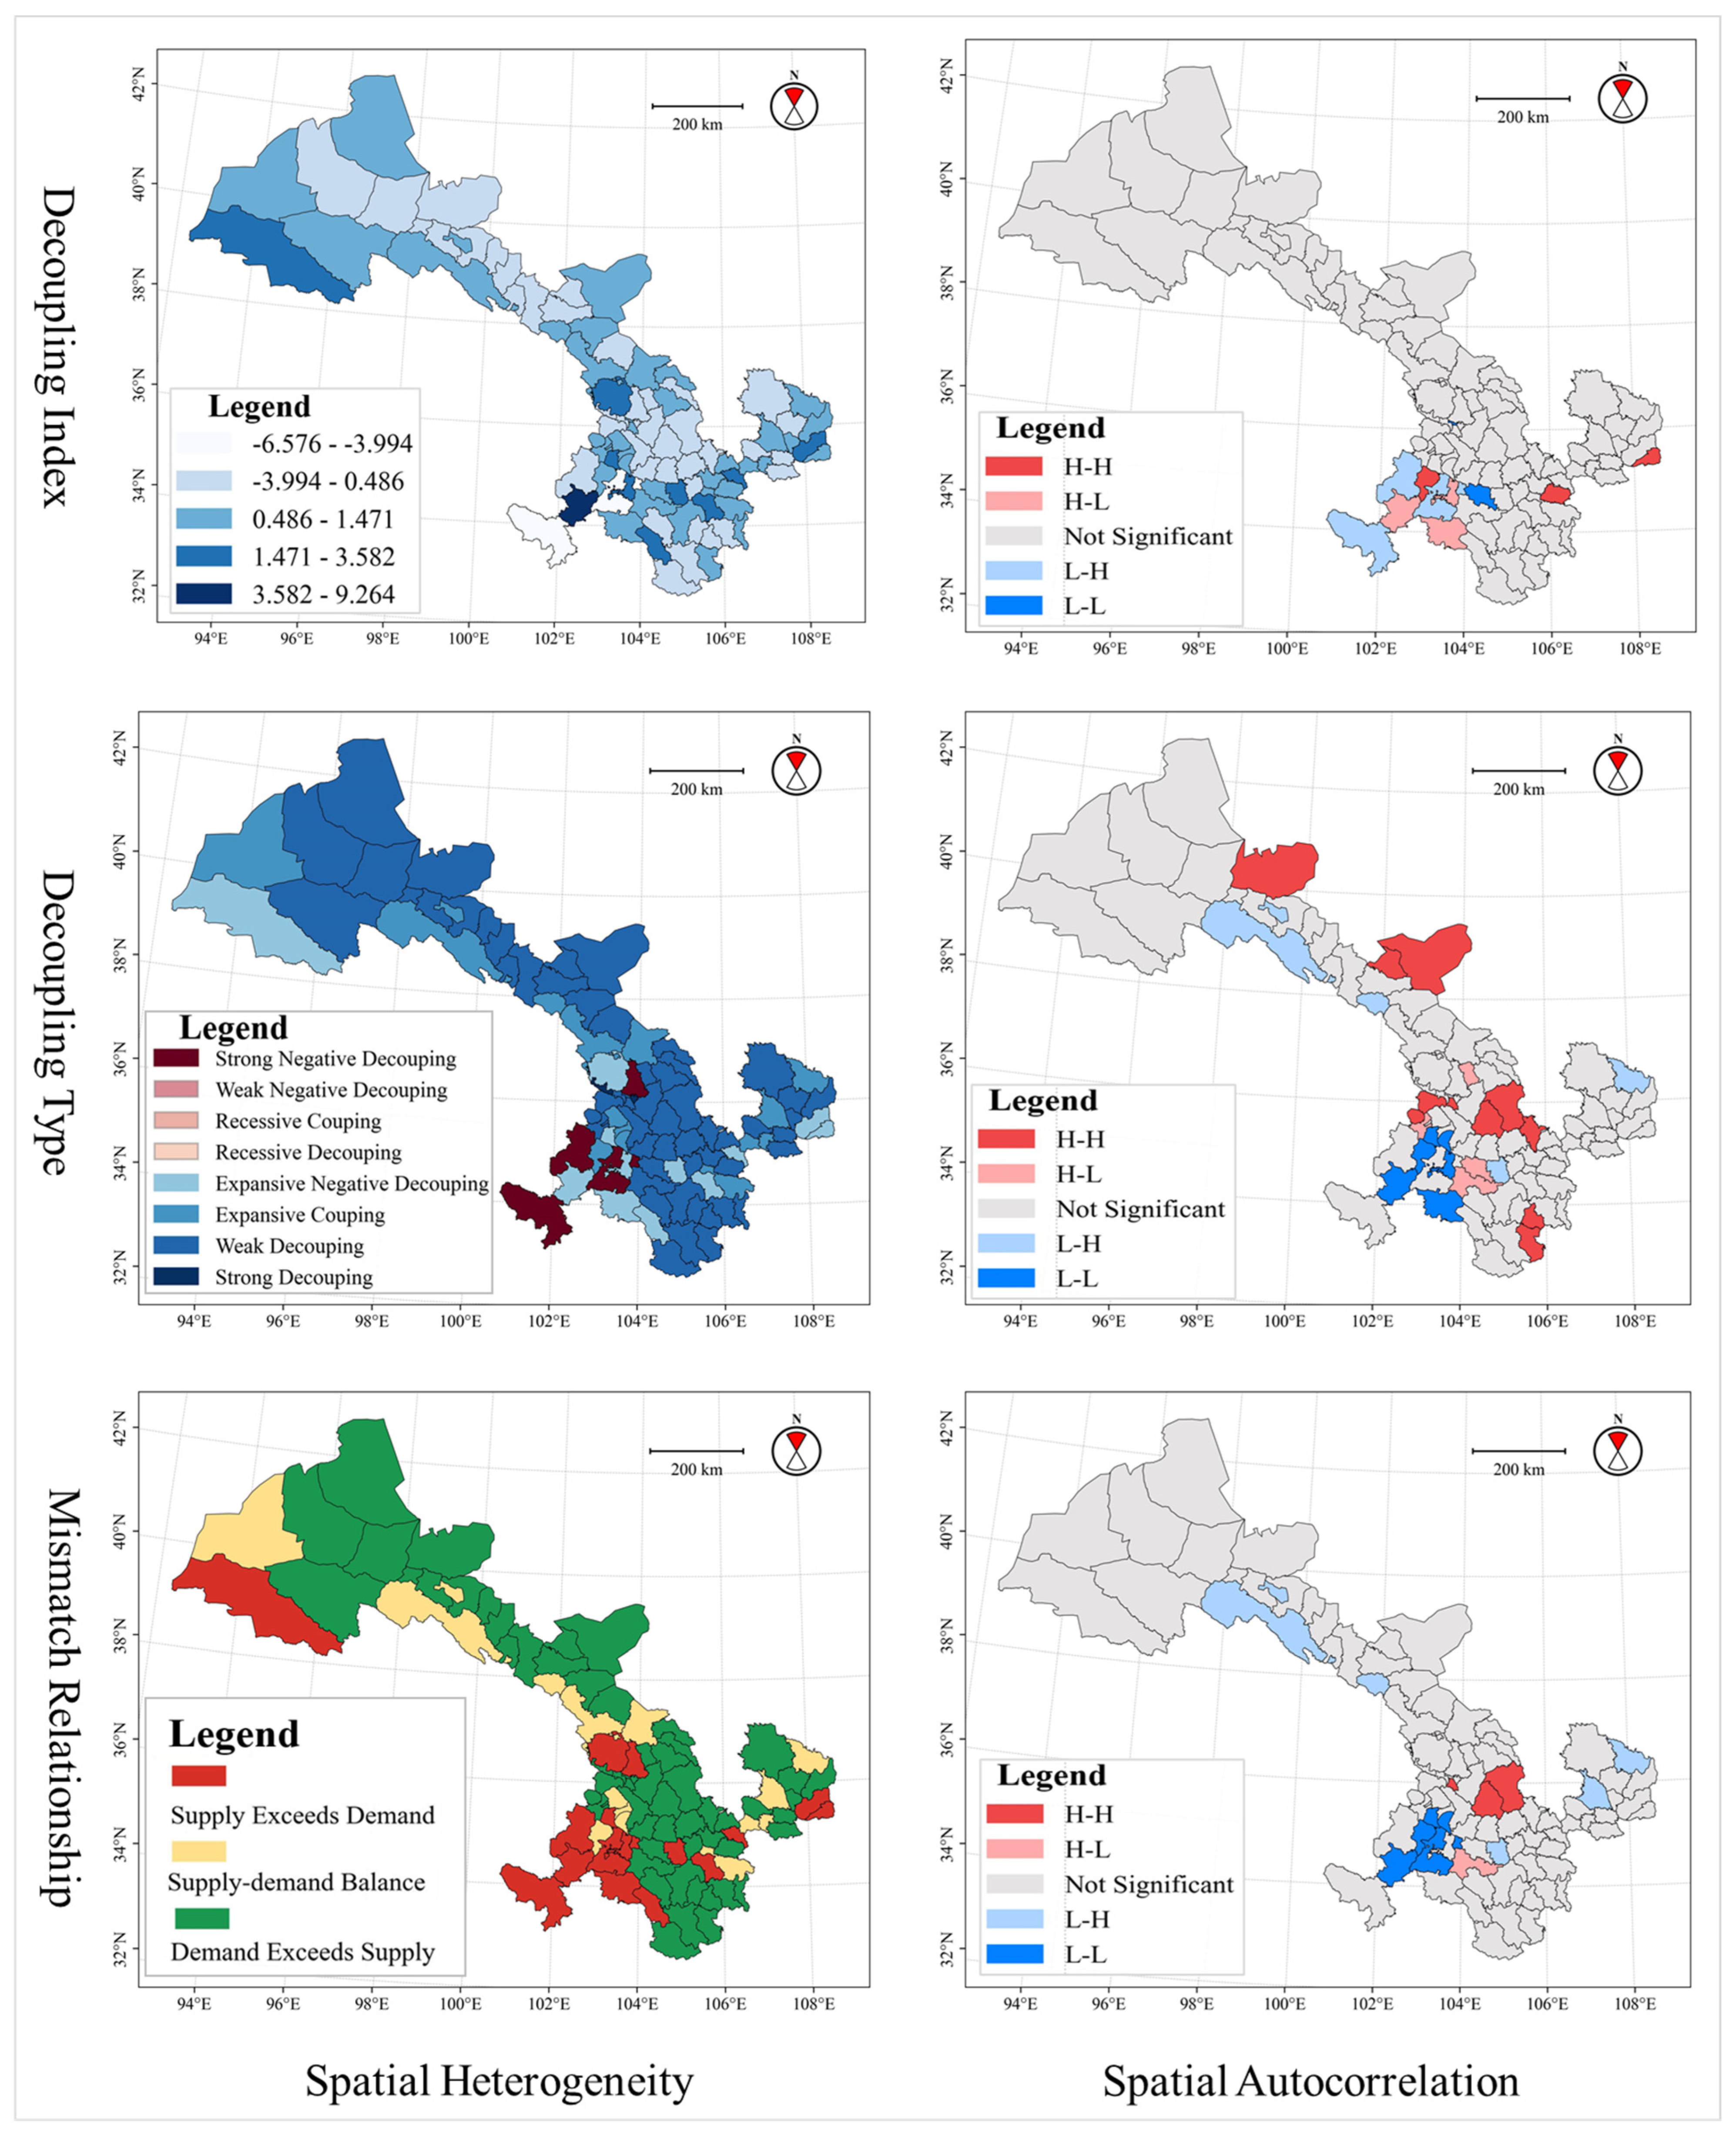
The decoupling index of 87 counties exhibits significant spatial heterogeneity, with a coefficient of variation of 2.39. More than 90% of counties have a positive decoupling index, with the highest value recorded in Luqu (9.26). Counties such as Lintan, Yongdeng, Zhangjiachuan, Zhouqu, Hezheng, Ningxian, Akesai, Wushan, and Qinzhou are at a higher level, while counties at a medium-high level, including Zhengning, Diebu, Guanghe, Dongxiang, Tianzhu, Maiji, Chongxin, Huating, Zhenyuan, Sunan, Dunhuang, Hezuo, Kangle, Jingtai, Huachi, Kangxian, Liangdang, Qingshui, Xifeng, and Heshui, are distributed near the axis of the urban belt. Counties with a low decoupling index cluster in a belt-like pattern in the west and in a coarse cluster in the east, including Guazhou, Jinta, Tongwei, Chengxian, Ganzhou, Huixian, Suzhou, Jiayuguan, Longxi, Huining, Shandan, Baiyin, Jinchuan, and Qingcheng. Notably, six counties have a negative decoupling index, that is, Honggu, Gaolan, Chengguan, Xiahe, Zhuoni, and Maqu. Moran’s I is −0.56 (p = 0.00, Z = −8.72), indicating a significant negative spatial autocorrelation in the decoupling index, completely different from the supply of commercial land and consumer demand. Three counties are classified as highland areas (HH), including Qingshui, Zhengning, and Hezuo. Anning and Zhangxian are plain areas (LL). Lintan, Diebu, and Luqu are polarized high mountain areas (HL), while Zhuoni, Maqu, and Xiahe are categorized as low-lying valley areas (LH) (Figure 6).
The counties in the weak decoupling state have the largest number, exceeding 60%, including Qilihe, Xigu, Anning, Yuzhong, Jiayuguan, Jinchuan, Yongchang, Baiyin, Pingchuan, Jingyuan, Huining, Qingshui, Qinan, Gangu, Liangzhou, Minqin, Gulang, Ganzhou, Minle, Linze, Gaotai, Shandan, and Kongtong. The number of counties experiencing expansive coupling and expansive negative decoupling is roughly equal, each at around 14%. The former includes Jingtai, Maiji, Tianzhu, Sunan, Chongxin, Huating, Dunhuang, Huachi, Zhenyuan, Kangle, Guanghe, and Dongxiang, while the latter includes Hezuo, Yongdeng, Qinzhou, Wushan, Zhangjiachuan, Akesai, Zhengning, Ningxian, Hezheng, Lintan, Zhouqu, Diebu, and Luqu. Gaolan, Zhuoni, Maqu, and Xiahe exhibit strong negative decoupling, while Chengguan and Honggu exhibit strong decoupling. These areas are small in number, and they are primarily concentrated in ethnic minority settlements. No county is in a state of recessive decoupling, recessive coupling, or weak negative decoupling. Moran’s I is 0.13 (p = 0.03, Z = 2.12), indicating a significant positive spatial autocorrelation in decoupling types. Eleven counties are classified as highland areas (HH), including Qilihe, Jinchuan, Huining, Minqin, Jingning, Jinta, Anding, Chengxian, Kangxian, Yongjing, and Jishishan. Six counties are plain areas (LL), including Kangle, Hezheng, Hezuo, Lintan, Diebu, and Luqu. Baiyin, Zhangxian, Minxian, and Linxia are classified as polarized highland areas (HL), while Wushan, Sunan, and Huachi are low-lying valley areas (LH) (Figure 6).

3.3.2. Dynamic Mismatch Relationship Analysis

Only 13 counties exhibit a supply–demand balance between commercial land provision and consumption demand, accounting for nearly 15%. Most of them are located in the Hexi Corridor urban belt and the southeastern Gansu urban belt, including Jingtai, Maiji, Tianzhu, Sunan, Chongxin, Huating, Dunhuang, Huachi, Zhenyuan, Kangle, Guanghe, Dongxiang, and Hezuo. Demand exceeds supply (positive mismatch) by 67%, occupying a dominant position. They are concentrated in the urban belts of the Hexi Corridor, along the Yellow River, and in the southeastern Gansu urban belt, with members including Chengguan, Qilihe, Xigu, Anning, Honggu, Yuzhong, Jiayuguan, Jinchuan, Yongchang, Baiyin, Pingchuan, Jingyuan, Huining, and Qingshui. Counties where supply exceeds demand (negative mismatch) are mostly clustered in the Gannan ethnic minority enclave and its surrounding areas, including Yongdeng, Gaolan, Qinzhou, Wushan, Zhangjiachuan, Akesai, Zhengning, Ningxian, Hezheng, Lintan, Zhuoni, Zhouqu, Diebu, Maqu, Luqu, and Xiahe. Moran’s I is 0.21 (p = 0.00, Z = 3.07), indicating a significant positive spatial autocorrelation in the mismatch relationship. Qilihe, Huining, and Anding are classified as highland areas (HH); Kangle, Hezheng, Hezuo, Zhuoni, and Luqu as plain areas (LL); Minxian as polarized high mountain areas (HL); and Wushan, Sunan, Huachi, and Zhenyuan as low-lying valley areas (LH) (Figure 6).

3.4. Impact Mechanism of Dynamic Mismatch Relationship

3.4.1. Analysis of Factor Attributes and Influence Strength

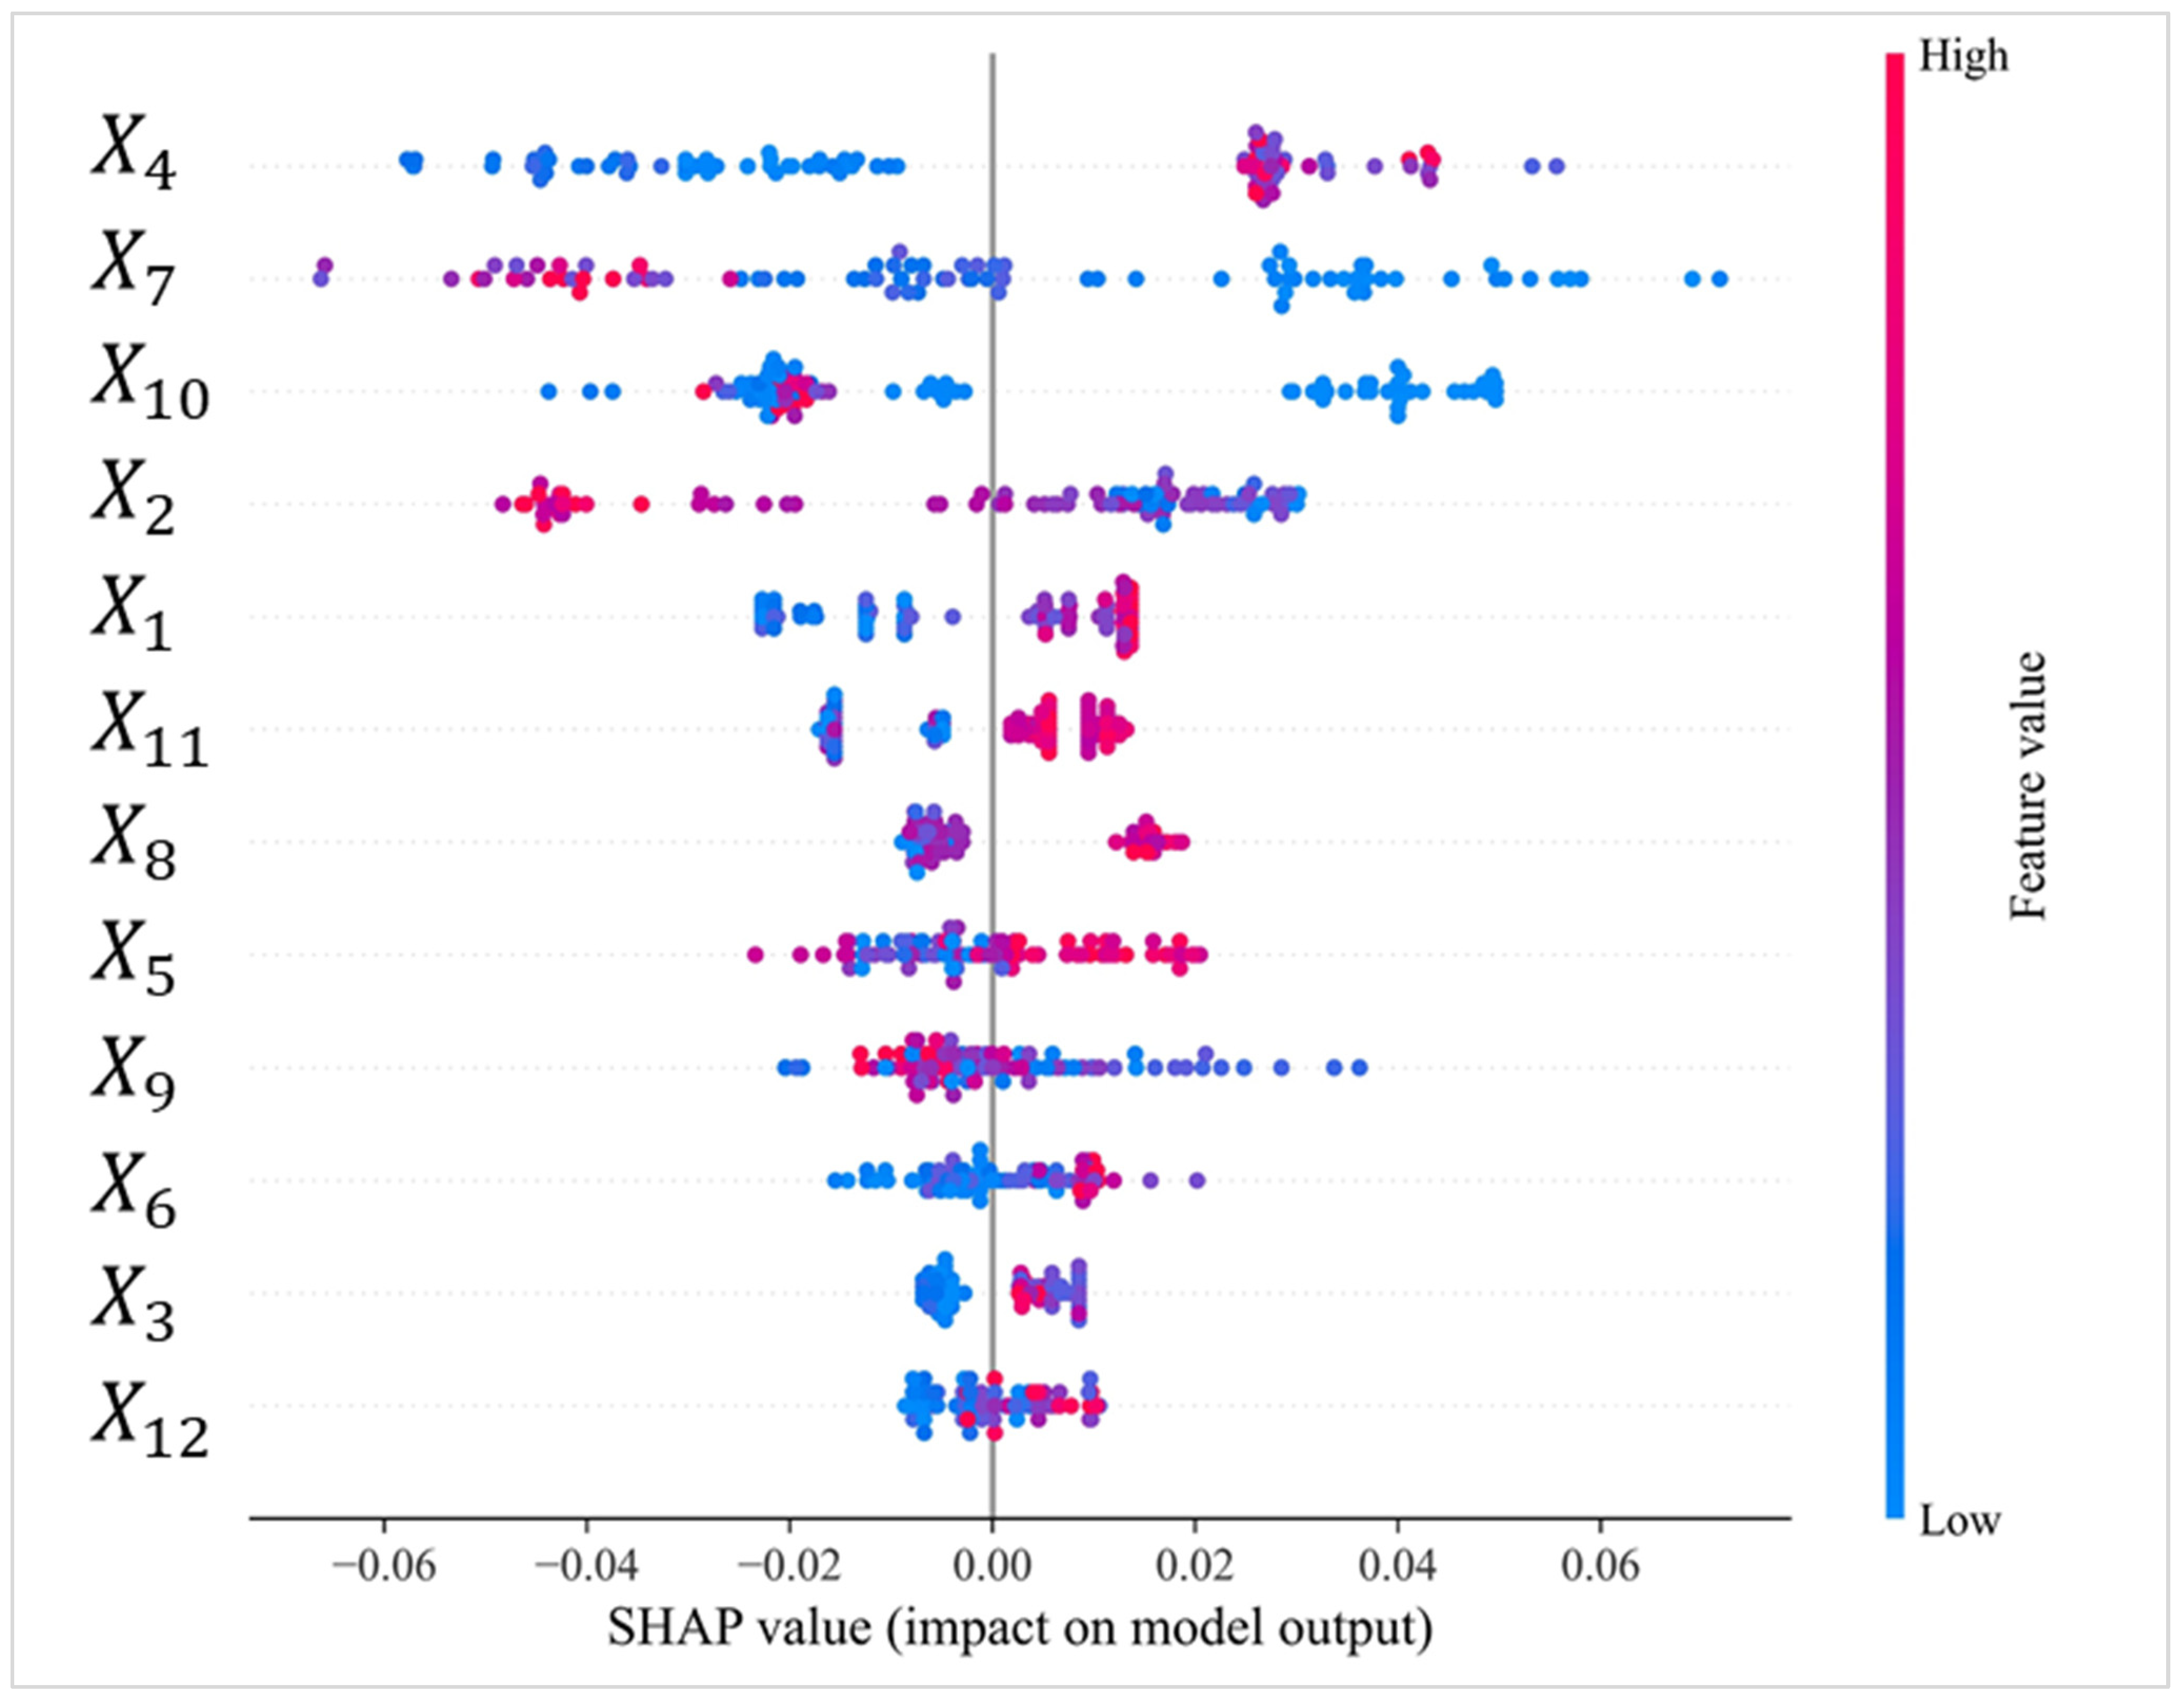
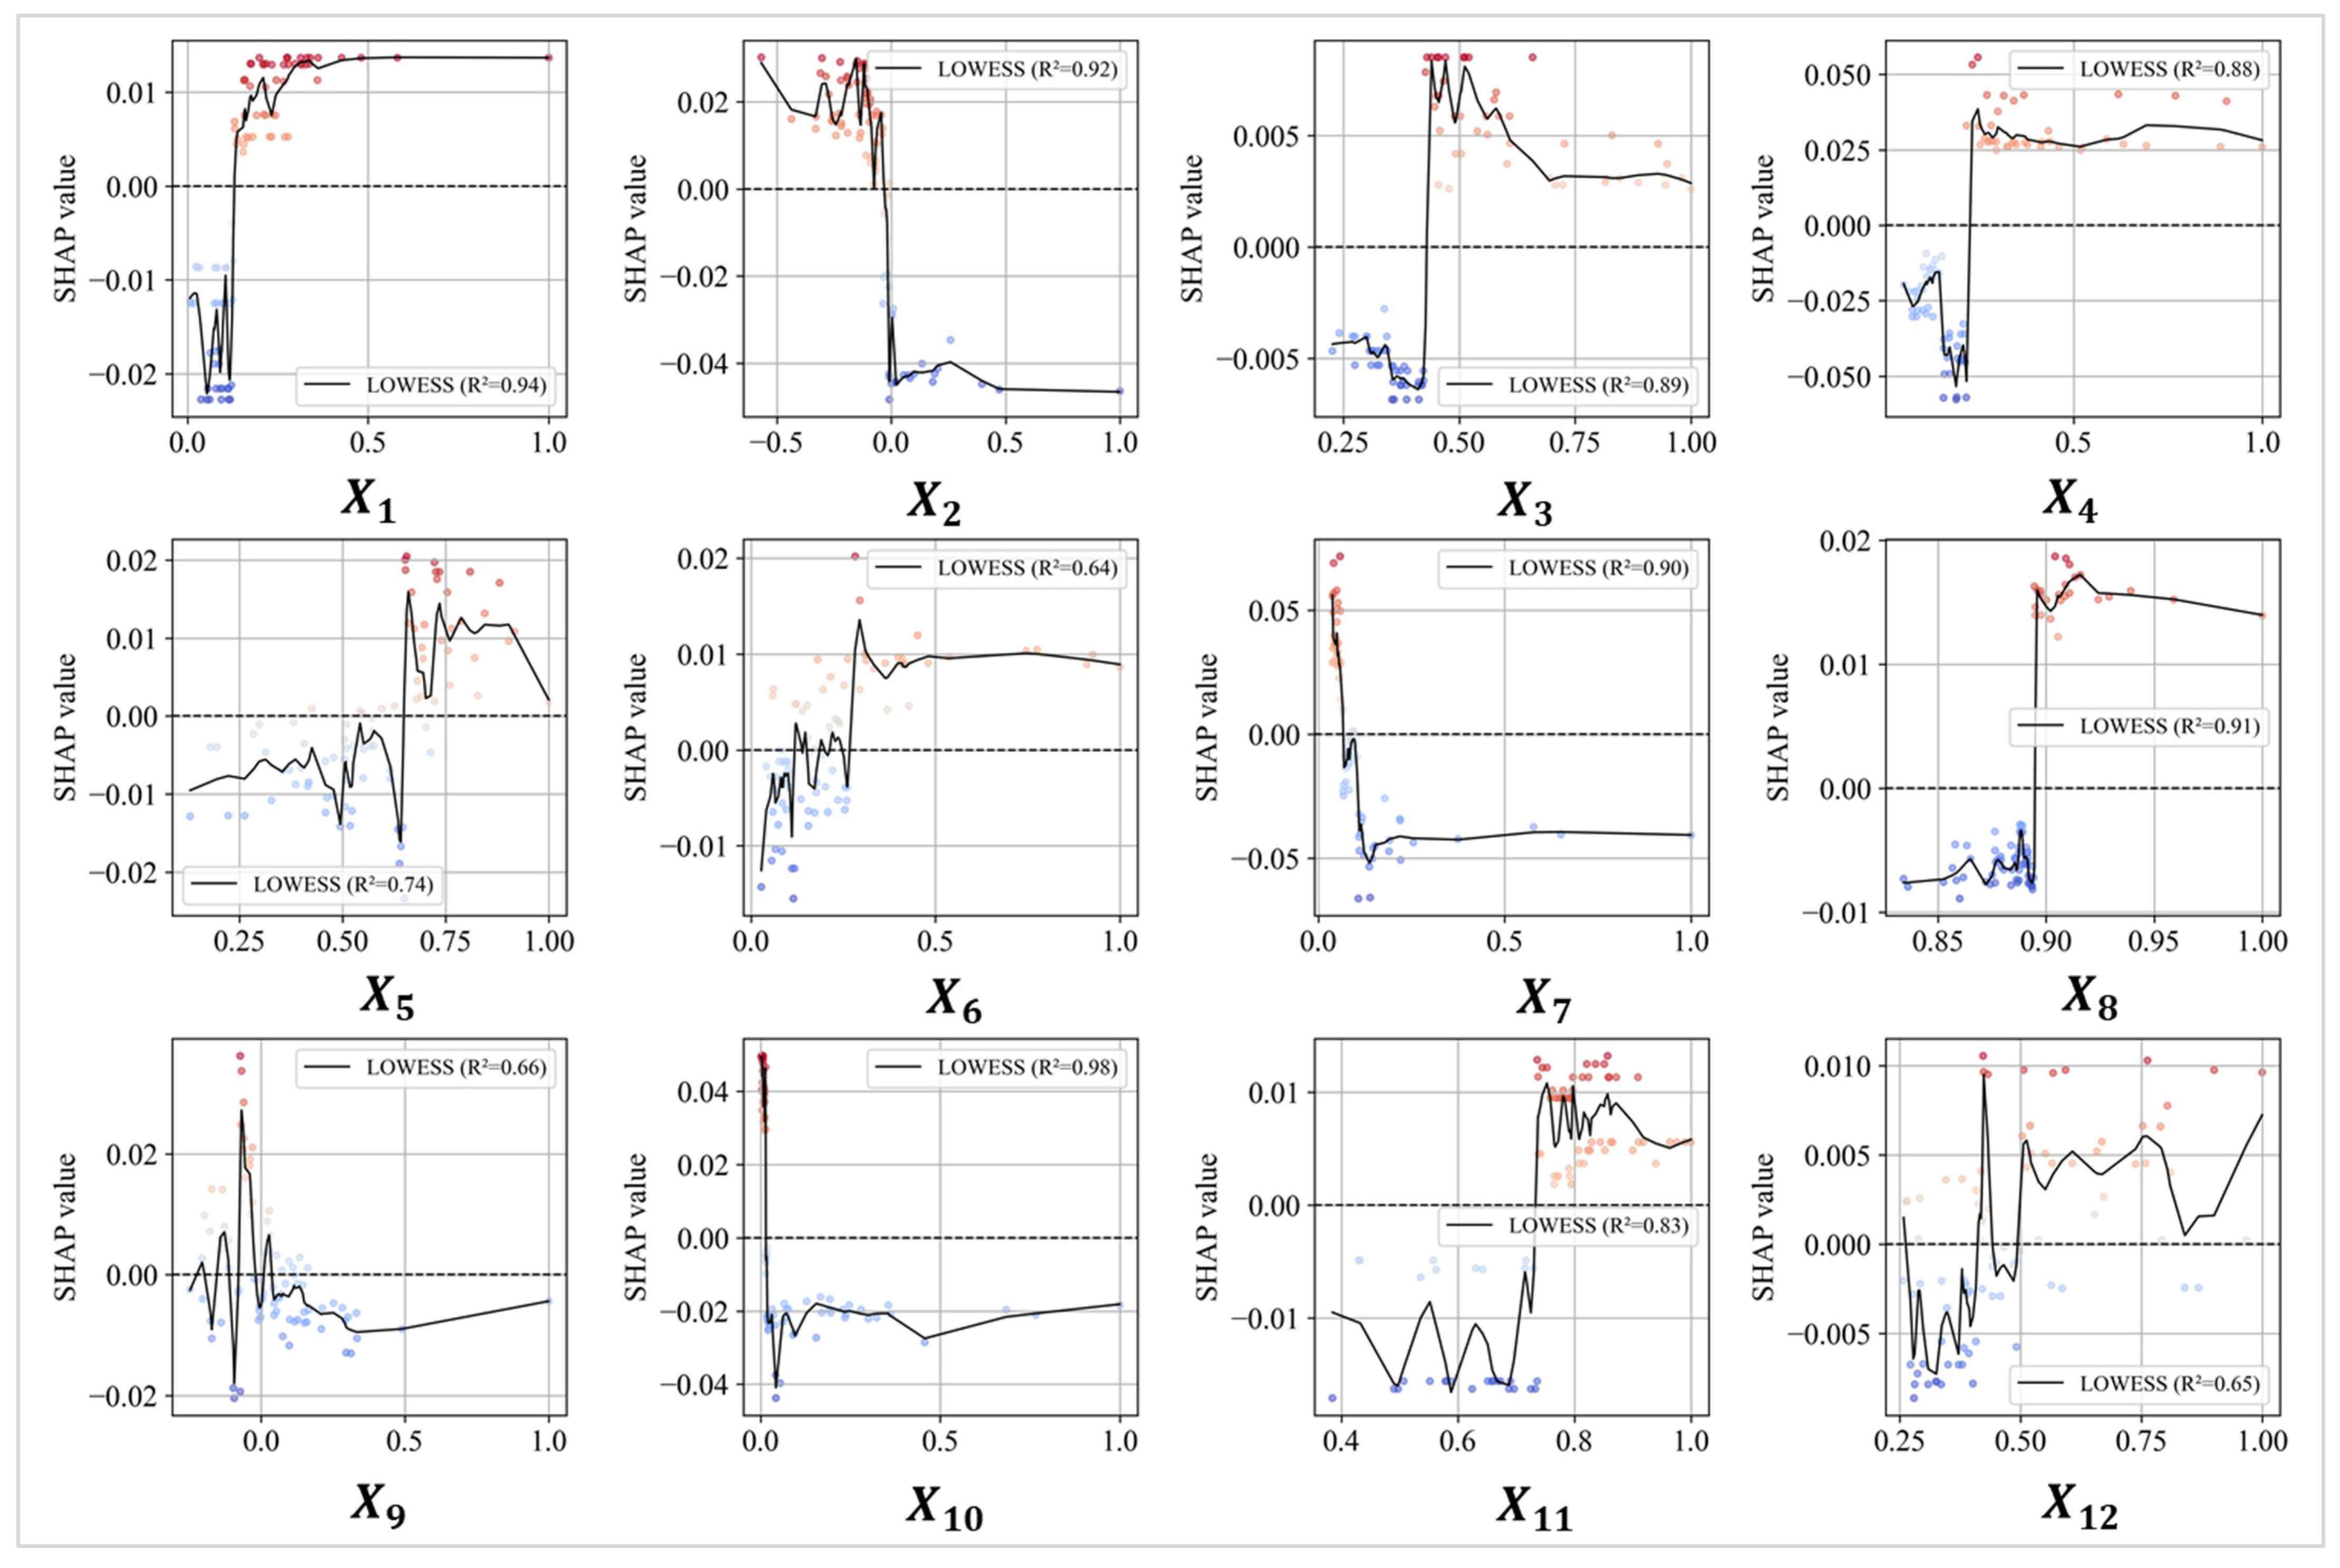
This study used four explainable machine learning models, and, after comparison in Table 3, LightGBM was ultimately chosen. Figure 7 summarizes the machine learning (LightGBM) analysis results, revealing that the mechanisms of influencing factors exhibit exceptionally complex characteristics. Table 4 shows the statistical parameters of the SHAP factor, which displays the trajectory of changes from the minimum to the maximum value. This study indicates that most influencing factors simultaneously possess the dual potential to promote (positive) and inhibit (negative) commercial land mismatch, demonstrating a significant “mixed” characteristic. This mixed characteristic indicates that no factor is inherently “good” or “bad”; its role within the commercial land allocation system is highly contingent upon the specific context and stage of development. The analysis of the direct impact strength of factors shows that per capita gross domestic product ( X 4 ) exerts the strongest influence, followed sequentially by satellite night light ( X 7 ), carbon emission ( X 10 ), and floating population ( X 2 ). They are key factors and have a comprehensive and dominant influence on the mismatch between commercial land use and consumer demand, as well as on spatial patterns. Resident population ( X 1 ), particulate matter 2.5 ( X 11 ), growth rate of gross domestic product ( X 8 ), proportion of tertiary industry ( X 5 ), and growth rate of tertiary industry investment ( X 9 ) are important factors, playing noticeable regulatory roles in shaping the mismatch relationship in specific aspects or regions. Per capita disposable income ( X 6 ), fiscal self-sufficiency rate ( X 3 ), and relief degree of land surface ( X 12 ) have minimal direct influence and can be categorized as auxiliary factors.

3.4.2. Nonlinear Effect Analysis of Influence Factors

Figure 8 illustrates the pathways of different factors, revealing significant nonlinear characteristics in their effects, with most factors exhibiting threshold effects and transition nodes. Some factors exhibit similarities in their mechanisms of action, and they are summarized into four categories based on comparative analysis. The first category is the S-type factors, including resident population ( X 1 ), per capita disposable income ( X 3 ), per capita gross domestic product ( X 4 ), proportion of tertiary industry ( X 5 ), growth rate of gross domestic product ( X 8 ), and particulate matter 2.5 ( X 11 ). The nature and intensity of their functions undergo continuous transformation along with the level of development. At low values, they primarily exert a negative effect. As the value increases, the inhibitory effect slowly decreases or remains overall stable in fluctuations. They primarily exert a positive effect at high values. As the value increases, the promoting effect slowly decreases or remains overall stable in fluctuations. There are obvious turning points in the conversion of positive and negative effects, but the threshold values of different factors vary slightly. The second category is L-type factors, including satellite night light ( X 7 ) and carbon emission ( X 10 ). They exert a positive effect at low values and a negative effect at high values, reflecting the diminishing marginal returns or negative effects of excessive agglomeration in factor influence. The third category is Z-type factors, which are the exact opposite of S-type factors. The floating population ( X 2 ) exhibits a promoting effect at low values and an inhibiting effect at high values, with zero serving as the threshold for the shift between positive and negative influence. The fourth category comprises fluctuating factors, which undergo significant changes and exhibit environmental sensitivity. This group consists of three members, each exhibiting distinct fluctuation patterns. The fiscal self-sufficiency rate ( X 6 ) exhibits fluctuating negative effects at low values, has minimal impact at medium values, and demonstrates stable positive effects at high values. The growth rate of tertiary industry investment ( X 9 ) fluctuates sharply around zero at low values, shows V-shaped fluctuations at high values, and consistently displays negative effects. The relief degree of land surface ( X 12 ) primarily exhibits negative effects at low values and fluctuates in a U-shaped pattern. At high values, it primarily exhibits a positive effect and shows W-shaped fluctuations. In summary, S-type and Z-type factors indicate the existence of distinct developmental “thresholds” or “turning points”, where the policy implications of the same factor are completely opposite on either side of the threshold. The L-factor serves as a warning against the principle that “too much of a good thing can be bad”, indicating that its positive contribution has a ceiling. The effect of the fluctuating factor is highly unstable, suggesting its impact heavily depends on other contextual conditions.
By examining the nonlinear pathways of factor interactions, we can identify the inflection points of factor forces. The growth rate of tertiary industry investment ( X 9 ) and the relief degree of land surface ( X 12 ) exhibit no distinct inflection points, with their effects remaining in a state of significant fluctuation. The seven factors share only one threshold value, all being property reversal nodes, yet their threshold values differ from one another. The threshold value for floating population ( X 2 ) is near zero, while that for per capita gross domestic product ( X 4 ) is at 0.25. The threshold for satellite night light ( X 7 ) is around 0.15, and both the growth rate of gross domestic product ( X 8 ) and particulate matter 2.5 ( X 11 ) are near 0.9. The threshold for carbon emission ( X 10 ) is approximately 0.1. Their effects before and after the inflection points are opposite in nature, with stable intensity. Notably, the proportion of tertiary industry ( X 5 ) differs from them, exhibiting unstable factor effects before and after the inflection point (0.65), remaining highly volatile throughout. Three factors possess two inflection points, demonstrating high complexity. For resident population ( X 1 ), there are two inflection points. The first occurs near 0.2, marking the threshold where the nature of the force reverses; the second inflection point is near 0.5, after which the force remains stable and unchanged. Per capita disposable income ( X 3 ) has two inflection points: the first is near 0.4, marking the threshold for effect reversal; the second is near 0.75, and the effect remains stable thereafter. For the fiscal self-sufficiency rate ( X 6 ), there are two inflection points: the first is near 0.3, representing a qualitative transition; the second is near 0.4, after which the effect remains at a high positive level.

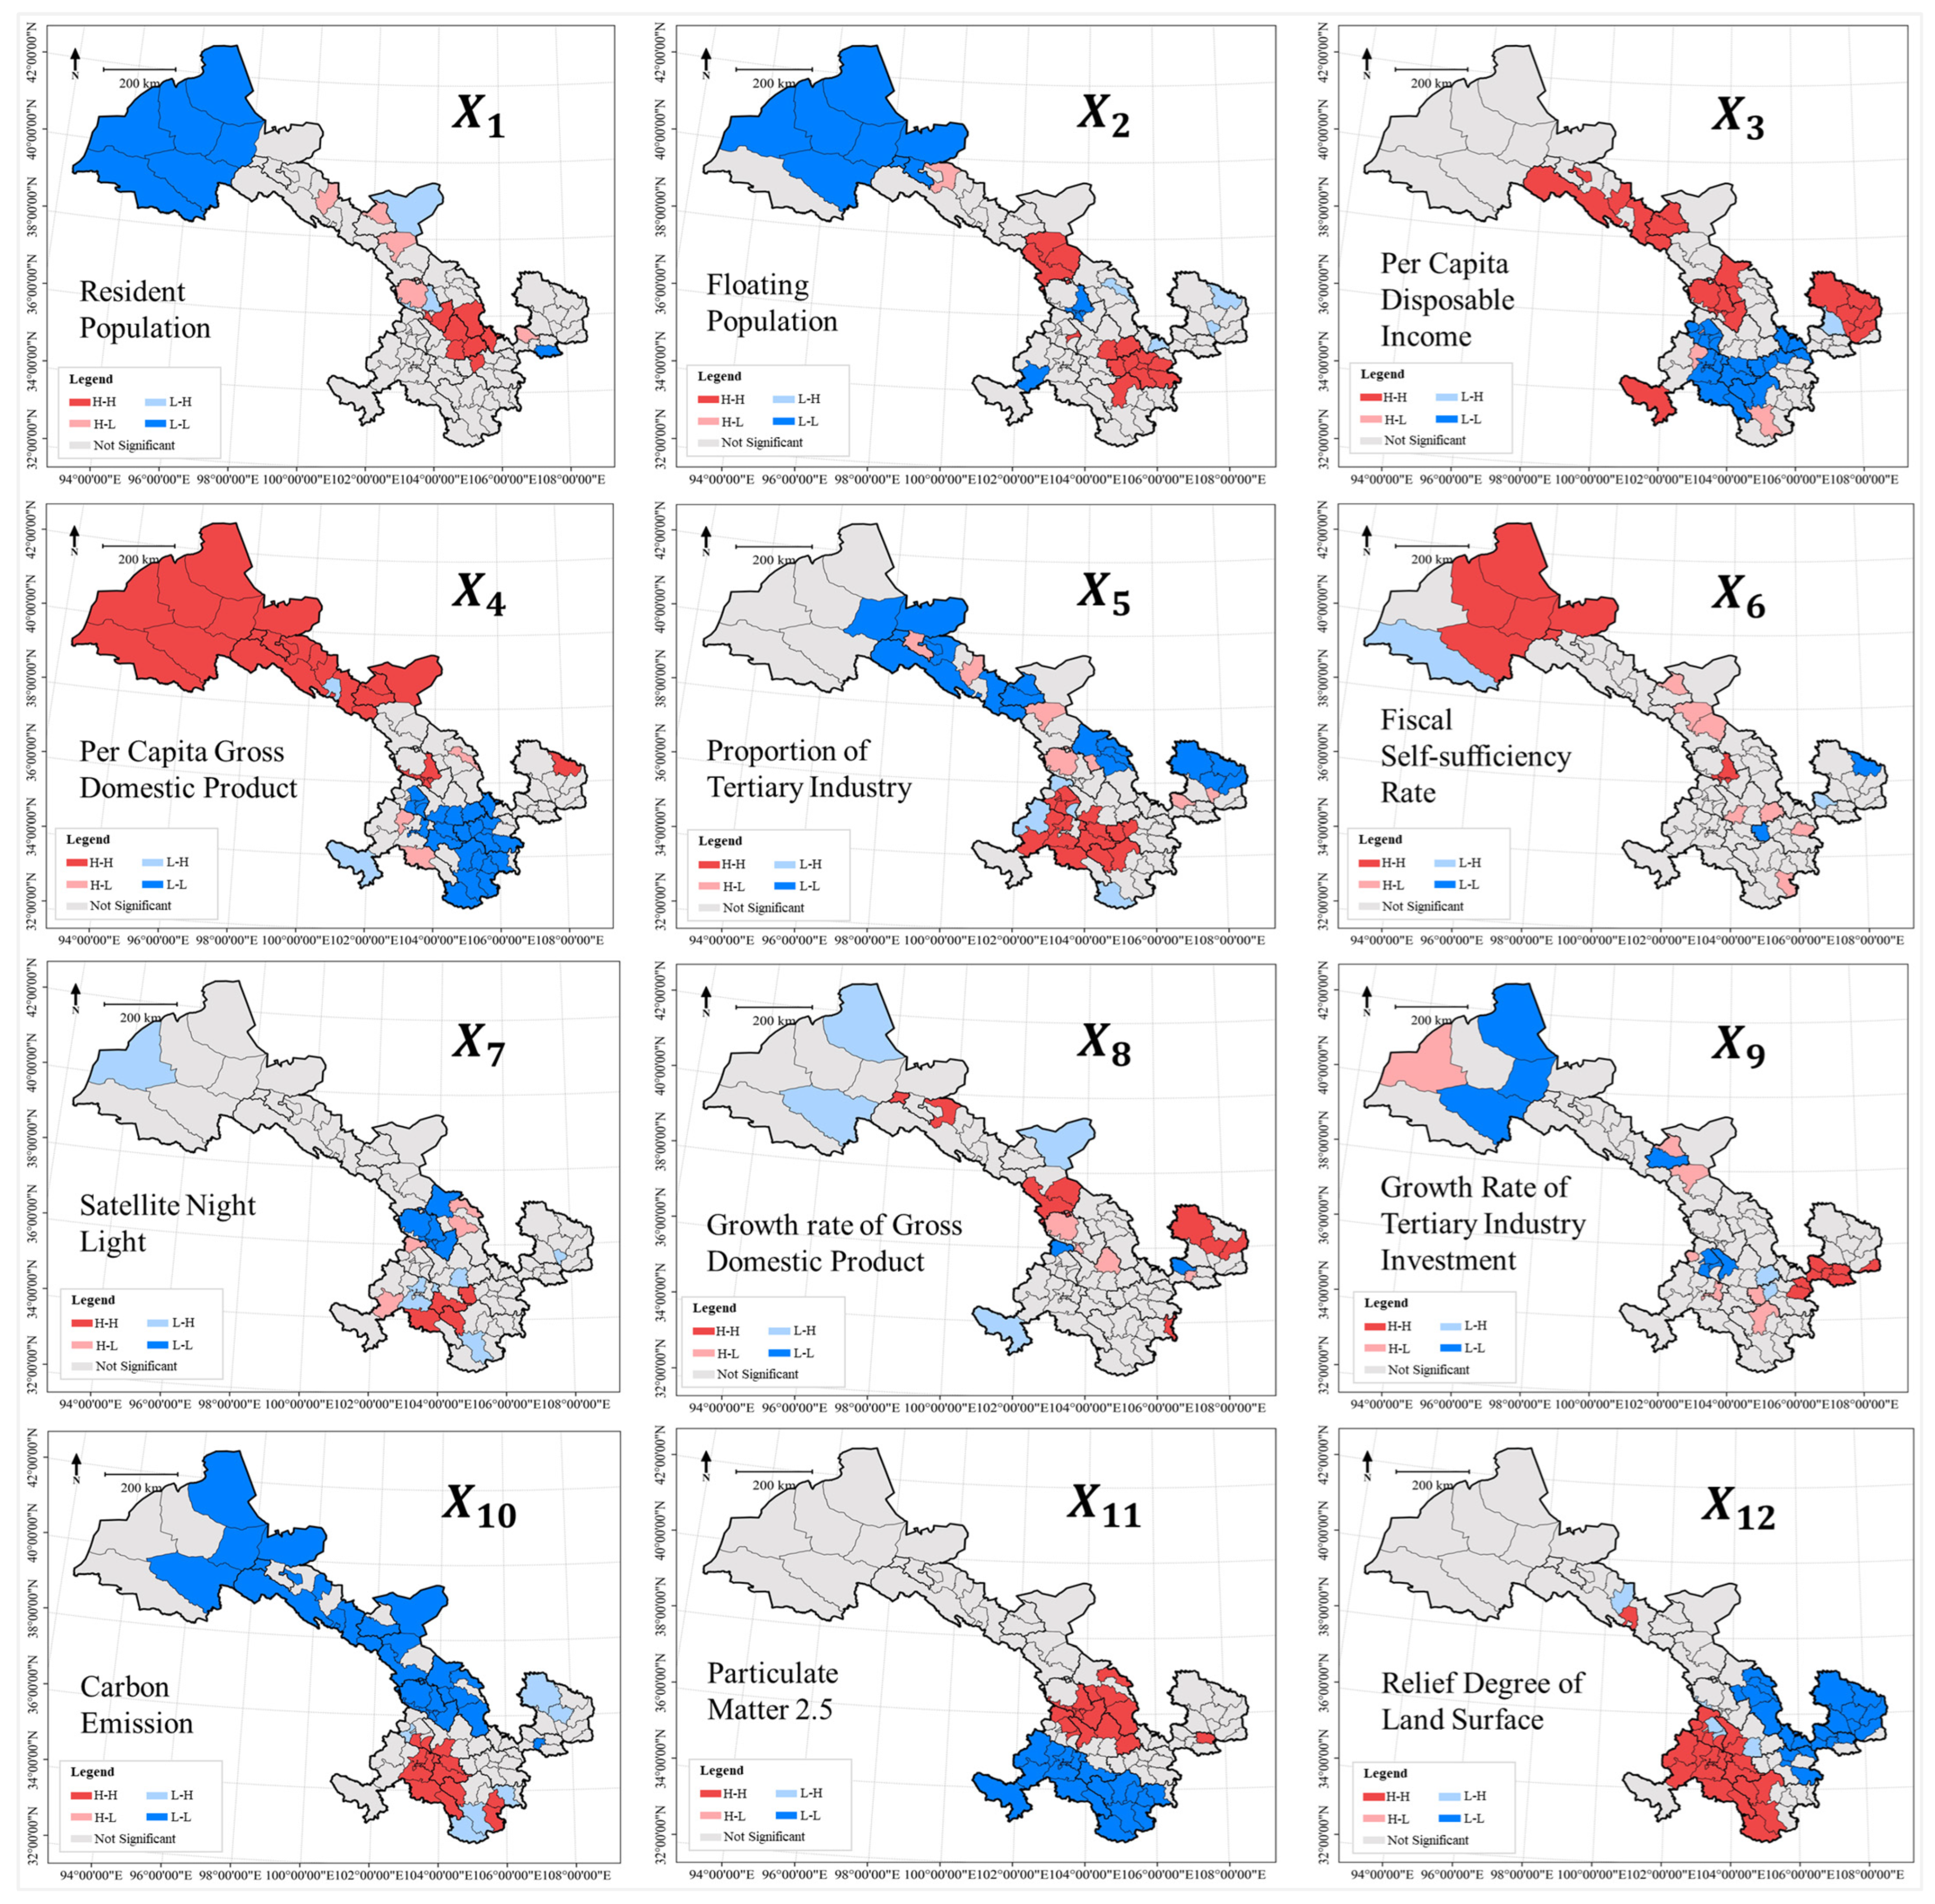
3.4.3. Spatial Effect Analysis of Influence Factors

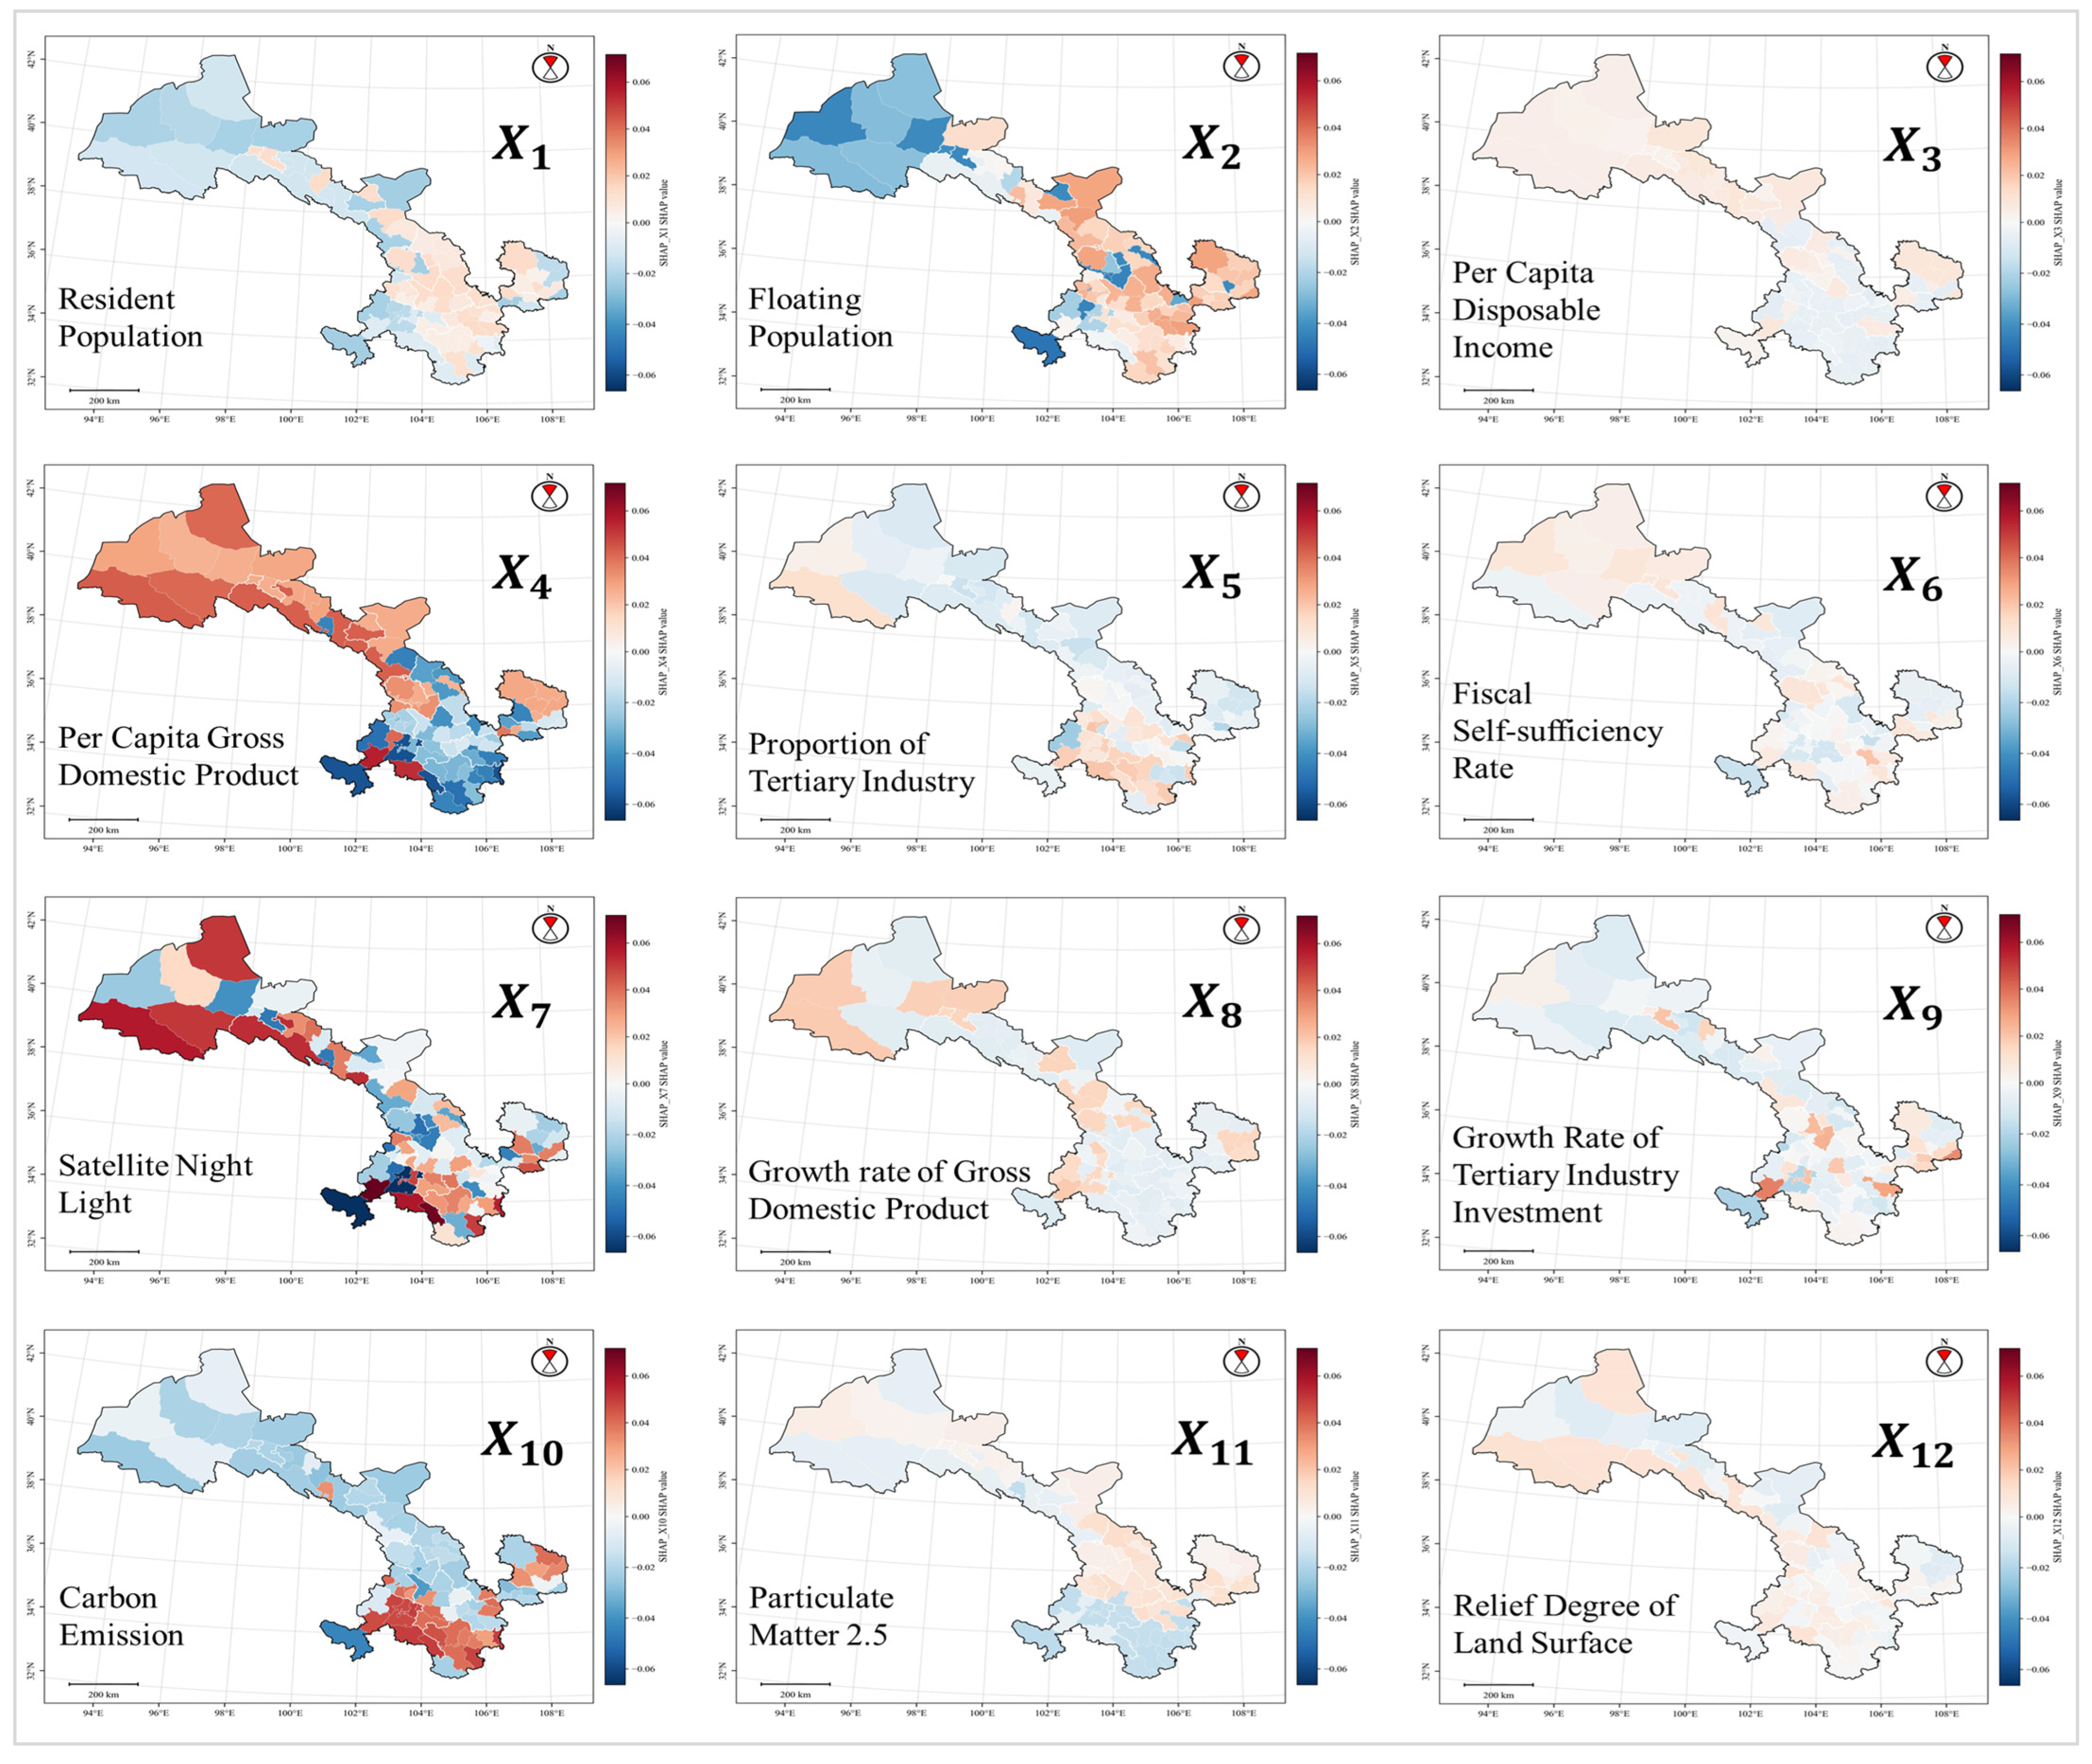
The spatial heterogeneity of factor influence is remarkably pronounced, with the same factor potentially playing entirely different roles across different regions. Table 5 reveals significant spatial heterogeneity in factor influence, with extremely large coefficients of variation, particularly for the growth rate of gross domestic product ( X 8 ), satellite night light ( X 7 ), carbon emission ( X 10 ), and floating population ( X 2 ). Figure 9 illustrates the conditions of spatial non-stationarity in factor effects. For the resident population ( X 1 ), the geographic coverage of positive and negative impacts is relatively similar, with negative impacts concentrated in the western regions, particularly the Hexi Corridor and the Gannan ethnic minority-populated areas. For the floating population ( X 2 ), positive effects cover most regions, while negative effects are confined to the westernmost end of the Hexi Corridor and the southernmost tip of ethnic minority settlements. For per capita disposable income ( X 3 ), the spatial distribution of positive and negative effects is similarly balanced, with positive effects clustered along the urban belt of the Hexi Corridor and negative effects concentrated in the southern regions of Gansu Province. The spatial effect of per capita gross domestic product ( X 4 ) is similar to that of per capita disposable income ( X 3 ) but exhibits greater influence. The negative effects of the proportion of tertiary industry ( X 5 ) extend across a broader geographical area, primarily concentrated in the Hexi Corridor, provincial capitals, Qingyang, and other regions in the northeastern part of Gansu Province. Positive effects are concentrated in the western and southern areas with concentrated ethnic minority populations. The fiscal self-sufficiency rate ( X 6 ) exerts a positive influence at the northern end of the Hexi Corridor urban cluster while exhibiting a mixed impact of both positive and negative effects in other regions. Satellite night light ( X 7 ) tends to exert a mixed influence across the province, but its impact is significantly greater than that of other factors. The growth rate of gross domestic product ( X 8 ) and the growth rate of tertiary industry investment ( X 9 ) both exert a negative influence in most regions, with higher concentrations observed in the Hexi Corridor and the southeastern Gansu urban belt. Carbon emissions ( X 10 ) have a negative impact in most regions, particularly in the Hexi Corridor urban belt and provincial capital metropolitan areas. Positive-effect clusters are concentrated primarily in the southern regions inhabited by ethnic minorities. Both particulate matter 2.5 ( X 11 ) and relief degree of land surface ( X 12 ) exhibit mixed influences, with positive and negative forces showing a north–south divergence. The negative influence of the former is concentrated in the southern ethnic minority areas, while its positive influence is concentrated in the north. Conversely, the latter exhibits a greater tendency for positive influence in the south, with negative effects concentrated in the north, particularly along the Hexi Corridor urban belt.
Table 5 shows that all factors exhibit positive Moran’s I, indicating positive spatial autocorrelation in SHAP values. Notably, only floating population ( X 1 ), satellite night light ( X 7 ), growth rate of gross domestic product ( X 8 ) are insignificant, while fiscal self-sufficiency rate ( X 6 ) and growth rate of tertiary industry investment ( X 9 ) exhibit marginal significance, which may be related to the small sample size in this study. Particulate matter 2.5 ( X 11 ) exhibits the highest level of spatial autocorrelation, with HH and LL forming adjacent spatial clusters in southern Gansu Province. The former includes Chengguan, Qilihe, Xigu, Anning, Honggu, Gaolan, Yuzhong, Baiyin, Jingyuan, Huining, Jingchuan, Anding, Tongwei, Lintao, Yongjing, Guanghe, and Dongxiang; the latter comprised Minxian, Wudu, Chengxian, Wenxian, Tanchang, Kangxian, Xihe, Lixian, Huixian, Hezuo, Lintan, Zhuoni, Zhouqu, Diebu, Maqu, Luqu, and Xiahe. The spatial autocorrelation level of relief degree of land surface ( X 12 ) is similar to that of particulate matter 2.5 ( X 11 ), but the members and distribution of HH and LL spatial clubs differ significantly. Per capita disposable income ( X 3 ), per capita gross domestic product ( X 4 ), and carbon emissions ( X 10 ) also exhibit extremely high spatial correlation. Compared to these variables, other factors show a significantly reduced level of spatial autocorrelation. For per capita disposable income ( X 3 ), counties classified as HH are scattered across the Hexi Corridor and resource-rich areas, including Chengguan, Xigu, Anning, Yongdeng, Gaolan, Yuzhong, and Jinchuan. Counties classified as LL are highly concentrated in ethnic autonomous regions, such as Qinan, Gangu, Wushan, Zhangjiachuan, Zhuanglang, Jingning, and Zhangxian. For per capita gross domestic product (PGDP), counties classified as HH are highly concentrated in the urban belt of the Hexi Corridor, including Chengguan, Qilihe, Xigu, Anning, and Honggu. Counties classified as LL are also highly concentrated in ethnic autonomous regions, such as Qinzhou, Maiji, Qinan, Gangu, Wushan, and Jingning. For carbon emission (CE), counties classified as HH are highly concentrated in ethnic autonomous regions, including Weiyuan, Zhangxian, Minxian, Chengxian, Tanchang, Kangxian, Kangle, Hezheng, Lintan, Zhuoni, Zhouqu, and Diebu. Counties classified as LL are located in the urban belt of the Hexi Corridor and the provincial capital metropolitan area, including Chengguan, Qilihe, Xigu, Anning, Honggu, Yongdeng, and Gaolan. For the floating population ( X 2 ), Qinzhou, Maiji, Qingshui, Qinan, Gangu, Wushan, Liangzhou, Gulang, Tianzhu, Tongwei, Longxi, Lixian, and Guanghe are HH members, clustering around the provincial capital metropolitan area and the Guanzhong urban agglomeration; Chengguan, Qilihe, Xigu, Anning, Gaolan, Jiayuguan, Suzhou, Jinta, Guazhou, Subei, Yumen, Dunhuang, and Luqu are LL members, all concentrated in the northwestern corner. For the proportion of tertiary industry ( X 5 ), Gangu, Wushan, Weiyuan, Zhangxian, Minxian, Tanchang, Lixian, Linxia, Linxia, Guanghe, Hezheng, Dongxiang, Hezuo, Zhuoni, Diebu, and Luqu are HH members, highly clustered in ethnic minority autonomous regions; Jiayuguan, Jinchuan, Yongchang, Pingchuan, Jingyuan, Jingtai, Sunan, Gaotai, Shandan, Jinta, Yumen, Qingcheng, Huanxian, Huachi, and Heshui form three small clusters in the Hexi Corridor urban belt, the provincial capital metropolitan area, and resource-rich regions, respectively (Figure 10).

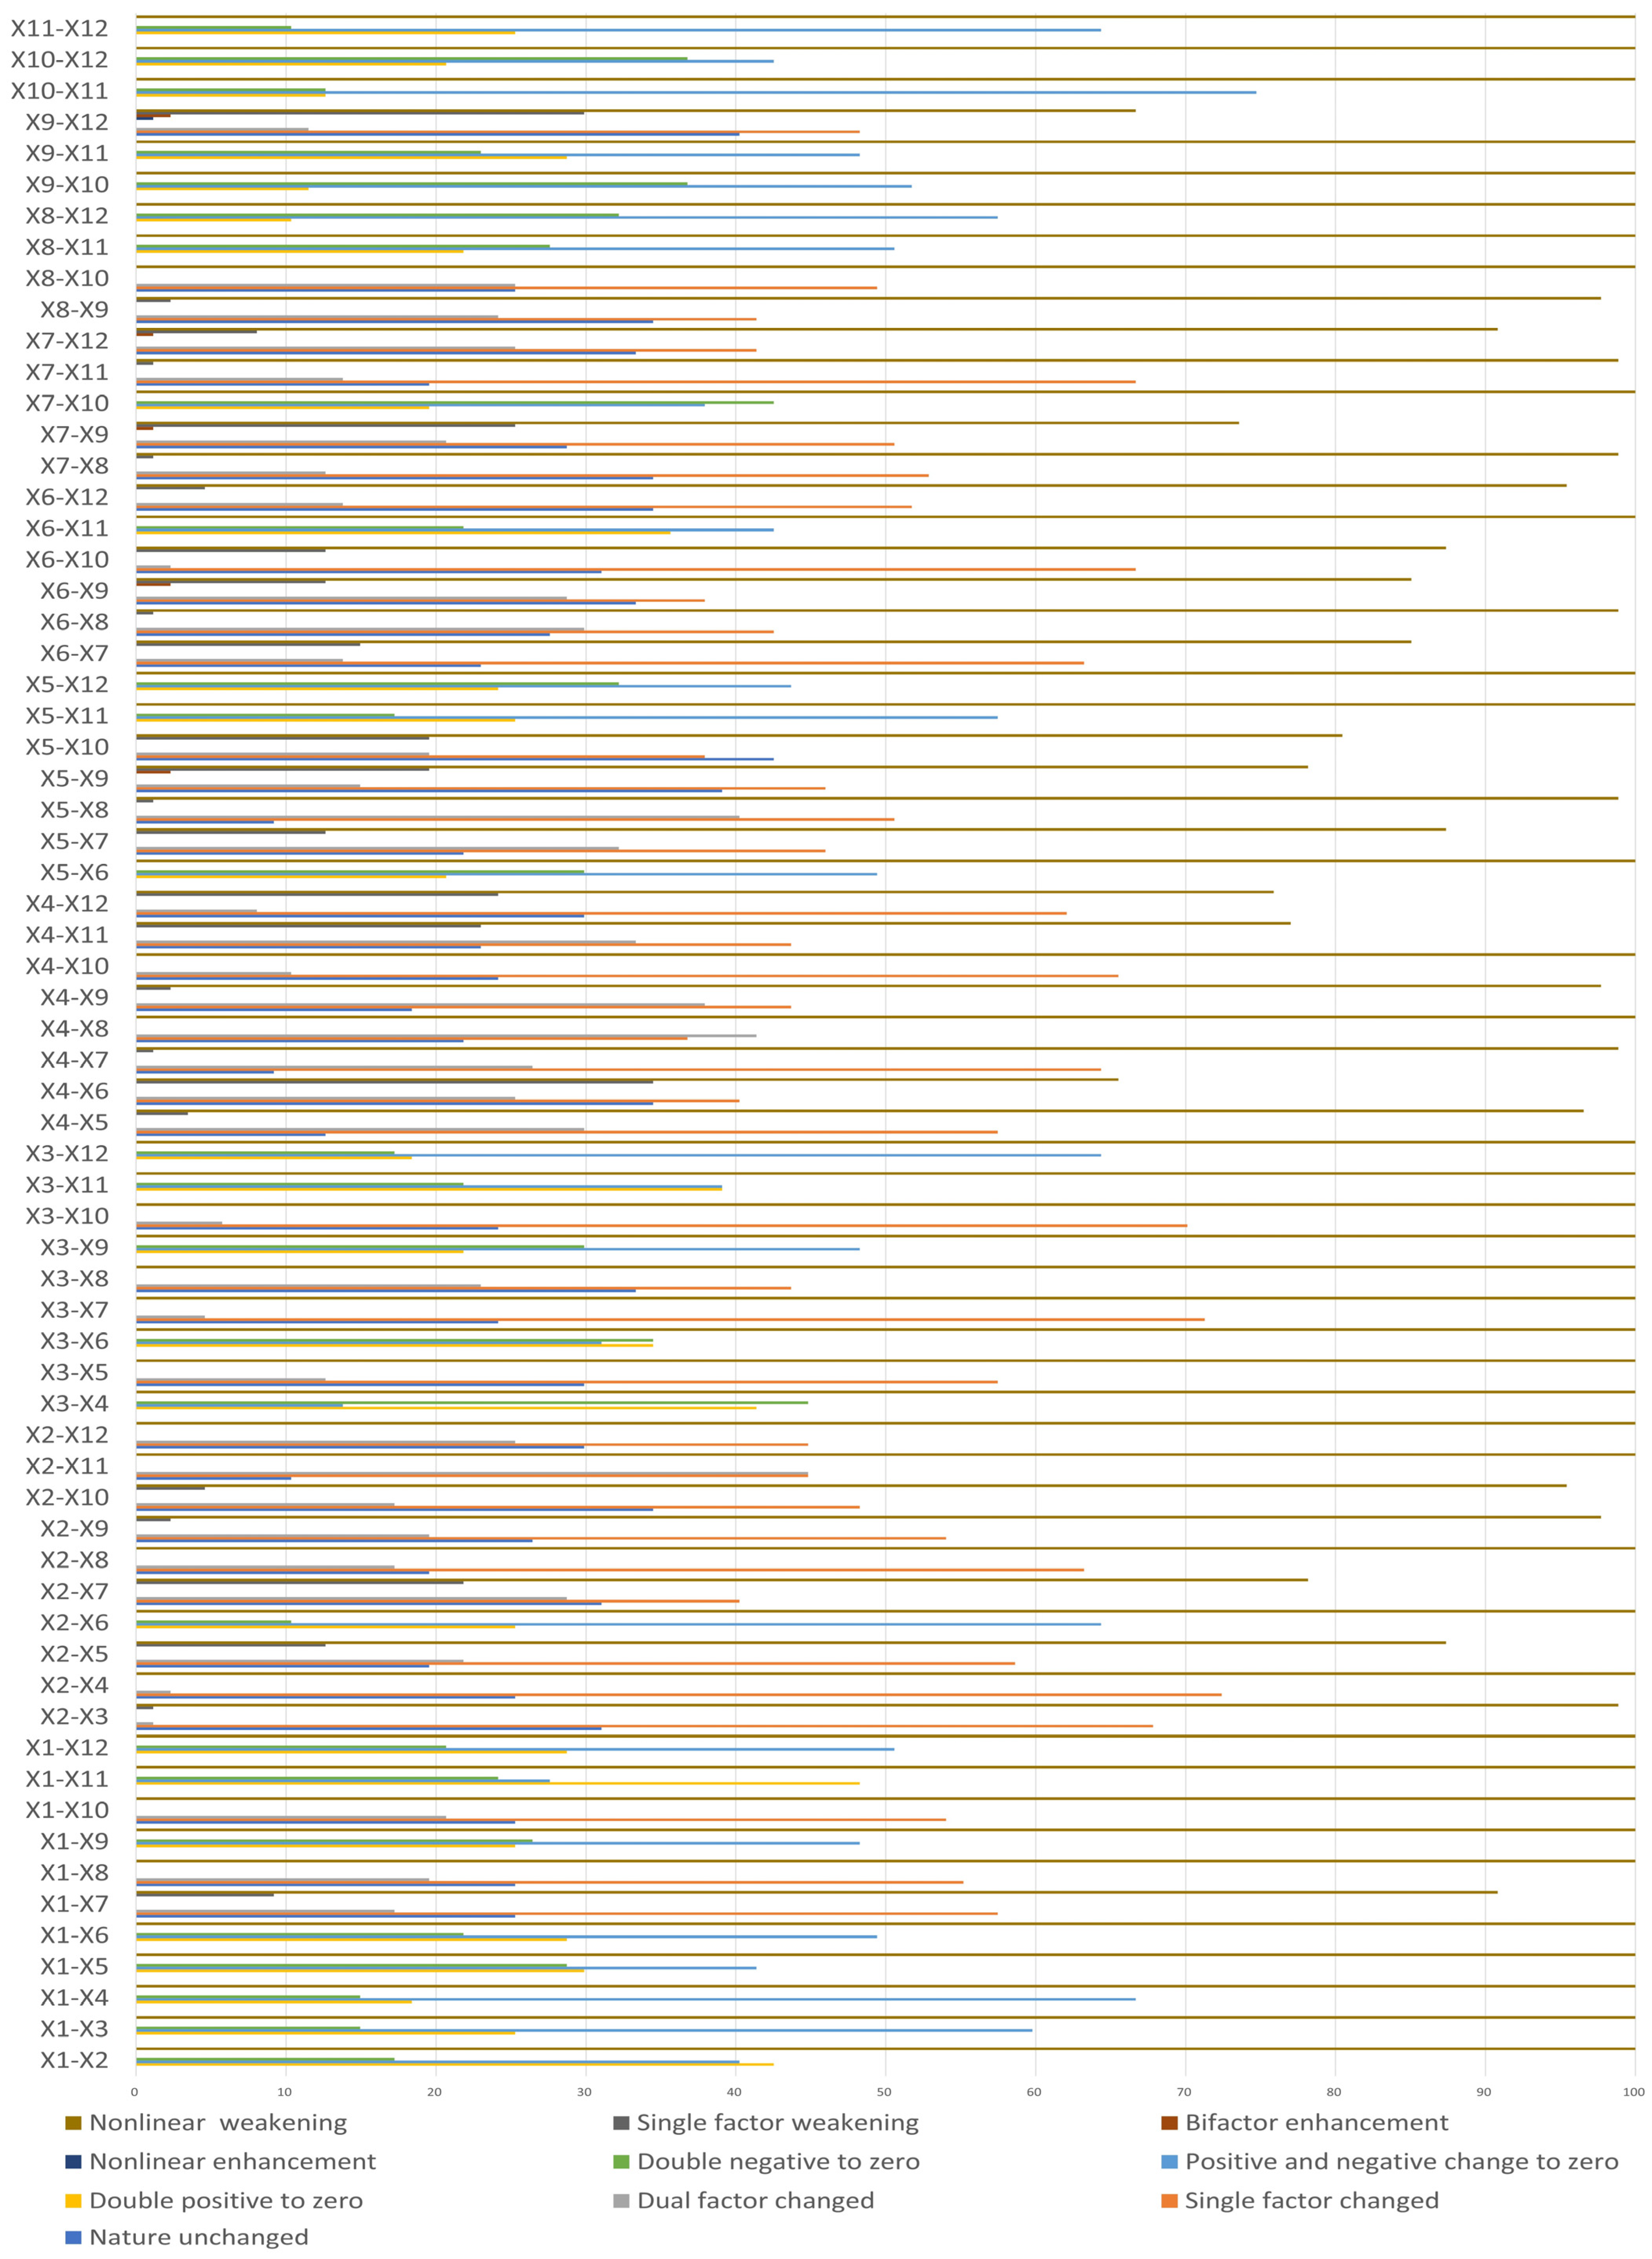
3.4.4. Interaction Effect Analysis of Influence Factors

From a factor nature perspective: the proportion of single factor changed is the highest, reaching 31.97%. Most of them are factor pairs composed of X 3 (per capita disposable income) and X 4 (per capita gross domestic product). For example, the frequency of three factor pairs exceeds 60 times, including X 2 X 4 (floating population ∩ per capita gross domestic product), X 3 X 7 (per capita disposable income ∩ satellite night light), X 3 X 10 (per capita disposable income ∩ carbon emission). There are 12 factor pairs with more than 50 occurrences. For example, X 2 X 3 (floating population ∩ per capita disposable income), X 4 X 5 (per capita gross domestic product ∩ proportion of tertiary industry), X 4 X 7 (per capita gross domestic product ∩ satellite night light), X 4 X 10 (per capita gross domestic product ∩ carbon emission), X 4 X 12 (per capita gross domestic product ∩ relief degree of land surface). Positive and negative changes to zero come second, reaching 19.17%. The frequency of X 10 X 11 (carbon emission ∩ particulate matter 2.5) is the highest, reaching 65. In addition, seven factors have a frequency exceeding 50, including X 1 X 4 (resident population ∩ per capita gross domestic product), X 2 X 6 (floating population ∩ fiscal self-sufficiency rate), X 11 X 12 (particulate matter 2.5 ∩ relief degree of land surface), etc. Property unchanged also has a comparative advantage, reaching 16.16%. There are three factor pairs with a frequency exceeding 30, including X 5 X 10 (proportion of tertiary industry ∩ carbon emission), X 5 X 9 (proportion of tertiary industry ∩ growth rate of tertiary industry investment), X 9 X 12 (growth rate of tertiary industry investment ∩ relief degree of land surface). The proportion of double factor changed, double positive to zero, and double negative to zero is close, both around 10% (Figure 11 and Supplementary Materials S1 and S2).
In terms of intensity, non-linear fatigue has an absolute advantage, accounting for 95.19%. The proportion of single-factor weakness is 4.65%. There are a total of 27 factor pairs, of which 5 have a frequency exceeding 20, including X 4 X 6 (per capita gross domestic product ∩ Fiscal Self-sufficiency Rate), X 4 X 11 (per capita gross domestic product ∩ Particulate Matter 2.5), X 4 X 12 (per capita gross domestic product ∩ Relief Degree of Land Surface), X 9 X 12 (Growth Rate of Tertiary Industry Investment ∩ Relief Degree of Land Surface), X 9 X 7 (Growth Rate of Tertiary Industry Investment ∩ Satellite Night Light). The combined proportion of non-linear enhancement and bifactor enhancement is less than 1%. The members of the former are only X 9 X 12 (growth rate of tertiary industry investment ∩ relief degree of land surface), The latter has five factor pairs, including X 5 X 9 (proportion of tertiary industry ∩ growth rate of tertiary industry investment), X 5 X 9 (proportion of tertiary industry ∩ growth rate of tertiary industry investment), X 6 X 9 (fiscal self-sufficiency rate ∩ growth rate of tertiary industry investment), X 12 X 9 (relief degree of land surface ∩ growth rate of tertiary industry investment), X 7 X 9 (satellite night light ∩ growth rate of tertiary industry investment), and X 12 X 7 (relief degree of land surface ∩ satellite night light).
Overall, less than 20% of factor interactions can maintain their properties unchanged, and most factor interactions exhibit antagonistic effects rather than synergistic effects. Their impact on the mechanism of factor action cannot be ignored. The planning inspiration for interactive effects is that decision-makers must carefully choose and plan different combinations of measures in the policy design process. Improper combinations not only make it difficult to achieve expectations but may even lead to completely opposite results.

4. Discussion

4.1. Policy Implication

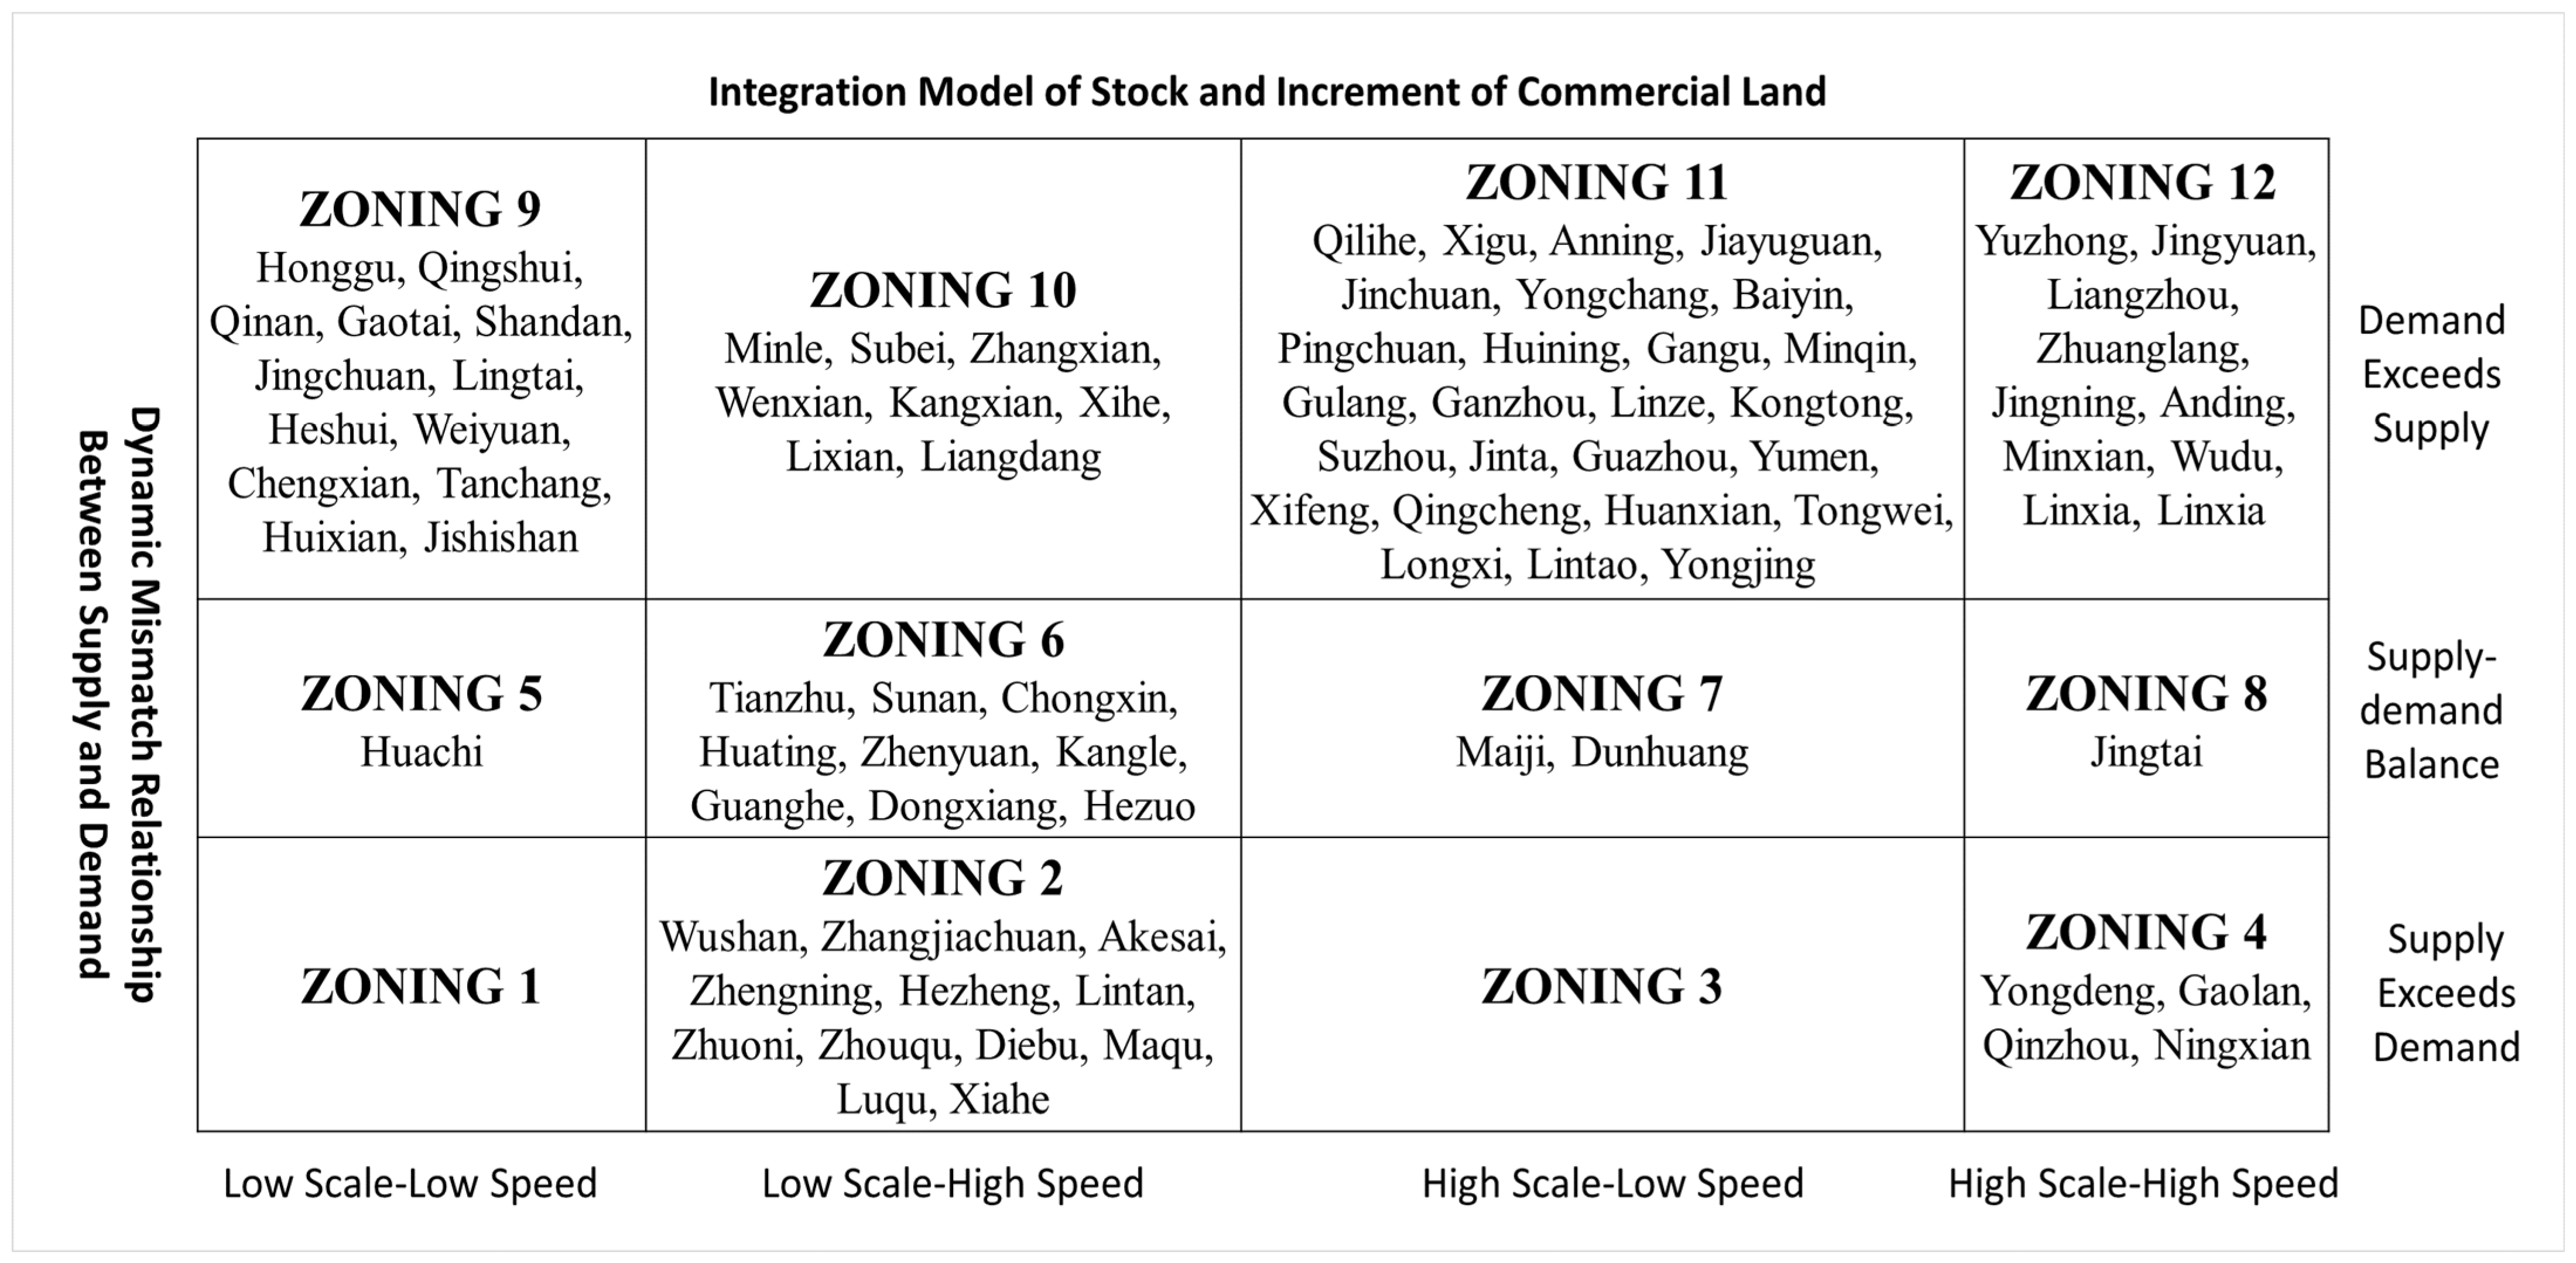
The allocation of commercial land, consumer demand, and mismatches all demonstrate significant spatial heterogeneity, which corroborates the findings of previous scholars [50]. This study identifies four distinct patterns in commercial land allocation, that is, high-scale–high-speed, high-scale–low-speed, low-scale–high-speed, and low-scale–low-speed, while mismatches are categorized into three types: demand exceeds supply, supply–demand balance, and supply exceeds demand. Based on these categorizations, 12 policy zonings are delineated. It is recommended that Gansu Province adopt a zoning approach to position its 87 counties within a theoretical framework of 12 policy zonings (Figure 12). For different zonings, differentiated management policies that are more targeted and actionable should be established based on the positioning and characteristics of their members. Additionally, efforts must be accelerated to build a dynamic monitoring system, regularly reassess the supply–demand relationship between commercial land and residential consumption, and promptly adjust zoning plans to better respond to uncertainties in the market and development environment [51]. Whether matching is achieved serves as a critical yardstick for evaluating the rationality of commercial land supply models. Policy design should prioritize addressing mismatch while integrating the effects of influencing factors. For surplus-type mismatch (supply exceeds demand), future supply models should be guided to transition toward high-scale–low-speed and low-scale–low-speed patterns in accordance with the development environment and demand conditions. Conversely, for shortage-type mismatch (demand exceeds supply), supply models should be promoted to shift toward low-scale–high-speed and high-scale–high-speed patterns as much as possible. This will ultimately drive the dynamic relationship between commercial land and consumer services toward a state of supply–demand balance.
Zonings 1–4 face an oversupply of commercial land, necessitating varying degrees of tightening in retail space allocation and adopting a reduction-oriented development strategy [52]. Policy Zonings 1 and 3 have no members. Commercial land in Zonings 9–12 is in short supply, necessitating varying degrees of relaxation in retail space allocation moving forward. Zonings 5–8 have achieved varying degrees of supply–demand equilibrium, and they can maintain their current commercial space allocation dynamics going forward. Huachi is classified as Zoning 5 and currently maintains a low-level supply–demand equilibrium. Land availability is not the primary constraint on boosting consumption. Future strategies should focus on creating opportunities for consumption upgrades through non-land-use policies such as business format innovation [53]. Tianzhu, Sunan, Chongxin, Huating, Zhenyuan, Kangle, Guanghe, Dongxiang, and Hezuo are classified under Zoning 6. Their commercial land reserves are relatively low, and they will continue to implement a high-growth incremental allocation model in the future. Maiji and Dunhuang are classified as Zoning 7. Their consumer markets are stable, and in principle, no new large-scale commercial land use will be added, with a focus on renewal of existing stock. Existing commercial land will focus on micro-upgrades and operational optimization, enhancing supporting facilities such as parking, greenery, and public spaces to elevate the consumer experience. Efforts will be continuously strengthened to maintain commercial brands and cultivate neighborhood ambiance [54]. And they should also maintain flexibility to respond to potential future downturns. Jingtai falls under Zoning 8, where supply and demand are well-balanced, positioning it in a golden period of development. It should maintain the current pace of land supply in the future, expanding both existing and new land reserves simultaneously, while focusing on structural optimization and quality enhancement. And it is recommended to establish a dynamic monitoring system as soon as possible to prevent potential imbalances between supply and demand for commercial land and residential consumption in the future.
Wushan, Zhangjiachuan, Akesai, Zhengning, Hezheng, Lintan, Zhuoni, Zhouqu, Diebu, Maqu, Luqu, and Xiahe are classified as Zoning 2. Their commercial land supply is already excessive yet continues to expand rapidly. Future measures should be implemented to strictly control the incremental supply of commercial land. The rationality of consumer market demand and commercial land-use planning should be reassessed, and, based on the evaluation findings, the transformation and renovation of existing commercial land should be promoted [55]. The core contradiction they face is that, against the backdrop of an already evident surplus in commercial land inventory, their supply scale continues to grow rapidly, posing significant risks of exacerbating supply–demand imbalances, reducing land-use efficiency, and accumulating financial risks. It is recommended that they implement incremental supply management as soon as possible through a “flexible freeze” and “negative list” approach. The conventional commercial land supply model based on traditional planning indicators or growth expectations should be immediately stopped. Any new commercial land development project must undergo a special approval process based on a detailed market demand assessment report, with efficiency metrics such as per capita commercial floor area, vacancy rates, and sales per unit area forming the core of the decision-making process. Large commercial complexes, traditional wholesale markets and other business types that are prone to oversupply are included in the negative list of “land supply prohibition”. And a comprehensive coupling assessment between commercial spatial planning and consumer demand should be initiated. Third-party institutions may be commissioned to recalculate the total volume and structure of medium-to-long-term commercial service demand in counties based on population demographics, consumption capacity, mobility patterns, and the impact of e-commerce competition. The commercial land allocation plan in the county’s overall territorial space planning should be revised based on the assessment results. This revision should specify the timeframe for absorbing existing stock and establish reduction targets, thereby achieving a paradigm shift in planning from “incremental expansion” to “enhancing the quality of existing stock”. Finally, efforts should be made to promote the “functional transformation” and “scenario reinvention” of existing land parcels. A policy that combines incentives and constraints should be established to revitalize the existing stock. For instance, a special fund should be set up to encourage the transformation of idle or inefficient commercial land (buildings) into community public service facilities, cultural and creative spaces, tourism service stations, inclusive elderly care facilities or guaranteed rental housing. Commercial spaces should be guided to upgrade toward experiential, themed, and cultural-tourism integrated directions based on local cultural and tourism resources, creating new consumption scenarios.
Yongdeng, Gaolan, Qinzhou, and Ningxian fall under Zoning 4. Despite high commercial land inventory and oversupply, their incremental development remains in a phase of rapid expansion, posing significant risks of mismatch. They should implement comprehensive reduction policies in the future, prioritizing strict control over the supply of new commercial land and suspending approvals for large-scale commercial projects. For example, a comprehensive ban on new commercial land development and a project approval “circuit breaker” mechanism may be introduced. Except for small-scale community-based commercial projects closely tied to livelihood security, provincial-level directives should mandate a halt to new commercial land supply for the next five years. And they should promote the conversion or upgrading of existing commercial land use (such as repurposing for public services, cultural and creative industries, or mixed-use development), encourage innovation and differentiated development in commercial formats, and further raise the investment threshold and return rates for commercial land use [56,57]. Provincial natural resources departments should take the lead in formulating and issuing mandatory guidelines and annual plans for the functional conversion of existing commercial land. Priority should be given to promoting the withdrawal of commercial land with poor location conditions and high vacancy rates from commercial use, and after evaluation, it should be legally converted into public management, public services, public facilities, green spaces, or policy housing land. A trading mechanism for “commercial land use conversion indicators” should be explored, permitting compensated transfers within or across districts. A tight rein should be put on homogeneous commercial projects. Policies such as tax incentives and subsidies should be leveraged to vigorously support emerging business models including flagship stores, brand concept stores, immersive retail experiences, and nighttime economy initiatives. Commercial facilities should be encouraged to undergo smart and green renovations to enhance output per unit area and experiential value. The investment intensity, output efficiency, and brand level thresholds for newly established commercial projects should be raised.
Honggu, Qingshui, Qinan, Gaotai, Shandan, Jingchuan, Lingtai, Heshui, Weiyuan, Chengxian, Tanchang, Huixian, and Jishishan fall under Zoning 9. Future efforts should focus on expanding both incremental and existing commercial land supply in these areas. This commercial land parcel exhibits characteristics of “insufficient total supply and structural deficiencies”, representing a typical area with lagging supply. The core goal of the policy is to rapidly address the basic service gap while simultaneously optimizing the supply structure. Through dual-track drivers of “precision allocation of incremental resources” and “efficient tapping of existing potential”, the aim is to establish a comprehensive and easily accessible commercial service system. On the one hand, priority should be given to these areas in the allocation of incremental indicators for regional commercial land use, accelerating the development of new community-level basic commercial service spaces to prioritize filling gaps in essential commercial services for residents. Special indicators for “basic commercial service guarantees” may be established for them in the annual allocation of provincial-level territorial spatial planning indicators. Newly allocated land should prioritize projects such as community commercial centers, fresh food supermarkets, and convenient living circles, with a focus on addressing the shortage of commercial service facilities in densely populated areas and newly developed residential zones. A project inventory management system should be implemented to ensure that newly allocated land precisely corresponds to specific livelihood projects. On the other hand, other existing land should be encouraged to be transformed into commercial land (such as industrial to commercial and residential to commercial), and the transformation of existing commercial land should be promoted to improve land use efficiency. It is recommended to expedite the formulation and release of a catalog of existing land types encouraged for conversion to commercial use (e.g., idle industrial plants, warehouses, and inefficient office facilities), and implement a “positive incentive” mechanism for functional transformation of existing land. Eligible projects involving “industrial-to-commercial conversion” and “old-to-new commercial redevelopment” should receive policy support packages, including preferential land premiums, floor area ratio incentives, and streamlined approval procedures. Special funds should be established to support the modernization and business model upgrades of existing outdated commercial facilities, thereby enhancing their service capabilities.
Minle, Subei, Zhangxian, Wenxian, Kangxian, Xihe, Lixian, and Liangdang are classified under Zoning 10. These areas exhibit strong demand but low market share, indicating significant growth potential. Their commercial development is in the early stage of potential activation, with clear growth in consumer demand but a relatively low share of commercial carriers, resulting in the contradiction of “demand without carriers”. The policy objective is to transform latent demand into tangible growth momentum through forward-looking planning and targeted investments. This area should be designated as a key cultivation zone in urban commercial development planning, with specialized development plans formulated. A Specialized Plan and Action Program for Commercial Outlet Development should be formulated, clearly defining the strategic positioning, spatial structure, key sectors, and benchmark projects for commercial space development over the next 5 to 10 years. The planning should emphasize coordination with specialized plans for culture, tourism, and transportation, reserving and pre-controlling commercial development space at key nodes such as scenic gateways and transportation hubs. Enhanced early warning mechanisms should be implemented for monitoring consumer markets and assessing risks associated with commercial land allocation. The scale, structure, flow direction and the trend of integration of online and offline consumption within the region should be monitored in real time through big data means. A health index for the commercial real estate market should be established to provide quarterly early warnings on risks such as vacancy rates, rental fluctuations, and homogenized competition. This will offer data support for dynamically adjusting land supply rhythms and guiding business formats, thereby preventing blind, trend-driven development.
Qilihe, Xigu, Anning, Jiayuguan, Jinchuan, Yongchang, Baiyin, Pingchuan, Huining, Gangu, Minqin, Gulang, Ganzhou, Linze, Kongtong, Suzhou, Jinta, Guazhou, Yumen, Xifeng, Qingcheng, Huanxian, Tongwei, Longxi, Lintao, and Yongjing fall under Zoning 11. In the future, unreasonable restrictions on the expansion of commercial land should be lifted to remove constraints on their consumption growth. Moderate increases in incremental supply should be implemented, with priority given to small-scale and community-oriented high-quality commercial land in underserved areas such as neighborhood commerce and convenience services [58]. At the provincial level, a “flexible adjustment” mechanism should be implemented for them under the control of the total amount of commercial land. According to the annual consumption growth assessment report, moderate increases in land use indicators are permitted in areas “requiring improvement” (such as community commerce, commercial facilities supporting elderly care and childcare services, and integrated convenience service complexes). Priority should be given to safeguarding community commercial land. In the land transfer conditions for newly built residential areas, a certain proportion of community commercial buildings with clear property rights should be forcibly allocated, and their business formats, operational requirements, and unauthorized changes in use should be clearly defined. Efforts should be made to encourage the revitalization of idle spaces and the conversion of existing buildings to incorporate embedded physical spaces for community-oriented businesses such as supplementary markets, breakfast shops, and convenience stores during the renovation of older residential neighborhoods.
Yuzhong, Jingyuan, Liangzhou, Zhuanglang, Jingning, Anding, Minxian, Wudu, and Linxia are classified as Zoning 12. Their commercial land has entered a phase of rapid expansion characterized by large-scale and high-growth rates, yet it still struggles to meet the demands of rising consumption. Future strategies should pursue simultaneous expansion of existing and new commercial areas, further increase the allocation of commercial land quotas to attract strategic commercial projects, enhance supporting service infrastructure, and accelerate the development of emerging commercial centers [59]. Priority allocation of provincial land use quotas should be granted to ensure reasonable land requirements for strategic projects such as regional commercial centers, modern logistics hubs, and large-scale specialized markets. Commercial land use adjustments should be integrated into urban renewal initiatives. Areas characterized by excessive commercial clustering and low efficiency should undergo systematic rezoning. Through land consolidation, demolition and reconstruction, and connectivity upgrades, the layout of commercial spaces should be optimized to foster a rational hierarchy and complementary commercial ecosystem. It is also necessary to increase the transformation of existing land, encourage three-dimensional composite development, increase the utilization of underground commercial space, and enhance the intensity of commercial land development. It is recommended to revise and increase the maximum allowable floor area ratio and development intensity for commercial land in core commercial districts and transportation hub areas. New large-scale commercial projects must undergo unified underground space development and be interconnected with subway systems, underground parking facilities, and pedestrian systems. Commercial buildings should be encouraged to be available in a vertical mixed functional model of “commercial + office + hotel + apartment” to enhance the output efficiency per unit of land.

4.2. Theoretical Mechanism

This study reveals the complex operational mechanisms of factors influencing commercial land mismatch through machine learning models, demonstrating a complexity far beyond what traditional linear and homogenized theories can encapsulate. The analytical results indicate that the supply–demand mismatch of commercial land is not simply driven by a single factor but constitutes a complex systemic issue shaped by nonlinear interactions of multiple factors, spatial heterogeneity modulation, and threshold effects, thereby revising and surpassing the conclusions derived from linear model analyses. Traditional studies often presuppose that a single factor exerts a clear “promoting” or “inhibiting” effect on spatial mismatch. However, the SHAP analysis in this study indicates that the nature of factor effects exhibits mixed and dual characteristics, featuring both positive and negative influences coexisting [60]. This hybridity and duality stem from the context-dependent nature of factor effects—the same factor exhibits significant correlations with the supply side of commercial land, the demand side of consumer services, and the matching relationship between the two across different developmental stages and spatial contexts. And the study reaffirms the differential characteristics of factor effects, categorizing them into three tiers: key factors, important factors, and auxiliary factors [16]. Therefore, in future commercial land management, it is essential to conduct meticulous assessments of the direction and intensity of various factors based on regional differences, developmental stages, and varying parameter values. This will enable the design of differentiated policies, thereby providing a foundation for urban commercial land-use planning [61].
Moreover, this study reveals that factor effects generally exhibit nonlinear pathways and spatial non-stationarity, highlighting the inherent complexity of the mechanisms. The nonlinear characteristics and threshold effects of factor influences reveal the dynamic mechanisms underlying commercial land mismatch—both the intensity and direction of a factor’s impact shift as its value changes, with clear transition thresholds marking these shifts. This study categorizes nonlinear action paths into four types: S, Z, L, and wave type. Their formation is closely linked to the “stage transition” characteristics of regional development. Such nonlinear relationships indicate that the directional influence of a single factor must be assessed in conjunction with its threshold range and regional development stage, as traditional linear analysis frameworks may underestimate its complexity.
It is worth noting that different factors have diverse thresholds and turning points for mismatches. Most factors present a single sign-reversal node, with threshold values ranging from 0.1 to 0.9. Several factors display double-threshold characteristics and more complex influence pathways, while very few factors show no stable turning points and exert continuously fluctuating effects. It should be noted that the heterogeneity in turning points and threshold ranges may be partly constrained by this study’s sample size of 70 county-level units. A relatively small sample can render the boundary estimation of certain nonlinear relationships sensitive to model parameters and outliers, thereby undermining the stability and generalizability of the identified threshold positions. Future research may extend the study scope to cover approximately 3000 county-level units nationwide. Through large-sample comparative analysis, the applicability and robustness of the thresholds identified in this study can be systematically examined across broader regions and different development stages, which will further advance the scientific understanding of the dynamic matching mechanism between commercial land use and consumption demand.
The influence of different factors exhibits significant spatial heterogeneity and non-stationarity within Gansu Province, with the direction and intensity of factor effects demonstrating distinct regional differentiation patterns across space. The spatial heterogeneity and non-stationarity of factor effects validate the “regional adaptability of commercial land mismatch mechanisms at spatial scales”. This finding suggests that future research should ground its analysis in the natural geography and resource endowment disparities of study areas, embedding it within the context of regional development imbalances [62]. Therefore, future policy design must thoroughly account for the specific locations, intervals, and corresponding inflection points of different factors to precisely formulate “region-specific” commercial land management policies, avoiding simplistic linear extrapolation and cross-regional replication [63].
The core advancement of this study lies in transcending the traditional paradigm of isolated single-factor analysis, revealing that synergistic interactions among factors constitute the key mechanism driving mismatch complexity. Key factors and non-key factors do not simply add up; rather, through nonlinear interactions, they produce emergent outcomes where “1 + 1 > 2” or “1 + 1 < 0”. The finding indicates that commercial land mismatch is not determined by any single “weak link” but rather results from the coupled interaction of multiple factors within specific spatial contexts. A seemingly minor or secondary factor may play a crucial role as a “trigger” or “stabilizer” in its interaction with core factors. Therefore, future policy design must shift from a “single-tool” mindset to a systemic “policy toolkit” approach. Any policy aimed at optimizing commercial land allocation must simultaneously consider its ripple effects on other key driving factors, prioritize responses to changes in critical drivers, and pay attention to the transmission chains between factors at different levels to avoid inherent conflicts and offsetting effects among policies (Figure 13).

4.3. Spatial Effect

This study reveals that counties in Gansu Province exhibit significant spatial heterogeneity in commercial land supply scale, resident consumption service demand, and the mismatch relationship and degree between the two. This heterogeneity manifests in the mismatch between the spatial distribution of supply and demand itself and is also reflected in the driving factors influencing their relationship, where the intensity, direction, and interactions of these factors exhibit distinct regional variations. This high degree of heterogeneity is not accidental but rather the result of the combined effects of regional development imbalances, locational conditions, geographical constraints, resource endowments, population agglomeration characteristics, differences in urbanization stages, and diverse local governance models [64,65]. The pronounced spatial heterogeneity in land use and service demand at the county scale is not a unique phenomenon observed in this study. The high spatial heterogeneity in commercial spaces, consumer services, land use mismatch, and factor interaction mechanisms has been repeatedly validated by numerous scholars across different regional scales and topics, becoming a universal principle in the spatial analysis of human-economic geography [66,67]. The policy implication of this conclusion is that, given the spatial heterogeneity of Gansu’s County towns, commercial land-use planning and consumer service development policies must abandon a “one-size-fits-all” approach and shift toward a spatial governance path that precisely identifies local contexts and implements differentiated regulation.
Moreover, both the supply of commercial land and consumer demand exhibit significant spatial autocorrelation, as does the mismatch between them. This policy implication underscores the need to strengthen regional coordination [68]. The allocation of commercial land and the stimulation of resident consumption are not random outcomes of independent decision making by individual counties but are influenced by neighboring regions, potentially driven by policy imitation, regional development strategies, or shared external environmental factors. Therefore, in developing zoning plans, it is essential to integrate the characteristics of spatial clusters, particularly the spatial distribution patterns of HH and LL counties, transcend administrative boundary thinking, and achieve regional collaborative governance [69]. When designing regional coordination policies, it is necessary to simultaneously consider the spatial correlations among the spatiotemporal evolution patterns of commercial land use and consumer economy, their mismatch types, and influencing factors. It is recommended to conduct overlay analysis to identify “spatial clubs” (e.g., HH or LL clusters) to facilitate the establishment of a “Regional Collaborative Development Alliance”. This alliance should implement a regular joint conference system responsible for formulating and executing specific collaborative plans. And a “Regional Coordination Chapter” shall be incorporated as a mandatory component within commercial territorial spatial planning and the 15th Five-Year Plan for service industry development. The opinions of the governments and residents of adjacent areas should be solicited during the process of formulating and implementing the plan.

5. Conclusions

In an era where consumption has become the core engine of urban economic growth, commercial land serves as the primary spatial vehicle for consumer services. Its supply–demand dynamics, spatial layout, and utilization efficiency directly impact the vitality and potential of the consumer market. This study draws upon theories from land economics, consumer economics, and urban–rural planning. By applying multidisciplinary econometric models including BCGM, ESDA, DM, and EML, it conducts an empirical analysis of Gansu Province. It quantitatively analyzes the dynamic characteristics of commercial land and residential consumption in Gansu, identifies the mismatch between the two, and reveals their underlying driving mechanisms. In light of the mismatch between commercial land supply and consumer demand in Gansu Province, it also proposes suggestions for optimizing the allocation of commercial land and boosting consumption in the counties.
Findings: First, the integration of incremental and stock commercial land allocation has given rise to diverse patterns: high-scale–high-speed, high-scale–low-speed, low-scale–high-speed, and low-scale–low-speed. There is a marked regional differentiation across the 87 counties. Second, a significant dynamic mismatch between supply and consumer demand is identified in commercial land use in Gansu Province, with only 15% of counties compatible with each other. Mismatch relationships are categorized into two types: demand exceeding supply and supply exceeding demand, with the former holding absolute dominance. Third, the formation mechanism of the mismatch between commercial land supply and residential consumption demand is highly complex, involving the interaction of multidimensional and multilevel factors. Factor interactions exhibit pronounced hybridity and duality, demonstrating path nonlinearity and threshold effects, spatial non-stationarity and geographical dependency, as well as synergistic and antagonistic interactions among factors. Fourth, the supply of commercial land, consumer demand, and their mismatch in Gansu Province all display pronounced spatial heterogeneity and correlation (particularly with positive spatial autocorrelation playing a dominant role). Future policy design must consider both zoning planning and regional coordination. Fifth, by integrating the dynamics and mismatches in commercial land allocation, Gansu Province’s commercial land is divided into 12 planning zonings, each with tailored management policies. This provides a crucial basis for informed decision making.
The most significant innovation of this study lies in integrating multidisciplinary quantitative models such as the Boston Matrix, decoupling model, and explainable machine learning to establish an analytical framework for the dynamic alignment between commercial land supply and residential consumption demand. It reveals the complex nonlinear driving mechanisms behind the formation and evolution of mismatch relationships, offering scientific support for commercial territorial spatial planning and consumption policy design. The key academic contribution of this study lies in the systematic development and empirical application of an integrated analytical framework that combines dynamic identification of supply–demand mismatch, characterization of spatial heterogeneity, and explanation of nonlinear mechanisms. Theoretically, this framework transcends the limitations of conventional linear statistical models, which tend to oversimplify complex human–land systems. It embodies a triple paradigm shift—from static equilibrium to dynamic alignment, from homogeneity assumptions to explicit recognition of spatial heterogeneity, and from average marginal effects to nuanced nonlinear pathways—while methodologically furnishing a transferable analytical template for interdisciplinary research at the intersection of territorial spatial planning and consumption geography. Commercial land is not merely a land resource but also the infrastructure of the consumption ecosystem. As China deepens its strategy to expand domestic demand, it urgently needs to move beyond the mindset of “land-sale finance”. Only by treating commercial spaces as key vehicles for stimulating consumption, promoting social integration, and enhancing urban quality can it truly achieve the virtuous cycle where “spaces tailored to consumption, and consumption nourishing spaces”. This study creatively introduces the Boston Matrix and decoupling model to quantitatively analyze the dynamic mismatch between commercial land supply and residential consumption demand. Furthermore, it applies an explainable machine learning model to analyze the nonlinear and spatialized pathways through which various factors influence mismatch relationships, surpassing and breaking through traditional linear and statistical models.
Although this study systematically analyzes the dynamic mismatch between commercial land supply and residential consumption demand across 87 counties in Gansu Province, it still has certain limitations. First, this study focuses on the mismatch characteristics in the quantitative dimensions of supply and demand. Due to data limitations, it does not incorporate dimensions such as the quality and layout structure of commercial land into the research framework. In the decision-making process for commercial land allocation by provincial governments, the scale of land allocated to county-level organizations has long depended more on inter-county administrative coordination and bargaining than on scientific evidence based on objective supply and demand conditions. At the provincial decision-making level, there is a lack of a systematic technical tool to effectively link commercial land supply with regional consumer service demand, and to design more rational allocation plans based on the degree of alignment between the two. The core objective of this study is precisely to provide provincial governments with such a scientific decision-support tool. The current research can be regarded as Version 1.0 of this system, primarily focusing on the “quantity” dimension of land allocation. The quality attributes of commercial land, such as planning and design standards and the completeness of supporting facilities, as well as the alignment between spatial distribution and population agglomeration patterns or consumption hotspots, significantly influence supply–demand matching. Therefore, future research may focus on establishing a trinity-based evaluation system for supply–demand matching that integrates quantity, quality, and layout. Future research may further incorporate field surveys and collaboration with departments such as natural resources and housing and urban–rural development to obtain quality attribute data, including commercial land plot ratios, building densities, and construction eras, while integrating POI data and transportation network data to extract locational characteristics and spatial agglomeration metrics of land use. On this basis, the quantitative indicators employed in this study can be integrated with newly collected qualitative and spatial data to construct a comprehensive multi-dimensional evaluation index system for commercial land allocation. Ultimately, the technical framework established in this study can be applied to conduct empirical analysis of this composite index, thereby enhancing the systematic and scientific rigor of commercial land allocation research. In addition, the analysis of policy variables and institutional factors in the mismatch mechanism was insufficient. Factors such as land policies (e.g., floor area ratio regulations, commercial land transfer methods) and consumption policies (e.g., voucher distribution, support for flagship store economies) were not included in the influencing factor index system, potentially underestimating the regulatory role of policy interventions on mismatch relationships.

Supplementary Materials

The following supporting information can be downloaded at: https://www.mdpi.com/article/10.3390/land15020351/s1, Supplementary Material S1: Interaction Effect 1—nature; Supplementary Material S2: Interaction Effect 2—strength.

Author Contributions

Conceptualization, Y.L.; methodology, Y.L.; software, S.Z.; validation, Y.L. and C.Z.; formal analysis, S.Z.; investigation, Y.L. and C.Z.; resources, Y.L.; data curation, Y.L. and S.Z.; writing—original draft preparation, Y.L. and C.Z.; writing—review and editing, C.Z. and S.Z.; visualization, S.Z.; supervision, C.Z.; project administration, S.Z.; funding acquisition, S.Z. and Y.L. All authors have read and agreed to the published version of the manuscript.

Funding

This research was funded by the Guangxi Young and Middle-aged University Teachers’ Basic Research Capacity Enhancement Project in 2025, grant number 2025KY0433.

Data Availability Statement

The data is sourced from the third national land survey in Gansu Province, and some missing data is sourced from the land expropriation info open platform in Gansu Province (https://zd.zrzy.gansu.gov.cn, accessed on 12 August 2025) and China Land Market Network (https://www.landchina.com, accessed on 12 August 2025).

Acknowledgments

Thank you Qi for providing assistance in data processing and analysis.

Conflicts of Interest

Author Yongxin Liu was employed by the company Gansu Kaiyuan Survey, Planning, Design and Consulting Co., Ltd. The remaining authors declare that the research was conducted in the absence of any commercial or financial relationships that could be construed as a potential conflict of interest.

References

  1. Cuadrado-Roura, J.R. Deindustrialization and tertiarization. Progress towards an increasing service-industry integration. Trimest. Econ. 2021, 88, 719–768. [Google Scholar] [CrossRef] [Scilit]
  2. Kim, J.; Wood, J. Service sector development in Asia: An important instrument of growth. Asian-Pac. Econ. Lit. 2020, 34, 12–25. [Google Scholar] [CrossRef] [Scilit]
  3. Li, Y.; Yuan, F. Business-promoted city-regionalism? New Industrial City projects by China Fortune Land Development. Reg. Stud. 2021, 56, 355–370. [Google Scholar] [CrossRef] [Scilit]
  4. Zhong, Y.; Wei, Y.D. Economic Transition, Urban Hierarchy, and Service Industry Growth in China. Tijdschr. Voor Econ. En Soc. Geogr. 2018, 109, 189–209. [Google Scholar] [CrossRef] [Scilit]
  5. Shen, L.; Zhang, L.; Bao, H.; Wong, S.; Du, X.; Wei, X. An Empirical Study on the Mismatch Phenomenon in Utilizing Urban Land Resources in China. Land 2023, 12, 1196. [Google Scholar] [CrossRef] [Scilit]
  6. Hu, Y.H.; Wang, M.M. Impact of resource reconfiguration on total factor productivity of service industry. Int. J. Electr. Eng. Educ. 2020, 0020720920940579. [Google Scholar] [CrossRef] [Scilit]
  7. Liao, J.M. The rise of the service sector in China. China Econ. Rev. 2020, 59, 101385. [Google Scholar] [CrossRef] [Scilit]
  8. Henderson, S.R. City centre retail development in England: Land assembly and business experiences of area change processes. Geoforum 2011, 42, 592–602. [Google Scholar] [CrossRef] [Scilit]
  9. Murakami, J.; Chang, Z. Polycentric development under public leasehold: A spatial analysis of commercial land use rights. Reg. Sci. Urban Econ. 2018, 71, 25–36. [Google Scholar] [CrossRef] [Scilit]
  10. Ustaoglu, E.; Silva, F.B.E.; Lavalle, C. Quantifying and modelling industrial and commercial land-use demand in France. Environ. Dev. Sustain. 2020, 22, 519–549. [Google Scholar] [CrossRef] [Scilit]
  11. Silva, F.B.E.; Koomen, E.; Diogo, V.; Lavalle, C. Estimating Demand for Industrial and Commercial Land Use Given Economic Forecasts. PLoS ONE 2014, 9, e91991. [Google Scholar] [CrossRef] [Scilit]
  12. Sun, C.Z.; Sun, C.; Yang, Z.S.; Zhang, J.K.; Deng, Y. Urban Land Development for Industrial and Commercial Use: A Case Study of Beijing. Sustainability 2016, 8, 1323. [Google Scholar] [CrossRef] [Scilit]
  13. Zhao, S.D.; Zhao, K.X.; Yan, Y.R.; Zhu, K.; Guan, C.M. Spatio-Temporal Evolution Characteristics and Influencing Factors of Urban Service-Industry Land in China. Land 2022, 11, 13. [Google Scholar] [CrossRef] [Scilit]
  14. Kim, S.; Byun, J. Identifying spatiotemporally-varying effects of a newly built subway line on land price: Difference and correlation between commercial and residential uses. Int. J. Sustain. Transp. 2020, 15, 364–374. [Google Scholar] [CrossRef] [Scilit]
  15. Wang, L.; Yuan, F.; Duan, X.J. How high-speed rail service development influenced commercial land market dynamics: A case study of Jiangsu province, China. J. Transp. Geogr. 2018, 72, 248–257. [Google Scholar] [CrossRef] [Scilit]
  16. Kosow, H.; Wassermann, S.; Bartke, S.; Goede, P.; Grimski, D.; Imbert, I.; Jenssen, T.; Laukel, O.; Proske, M.; Protzer, J.; et al. Addressing Goal Conflicts: New Policy Mixes for Commercial Land Use Management. Land 2022, 11, 795. [Google Scholar] [CrossRef] [Scilit]
  17. Zhang, P.; Yang, X.; Chen, H.; Zhao, S. Matching Relationship between Urban Service Industry Land Expansion and Economy Growth in China. Land 2023, 12, 1139. [Google Scholar] [CrossRef] [Scilit]
  18. Byun, J.; Jang, K. The Effects of Subway Operation for Commercial Land Values: A Case Study in Daejeon, South Korea. Res. Transp. Econ. 2024, 106, 101462. [Google Scholar] [CrossRef] [Scilit]
  19. Lee, C. The Relationship between Foot Traffic and Commercial Land Prices. Geografie 2024, 129, 1–13. [Google Scholar] [CrossRef] [Scilit]
  20. Nichols, J.B.; Oliner, S.D.; Mulhall, M.R. Swings in commercial and residential land prices in the United States. J. Urban Econ. 2013, 73, 57–76. [Google Scholar] [CrossRef] [Scilit]
  21. Cheng, J. Analysis of commercial land leasing of the district governments of Beijing in China. Land Use Policy 2021, 100, 104881. [Google Scholar] [CrossRef] [Scilit]
  22. Sohn, D.W. Do all commercial land uses deteriorate neighborhood safety? Examining the relationship between commercial land-use mix and residential burglary. Habitat Int. 2016, 55, 148–158. [Google Scholar] [CrossRef] [Scilit]
  23. Izanloo, A.; Rafsanjani, A.K.; Ebrahimi, S.P. Effect of Commercial Land Use and Accessibility Factor on Traffic Flow in Bojnourd. J. Urban Plan. Dev. 2017, 143, 05016016. [Google Scholar] [CrossRef] [Scilit]
  24. Yang, H.J.; Song, J.; Choi, M.J. Measuring the Externality Effects of Commercial Land Use on Residential Land Value: A Case Study of Seoul. Sustainability 2016, 8, 432. [Google Scholar] [CrossRef] [Scilit]
  25. Langer, S.; Korzhenevych, A. The effect of industrial and commercial land consumption on municipal tax revenue: Evidence from Bavaria. Land Use Policy 2018, 77, 279–287. [Google Scholar] [CrossRef] [Scilit]
  26. Gingerich, K.; Maoh, H.; Anderson, W. Choice of Land Use Development Type within Commercial and Industrial Zoning. J. Urban Plan. Dev. 2015, 141, 04014024. [Google Scholar] [CrossRef] [Scilit]
  27. Wang, Y.D.; Wang, T.; Tsou, M.H.; Li, H.; Jiang, W.; Guo, F.Q. Mapping Dynamic Urban Land Use Patterns with Crowdsourced Geo-Tagged social media (Sina-Weibo) and Commercial Points of Interest Collections in Beijing, China. Sustainability 2016, 8, 1202. [Google Scholar] [CrossRef] [Scilit]
  28. Garang, Z.; Wu, C.F.; Li, G.; Zhuo, Y.F.; Xu, Z.G. Spatio-Temporal Non-Stationarity and Its Influencing Factors of Commercial Land Price: A Case Study of Hangzhou, China. Land 2021, 10, 317. [Google Scholar] [CrossRef] [Scilit]
  29. Colaço, R.; Silva, J.D.E. Commercial Land Use Change and Growth Processes—An Assessment of Retail Location in Lisbon, Portugal, 1995–2020. J. Urban Manag. 2024, 13, 157–170. [Google Scholar] [CrossRef] [Scilit]
  30. Wen, S.P.; Shi, J.G.; Zhang, W. Impact of Urban Rail Transit Network on Residential and Commercial Land Values in China: A Complex Network Perspective. Complexity 2021, 2021, 1–11. [Google Scholar] [CrossRef] [Scilit]
  31. Zhang, M.Z.; Liu, H.Y.; Su, Y.Y.; Zhou, X.Y.; Li, Z.C.; Chen, C. Assessment and Decomposition of Regional Land Use Efficiency of the Service Sector in China. Land 2022, 11, 1911. [Google Scholar] [CrossRef] [Scilit]
  32. Lu, Q.; Ning, J.; You, H.; Xu, L. Urban Intensity in Theory and Practice: Empirical Determining Mechanism of Floor Area Ratio and Its Deviation from the Classic Location Theories in Beijing. Land 2023, 12, 423. [Google Scholar] [CrossRef] [Scilit]
  33. Fan, W.J.; Pan, J.D.; Zhou, M.H. An Explanation of the Underdevelopment of China’s Service Sector from the Perspective of Demand. Emerg. Mark. Financ. Trade 2019, 56, 3044–3059. [Google Scholar] [CrossRef] [Scilit]
  34. Daniel, C.; Hernandez, T. What Retail Apocalypse? A Delphi Forecast of Commercial Space Demand in the Toronto Region. J. Retail. Consum. Serv. 2024, 77, 103670. [Google Scholar] [CrossRef] [Scilit]
  35. Li, W.; Zhang, P.; Zhao, K.; Chen, H.; Zhao, S. The Evolution Model of and Factors Influencing Digital Villages: Evidence from Guangxi, China. Agriculture 2023, 13, 659. [Google Scholar] [CrossRef] [Scilit]
  36. Zhao, S.; Zhang, P.; Li, W. A Study on Evaluation of Influencing Factors for Sustainable Development of Smart Construction Enterprises: Case Study from China. Buildings 2021, 11, 221. [Google Scholar] [CrossRef] [Scilit]
  37. Zhang, P.; Li, W.; Zhao, K.; Zhao, S. Spatial Pattern and Driving Mechanism of Urban–Rural Income Gap in Gansu Province of China. Land 2021, 10, 1002. [Google Scholar] [CrossRef] [Scilit]
  38. Xiong, C.H.; Yang, D.G.; Huo, J.W.; Zhao, Y.N. The Relationship between Agricultural Carbon Emissions and Agricultural Economic Growth and Policy Recommendations of a Low-carbon Agriculture Economy. Pol. J. Environ. Stud. 2016, 25, 2187–2195. [Google Scholar] [CrossRef] [Scilit]
  39. Song, Y.; Sun, J.J.; Zhang, M.; Su, B. Using the Tapio-Z decoupling model to evaluate the decoupling status of China’s CO2 emissions at provincial level and its dynamic trend. Struct. Change Econ. Dyn. 2020, 52, 120–129. [Google Scholar] [CrossRef] [Scilit]
  40. Lu, Z.W.; Wang, H.M.; Yue, Q. Decoupling Analysis of the Environmental Mountain—with Case Studies from China. J. Ind. Ecol. 2015, 19, 1082–1090. [Google Scholar] [CrossRef] [Scilit]
  41. Li, Z.Q. Extracting Spatial Effects from Machine Learning Model Using Local Interpretation Method: An Example of SHAP and XGBoost. Comput. Environ. Urban Syst. 2022, 96, 101845. [Google Scholar] [CrossRef] [Scilit]
  42. Zhou, C.Y.; Wang, Z.; Wang, X.L.; Guo, R.; Zhang, Z.; Xiang, X.W.; Wu, Y.Q. Deciphering the Nonlinear and Synergistic Role of Building Energy Variables in Shaping Carbon Emissions: A LightGBM—SHAP Framework in Office Buildings. Build. Environ. 2024, 266, 112035. [Google Scholar] [CrossRef] [Scilit]
  43. Chen, Y.B.; Zhang, Z.L.; Lang, L.X.; Long, Z.; Wang, N.F.; Chen, X.P.; Wang, B.; Li, Y. Measuring the Spatial Match between Service Facilities and Population Distribution: Case of Lanzhou. Land 2023, 12, 1549. [Google Scholar] [CrossRef] [Scilit]
  44. Nie, L.; Wang, Y.Y. Spatial Effects of Service Industry’s Heterogeneous Agglomeration on Industrial Structure Optimization: Evidence from China. Systems 2024, 12, 85. [Google Scholar] [CrossRef] [Scilit]
  45. Wu, Z.X.; Zheng, X.Z.; Chen, Y.J.; Huang, S.; Duan, C.F.; Hu, W.L. Regional Differences and Dynamic Evolution of High-Quality Development in Service Industry: A Case Study of the Chengdu-Chongqing Economic Circle. PLoS ONE 2024, 19, e0297755. [Google Scholar] [CrossRef] [Scilit]
  46. Wu, S.; Zhou, Y.; Yan, W.Y. Coastal Service Industry, Industrial Structure Optimization and Environmental Governance: An Empirical Analysis Based on Chinese Coastal Cities. J. Coast. Res. 2020, 109, 114–120. [Google Scholar] [CrossRef] [Scilit]
  47. You, Z.; Feng, Z.M.; Yang, Y.Z. Relief Degree of Land Surface Dataset of China (1 km). Digit. J. Glob. Change Data Repos. 2018, 2, 151–155. [Google Scholar] [CrossRef] [Scilit]
  48. Miyamoto, S.; Chacon, A.; Hossain, M.; Martinez, L. Soil salinity of urban turf areas irrigated with saline water I. Spatial variability. Landsc. Urban Plan. 2005, 71, 233–241. [Google Scholar]
  49. She, D.L.; Shao, M.A.; Yu, S.G. Spatial Variability of Soil Water Content on a Cropland-grassland Mixed Slope Land in the Loess Plateau, China. Trans. Chin. Soc. Agric. Mach. 2010, 41, 57–63. [Google Scholar]
  50. Li, P.L.; Yu, Y.Z.; Xuan, Y. Measurement and spatial-temporal convergence analysis of high-quality development of service industry: New city-level evidence in China. J. Asia Pac. Econ. 2023, 30, 398–426. [Google Scholar] [CrossRef] [Scilit]
  51. Xie, F.; Zhang, S.; Zhao, K.; Quan, F. Evolution Mode, Influencing Factors, and Socioeconomic Value of Urban Industrial Land Management in China. Land 2022, 11, 1580. [Google Scholar] [CrossRef] [Scilit]
  52. Wang, C.; Yu, H. Research on the Evaluation of the High-Quality Development of the Modern Service Industry under the Back-ground of Reduction Development: A Case Study of Beijing. Sustainability 2024, 16, 3224. [Google Scholar] [CrossRef] [Scilit]
  53. Hügel, S.; Kreutzer, M.; Rottke, N.B. Firm Innovativeness in Service Industries: A Construct Validation in the External Environment and Industry Structure Contexts. Int. J. Innov. Manag. 2019, 23, 1950051. [Google Scholar] [CrossRef] [Scilit]
  54. Deng, H.F. Inventory Land Era and Transformation of China’s Urban Regeneration: An Empirical Study of Chengdu Hi-Tech West District, China. Habitat Int. 2024, 150, 103133. [Google Scholar] [CrossRef] [Scilit]
  55. Wang, F.; Niu, F.Q. Urban Commercial Spatial Structure Optimization in the Metropolitan Area of Beijing: A Microscopic Per-spective. Sustainability 2019, 11, 1103. [Google Scholar] [CrossRef] [Scilit]
  56. Xu, H.T. Commercial-to-Residential Land-Use Conversion and Residential Recentralization in Large Cities. Can. J. Econ. 2023, 56, 306–338. [Google Scholar] [CrossRef] [Scilit]
  57. Mckeown, B.; Coulton, J.; Saydam, S.; Dempster, A.G. What is an Appropriate Investment Hurdle Rate for Commercial Space Resource Development Projects? Space Policy 2024, 70, 101630. [Google Scholar] [CrossRef] [Scilit]
  58. Hu, L.H.; Fan, J.; Li, C.C.; Luo, S.J. Evaluation of Community Commercial Space Design Experience and Optimization Strategy Based on KANO Model. Buildings 2023, 13, 1760. [Google Scholar] [CrossRef] [Scilit]
  59. Wu, Y.Z.; Fan, P.L.; You, H.Y. Spatial Evolution of Producer Service Sectors and Its Influencing Factors in Cities: A Case Study of Hangzhou, China. Sustainability 2018, 10, 975. [Google Scholar] [CrossRef] [Scilit]
  60. Shen, Y.M.; Qiu, L.; Ren, W.B.; Cao, Y.; Hu, D.; Song, Y.J. Basic characteristics, spatial disparity and its major influencing factors of service industry in China. Chin. Geogr. Sci. 2009, 19, 314–324. [Google Scholar] [CrossRef] [Scilit]
  61. Yang, D.W.; Zhao, J.H.; Xu, P. Deep Learning-Based Approach for Optimizing Urban Commercial Space Expansion Using Artificial Neural Networks. Appl. Sci. 2024, 14, 3845. [Google Scholar] [CrossRef] [Scilit]
  62. Agarwal, S.; Behera, S.R. Spatial Concentration of Indian Service Industries in Rural and Urban Areas: A Micro-Unit-Level Analysis. Cogent Econ. Financ. 2023, 11, 2270231. [Google Scholar] [CrossRef] [Scilit]
  63. Barlet, M.; Briant, A.; Crusson, L. Location Patterns of Service Industries in France: A Distance-Based Approach. Reg. Sci. Urban Econ. 2013, 43, 338–351. [Google Scholar] [CrossRef] [Scilit]
  64. Xiao, Y.H.; Li, C.Z.; Zhou, Z.W.; Hou, D.Y.; Zhou, X.G. Analysis and Optimization of the Spatial Patterns of Commercial Service Facilities Based on Multisource Spatiotemporal Data and Graph Neural Networks: A Case Study of Beijing, China. ISPRS Int. J. Geo-Inf. 2025, 14, 23. [Google Scholar] [CrossRef] [Scilit]
  65. Yu, H.T.; Pang, H.; Zhang, M. Value-added effects of transit-oriented development: The impact of urban rail on commercial property values with consideration of spatial heterogeneity. Pap. Reg. Sci. 2018, 97, 1375–1397. [Google Scholar] [CrossRef] [Scilit]
  66. Gao, Y.X.; Wang, Z.Q.; Chai, J.; Zhang, H.W. Spatiotemporal Mismatch of Land Use Functions and Land Use Efficiencies and Their Influencing Factors: A Case Study in the Middle Reaches of the Yangtze River, China. J. Geogr. Sci. 2024, 34, 62–88. [Google Scholar] [CrossRef] [Scilit]
  67. Liao, Y.X.; Huang, J.J.; Luo, C.R.; Fang, M.Z.; Xu, X.L.; Qiao, Z.; Liu, L. Deciphering Supply-Demand Mismatch and Influencing Mechanisms of Cropland Multifunction in China: Toward Targeted Spatial Governance. J. Clean. Prod. 2025, 527, 146719. [Google Scholar] [CrossRef] [Scilit]
  68. Liao, W.H.; Zhang, Z.H.; Jiang, W.G. Concept Lattice Method for Spatial Association Discovery in the Urban Service Industry. ISPRS Int. J. Geo-Inf. 2020, 9, 155. [Google Scholar] [CrossRef] [Scilit]
  69. Chen, B.Q.; Xu, X.T. The North-South Gap and Spillover Effect of Chinese Service Industry Green Development. Front. Ecol. Evol. 2023, 10, 1094646. [Google Scholar] [CrossRef] [Scilit]
Figure 1. Study area: location and scope of Gansu Province.
Land 15 00351 g001
Figure 2. Research framework and technical roadmap for empirical analysis.
Land 15 00351 g002
Figure 3. Technological roadmap of explainable machine learning.
Land 15 00351 g003
Figure 4. Spatiotemporal evolution model and spatial effects of commercial land supply.
Land 15 00351 g004
Figure 5. Spatiotemporal evolution model and spatial effects of consumption service demand.
Land 15 00351 g005
Figure 6. Dynamic mismatch relationship between supply and demand.
Land 15 00351 g006
Figure 7. Analysis of factor attributes and influence strength.
Land 15 00351 g007
Figure 8. Nonlinear effect analysis of influence factors.
Land 15 00351 g008
Figure 9. Spatial differentiation analysis of influence factor SHAP Values.
Land 15 00351 g009
Figure 10. Spatial correlation analysis of influence factor SHAP Values.
Land 15 00351 g010
Figure 11. Interaction effect analysis of influence factors.
Land 15 00351 g011
Figure 12. Comprehensive policy zoning.
Land 15 00351 g012
Figure 13. Theoretical mechanism of mismatch relationship.
Land 15 00351 g013
Table 1. The indicator system of impact factor analysis.
TypeCodeIndicatorMeaning
Basic VariablesY1Commercial land areaSpatial Supply
Y2Retail sales of consumer goods in societyConsumption Demand
Dependent VariableYDynamic Mismatch Relationship Between Supply and DemandDecoupling Relationship
Independent VariableX1Resident PopulationConsumption Foundation and Capacity
X2Floating Population
X3Per Capita Disposable Income
X4Per Capita Gross Domestic ProductIndustrial Structure and Government Regulation
X5Proportion of Tertiary Industry
X6Fiscal Self-sufficiency Rate
X7Satellite Night LightEconomic Vitality
X8Growth rate of Gross Domestic Product
X9Growth Rate of Tertiary Industry Investment
X10Carbon EmissionEnvironmental Constraints
X11Particulate Matter 2.5
X12Relief Degree of Land Surface
Table 2. Descriptive statistics of commercial land supply and consumption service demand.
ParameterCommercial Land SupplyConsumption Service Demand
Relative ShareGrowth RateRelative ShareGrowth Rate
Min0.02−0.890.00−31.62
Lower Quartile0.101.850.013.18
Median0.182.730.024.95
Upper Quartile0.324.180.047.57
Max1.009.611.0010.47
Mean0.243.220.054.78
Table 3. Comparative analysis of different models in explainable machine learning.
ModelR2RMSEMAE
LightGBM0.89020.05280.0325
XGBoost0.85460.06080.0232
Gradient Boosting0.85570.06050.0306
Random Forest0.57310.10410.0432
Table 4. Descriptive Statistical Analysis of Impact Factor SHAP Values.
FactorMinLower QuartileMedianUpper QuartileMaxMean
X1−0.0227−0.01250.00520.01290.0136−0.0005
X2−0.0483−0.02440.01290.02070.03020.0007
X3−0.0069−0.00530.00260.00560.00850.0003
X4−0.0577−0.0303−0.01390.02760.0557−0.0028
X5−0.0234−0.0081−0.00230.00790.0205−0.0004
X6−0.0155−0.0039−0.00030.00810.02020.0009
X7−0.0663−0.0329−0.00490.02950.0718−0.0007
X8−0.0089−0.0070−0.00520.01390.01870.0002
X9−0.0204−0.0069−0.00240.00550.03620.0005
X10−0.0438−0.0218−0.01840.03680.04960.0008
X11−0.0171−0.00570.00480.00950.01320.0006
X12−0.0086−0.0028−0.00020.00440.01050.0003
Table 5. The CV (coefficient of variation) and Moran’s index of SHAP value.
IndicatorCVMoran-Ip-ValueZ-Score
X1−27.3980.0380.2400.691
X235.3600.2550.0013.622
X320.7390.4500.0016.383
X4−11.9300.4620.0016.562
X5−23.9800.3010.0014.354
X67.6960.0870.0921.403
X7−47.9000.0660.1421.100
X848.7020.0470.1890.833
X921.1250.0940.0711.470
X1035.3020.4490.0016.455
X1116.3000.5590.0017.933
X1217.6670.5310.0017.715
Disclaimer/Publisher’s Note: The statements, opinions and data contained in all publications are solely those of the individual author(s) and contributor(s) and not of MDPI and/or the editor(s). MDPI and/or the editor(s) disclaim responsibility for any injury to people or property resulting from any ideas, methods, instructions or products referred to in the content.