Abstract
Our work develops the financial engineering module of the REGENerative Agriculture (REGENA) Production Function, with Soil Organic Carbon (SOC) as ecosystem service and contract underlying index, contributing to the global literature and business practices. Specifically, we design and engineer a 30-year Net Present Value (NPV) intergenerational ecological bond instrument tailored for carbon farming (CF) as a part of regenerative practices. With SOC constituting a fundamental soil health indicator for the European Union Soil Observatory (EUSO), we model the flow of value from atmospheric CO2 removal and its metabolism into SOC within a stochastic SOC Value at Risk (VaR) framework. We assess the SOC VaR in five experimental plots in five Mediterranean countries in South Europe and North Africa for three different treatments in each plot. In turn, the SOC VaR is incorporated into an adjusted Shannon entropy index (H(X)ADJ) to estimate the coefficient of a positive, net-zero, or negative carbon balance and further assess the risk-adjusted discount rate. The monetary value per gram of carbon per kilogram of soil (g C/kg Soil) signifies a clear advantage of combined regenerative treatments. Finally, three selected extensions of our work are discussed, such as the application of the framework to other nutrients, the establishment full cost–benefit accounting methods for monetizing the environmental benefits of CF to upscale investments and the lifecycle accounting of ecosystem services.
1. Introduction
Our work structures an integrated and consistent financial engineering framework to quantitatively assess the monetary value of carbon farming (CF) in terms of its potential to remove atmospheric CO2 and store it in the soil in the form of Soil Organic Carbon (SOC). The methodology is then tested empirically in 5 experimental plots in South Europe and North Africa via a structured ecological finance instrument that compares the performance of carbon farming across alternative conventional and regenerative treatments. SOC holds pivotal role as Key Performance Indicator (KPI) for measuring the output composition, quality, and environmental value of regenerative farming practices, as it comprises both a Soil Degradation Indicator (SDI) of the European Union Soil Observatory (EUSO) [1], as well as an Ecosystem Service (ES) within the Common International Classification of Ecosystem Services (CICES) v5.1 (2018) [2]. This original approach contributes to the enrichment of the global literature on environmental accounting [3] and valuation models for carbon sequestration [4,5], as well as to the enrichment of business, investing and financial practices. Although regenerative practices have become a major trend for the shift of the global and the European Union’s (EU) agriculture [6,7], the lack of knowledge—and its respective standardization—on the biophysical processes that drive land regeneration and the deriving values from regenerative land management constitutes a major obstacle for its market upscale [8]; in turn preventing financial institutions from investing in such solutions due to a lack of universally acceptable cost-benefit assessment frameworks [9,10,11] that provide a benchmark for profitability and Return on Investment (RoI) rates. We then discuss the application of the SOC valuation method to Nitrogen (N) and Phosphorus (P) in an attempt to investigate their role as causal SOC markers [12] and generalize the methodology for both nutrients as parts of the EUSO SDIs (when their concentrations are excessive or deficient), considering that their optimal combined use depends on the identified limiting factor [13].
1.1. Nature-Based, Regenerative, and Carbon-Balancing Structures
An issue of imperative importance for the scientific literature and respective business practices that constitutes the foundation of carbon and, generally, environmental finance is the distinction between the terms of nature-based, regenerative and carbon sequestering that are frequently used interchangeably. Although these terms are ontologically related, we may observe conceptual confusion between the two first. We argue that the cornerstone criterion for the adoption of each term should be the level of naturally formed ecosystem energy flows above thermodynamic equilibrium without human intervention. By this approach, we may define nature-based to be any state functioning at the optimal eco-energetic level, regenerative to be any process functioning towards the restoration of the nature-based state, while carbon sequestering to be any subset of regenerative solutions that mitigate the effects of atmospheric CO2 accumulation. Figure 1a depicts their ontological hierarchy, while Figure 1b depicts the typology of regenerative processes by functional response [14,15].
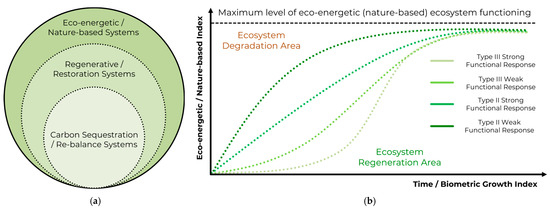
Figure 1.
Schematic depiction of (a) the hierarchical ontology between NBS, RS and CarSeqS and (b) the functional response typology across the transition from a fully degraded to a fully nature-based functioning ecosystem. Regeneration is depicted as a process beginning from a state of degradation that gradually converges into the nature-based state. Each functional response type determines the convergence pattern parameters, such as the regeneration rates’ distribution and convergence time.
Although structuring and quantifying an integrated nature-based index escapes the scope of our work, we consider a semi-quantitative introduction to be of high value-added to activate a related scientific discussion. In general, the eco-energetic state approach for benchmarking an optimal ecosystem functioning state has been postulated by several authors, either in terms of response towards dynamic changes in energy inputs [16] or in the more classical approach of the trophic pyramid [17,18,19,20]. Related studies show a statistically significant relation between trophic pyramid energy flows and ecological functions in African ecosystems [21]. Other approaches define the optimal eco-energetic level as the minimum energy expenditures required for implementing the sequences of exothermic and endothermic reactions in the environment for the regulation of every biogeochemical cycle without the intervention of human activity [22,23]. This approach of the nature-based state as a balance of eco-energetic flows above the thermodynamic equilibrium is consistent with the trophic pyramid approach [17,18,19,20] as the structure that regulates biogeochemical circulation and interlocks relatively stable nutrient cycles.
The idea of humanity’s adaptation to natural ecosystem flows and emerging carrying capacities has also been the subject of several socio-ecological studies on agrarian societies (12,000 BC to 1800AC) [24,25] as a state to be replicated by modern regenerative agriculture approaches and technologies. The identification of such an index of optimal eco-energetic flows to which human economies should adapt constitutes the cornerstone of ecological schools of thought of economics [26,27]; further extending to the monetary system itself, money and debt issuance should comply with the laws of thermodynamics [28,29,30]. In such a context, financial capital should prioritize investments towards regenerative systems [31,32,33], endowing the future generations with the embodied monetized value of restored (regenerated) ecosystems, their functions, and their derived services.
The eco-energetic approach is reflected in the attempt to establish a unified soil health index from several international and EU organizations. For instance, the EUSO classifies the loss of SOC as a category on its own within its SDIs with the metric of distance to maximum SOC, defining the latter as the increase in SOC content that would be achievable if the land was kept under continuous grassland for 40 years continuous without ploughing [1]. This clearly states that the optimal ecosystem state of the soil should be viewed as if it was unencumbered by human activity for 40 years, which is an almost equivalent duration of one generation (of 30 years) that we adopt in our intergenerational ecological bond based on the SOC value. In this context, a standardized soil health index based on an SOC concentration metric could take values within a range of (0, 1), where the value 1 would indicate a nature-based state, while the value 0 would indicate a state of complete degradation. Any other value within this range would indicate a deviation from the nature-based state and partial degradation, while an increasing value converging to 1 in time would indicate that a regeneration process was taking place.
Quantitatively, an indicative model backing the above eco-energetic regeneration approach is the Chapman-Richards (CR) growth function [34], with numerous shape flexibilities and physical and bioeconomic interpretations that are consistent with ecological principles [34,35]. The CR function is frequently used for modeling forest ecosystems [36], with the ability to produce many growth patterns, such as exponential and logistic, as schematically presented in Figure 1b. The CR general form is:
Equation (1) depicts the CR formulation in its production function form where n factors combine to yield a total output Q. Such functions are widely used in agriculture [37,38] to model the contribution of production factors, such as labor, tractors, fertilizers and pesticides, to agricultural yield. Similarly, the CR production function formulation can be used to depict the contribution of n regenerative factors combined to restore the soil towards its nature-based state. Specifically, in Equation (1), parameter A depicts the carrying capacity as the optimal state, which, for a standardized soil index, A = 1. Parameter a depicts the proximity of an initial quantity to the carrying capacity; parameter b depicts each i factor’s growth rate; while parameter m contains a double role as a scale multiplier and a growth “fuse delay”, reproducing the type I and type II functional responses [14,15,35] presented in Figure 1b. The physical meaning of the CR function reproducing such a functional response variation concerns the metabolic ability of regenerative factors—such as beneficial microorganisms—to enrich the soil with nutrient compounds [39]. Exponent (1 − m)−1 constitutes a flexible and meaningful way to generalize the complementary exponential decay function into a logistic growth pattern (depending on the value of parameter m) with type II or type III functional responses.
Such an approach has multiple applications and values for soil regeneration, extending from farming to soil bioremediation. Respectively, the mathematical representation of functional responses would indicatively depict the response of microbiota to the concentrations of contaminants [40] and their ability to decompose them, or the ability of cover crops to fixate nutrients in stressed soils [41]. In turn, ESs generation patterns are generally expected to follow functional response patterns, paving the way for classifying soil states by their distance to their nature-based state. Such a classification would order the regeneration potential of soils with regenerative finance schemes, coupling their RoI with SOC and atmospheric CO2 removal. From a financial standpoint, the main challenge of human economies is to structure the proper business and financial models that reward filling this capacity with factors that stimulate the generation of monetizable ESs [42,43,44,45,46], while putting monetary penalties on practices that increase contaminant concentrations [47,48] that bind soils and farming systems into vicious cycles of direct and indirect costs.
1.2. Carbon Agriculture Financial Engineering (CAFE) Research
The field of environmental finance and its branches for tailored solutions on natural resource species emerged from the realization of finite biophysical surpluses and carrying capacities deriving from the universal validity of thermodynamic laws [22,23,26,27,30,49]. The Second Thermodynamic Law is at the core of the scientific discussion [26,27,49], dictating that thermomechanical work becomes increasingly scarce across energy transformations. This scientific discussion ignited a series of recommendations on the a priori incorporation of thermodynamics in economic models, whether this was stated directly [23,26,27,50,51,52,53,54] or indirectly [55]. In turn, this epistemological restructuring of economic models was extended to the field of financial modeling, establishing the field of ecological finance with the task of postulating nature-based convergence underlying indices [29,30,56,57], validating a regeneration process [31,32] and its monetary value. Such underlying indices are coupled with marketable financial instruments that can be traded between stakeholders and investors to enrich their portfolios with certified environmental finance instruments that provide them with several benefits [58,59,60]. In this methodological context, Carbon Agriculture Financial Engineering (CAFE) emerges as a special field for financial structuring and a part of CarSeqS that considers SOC to be a representative pivotal indicator of agroecosystem health. On these grounds, we develop a CAFE instrument for assessing the value of soil regeneration in an ES accounting framework [2,3,4,5,61], with SOC being a pivotal and easily operational index for market upscale.
Specifically, in our Materials and Methods section, we examine the pivotal importance of SOC as an ES within various classification and valuation standards [2,42,61] in relation to the EU Green Deal (EU GD) [62], with focus on Mediterranean agro-ecosystems as more exposed to pedoclimatic risks [63], as well as its Sustainability Finance Taxonomy (EU SFT) being its financial vehicle [64]. Adopting this approach, we record the identified ESs from 8 Case Studies (CSs) located in South Europe and North Africa applying regenerative farming practices, with SOC as their common ES (see Appendix A). As carbon farming is reflected in the recent EU legislation as a priority within voluntary market systems of carbon removal credits [60,64] and environmental lifecycle footprints [65], we utilize the financial engineering module of the REGENerative Agriculture Production Function (REGENA) [38] to monetize the SOC Value at Risk (VaR) within a stochastic framework for a 30-year intergenerational ecological bond. In this context, we quantify the Net Present Value (NPV) of removed atmospheric CO2 that is transformed into the SOC with a risk-adjusted discount rate (for depicting the SOC NPVaR). The risk coefficient is modeled by a modified Shannon entropy index derived from the variability of the distributions of SOC differences that has been used to test biomass growth risk in discrete-time models [17].
In our Results section, we present the composition of identified environmental value chains and ESs [43,66] by the CICES v5.1 standard for each of the four ABMR regenerative farming pillars examined in the eight CSs, standing for Agronomical Practices (A), organic biomasses (B), beneficial microorganisms (M), and Resistant Varieties (R) [38]. The responses of the CSs were recorded, classified by the ABMR pillar, and further processed to identify basic statistical relations. To assess the pivotality of each pillar for the generation of ESs, a Shannon entropy index [67] was used. In turn, we selected SOC as the most representative CICES v5.1 ES, coupled with the EUSO Distance to Max SOC SDI definition [1] for building the stochastic framework of Gaussian continuous distributions [68] of SOC concentrations from the pilot plot measurements. This constitutes the background work for structuring the risk-adjusted coefficient with a Bayesian approach [68] as part of the ecological bond’s discounted SOC NPV, taking into consideration the differences between (a) the exchange rates, (b) the EU Harmonized Index of Consumer Prices (HICPs) and (c) the central bank nominal discount rates in the countries of the 5 examined CSs; normalized with Purchasing Power Parity (PPP) values. The simulations demonstrate a clear prevalence of combined regenerative farming treatments in comparison to conventional or moderate regenerative ones in terms of the SOC value as an indicator of a farm’s conversion potential [69], potential income source, and collateral asset base for upfront investment. Finally, in the Discussion section, we examine the extensions of the financial engineering module of REGENA for Nitrogen and Phosphorus nutrients as parts of the EUSO SDIs list, along with the issue of Full Cost–Benefit Accounting (FCBA) at lifecycle to assess the SOC value in terms of Global Warming Potential (GWP) avoidance.
2. Materials and Methods
In this section, we exhibit the methods and key metrics for analyzing the monetary value of the ecological benefits from carbon farming solutions in the 5 tested plots and for building the 30-year SOC Present Value at Risk (PVaR) bond. Specifically, this section consists of three main segments as follows: (a) the identification and recording of ecosystem services by the CICES v5.1 standard in the 8 surveyed Mediterranean CSs and the metrics for assessing their pivotality; (b) the selection of the SOC definition and quantification by the EUSO SDIs framework as an institutional reference for policy recommendations in the EU; and (c) the step-by-step structuring of the SOC PVaR’s performance quantification as the underlying index of the bond’s payoffs across its 30-year duration.
2.1. Regenerative Farming Pillars and Ecosystem Services
A fundamental entry point for the market uptake of carbon farming is the classification, standardization and valuation of ecosystem services [2,42,43] within an established corporate, national, and global system of environmental accounting [3,27]. Several studies have shown that ESs can comprise a significant asset base of carbon farms [70,71,72,73,74], as well as act as collateral, securing upfront financial investments and regenerative funds [56,57], taking into consideration that the transition from conventional practices requires a significant time lag to yield results [38,69]. The most widely adopted ESs global standard is the CICES v5.1 [2,17] that consists of 92 ESs, classified into 3 categories: Provisional (biotic and abiotic), related to the provision of biomass and compounds (e.g., genetic material) from ecosystem functions; Regulation and Maintenance (biotic and abiotic), related to the conservation of ecosystems’ functions, as well as climate conditioning that has tangible economic value for human societies (e.g., carbon sequestration, flood protection) as it reduces the need—hence, the cost—for technical infrastructure; and Cultural (biotic and abiotic), related to intangible values, such as outdoor activities and environmental education (e.g., living labs). The CICES v5.1 standard uses quaternary classification (4-digit) for encoding the hierarchy from the most general to the most specific ES class with increasing granularity. SOC is classified to biotic regulatory and maintenance ESs under the code 2.1.1.2. A presentation of the identified ESs by the CICES v5.1 standard in the 8 CSs with the examined ABMR pillar is provided in Appendix A.
To quantify the pivotality of identified ESs to each ABMR pillar, a Shannon Information Entropy H(E) metric was applied. Via the H(E) metric, we examine how each regenerative pillar transcends the 8 CSs, irrespective of how frequently it is identified to be a source of an ES. The H(E) discrete metric in our approach is presented in Equation (2) as follows:
Equation (2) applies the Shannon Entropy formula horizontally, essentially measuring how equally each ABMR pillar is distributed across the 8 CSs, irrespective of its frequency of appearance. For instance, although pillar B has a much higher association frequency to CICES v5.1 ESs, it is limited to 6 CSs. In contrast, pillar M is associated with ESs by only 54% of that of pillar B; however, it is extended to 7 CSs and has a more equal distribution.
2.2. Carbon Farming, Soil Heatlh, and Soil Organic Carbon (SOC)
In relation to the typology of Figure 1, carbon farming belongs to the CarSeqS subset of regenerative systems. The CarSeqS distinctive feature is that CO2 sequestration is considered a pivotal metric for mitigating different sets of environmental stresses. In particular, carbon uptake for metabolic functions and biomass formation of plants and microbiota that constitute 99.6% of total biosphere mass [17] can be a reliable proxy indicator of overall nature-based functioning. This prioritization of balanced carbon flows is also reflected in the most recent Assessment Report (AR 6) of the Intergovernmental Panel on Climate Change (IPCC) that identifies several Greenhouse Gases (GhGs) and translates them to CO2 equivalents of GWP [75]. In addition, this is reflected in environmental footprint lifecycle analyses [65] as part of corporate sustainability reports, where all impacts are reduced to CO2 equivalents following mid-point approaches. Another case where CO2 equivalents are prioritized is in the coefficients of fuel emissions [76]. In conclusion, established methods for carbon flows and impacts on ecosystems—accompanied by respective market schemes on carbon sinks in forest ecosystems [4,36,77]—constitute an adequate basis for the design of carbon farming markets for re-balancing excessive atmospheric CO2.
Respectively, the EUSO SDIs consist of 19 different metrics classified into 9 categories with a secondary (2-digit) classification. From these 9 categories, we examine 2 categories: (a) Loss of Soil Organic Carbon (SOC), measured by Distance to Maximum SOC Level, and (b) Soil Nutrients that include (i) Nitrogen Surplus and (ii) Phosphorus Excess or Deficiency. However, it was convenient to integrate them into a single category with an optimal range of soil Phosphorus concentrations between the excess and deficiency limits. We use the SOC increase measurements from each of the 3 treatments in each of the 5 CSs to simulate the continuous distributions that estimate the expected SOC values and risk coefficients in the discount rates of their respective SOC PVaR bonds. Nitrogen and Phosphorus are not directly utilized in the quantification framework; however, their causal relationship to SOC and use as root underlying indices are discussed in Section 4.1. Several meta-studies exist on the optimal metrics of SOC increase [78], however, their review and evaluation escape the scope of this work. Moreover, the SOC PVaR financial instrument is based on the observed SOC increase in the tested CSs, which is a rather simple and straightforward metric of the performance of regenerative practices. Hence, the EUSO SDIs framework is utilized, as it comprises an EU regulatory reference for future soil policies [79]. The SDI categories considered more related to SOC performance are presented in Table 1 below.

Table 1.
SOC loss and Soil Nutrients as part of the EUSO SDIs list.
To model the continuous distributions of SOC differences, we utilized SOC measurements from each CS as well as literature sources [11]. The SOC measurements were performed for 3 different treatments in each CS, ranging from conventional tillage to enhanced regenerative practices—including the combined effect of organic biomasses and microorganisms that the REGENA Production Function relates mathematically [38]. For each treatment, the measurements were repeated for 3–4 statistically independent replicates to test SOC differences. The replicate number encodes the replicate measurement in each one of the 3 treatments in the experimental plot. Due to the low number of measurements (essentially 3–4 initial and 3–4 final) from each treatment, the spatial statistical independence is convenient for the use of Normal Distribution to model a continuous distribution of SOC differences (between final and initial measurements) with sufficient reliability. The variability of the extrapolated distributions is then utilized to estimate the risk-adjusted discount rate via an adjusted Shannon entropy index that has been used in discrete-time systems [17]; here, modified to fit continuous distributions. Finally, via the distributions, we estimate the expected SOC value from the CO2 prices of the EU Emissions Trading System (EU ETS) [80].
It is frequently argued that, as carbon farming is not included in the EU ETS, alternative abatement prices should be adopted [81]. Although social pricing methods are more inclusive and consistent with bottom-up accounting approaches to pollution costs, a counter argument is that the EU ETS already includes a part of the abatement costs in the form of endogenized Research and Development (R&D) expenditures for substituting fossil fuels with alternative energy technologies. Hence, as part of these abatement costs is already accounted for, CO2 rights in the EU ETS are demanded for residual emissions to be offset still. Another counter argument is that an additional part of the abatement cost is embodied in carbon taxes and hybrid models. Finally, carbon farming is an activity mainly covered by voluntary markets with carbon prices that are significantly lower than the EU ETS [82]. In any case, as the thorough examination and assessment of CO2 pricing methods are out of the scope of this work, we adopt a convergent price as a benchmark. In addition, as the per se methodology described below remains unaffected by the assumed carbon price, while as the EU ETS mean 2024 price overlaps with the lower bound abatement CO2 price [81], we may adopt the EU ETS price as sufficiently representative for our simulation.
2.3. Engineering the SOC PVaR Financial Instrument
As presented in the previous section, we simulate SOC PVaR with consistency to the EUSO SDI definition, utilizing the SOC measurements from each one of the 3 treatments that took place in each of the 5 CSs at soil depths of 0–30 cm, with 3–4 random and statistically independent replicates for each treatment. The statistical independence of the replicates is cross validated by the indications of normality from the derived boxplots on their mean and variability values.
Following the EUSO definition, as shown in Table 1, soils are considered unhealthy if the measured SOC level is 60% lower than the maximum value. The 60% threshold is selected as a reasonable and pragmatic distance gap from the maximum achievable SOC level across the industrialization of agriculture and the shift towards petrochemical fertilizers and pesticides since 1800 [24]. As the main goal of CF is to increase SOC and reduce the distance between current and maximum levels, the uncertainty of this process should be incorporated into the financial instrument. Specifically, a CF investment should be discounted in present monetary values, with the benchmark or minimum-risk discount rate increased by an uncertainty coefficient. These two factors combined form the risk-adjusted discount rate that assesses the SOC PVaR for a sequence of years. The uncertainty coefficient derives from the variability of the distribution of SOC differences (with a mean and a Standard Deviation value), measured by the replicates of each treatment. The coefficient is calculated via a basic Shannon Entropy H(C) [67] metric on the variability of SOC differences from n replicate observations per k tillage methods used:
In Equation (3), the replicate number n per treatment k signifies the replication performed for each treatment in the experimental design. Typically, although for continuous distributions the information entropy is proportional to the Standard Deviation (H(C)∝σ), for empirical time series, it can demonstrate paradoxical behavior. For instance, SOC differences may demonstrate very low information entropy with oscillating behavior, acquiring only two extreme (Min; Max) values. Such a behavior of periodically iterated observed values would yield low information entropy but would still suffer from undetected variability if the typical H(C) was used without a normalization coefficient on the range of the distribution. On these grounds, a generalized formulation of Equation (3) may be postulated to include the effect of the (empirical or fitted) distribution’s variability of SOC differences from k (where in our case k = 3) treatment methods, which we may re-write as:
Equation (4) complements the basic Shannon Entropy metric of Equation (3), with an oscillator function as a weight to the standard H(C) metric to include the effect of the distribution’s total range on the risk coefficient. The oscillator consists of the distribution of SOC differences as the range between its maximum and minimum values divided by the maximum value, with the oscillator’s value range set to ADJ|k ∈(0,1]. For values MinCk ≤ 0, the oscillator automatically receives a value of ADJ|k =1 to avoid an underestimation of the risk factor; either for the case (i) where MinCk ≤ 0, signifying a positive probability of the treatment to be a net SOC remover and net CO2 emitter, or (ii) where both MinCk and MaxCk ≤ 0, signifying the treatment’s certainty (pi = 100%) to be net SOC remover and CO2 emitter. In the financial instrument, SOC comprises a benchmark ES—accounting for the generated revenues from atmospheric CO2 removals and their transformation into SOC with the CICES v5.1 ES code 2.1.1.2—as well as an underlying index. This approach addresses the need to adopt a representative risk-adjusted payoff metric, sought by financial institutions for discounting the NPV of CF investments.
The NPV is a reference financial method for assessing the current value of an (estimated) future stream of cash flows. To bring the value of these future cash flows into the present, a discount rate is used. As mentioned, the discount rate consists of the minimum-risk yield depicting the alternative (or safest) investment—such as a bank deposit—and a risk coefficient denoting the uncertainty of the expected cash flows. Hence, to consider a carbon farming investment for atmospheric CO2 removal and SOC increase as more preferable to the minimum-risk investment, the yield at the contract’s maturity (in our case, 30 years) should have a positive value, quantitatively set for NPV > 0. In this context, we may write the generalized NPV ecological finance model for each treatment k as:
In Equation (5), K0 is the initial financial investment at time step t = 0, i is the benchmark or minimum-risk discount rate, and H(C)ADJ|k is the risk coefficient per treatment k, expressed in terms of adjusted Shannon Entropy, shown in Equation (4). The discounted profit flows from SOC are the net sum of operational revenues (B) minus the sum of operational costs (E) and Scarcity Rents (SRs) (λ) at all time steps (t). The SR expresses the net lifecycle depletion of any resource used as an infrastructure element [83]. For instance, the use of critical minerals for digital monitoring induces a scarcity effect on their proven reserves, as this type of resource is exhaustible. Even logging as part of the CICES v5.1 ESs list can cause a net scarcity effect if the wood biomass is extracted at a higher rate from its natural replenishment rate. Overall, the discounted profits must be positive at the end of the infrastructure’s lifetime TK, with the upfront investment (K) taking place during the preparatory period t:0 → TI before the infrastructure becomes fully operational and starts generating revenue. Analytically, the nominal (undiscounted) revenue flow at each time step, as soon as the infrastructure becomes operational, is equal to the expected value of CO2 removal from the atmosphere and its transformation into SOC as:
Equation (6) suggests that the expected cash flow (B) at any time step t for each treatment k is equal to the atmospheric CO2 removal coefficient (β), multiplied by the expected value of atmospheric CO2 removal by the treatment within its distribution’s range (MinCk and MaxCk), and further multiplied by the mean annual price of CO2 emissions in the EU ETS. The coefficient of atmospheric CO2 transformation to SOC (β) is assumed to be universal and equal to 3.67 [84,85,86,87], which stands for the ratio of the molecular mass of CO2 to C that is assumed to be broken down and metabolized in the soil. In addition, the result of Equation (6) is normalized to turn tons to grams of SOC per kg of soil. Finally, to compare the SOC PVaR performance in each country, taking into consideration their differences in fundamental economic variables, such as their exchange rates, the minimum-risk discount rates, and the price indices, the result is normalized into PPPEUR as:
Equation (7) suggests that, after the biophysical performance of each treatment is assessed, the purchasing power differences in the same monetary unit in the different countries of the CSs should be accounted for—especially since they are significant. Hence, we normalize all values into EUR PPP [88], taking into account currency exchange rates, the EU HICP [89] and the nominal discount rates [90] in the CSs, to simulate the SOC VaR of the ecological intergenerational finance instrument with a maturity of 30 years.
3. Results
In this section, we analytically present the results of our analysis on (a) the recording of ESs of CICES v5.1 by ABMR pillar for each of the 8 examined CSs, and (b) the SOC VaR as the CICES v5.1 biotic regulatory and maintenance ES 2.1.1.2 in 5 examined CSs (except for CS2 in Italy, CS5 in Morocco and CS8 in Portugal) for 3 treatments. This analysis contributes to the establishment of ESs valuation methods within FCBA frameworks, as depicted in the System of Economic and Environmental Accounting (SEEA) [3]. The application of integrated environmental and economic accounting methods is the cornerstone for the monetization and market uptake of regenerative farming practices that have a significant time lag to yield results [38], while appearing more expensive with conventional accounting methods. In addition, the FCBA is essential to providing financial institutions with the proper underlying indices in contracts that incorporate the value of (restored) biodiversity [91], manage climate-related risks [92,93] and balance supply chain instabilities [94].
3.1. Pivotality of Ecosystem Services by Regenerative Farming Pillar
A major challenge in the field of natural resource economics is to monetize ecosystem services as final ecological goods deriving from intermediate ecosystem functions and embody their value added in the socio-economic production nexus [52]. The concept of ecosystem services is relatively new, substantiating the economic value that ecosystem functions provide to the human economy that would be either impossible or extremely expensive to be substituted by human technology [53]. Based on these features, the fundamental property of ESs is their non-substitutability or complementarity [95,96,97].
The responses of the 8 CSs on the identification of ESs by ABMR pillar (see Appendix A for the analytic record) resulted in the recording of up to 23 ESs out of 92 in total in the CICES v5.1 framework, signifying that up to 25% of the complete ESs list could be generated in the CSs. The highest number of ESs were recorded in CS6 and CS7 (=21) with three examined regenerative pillars each (ABR in CS6; BMR in CS7). The lowest number of ESs were recorded in CS3 (=5) and CS5 (=6) with two regenerative pillars (MR). It is important to note, though, that the above purely concern the ESs identification without any qualitative or economic value aspect; hence, deviations between CSs do not signify a lower economic value due to the lower number of identified ESs. For instance, an ES in an arid area related to pillar R against pests or heat waves may embody a higher economic value—in terms of cost savings—for a specific area than for somewhere else. Additionally, the most commonly identified ESs were “Micro-biotic Filtration and Sequestration” (code 2.1.1.2) and “Disease Control” (code 2.2.3.2), with 75% frequency. SOC is related to ES 2.1.1.2 that was identified in all CSs except for CS2 and CS5. The ES 2.1.1.2 description is “By type of living system, or by water or substance type”. Another vital facet of ESs identification concerned the intensity of an observed ES by its examined pillars. CS7 and CS8 identified potential ESs, even for regenerative pillars they did not examine (CS7 on pillar A; CS8 on pillars A, M), while a contrasting view was observed in CS4 and CS8, which did not identify any ES for their examined pillar R. The intensity of ESs by ABMR pillars is shown in Figure 2.
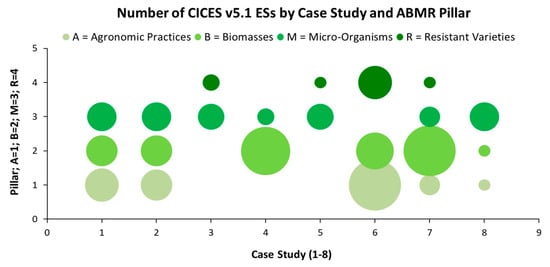
Figure 2.
Classification of ES intensity (size of the bubble) per ABMR pillar in each of the 8 CSs.
According to Equation (2), we observe that, although pillar B is more frequently identified as being associated with the generation of ESs (61 ESs), it is highly concentrated to specific CSs, while it is missing completely from CS3 and CS5 and with very low contributions to CS8. In contrast, pillar M is more dispersed, as shown in Table 2.
Table 2.
Frequency and Shannon Information Entropy H(E) of each ABMR pillar as a source of ES generation across the 8 CSs.
Table 2 presents the H(E) metric in terms of proximity to the uniform distribution or Maximum Entropy (MaxEnt) state [67] for each regenerative pillar and the total number of identified ESs associated with it. As the CSs were requested to identify potentially generated ESs, even by pillars they did not examine, the H(E) metric’s physical meaning is that if an ABMR pillar is pivotal for ES generation, it will be identified more frequently in each CS, irrespective of geography and number of examined pillars. This feature complements Figure 2 that visualizes ESs distribution by pillar (horizontally) and by CS (vertically). In addition, Appendix A presents data on the frequency of every ES identified at least once in each CS, although without indicating for which ABMR pillars in each CS this ES was identified. Finally, another crucial CICES v5.1 aspect concerns the overlap between some of its 92 recorded ESs, which was a challenging issue for the responding CSs as well. For instance, ES 2.2.4.2 with the description “Decomposition and fixing processes and their effect on soil quality” and ES 2.2.6.1 with the description “Regulation of chemical composition of atmosphere and oceans” were also considered directly relevant to atmospheric CO2 removal—as suggested by their respectively high identification frequency (62.5%). Although ES 2.1.1.2 is considered more representative in terms of description and definition proximity to the SOC, it was noted in the surveys that ESs 2.2.4.2 and 2.2.6.1 comprised different parts of the ES 2.1.1.2 lifecycle process, involving pillars B and M. This indicates the possible restructuring of classification methods with fewer overlaps in the updated CICES standard.
3.2. SOC PVaR Simulations
Equation (7) suggests that the PPP of each EUR unit in the country i of each examined CS is equal to the exchange rate (Ri) on the EUR, multiplied by the HICP to the CPIi ratio. The HICP is assumed to be common to all CSs in the countries of the EUR zone, while the CPI of every non-EUR zone country was examined separately. The results of the analysis with every building block of the cumulative 30-year PVaR are presented in Table 3.
Table 3.
PVaR components and accumulated discounted 30-year values for each of the 3 treatments tested in each of the 5 CSs.
For convenience, the effect of variables K, O, and λ of Equation (5) are left out of the analysis, having a negligible modeling impact, considering also the several uncertainties that would require rational assumptions to compensate for the lack of data. For instance, the tested plots are small without benefiting from economies of scale that would depict the full potential of lowering the cost (O). Hence, we focus on the size of cash flows (B) at each time step and on the instrument’s components, as shown in Equations (3)–(7). Table 3 presents the instrument’s components for each of the three treatments in each CS, as well as the cumulative SOC PVaR from each treatment in terms of grams of SOC per kilogram of soil. The CO2 transformation coefficient (β) of 3.67g of the atmospheric CO2 uptake per g of the SOC mass is adopted as universal for all treatments [84,85,86,87]. For the monetary value, the expected value of CO2 uptake is multiplied with the 2024 mean annual carbon permit price in the EU ETS (=57.03 EUR/ton CO2) [80]. For simplicity, this price is assumed to be constant until the contract’s maturity at 30 years, with respective cash flows assumed to be constant as well. This may underestimate the level of cash flows, as it is quite likely that carbon permit prices will be increasing along with the depletion of the atmospheric CO2 carrying capacity in the next decades. Finally, the expected value of the SOC difference in each treatment is assumed to derive exclusively from atmospheric CO2 sequestration. The economic rationale behind risk-adjusted discounting is that treatments with higher SOC formation uncertainty should compensate investors for the cost that they would bear to hedge this uncertainty via additional insurance instruments [93]. The distributions of SOC differences and per year cumulative SOC PVaR results are presented in Figure 3.
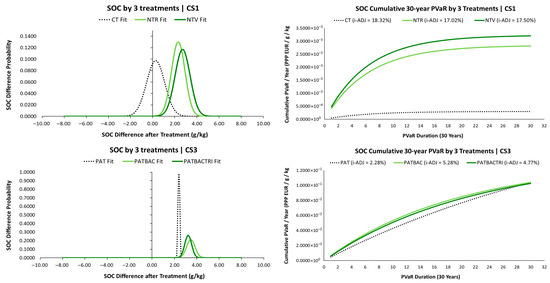
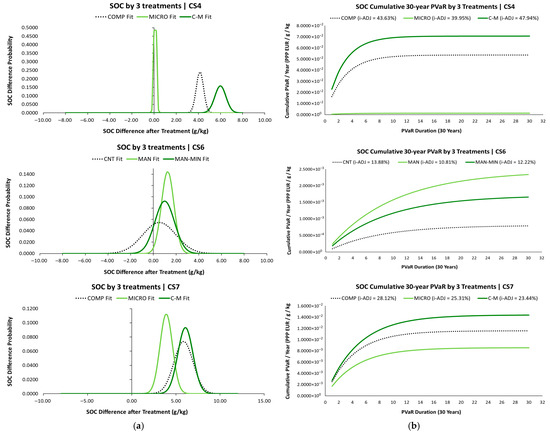
Figure 3.
Derivation of SOC PVaR from the moments (Mean; StDev) of SOC difference distributions for each treatment: (a) continuous distributions of SOC differences (as g of Carbon/kg of soil) after the application of each treatment in each CS; (b) 30-year SOC PVaR in PPP EUR values per treatment in each examined CS.
From Table 3 and Figure 3, we can conclude that the highest performance in terms of SOC PVaR is achieved by CS3, with a range of 1.0271 × 10⁻¹ to 1.0399 × 10⁻¹ EUR per SOC g/kg of soil. In addition, the performances of all three treatments in CS3 have a minimum distance, signifying that as alternative solutions, they achieve a relatively equivalent effect. A similar view is observed for other CSs in non-EUR zone countries (CS4, CS7), with SOC PVaR performance within a higher order of magnitude in relation to CSs in the EUR zone (CS1, CS6). At this point, it should be noted that this higher performance of CS3, CS4, and CS7 mainly derives from the high PPP coefficient, combined with the lower risk-adjusted discount rate that allows for a higher PV of future cash flows—especially for CS3. What the PPP essentially suggests is that each EUR currency unit has higher purchasing power in Morocco, Egypt and Tunisia, than in Italy and Spain. It means that if the EU ETS paid an EUR unit to a carbon farmer for transforming one unit of atmospheric CO2 into SOC, this EUR unit could purchase 9.6193 more goods in Morocco, 27.0192 more goods in Egypt and 2.6575 more goods in Tunisia. The effect of PPP is partially compensated for by the high nominal (minimum-risk) discount rates in CS4 and CS7 countries, dragging the PV of their future cash flows downwards at a faster rate.
Even though the above economic performance of the CSs in non-EUR zone countries could theoretically depict their biophysical performance as well, such a direct conclusion should be avoided. The essential diagnostics on the biophysical performance of each treatment in Table 3 are the Shannon Entropy H(C) metric, the adjustment coefficient ADJ, and their combined effect as the adjusted Shannon Entropy H(C)ADJ metric. These indices are completely independent from monetary effects between countries, depicting the pure effect of selected treatments in terms of SOC differences. Specifically, for the best performing treatments, the mean value would locate the distribution to the right of the probability (vertical) axis with the longest possible distance from the zero (=0) value at the intersection of the vertical and horizontal axes and with minimum Standard Deviation, which would graphically shape the distribution as narrow as possible. The high mean value statistically signifies that the expected future cash flows (B) in Equation (5) will be high, while the low variability (in terms of Standard Deviation) signifies that these cash flows will take place in the long term near the expected (mean) value with high certainty and without deviating significantly from it. The combination of these statistical properties essentially motivates investors to engage in carbon farming projects with a high expected revenue and low risk.
The biophysical meaning of such a combined statistical behavior with high Mean and low Standard Deviation would suggest that the treatment is very effective at transforming atmospheric CO2 to significantly increase the SOC with high certainty, which signifies resistance towards external conditions, such as temperature, wind and precipitation variability. This behavior is attractive for investors and is reflected in the risk-adjusted discount rate that depicts the environmental risk of manifesting the expected SOC cash flows across the 30-year period with predictability. The size and predictability of expected future cash flows in environmental investments is of imperative importance to investors for managing their financial liquidity [40] and costs from additional financial instruments that function as insurance instruments against hydroclimate variability [93]. These features exclusively concern the size and environmental uncertainty of SOC cash flows, irrespective of a country’s background economic conditions, such as exchange rates, benchmark discount rates and consumer prices. From the components of Table 3, it is evident that CS3 demonstrates the highest performance even by these criteria, with the lowest H(C) and ADJ indices, followed by CS4 and CS7.
In contrast, CS1 and CS6 demonstrate the lowest SOC PVaR performance that is also reflected in the respective environmental diagnostic indices in Table 3, along with the Microorganisms treatment in CS4 as the only exception to North African CSs. However, it should be noted that CS1 and CS6 apply relatively mild regenerative treatments. Those mainly concern 3 alternative tillage methods in CS1 and 3 alternative fertilization methods in CS6, where direct sowing is applied in all of them. CS1 is the only one testing a Conventional Tillage (CT) treatment, compared to No-Tillge Rye (NTR) and No-Tillage Vetch (NTV) treatments as its regenerative alternatives. From Table 3 and Figure 3, CT yields low SOC PVaR, with a 42.06% probability to either maintain a net-zero carbon balance (no net release or uptake) or release soil carbon into the atmosphere. With such a low probability of atmospheric CO2 transformation into SOC, the expected cash flows from the CT treatment are among the lowest, irrespective of the distribution’s variability. A similar phenomenon is observed for the MICRO treatment in CS4, with a net-SOC formation probability being only marginally higher than 50%. A slightly better view is observed for the CNT (control treatment with no fertilization), with a 61.71% probability of net-SOC formation.
With the same rationale, NTR in CS1 has only 0.010% probability of net-zero or negative carbon balance, while NTV has a 0.0065% probability, which may be considered negligible. Respectively, for CS6, the treatment with dairy manure without fertilization at top dressing (MAN) only has 1.66% probability of a net-zero or negative carbon balance, while the same treatment with mineral fertilization at top dressing (MAN-MIN) has a probability of 14.77%. In addition, the best performances in terms of average SOC distances from the optimal EUSO value after each treatment are achieved in CS3, with 36.96% for the PAT treatment, 33.73% for the PATBAC treatment, and 34.41% for the PATBACTRI treatment; in CS7, with 51.37% for the COMP treatment, 57.12% for the MICRO treatment and 50.75% for the C-M treatment; and CS1, with 65.92% for the CT treatment, slightly lower than the tolerance value, 59.92% for the NTR treatment and 58.77% for the NTV treatment, which is within the maximum tolerable SOC distance and is significantly better than the CT performance.
4. Discussion
Except for the necessity for a scientific conceptualization of nature-based and regenerative anthropogenic structures, with the minimum deviation of their energetic functions from the benchmark eco-energetic level being the fundamental evaluation criterion [22]—as shown in Figure 1—respective regenerative economic and financial designs should be consistent with the laws of thermodynamics. Such designs can be found in the SEEA [3], as well as in the EU GD [62,63] and EU SFT [59] that realize this biophysical reality; however, there are significant difficulties turning it to mainstream business practice and market uptake. In this section, we discuss three extensions of our current work: (a) the utilization of Nitrogen and Phosphorus nutrients as causal factors of SOC formation [12], according to the Sprengel and von Liebig Law of the Minimum [13]; (b) the aspect of FCBA for regenerative economic systems; and (c) the restructuring of ESs classification standards towards lifecycle accounting—with a focus on CICES v5.1 as the most widely used standard.
4.1. Nitrogen (N) and Phosphorus (P) Balance Optimization
A significant aspect of our work with potential biophysical and financial extensions concerns the deduction of atmospheric CO2 transformation to SOC from Nitrogen (N) and Phosphorus (P) as the major complementary nutrients that are necessary for plant metabolism and biomass formation. In addition, N and P comprise a fundamental category with the title Soil Nutrients in the EUSO SDIs list, as presented in Table 1. A fundamental mathematical relationship of soil nutrients derives from the Sprengel–Liebig Law of the Minimum [13,17,24,38] by which plant growth depends on the nutrient in minimum relative availability. Minimum relative availability is defined as the maximum exact ratio of the minimum quantity X of an n nutrient required to be combined with the respective minimum quantities of the n − 1 complementary nutrients to form one unit of biomass in relation to their environmental availability Yn. We model XY to depend on the system’s limiting factor as:
Equation (8) depicts the law as a Consumption to Reserves (X/Y) ratio, which is widely used in natural resource economics. In regard to its physical meaning, for a typical ratio of Carbon, Nitrogen, and Phosphorus nutrients, C/N/P = 41/7/1, and a natural availability of Phosphorus at only 0.5 units, the system will utilize only 20.5 units of Carbon and 3.5 units of Nitrogen to preserve this ratio. Any excess amounts will remain unutilized by the system at the risk of them migrating via water flows to wetlands and groundwater aquifers, causing eutrophication and pollution. This is another aspect of regenerative farming practices with high value-added. For instance, Nitrogen-fixing bacteria optimize, via natural processes, the above ratio [12,38] and substitute petrochemical fertilizers, along with the reduction of risks for excessive water consumption and eutrophication.
In this context, we may identify two vital aspects of the N-P balance that can further imprint on the payoff underlying indices of ecological finance instruments: (a) the optimal ratio of utilized (C/N/P) nutrients, so that the system fully utilizes the available resources with no surplus remaining [24] at the risk of migrating and causing environmental pollution; and (b) the optimal ratio of utilized nutrients so that atmospheric CO2 removal and transformation into SOC are maximized. Specifically, the optimal utilization of nutrients maximizes biomass growth and atmospheric CO2 sequestration for metabolism. Furthermore, such an optimization—especially when achieved via organic biomasses—limits the use of N-content petrochemical fertilizers, which from a lifecycle viewpoint, constitute by default a serious source of atmospheric and soil pollution in the form of embodied (across their manufacturing stage) and operational (across their use stage) GhG emissions [98]. In this respect, the optimal utilization of nutrients reduces the probability of excess and the accumulation of P-content fertilizers that result in eutrophication [24], water quality degradation, biodiversity decline, and public health risks. In a financial engineering context, the above-described benefits of pollution reduction and avoidance could be incorporated into the underlying payoff indices of ecological investment contracts and their correlated derivatives, designed for hedging climate risks [93] and reducing insurance costs.
4.2. Full Cost–Benefit Accounting (FCBA) for Regenerative Farming
The transition from conventional to integrated accounting models requires a fundamental classification of all costs and benefits of a production process that, according to the Second Thermodynamic Law, is a process of transforming in situ natural resources into structured goods that embody economic utility [26,27,29,30,49,53,56,57]. In any production process, waste generation is an inevitable part; hence, the vital issue for adapting economic processes to nature-based functioning is the minimization of waste output within ecosystems’ carrying capacity [17,22,24,30,96,97,98]. This context is directly related to the establishment of quantitative methods for assessing environmental costs, further classified in resource depletion and ecosystem degradation costs that have to be added to conventional costs. Conventional costs are related to the legal establishment and operation of a farm, whether conventional, regenerative, or mixed, that are part of production functions [37,38], which include labor costs, mechanical capital purchases, and financial costs (discount rates).
The building blocks of conventional costs are (a) Capital Expenses (CAPEX) as the investment cost for a farm’s foundation, facilities, and infrastructure. CAPEX may be either tangible (e.g., equipment) or intangible [40,99], such as Intellectual Property (IP) assets [38] that are subject only to technological depreciation. As argued in a related work [38], intangible assets comprise the parts of conventional costs that are of imperative importance for regenerative farms. Specifically, a significant fraction of their differentiation from conventional farms and value-added composition depends on the scientific research of local agro-ecosystems and the development of optimally adapted solutions. In turn, (b) Operational Expenses (OPEX) concern a set of costs that are a direct function of a farm’s operations and production volume, including machinery maintenance, software licenses, manual labor, electricity, fertilizers’ use, fuels, pesticides, and testing. A special category of conventional costs is (c) Administration Expenses (ADEXs), which include a farm’s expenses for corporate management (e.g., its Board of Directors), accounting and legal departments, as well as all expenses that aim at keeping the farm compliant with its institutional and economic environment. ADEXs are usually negligible for small-scale farms and are frequently classified as part of OPEX, although for large agricultural corporations with possession of large areas of land and industrial sites, this should be calculated separately.
Complementary to conventional costs are the environmental costs related to the environmental impacts of a farm and the core of the argumentation on the how the differentiation of regenerative and carbon farming practices should be respectively reflected in accounting standards. In addition, we may identify a potential substitution relationship between conventional and environmental costs, as each crop production method or technology may have different environmental impacts. For instance, an advanced farm monitoring system for beneficial microorganisms and organic biomass to optimize their combined use [13,38] can impose higher conventional costs on a regenerative farmer in relation to a conventional farmer that—in terms of lifecycle footprint—would signify that the regenerative farmer is more expensive. The same monitoring system, though, can generate lifecycle environmental restoration and pollution avoidance benefits that, if properly accounted for, can offset the previous conventional cost increase. The lack of monetization standards for environmental benefits maintains a bias in favor of agricultural practices of lower environmental effectiveness, preventing financial institutions from investing in regenerative structures.
In this context, environmental costs and benefits are classified into (a) Resource Costs and Benefits (RCBs), which are related to the use intensity of virgin resources. From a lifecycle analytics perspective, the use of virgin resources intensifies thermodynamic depletion at the extraction stage [100], while the use of recycled materials (e.g., residual biomass instead of petrochemical fertilizers) generates a resource depletion avoidance effect. A special case is water resources, where their conservation (depletion prevention) may concern water quality [50,51] via recycling, while decreasing exposure to hydroclimate variability [54]. Complementary to RCBs are Ecosystem Services’ Costs and Benefits (ESCBs), which are related to the impact of (crop) production methods and technologies in terms of their disruption of nature-based eco-energetic flows [22] or the deterioration of ecosystems under stress, eventually reducing the species, quantity and value of ESs.
4.3. Ecosystem Services Accounting at Lifecycle
The tuning of lifecycles of ecological processes that generate ESs to economic lifecycle analyses, constitutes a pivotal scientific and technical challenge for the accurate depiction of the distribution of environmental costs and benefits at each process stage. The Product Environmental Footprint (PEF) [65] constitutes the technical background for an EU legislation-compatible FCBA framework, as defined in the 2000/60 WFD [101] and the SEEA [3]. The PEF is a straightforward and consistent lifecycle impact accounting standard for monetizing both conventional and environmental costs and benefits at the EU scale. In addition, it consists of 15 variables, of which 3 relate to resource depletion and 12 to ESs degradation. This paves the way for updating the CICES v5.1 standard towards its compatibility with the PEF to cope with the issue of ES overlaps in the current version, as pointed out in Section 3.1, regarding an observed overlap between ES 2.1.1.2, ES 2.2.4.1, ES 2.2.4.2, and ES 2.2.6.1. Specifically, the CSs reported that ESs 2.2.4.1 and 2.2.4.2 comprise different stages of intra-soil cycles of microbiota biomass growth and decay that could be integrated into ES 2.1.1.2 and generate the climate effect described in ES 2.2.6.1.
The classification of monetizable environmental costs and benefits of available production processes has been at the core of natural resource economics discussions since the theoretical beginnings of global-scale climate change impact assessments [55], which were adopted for establishing “green” corporate and national accounts. A respective landmark was the 1992 Rio Summit and declaration of the Agenda 21, which essentially inspired the 2000/60 WFD [101] and SEEA [3]. In this context, lifecycle monetization aims at disclosing information about the regenerative and carbon sequestration potential of production processes within the Extended Producer’s Responsibility (EPR), the Sustainable Development Goals (SDGs), as well as the EU GD and EU SFT frameworks. Especially for food systems, the quantification of carbon sequestration potentials [102,103] is accompanied by labeling systems [104] that can be further utilized as lifecycle environmental performance declarations for higher consumer transparency and investment traction. With agriculture being a sector heavily dependent on fossil fuels since the Industrial Revolution [24,75], the PEF is compatible with the eco-energetic definition of nature-based systems, accounting for the disruptive impact of production processes to interlocked biogeochemical cycling functions [23]. Finally, a crucial feature of the PEF is the identification of unequally distributed costs and benefits across the lifecycle stages for targeted and low-cost interventions by (carbon) farmers.
5. Conclusions
In our work, we develop the theoretical and quantitative foundations of the financial engineering module of the REGENA Production Function for the design of tailored financial instruments for regenerative and carbon farming as an issue of vital importance for the academic literature and business practices in the context of the SEEA, EU GD and EU SFT, as reflected in the EU Regulation 2024/3012 [60] on the establishment of carbon removal markets with the participation of agriculture. The new legislation aims at the structural change from intensive conventional farming to the utilization of local biodiversity and ecological capital pillars, such as agronomical practices, organic biomasses, beneficial microorganisms and resistant varieties that we denote as ABMR pillars. The major challenge our work contributes to is achieving this transition via the market uptake of regenerative and carbon farming practices. As argued, this challenge consists of two vital aspects for accurate comparisons between different farming practices: (a) the extension of conventional accounting to include accounting for environmental costs and benefits and (b) the design and structuring of tailored financial instruments for carbon farming, with adequate environmental performance underlying indices that secure the investability of carbon farmers and sufficient investment returns to those who will provide the upfront capital.
To address the above issues, we develop a conceptual framework on the hierarchical classification of nature-based, regenerative and carbon sequestration structures to clarify a frequently observed overlap of their interchangeable use. In this context, we argue that, as we accept that soils are degraded in comparison to their optimal nature-based state, the recommended solutions for reversing this trend belong to regenerative systems, where carbon sequestration systems (CarSeqS), such as carbon farming, are a special class of regenerative systems that prioritize soil carbon as an inclusive overall indicator of ecosystem health. In turn, we argue that, as regenerative and carbon farming systems require a significant time lag to yield results, the Environmental Value at Risk (EnVaR) from expected Ecosystem Services (ESs) can comprise the collateral asset base on upfront invested capital from financial institutions in the contexts of the SEEA, EU GD, and EU SFT. For charting these potential environmental values, 8 Case Studies (CSs) in South Europe and North Africa identified the potentially generated ESs across the 4 ABMR pillars, following the Common International Classification of Ecosystem Services (CICES) v5.1 (2018) standard. From the list of identified ESs, Soil Organic Carbon (SOC) was selected to be quantified via a tailored ecological bond instrument as a benchmark CICES v5.1 ES under the code 2.1.1.2 due to its straightforwardness to assess, as well as its pivotality as part of the European Union Soil Observatory (EUSO) Soil Degradation Indicators (SDIs).
For the quantitative modeling, we design and engineer a 30-year-maturity intergenerational ecological bond with a Present Value at Risk (PVaR) applied to atmospheric CO2 removal and its transformation into SOC for five CSs. The PVaR is calculated in Purchasing Power Parity (PPP) EUR units for normalizing differences in exchange rates and price indices between CSs in the EU (CS1, CS6) and North Africa (CS3, CS4, and CS6). As atmospheric CO2 is considered to be a pollutant with a cost that is negotiable in the EU Emissions Trading System (ETS), the bond becomes an ES value financial instrument that derives from soil regeneration. This environmental asset is endowed to current and future generations, addressing the aforementioned challenge of financial institutions to upscale investments in regenerative systems via a rich inventory of proper underlying indices for monetizing environmental benefits. The PVaR simulation results show an impressive performance of enhanced regenerative practices in terms of long-term SOC value.
Finally, we discuss three main extensions of our work, regarding the optimization of Nitrogen and Phosphorus balances as causal elements of SOC maximization, the principles of universal Full Cost–Benefit Accounting (FCBA) standards, as well as the issue of ESs lifecycle accounting and valuation in an updated CICES version, along with its fine tuning using the Product Environmental Footprint (PEF) as an umbrella method in the EU. Considering the observed ES overlaps from the surveys, a key insight was that several ESs constituted different stages of the same soil lifecycle. In this context, a CICES update could be oriented towards an ES lifecycle approach to reflect these processes more accurately.
Author Contributions
Conceptualization, G.K.; methodology, G.K.; REGENA design and name, G.K.; REGENA financial engineering module design, G.K.; software, G.K.; validation, G.K., D.M. and E.M.; formal analysis, G.K.; investigation, G.K.; resources, G.K. and D.M.; data curation, G.K., D.M. and E.M.; writing—original draft preparation, G.K.; writing—review and editing, G.K., D.M. and E.M.; visualization, G.K.; supervision, G.K. and D.M.; project administration, G.K. and D.M.; funding acquisition, G.K. and D.M. All authors have read and agreed to the published version of the manuscript.
Funding
Financial support has been provided to the project Sustainable Innovations for Regenerative Agriculture in the Mediterranean (SIRAM) by the Partnership for Research and Innovation in the Mediterranean Area (PRIMA), supported by H2020, the European Program for Research and Innovation, as well as the General Secretariat for Research and Innovation (GSRI) in Greece that funded the research and the APC for this work, under the approval code ΓΓP21-0475840/ΓΓΕΚ Prima 2021-15.
Data Availability Statement
Raw data can be made available with permission by their providers. Structured data and simulations can be provided by the authors upon request.
Acknowledgments
The authors thank the SIRAM partners that provided data. The authors further thank Christoforos Lagadas for his insights and observations on the manuscript, the GSRI staff for their support, as well as the anonymous reviewers for their valuable comments on the manuscript.
Conflicts of Interest
Corresponding author Georgios Karakatsanis and co-authors Dimitrios Managoudis and Emmanouil Makronikolakis offered their expertise for the company EVOTROPIA Economic Architectures Private Company within the context of the PRIMA-SIRAM project. The authors declare that the research was conducted in the absence of any commercial or financial relationships that could be construed as a potential conflict of interest.
Abbreviations
The following abbreviations are used in this manuscript:
| CF | Carbon Farming |
| SOC | Soil Organic Carbon |
| KPI | Key Performance Indicator |
| SDI | Soil Degradation Indicator |
| EUSO | European Union Soil Observatory |
| ES | Ecosystem Service |
| CICES | Common International Classification of Ecosystem Services |
| EU | European Union |
| RoI | Return on Investment |
| N | Nitrogen |
| P | Phosphorus |
| NBS | Nature Based Systems |
| RS | Regenerative Systems |
| CarSeqS | Carbon Sequestration Systems |
| CR | Chapman-Richards |
| CAFE | Carbon Agriculture Financial Engineering |
| EU GD | European Union Green Deal |
| EU SFT | European Union Sustainability Finance Taxonomy |
| CS | Case Study |
| REGENA | REGENerative Agriculture Production Function |
| VaR | Value at Risk |
| NPV | Net Present Value |
| A | Agronomical Practices |
| B | Organic Biomasses |
| M | Beneficial Micro-Organisms |
| R | Resistant Varieties |
| HICP | Harmonised Index of Consumer Prices |
| PPP | Purchasing Power Parity |
| FCBA | Full Cost Benefit Accounting |
| GWP | Global Warming Potential |
| PVaR | Present Value at Risk |
| AR | Assessment Report |
| IPCC | Intergovernmental Panel on Climate Change |
| GhG | Greenhouse Gas |
| EU ETS | European Union Emissions Trading System |
| R&D | Research & Development |
| SR | Scarcity Rent |
| SEEA | System of Environmental and Economic Accounting |
| MaxEnt | Maximum Entropy |
| CT | Conventional Tillage |
| NTR | No-Tillage Rye |
| NTV | No-Tillage Vetch |
| PAT | Pathogen Treatment |
| PATBACTRI | Pathogen-Bacteria-Trichoderma Treatment |
| COMP | Compost Treatment |
| MICRO | Micro-Organisms Treatment |
| C-M | Combined Compost and Micro-Organisms Treatment |
| CNT | Treatment Control with No Fertilization |
| MAN | Pre-Sowing Daily Manure without Top-Dressing Fertilizer |
| MAN-MIN | Pre-Sowing Dairy Manure with Top-Dressing Mineral Fertilizer |
| CAPEX | Capital Expenses |
| IP | Intellectual Property |
| OPEX | Operational Expenses |
| ADEX | Administrational Expenses |
| RCB | Resource Costs and Benefits |
| ESCB | Ecosystem Services Costs and Benefits |
| PEF | Product Environmental Footprint |
| WFD | Water Framework Directive |
| EPR | Extended Producer’s Responsibility |
| SDGs | Sustainable Development Goals |
| EnVaR | Environmental Value at Risk |
| MEA | Millenium Ecosystem Assessment |
| TEEB | The Economics of Ecosystems and Biodiversity |
Appendix A. Regenerative Agriculture and Ecosystem Services
We distinguish 3 dominant ESs frameworks in the global literature and practice [17]; (1) the Millennium Ecosystem Assessment (MEA), (2) the Economics of Ecosystems and Biodiversity (TEEB), and (3) the CICES version 5.1 [2], as being the most currently updated. The CICES framework was essentially developed in parallel with the SEEA; however, it only became known after the publication of version 4.3 in 2013 (as the most widely known until its updated revision 5.1 in 2018). In contrast to the MEA approach, the CICES framework integrates regulatory and supporting ESs into one category, suggesting their common biophysical basis. Currently, the CICES 5.1 framework is gaining ground and is increasingly adopted by numerous case studies around the globe.
Appendix A.1. ABMR Pillars Examined in the Case Studies
In this section, we present the geographical distribution of the 8 CSs in the Mediterranean that were surveyed on the identified ESs following the CICES v5.1 framework and the basic descriptive statistics of their examined ABMR pillars by which the CSs were requested to relate those identified ESs. The geographical locations of the 8 Mediterranean CSs are presented in Figure A1 below.

Figure A1.
Geographical locations and references for the 8 CSs in South Europe and North Africa that responded to the ESs identification surveys by the CICES v5.1 standard.
Figure A1.
Geographical locations and references for the 8 CSs in South Europe and North Africa that responded to the ESs identification surveys by the CICES v5.1 standard.

Figure A1 depicts an equal geographical distribution of the 8 CSs—with 4 located in South Europe and 4 in North Africa—as well as an equal distribution of the sum of ABMR pillars examined by each CS. Table A1 encodes the examined pillars with the values 1 and 0, where 1 = ABMR pillar examined and 0 = ABMR pillar not examined.
Table A1.
Examined regenerative farming (ABMR) pillars by each CS.
Table A1.
Examined regenerative farming (ABMR) pillars by each CS.
| ABMR Pillars | CS 1 | CS 2 | CS 3 | CS 4 | CS 5 | CS 6 | CS 7 | CS 8 |
|---|---|---|---|---|---|---|---|---|
| A| Agronomical Practices | 1 | 1 | 0 | 0 | 0 | 1 | 0 | 0 |
| B| Biomasses | 1 | 1 | 0 | 1 | 0 | 1 | 1 | 0 |
| M| Microorganisms | 1 | 0 | 1 | 1 | 1 | 0 | 1 | 1 |
| R| Resistant Varieties | 0 | 0 | 1 | 1 | 1 | 1 | 1 | 1 |
| ABMR Pillars Examined | 3 | 2 | 2 | 3 | 2 | 3 | 3 | 2 |
Table A1 presents the different combinations of the examined ABMR pillars in each CS. All CSs examine 2 or 3 pillars in various combinations; however, no CS examines only 1 or all 4 ABMR pillars. As observed, the CSs are equally distributed both by geographical location and by the sum of examined ABMR pillars, with South Europe including two CSs examining 3 ABMR pillars (CS1, CS6) and two CSs examining 2 ABMR pillars (CS2, CS8), while a respective view applies for the four CSs in North Africa (CS4 and CS7, examining 3 ABMR pillars, while CS3 and CS5 examine 2 ABMR pillars). However, we observe significant inequality in the frequency of examined ABMR pillars, as shown in Table A2.
Table A2.
Frequency of each regenerative farming (ABMR) pillar’s examination in the eight CSs.
Table A2.
Frequency of each regenerative farming (ABMR) pillar’s examination in the eight CSs.
| Regenerative (ABMR) Pillar | A | B | M | R |
|---|---|---|---|---|
| Examination Frequency | 0.375 | 0.625 | 0.75 | 0.75 |
Specifically, pillar A is examined with the lowest frequency (37.5%) across the eight CSs, followed by pillar B with a 62.5% frequency. In contrast, the most frequently examined pillars in the eight CSs are M and R with a 75% frequency. As presented in the Results section, this mainly affects the ESs identified to be deriving from pillar M, while pillar B is less important for ESs generation.
Appendix A.2. Identified Ecosystem Services by CICES v5.1 in the Case Studies
For the completion of the ES survey, the eight CSs were familiarized with the CICES v5.1 standard via training sessions on ESs economic fundamentals for soil scientists and guidance through the CICES 4-level hierarchy. In turn, the CSs were requested to identify the potentially generated ESs in their experiments from a full list of CICES v5.1 ESs, classified in their 3 categories and subcategories (biotic; abiotic). An important survey feature is that each CS was requested to identify a potentially generated ES from the CICES v5.1 list across all ABMR pillars, whether it was examined by the CS or not. In this context, the CSs provided answers at two levels: (a) a basic text description of the mechanism by which a pillar (potentially) generates the ES and (b) the metric used to assess the improvement. Each identified ES could be associated with more than one ABMR pillar (up to all 4); thus highlighting their potential synergistic activity for ES generation, as also modeled via the REGENA function [38]. Table A3 shows the ESs identification frequency, noted in at least one ABMR pillar in at least one CS and only across CSs. For instance, even if a CS identified an ES for more than one pillar, it still counted as one.
Table A3.
Frequency of ESs appearing in at least one ABMR pillar by CICES v5.1 section and class.
Table A3.
Frequency of ESs appearing in at least one ABMR pillar by CICES v5.1 section and class.
| ES Section/Class | Code | ES Class Type | Freq. | Freq. (%) |
|---|---|---|---|---|
| Provisioning | ||||
| Biotic | ||||
| Cultivated terrestrial plants (incl. fungi, algae) grown for nutritional purposes | 1.1.1.1 | Crops by amount, type (e.g., cereals, root crops, soft fruit, etc.) | 5 | 62.50% |
| Fibers and other materials from cultivated plants, fungi, algae, and bacteria for direct use or processing (excl. genetic materials) | 1.1.1.2 | Material by amount, type, use, media (land, soil, freshwater, marine) | 5 | 62.50% |
| Cultivated plants (including fungi, algae) grown as a source of energy | 1.1.1.3 | By amount, type, source | 2 | 25.00% |
| Plants cultivated by in situ aquaculture grown for nutritional purposes | 1.1.2.1 | Plants, algae by amount, type | 1 | 12.50% |
| Animals reared for nutritional purposes | 1.1.3.1 | Animals, products by amount, type (e.g., beef, dairy) | 2 | 25.00% |
| Fibers and other materials from reared animals for direct use or processing (excluding genetic materials) | 1.1.3.2 | Material by amount, type, use, media (land, soil, freshwater, marine) | 5 | 62.50% |
| Wild plants (e.g., terrestrial and aquatic, including fungi, algae) used for nutrition | 1.1.5.1 | Plants, algae by amount, type | 3 | 37.50% |
| Seeds, spores, and other plant materials collected for maintaining or establishing a population | 1.2.1.1 | By species or varieties | 4 | 50.00% |
| Abiotic | ||||
| Surface water for drinking | 4.2.1.1 | By amount, type, source | 1 | 12.50% |
| Surface water used as a material (non-drinking purposes) | 4.2.1.2 | By amount & source | 2 | 25.00% |
| Ground (and subsurface) water for drinking | 4.2.2.1 | By amount, type, source | 2 | 25.00% |
| Ground water (and subsurface) used as a material (non-drinking purposes) | 4.2.2.2 | By amount & source | 3 | 37.50% |
| Mineral substances used for material purposes | 4.3.1.2 | Amount by type | 2 | 25.00% |
| Solar energy | 4.3.2.4 | Amount by type | 2 | 25.00% |
| Geothermal | 4.3.2.5 | Amount by type | 2 | 25.00% |
| Regulation & Maintenance | ||||
| Biotic | ||||
| Filtration/sequestration/storage/accumulation by microorganisms, algae, plants, and animals | 2.1.1.2 | By type of living system or by water or substance type | 6 | 75.00% |
| Smell reduction | 2.1.2.1 | By type of living system | 2 | 25.00% |
| Control of erosion rates | 2.2.1.1 | By reduction in risk, area protected | 3 | 37.50% |
| Hydrological cycle and water flow regulation (including flood control and coastal protection) | 2.2.1.3 | By depth/volume | 2 | 25.00% |
| Wind protection | 2.2.1.4 | By reduction in risk, area protected | 4 | 50.00% |
| Fire protection | 2.2.1.5 | By reduction in risk, area protected | 4 | 50.00% |
| Pest control (including invasive species) | 2.2.3.1 | By reduction in incidence, risk, area protected by type of living system | 3 | 37.50% |
| Disease control | 2.2.3.2 | By reduction in incidence, risk, area protected by type of living system | 6 | 75.00% |
| Weathering processes and their effect on soil quality | 2.2.4.1 | By amount/concentration and source | 3 | 37.50% |
| Decomposition and fixing processes and their effect on soil quality | 2.2.4.2 | By amount/concentration and source | 5 | 62.50% |
| Regulation of chemical composition of atmosphere and oceans | 2.2.6.1 | By contribution of type of living system to amount, concentration, or climatic parameter | 5 | 62.50% |
| Regulation of temperature and humidity, including ventilation and transpiration | 2.2.6.2 | By contribution of type of living system to amount, concentration, or climatic parameter | 3 | 37.50% |
| Other | 2.3.X.X | Other regulating and maintenance services from living systems to appropriate groups and classes | 3 | 37.50% |
| Abiotic | ||||
| Mediation of nuisances by abiotic structures or processes | 5.1.2.1 | Amount by type | 3 | 37.50% |
| Cultural | ||||
| Biotic | ||||
| Characteristics of living systems that enable scientific investigation or the creation of traditional ecological knowledge | 3.1.2.1 | By type of living system or environmental setting | 4 | 50.00% |
| Characteristics of living systems that enable education and training | 3.1.2.2 | By type of living system or environmental setting | 3 | 37.50% |
| Characteristics of living systems that are resonant in terms of culture or heritage | 3.1.2.3 | By type of living system or environmental setting | 1 | 12.50% |
| Characteristics of living systems that enable aesthetic experiences | 3.1.2.4 | By type of living system or environmental setting | 1 | 12.50% |
| Characteristics of living systems that are resonant in terms of culture or heritage | 3.2.1.3 | By type of living system or environmental setting | 1 | 12.50% |
| Characteristics or features of living systems that have an existence value | 3.2.2.1 | By type of living system or environmental setting | 1 | 12.50% |
An analytical presentation of the identified ESs by pillar is provided in Figure 2 and Table 2 of the main text. To secure the accuracy of the CSs responses on the relevance of identified ESs to their adopted—and potentially adopted—regenerative practices, a final check and quality control was implemented. For instance, marine or aquaculture ESs are indirectly related to regenerative farming (via the PEF lifecycle standard). Such corrective actions were not required, as none of the CSs identified these ESs. Finally, every description of a potentially generated ES was considered valid only as long as it was adequately substantiated, even if it lacked a specific proposed assessment metric.
References
- European Union Soil Observatory (EUSO). Soil Degradation Indicators Dashboard. Available online: https://esdac.jrc.ec.europa.eu/esdacviewer/euso-dashboard/ (accessed on 28 January 2026).
- Haines-Young, R.; Potschin, M.B. Common International Classification of Ecosystem Services (CICES) v5.1 and Guidance on the Application of the Revised Structure. 2018. Available online: https://cices.eu/content/uploads/sites/8/2018/01/Guidance-V51-01012018.pdf (accessed on 28 January 2026).
- United Nations (UN). System of Environmental Economic Accounting (SEEA) 2012: Central Framework; United Nations: New York, NY, USA, 2014; Available online: https://unstats.un.org/unsd/envaccounting/seearev/seea_cf_final_en.pdf (accessed on 28 January 2026).
- Matthews, H.D.; Zickfeld, K.; Koch, A.; Luers, A. Accounting for the climate benefit of temporary carbon storage in nature. Nat. Commun. 2023, 14, 5485. [Google Scholar] [CrossRef] [PubMed]
- Bossio, D.A. The role of soil carbon in natural climate solutions. Nat. Sustain. 2020, 3, 391–398. [Google Scholar] [CrossRef]
- European Alliance for Regenerative Agriculture (EARA). Farmer-Led Study on Europe’s Regenerating Full Productivity; EARA: London, UK, 2025; Available online: https://eara.farm/wp-content/uploads/EARA_Farmer-led-Research-on-Europes-Full-Productivity_2025_06_03.pdf (accessed on 28 January 2026).
- Reese, A. A revolution is sweeping Europe’s farms: Can it save agriculture? Nature 2025, 645, 301–303. [Google Scholar] [CrossRef] [PubMed]
- Kenny, D.C.; Castilla-Rho, J. What Prevents the Adoption of Regenerative Agriculture and What Can We Do about It? Lessons and Narratives from a Participatory Modelling Exercise in Australia. Land 2022, 11, 1383. [Google Scholar] [CrossRef]
- Francis, J. Regenerative Agriculture—Quantifying the Cost; Occasional Paper No 20.01; Australian Farm Institute: Sydney, Australia, 2020; Available online: https://www.farminstitute.org.au/wp-content/uploads/2020/06/May_2020_occasional-paper_20200522.pdf (accessed on 28 January 2026).
- Fan, S. Economics in food systems transformation. Nat. Food 2021, 2, 2018–2219. [Google Scholar] [CrossRef]
- Lorenzetti, L.A.; Fiorini, A. Conservation Agriculture Impacts on Economic Profitability and Environmental Performance of Agroecosystems. Environ. Manag. 2024, 73, 532–545. [Google Scholar] [CrossRef]
- Sun, X.; Chen, J.; Kuzyakov, Y.; Yang, Y.; Ferreira, G.W.D.; Ochoa-Hueso, R.; Mueller, C.W.; Wang, Z.; Hong, Y.; Li, D.; et al. Meta-analysis shows that planting nitrogen-fixing species increases soil organic carbon stock. Nat. Ecol. Evol. 2025, 9, 2046–2056. [Google Scholar] [CrossRef]
- Liebig, J. Organic Chemistry in Its Applications to Agriculture and Physiology; Taylor & Walton: London, UK, 1840. [Google Scholar]
- Real, L.R. The Kinetics of Functional Response. Am. Nat. 1977, 111, 289–300. Available online: http://www.jstor.org/stable/2460064 (accessed on 28 January 2026). [CrossRef]
- Van Leeuwen, E.; Jansen, V.A.A.; Bright, B.W. How Population Dynamics Shape the Functional Response in a One-Predator—Two-Prey System. Ecology 2007, 88, 1571–1581. [Google Scholar] [CrossRef]
- Hannon, B. Conditioning the Ecosystem. Math. Biosci. 1985, 75, 23–42. [Google Scholar] [CrossRef]
- Karakatsanis, G.; Mamassis, N. Energy, Trophic Dynamics and Ecological Discounting. Land 2023, 12, 1928. [Google Scholar] [CrossRef]
- Lindeman, R.L. The Trophic-Dynamic Aspect of Ecology. Ecology 1942, 23, 399–418. [Google Scholar] [CrossRef]
- Lotka, A.J. Elements of Physical Biology. Nature 1925, 116, 461. [Google Scholar] [CrossRef]
- Lotka, A.J. Contribution to the Energetics of Evolution. Proc. Natl. Acad. Sci. USA 1922, 8, 147–151. [Google Scholar] [CrossRef]
- Loft, T.; Menor, I.O.; Stevens, N.; Beyer, R.; Clements, H.S.; Santini, L.; Thomas, S.; Tobias, J.A.; Malhi, Y. Energy flows reveal declining ecosystem functions by animals across Africa. Nature 2025, 649, 104–112. [Google Scholar] [CrossRef]
- Karakatsanis, G. Development of Technology Finance Models Based on Eco-Exergy Analysis. Master’s Thesis, National Technical University of Athens (NTUA), Athens, Greece, 2007. Available online: https://dspace.lib.ntua.gr/xmlui/bitstream/handle/123456789/1220/karakatsanisg_ecoexergy.pdf?sequence=1&isAllowed=y (accessed on 28 January 2026). (In Greek with English abstract).
- Karakatsanis, G. Exergy and the economic process. Energy Procedia 2016, 97, 51–58. [Google Scholar] [CrossRef][Green Version]
- Karakatsanis, G.; Mamassis, N. Energy and the Macrodynamics of Agrarian Societies. Land 2023, 12, 1603. [Google Scholar] [CrossRef]
- Hopfenberg, R. An expansion of the demographic transition model: The dynamic link between agricultural productivity and population. Biodiversity 2015, 15, 246–254. [Google Scholar] [CrossRef]
- Kümmel, R. The Second Law of Economics: Energy, Entropy and the Origins of Wealth; Springer: New York, NY, USA, 2011. [Google Scholar]
- Daly, H.E. Ecological Economics and Sustainable Development: Selected Essays of Herman Daly; Edward Elgar Publishing Limited: Cheltenham, UK, 2007. [Google Scholar]
- Moreira Alves, F.; Santos, R.; Penha-Lopes, G. Revisiting the Missing Link: An Ecological Theory of Money for a Regenerative Economy. Sustainability 2022, 14, 4309. [Google Scholar] [CrossRef]
- Karakatsanis, G. Natural Theory of Money and Integrated Development. In Proceedings of the 7th Metsovion Interdisciplinary Research Center (MIRC) of the National Technical University of Athens (NTUA) Conference: Integrated Development in Times of Multidimensional Crisis: Causes, Responsibilities, Proposals, Measures, Actions and Prospects, Metsovon, Epirus, Greece, 12–15 September 2013. (In Greek with English abstract). [Google Scholar] [CrossRef]
- Karakatsanis, G. A Thermodynamic Theory of Money. In Proceedings of the Ecological Economics and Rio+20: Contributions and Challenges for a Green Economy, 12th Biennial Conference of the International Society for Ecological Economics (ISEE), Rio de Janeiro, Brazil, 16–19 June 2012. [Google Scholar] [CrossRef]
- Bacchoo, A.D.; Mishra, P.K. The Rise of Regenerative Finance: Investing in Solutions for Environmental Repair and Social Well-Being; Preprint Under Peer-Review. Available online: https://ssrn.com/abstract=5253848 (accessed on 28 January 2026).
- Shih, C.; Gwizdalski, A.; Deng, X. Building a Sustainable Future: Exploring Green Finance, Regenerative Finance, and Green Financial Technology; Nanyang Business School Research Paper No. 23-18; Nanyang Technological University: Singapore, 2023; Available online: https://papers.ssrn.com/sol3/papers.cfm?abstract_id=4449096 (accessed on 28 January 2026).
- Collado-Ruano, J.; Segovia Sarmiento, J. Ecological Economics Foundations to Improve Environmental Education Practices: Designing Regenerative Cultures. World Futures 2022, 78, 456–483. [Google Scholar] [CrossRef]
- Von Bertalanffy, L. Quantitative Laws in Metabolism and Growth. Q. Rev. Biol. 1957, 32, 217–231. [Google Scholar] [CrossRef] [PubMed]
- Gliessman, S.R. Agroecology; Springer-Verlag: New York, NY, USA, 1990. [Google Scholar] [CrossRef]
- Robinson, N.; Drever, C.R.; Gibbs, D.A.; Lister, K.; Esquivel-Muelbert, A.; Heinrich, V.; Ciais, P.; Silva-Junior, C.H.L.; Liu, Z.; Pugh, T.A.M.; et al. Protect young secondary forests for optimum carbon removal. Nat. Clim. Change 2024, 15, 793–800. [Google Scholar] [CrossRef]
- Debertin, D.L. Agricultural Production Economics, 2nd ed.; Macmillan Publishing Company: New York, NY, USA, 2012. [Google Scholar]
- Karakatsanis, G.; Managoudis, D.; Makronikolakis, E.N. REGENA: Growth Function for Regenerative Farming. Agriculture 2026, 16, 134. [Google Scholar] [CrossRef]
- Schreefel, L.; de Boer, I.; Timler, C.; Groot, J.; Zwetsloot, M.; Creamer, R.; Schrijver, A.P.; van Zanten, H.; Schulte, R. How to make regenerative practices work on the farm: A modelling framework. Agric. Syst. 2022, 198, 103371. [Google Scholar] [CrossRef]
- Karakatsanis, G.; Makropoulos, C. Resource Recovery and the Sherwood Plot. Entropy 2023, 25, 4. [Google Scholar] [CrossRef]
- Jiménez-Alfaro, B.; Frischie, S.; Stolz, J.; Gálvez-Ramírez, C. Native plants for greening Mediterranean agroecosystems. Nat. Plants 2020, 6, 209–214. [Google Scholar] [CrossRef]
- Fisher, B.; Turner, R.K. Ecosystem services: Classification for valuation. Biol. Conserv. 2008, 141, 1167–1169. [Google Scholar] [CrossRef]
- Ditzler, L.; Apeldoorn, D.F.; Schulte, R.P.; Tittonell, P.; Rossing, W.A. Redefining the field to mobilize three-dimensional diversity and ecosystem services on the arable farm. Eur. J. Agron. 2021, 122, 126197. [Google Scholar] [CrossRef]
- Schreefel, L.; Steenman, E.; Adler, F.; Buffara, R.; Freundt, S.; DeClerck, F.; Duncan, J.; Giller, K.E.; Koster, H.; van Zanten, H.H.E. Beyond the buzz: Analyzing actors promoting regenerative agriculture in Europe. npj Sustain. Agric. 2025, 3, 59. [Google Scholar] [CrossRef]
- Stoll, G.; Civita, N.; Starbard, T. The Economics of Regeneration: A Landscape Assessment of Opportunities to Support a Viable Regenerative Agricultural System; Mad Agriculture: Boulder, CO, USA, 2020; Available online: https://stage.madagriculture.org/assets/files/economicsofregeneration.pdf (accessed on 28 January 2026).
- Trifan, D.; Toader, G.; Enea, C.I.; Ghiorghe, A.I.; Lungu, E.; Toader, E.V.; Ilie, L. Economic model of regenerative agriculture and factors of agri-food system change. In Agrarian Economy and Rural Development: Realities and Perspectives for Romania; International Symposium, 12th ed.; The Research Institute for Agricultural Economy and Rural Development (ICEADR): Bucharest, Romania, 2021; pp. 99–104. Available online: https://www.econstor.eu/bitstream/10419/263027/1/ICEADR-2021-p099.pdf (accessed on 28 January 2026).
- Tilman, D.; Cassman, K.G.; Matson, P.A.; Naylor, R.; Polasky, S. Agricultural sustainability and intensive production practices. Nature 2002, 418, 671–677. [Google Scholar] [CrossRef]
- Falconer, K.; Hodge, I. Pesticide taxation and multi-objective policy-making: Farm modelling to evaluate profit/environment trade-offs. Ecol. Econ. 2001, 36, 263–279. [Google Scholar] [CrossRef]
- Georgescu-Roegen, N. The Entropy Law and the Economic Process; Harvard University Press: Cambridge, MA, USA, 1971. [Google Scholar]
- Karakatsanis, G.; Mamassis, N. Entropy, Recycling and Macroeconomics of Water Resources; European Geosciences Union (EGU) General Assembly: Vienna, Austria, 2014. [Google Scholar] [CrossRef]
- Roussis, D.; Karakatsanis, G.; Makropoulos, C. A macroeconomic model of water capital conservation. In Proceedings of the 4th International Conference of Water Economics, Statistics and Finance, Livorno, Italy, 4–5 April 2017. [Google Scholar] [CrossRef]
- Karakatsanis, G. Energy and the Agroeconomic Complexity of Ehiopia; European Geosciences Union (EGU) General Assembly: Vienna, Austria, 2016. [Google Scholar] [CrossRef]
- Karakatsanis, G. Energy and the Capital of Nations; European Geosciences Union (EGU) General Assembly: Vienna, Austria, 2016. [Google Scholar] [CrossRef]
- Karakatsanis, G.; Mamassis, N.; Koutsoyiannis, D.; Efstratiadis, A. Entropy and reliability of water use via a statistical approach of scarcity. In Proceedings of the Facets of Uncertainty: 5th EGU Leonardo Conference-Hydrofractals 2013-STAHY 2013, EGU, IAHS and IUGG, Kos, Greece, 17–19 October 2013. [Google Scholar] [CrossRef]
- Stern, N.H. The Economics of Climate Change: The Stern Review; Cambridge University Press: Cambridge, UK, 2006. [Google Scholar]
- Karakatsanis, G. An energy R&D fund for energy paradigm transitions: Macro and micro scale analysis. In Proceedings of the Ecological Economics and Rio+20: Contributions and Challenges for a Green Economy, 12th Biennial Conference of the International Society for Ecological Economics (ISEE), Rio de Janeiro, Brazil, 16–19 June 2012. [Google Scholar] [CrossRef]
- Karakatsanis, G. Ecological finance in technology: Increasing the world economy’s negentropy. In Proceedings of the 5th Biennial Conference of the United States Society for Ecological Economics (USSEE): Science & Policy for a Sustainable Future, Washington, DC, USA, 31 May–3 June 2009. [Google Scholar] [CrossRef]
- Pretty, J.; Garrity, D.; Badola, H.K.; Barrett, M.; Butler Flora, C.; Cameron, C.; Grist, N.; Hepburn, L.; Hilburn, H.; Isham, A.; et al. How the Concept of “Regenerative Good Growth” Could Help Increase Public and Policy Engagement and Speed Transitions to Net Zero and Nature Recovery. Sustainability 2025, 17, 849. [Google Scholar] [CrossRef]
- EU Technical Expert Group (TEG) on Sustainable Finance. EU Green Bond Standard Usability Guide. 2020. Available online: https://ec.europa.eu/info/files/200309-sustainable-finance-teg-green-bond-standard-usability-guide_en (accessed on 28 January 2026).
- European Union (EU). Regulation (EU) 2024/3012 of the European Parliament and of the Council of 27 November 2024 Establishing a Union Certification Framework for Permanent Carbon Removals, Carbon Farming and Carbon Storage in Products. 2024. Available online: https://eur-lex.europa.eu/legal-content/EN/TXT/PDF/?uri=OJ:L_202403012 (accessed on 28 January 2026).
- McVittie, A.; Hussain, S.S. The Economics of Ecosystems and Biodiversity Valuation Database Manual. 2013. Available online: https://www.teebweb.org/wp-content/uploads/2014/03/TEEB-Database-and-Valuation-Manual_2013.pdf (accessed on 28 January 2026).
- European Commission. Delivering the European Green Deal. 2021. Available online: https://ec.europa.eu/info/strategy/priorities-2019-2024/european-green-deal/delivering-european-green-deal_en (accessed on 28 January 2026).
- Sandri, S.; Hussein, H.; Alshyab, N.; Sagatowski, J. The European Green Deal: Challenges and opportunities for the Southern Mediterranean. Mediterr. Politics 2023, 30, 196–207. [Google Scholar] [CrossRef]
- European Commission. Commission Welcomes Political Agreement on EU-Wide Certification Scheme for Carbon Removals. Press Release. 20 February 2024. Available online: https://ec.europa.eu/commission/presscorner/detail/en/ip_24_885 (accessed on 28 January 2026).
- European Commission. Commission Recommendation (EU) 2021/2279 of 15 December 2021 on the Use of the Environmental Footprint Methods to Measure and Communicate the Life Cycle Environmental Performance of Products and Organisations. 2021, C/2021/9332. Available online: https://eur-lex.europa.eu/legal-content/EN/TXT/?uri=CELEX%3A32021H2279 (accessed on 28 January 2026).
- Schreefel, L.; Schulte, R.; de Boer, I.; Schrijver, A.P.; van Zanten, H. Regenerative agriculture—The soil is the base. Glob. Food Secur. 2020, 26, 100404. [Google Scholar] [CrossRef]
- Shannon, C.E. A Mathematical Theory of Communication. Bell Syst. Tech. J. 1948, 27, 379–423. [Google Scholar] [CrossRef]
- Ott, W.R. Environmental Statistics and Data Analysis; Lewis Publishers: New York, NY, USA, 1995. [Google Scholar]
- Kerselaers, E.; De Cock, L.; Lauwers, L.; Van Huylenbroeck, G. Modelling Farm Level Economic Potential for Conversion to Organic Farming. Agric. Syst. 2007, 94, 671–682. [Google Scholar] [CrossRef]
- Kurth, T.; Subei, B.; Plötner, P.; Krämer, S. The Case for Regenerative Agriculture for Germany—And Beyond; Boston Consulting Group (BCG): Boston, MA, USA; Nature and Biodiversity Conservation Union (NABU): Berlin, Germany, 2023; Available online: https://web-assets.bcg.com/76/27/7d265e864fa3b9b68bf4196497da/bcg-the-case-for-regenerative-agriculture-in-germany-and-beyond-jan-2023-rev.pdf (accessed on 28 January 2026).
- Stevens, A.W. The economics of land tenure and soil health. Soil Secur. 2022, 6, 100047. [Google Scholar] [CrossRef]
- Bennett, A. A Review of the Economics of Regenerative Agriculture in Western Australia; Department of Primary Industries and Regional Development, Western Australian Government: Perth, Australia, 2021. Available online: https://library.dpird.wa.gov.au/context/pubns/article/1171/viewcontent/A_review_of_the_economics_of_regenerative_agriculture_in_Western_Australia__PDF_325KB_.pdf (accessed on 28 January 2026).
- Ogilvy, S.; Gardner, M.; Mallawaarachichi, T.; Schirmer, J.; Brown, K.; Heagney, E. NESP-EP: Farm Profitability and Biodiversity Project Final Report—Graziers with Better Profitability, Biodiversity and Wellbeing; National Environmental Science Program: Canberra, Australia, 2018; Available online: https://pureadvantage.org/wp-content/uploads/2018/11/NESP-EP-Farm-profitability-and-biodiversity-final-report.pdf (accessed on 28 January 2026).
- Groot, J.C.J.; Oomen, G.J.M.; Rossing, W.A.H. Multi-objective optimization and design of farming systems. Agric. Syst. 2012, 110, 63–77. [Google Scholar] [CrossRef]
- Intergovernmental Panel on Climate Change (IPCC). Climate Change 2021: The Physical Science Basis; Cambridge University Press: Cambridge, UK; New York, NY, USA, 2021. [CrossRef]
- Energy Information Agency (EIA). Carbon Dioxide Emissions Coefficients. Available online: https://www.eia.gov/environment/emissions/co2_vol_mass.php (accessed on 28 January 2026).
- The Nature Conservancy. Reducing Emissions from Deforestation and Degradation (REDD): A Casebook of On-the-Ground Experience; Conservation International and Wildlife Conservation Society: Arlington, VA, USA, 2010; Available online: https://www.nature.org/media/climatechange/redd-casebook-tnc-ci-wcs.pdf (accessed on 28 January 2026).
- M’barek, R.; Delince, J. (Eds.) iMAP, an Integrated Modelling Platform for Agro-Economic Commodity and Policy Analysis: New Developments and Policy Support 2012-14; Joint Research Center (JRC), Publications Office of the European Union: Luxembourg, 2015. [Google Scholar]
- Panagos, P.; Broothaerts, N.; Ballabio, C.; Orgiazzi, A.; De Rosa, D.; Borrelli, P.; Liakos, L.; Vieira, D.; Van Eynde, E.; Navarro, C.A.; et al. How the EU Soil Observatory is providing solid science for healthy soils. Eur. J. Soil. Sci. 2024, 75, e13507. [Google Scholar] [CrossRef]
- Trading Economics. EU Carbon Permits. Available online: https://tradingeconomics.com/commodity/carbon (accessed on 28 January 2026).
- de Vries, J.; de Bruyn, S.; Boerdijk, S.; Juijn, D.; Bijleveld, M.; van der Giesen, C.; Korteland, M.; Odenhoven, N.; van Santen, W.; Pápai, S. Environmental Prices Handbook 2024: EU 27 Version; CE Delft: Delft, The Netherlands, 2025; Available online: https://cedelft.eu/wp-content/uploads/sites/2/2024/12/CE_Delft_230107_Environmental-Prices-Handbook-2024-EU-version_def_V1.1.pdf (accessed on 28 January 2026).
- Carbon Credits. Live Carbon Prices Today. Available online: https://carboncredits.com/carbon-prices-today/ (accessed on 28 January 2026).
- Shannon, G.; Issa, R.; Wood, C.; Kelman, I. Regenerative economics for planetary health: A scoping review. Int. Health Trends Perspect. 2022, 2, 81–105. [Google Scholar] [CrossRef]
- Singh, S.; Boda, R.K.; Mohan, S.V. Carbon farming: A circular framework to augment CO2 sinks and to combat climate change. Environ. Sci: Adv. 2024, 3, 522–542. [Google Scholar] [CrossRef]
- Lozano-Garcia, B.; Aguilera-Huertas, J.; Gonzalez-Rosado, M.; Parras-Alicantara, L. How Much Organic Carbon Could be Stored in Rainfed Olive Grove Soil? A Case Study in Mediterranean Areas. Sustainability 2022, 14, 14609. [Google Scholar] [CrossRef]
- Graeme, A.; Cann, M.; Field, H. Soil Carbon Snapshot; FERTCARE and Agriculture Victoria: Victoria, Australia, 2022. Available online: https://agriculture.vic.gov.au/__data/assets/pdf_file/0006/857607/Soil-Carbon-Snapshot-updated-May-2022.pdf (accessed on 28 January 2026).
- Eurofins Agro. How So You Calculate How Much CO2 Is Captured in Organic Matter? Available online: https://www.eurofins-agro.com/en/faq/how-do-you-calculate-how-much-co2-is-captured-in-organic-matter (accessed on 28 January 2026).
- World Bank. Measuring the Real Size of the World Economy: The Framework, Methodology, and Results of the International Comparison Program−ICP; World Bank: Washington, DC, USA, 2013. [Google Scholar] [CrossRef]
- Statistical Office of the European Union (EUROSTAT). Harmonised Index of Consumer Prices (HICP) Methodological Manual, 2024th ed.; Publications Office of the European Union: Luxemburg, 2024. [Google Scholar] [CrossRef]
- Drupp, M.A.; Freeman, M.C.; Groom, B.; Nesje, F. Discounting Disentangled. Am. Econ. J. Econ. Policy 2018, 10, 109–134. [Google Scholar] [CrossRef]
- World Business Council for Sustainable Development (WBCSD); One Planet Business for Biodiversity (OPB2B). Implementing Outcome-based Metrics to Scale Regenerative Agriculture; WBCSD: Geneva, Switzerland, 2025; Available online: https://www.wbcsd.org/resources/implementing-outcome-based-metrics-to-scale-regenerative-agriculture/ (accessed on 28 January 2026).
- Kontarakis, E.; Karakatsanis, G.; Dimitriadis, P.; Iliopoulou, T.; Koutsoyiannis, D. Hydroclimate and Agricultural Output in Developing Countries; European Geosciences Union (EGU) General Assembly: Vienna, Austria, 2018. [Google Scholar] [CrossRef]
- Karakatsanis, G.; Roussis, D.; Moustakis, Y.; Gournari, P.; Parara, I.; Dimitriadis, P.; Koutsoyiannis, D. Energy, variability and weather finance engineering. Energy Procedia 2017, 125, 389–397. [Google Scholar] [CrossRef]
- Garrido, A.; Brümmer, B.; M’Barek, R.; Meuwissen, M.; Morales-Opazo, C. Agricultural Markets Instability: Revisiting the Recent Food Crises; Routledge: New York, NY, USA, 2016. [Google Scholar]
- Gibbons, L.V. Regenerative—The New Sustainable? Sustainability 2020, 12, 5483. [Google Scholar] [CrossRef]
- Fath, B.D.; Fiscus, D.A.; Goerner, S.J.; Berea, A.; Ulanowicz, R.E. Measuring regenerative economics: 10 principles and measures undergirding systemic economic health. Glob. Transit. 2019, 1, 15–27. [Google Scholar] [CrossRef]
- Dinerstein, E.; Vynne, C.; Sala, E.; Joshi, A.R.; Fernando, S.; Lovejoy, T.E.; Mayorga, J.; Olson, D.; Asner, G.P.; Baillie, J.E.M.; et al. A Global Deal for Nature: Guiding principles, milestones, and targets. Sci. Adv. 2019, 5, 4. [Google Scholar] [CrossRef]
- Jones, J.W.; Antle, J.M.; Basso, B.; Boote, K.J.; Conant, R.T.; Foster, I.; Godfray, H.C.J.; Herrero, M.; Howitt, R.E.; Janssen, S.; et al. Brief history of agricultural systems modeling. Agric. Syst. 2016, 155, 240–254. [Google Scholar] [CrossRef]
- Karakatsanis, G.; Makropoulos, C. Chemical Leasing (Ch.L.) and the Sherwood Plot. Resources 2024, 13, 65. [Google Scholar] [CrossRef]
- Keyhani, M.; Abbaspour, A.; Bahadori-Jahromi, A.; Mylona, A.; Janbey, A.; Godfrey, P.; Zhang, H. Whole Life Carbon Assessment of a Typical UK Residential Building Using Different Embodied Carbon Data Sources. Sustainability 2023, 15, 5115. [Google Scholar] [CrossRef]
- Official Journal of the European Communities. Directive 2000/60/EC of the European Parliament and of the Council of October 2000; Establishing a Framework for Community Action in the Field of Water Policy, L 327/1, Document 32000L0060, 2000. Available online: https://eur-lex.europa.eu/legal-content/EN/TXT/?uri=celex%3A32000L0060 (accessed on 28 January 2026).
- Villat, J.; Nicholas, K.A. Quantifying soil carbon sequestration from regenerative agricultural practices in crops and vineyards. Front. Sustain. Food Syst. 2024, 7, 1234108. [Google Scholar] [CrossRef]
- Dudek, M.; Rosa, A. Regenerative Agriculture as a Sustainable System of Food Production: Concepts, Conditions, Perceptions and Initial Implementations in Poland, Czechia and Slovakia. Sustainability 2023, 15, 15721. [Google Scholar] [CrossRef]
- Moyer, J.; Smith, A.; Rui, Y.; Hayden, J. Regenerative Agriculture and Soil Carbon Solution; Rodale Institute: Kutztown, PA, USA, 2020; Available online: https://rodaleinstitute.org/wp-content/uploads/Rodale-Soil-Carbon-White-Paper_v8.pdf (accessed on 28 January 2026).


Disclaimer/Publisher’s Note: The statements, opinions and data contained in all publications are solely those of the individual author(s) and contributor(s) and not of MDPI and/or the editor(s). MDPI and/or the editor(s) disclaim responsibility for any injury to people or property resulting from any ideas, methods, instructions or products referred to in the content. |
© 2026 by the authors. Licensee MDPI, Basel, Switzerland. This article is an open access article distributed under the terms and conditions of the Creative Commons Attribution (CC BY) license.