Article

Spatiotemporal Dynamics and Regional Disparities of Urban Resilience in China’s Mining Cities

1
School of Public Administration, China University of Geosciences (Wuhan), Wuhan 430074, China
2
Yangtze River Basin Land and Space Governance and Green Development Research Institute, China University of Geosciences (Wuhan), Wuhan 430074, China
3
Huangshi City Cultural Relics Protection Center, Huangshi 435000, China
*
Author to whom correspondence should be addressed.
Land 2026, 15(2), 348; https://doi.org/10.3390/land15020348
Submission received: 15 January 2026 / Revised: 11 February 2026 / Accepted: 18 February 2026 / Published: 20 February 2026

Abstract

Building safe and resilient cities is a key objective of China’s urbanisation and a prerequisite for high-quality development. This study assesses urban resilience in 73 mining cities from 2014 to 2023 using a composite index system (30 indicators) structured around robustness, resistance, and recovery. We integrate ARIMA-based forecasting, kernel density estimation, and Dagum Gini decomposition to characterise spatiotemporal dynamics and quantify regional inequality. Urban resilience increases steadily over the study period and can be characterised by three sequential stages, with further gains forecast for 2024–2030. Spatially, high-resilience cities shift from a dispersed pattern to belt-like and clustered agglomerations, consistent with an increasingly stratified centre–periphery structure. Inequality is driven primarily by between-region disparities: the East performs best, followed by the Central region, whereas the West and Northeast lag behind, revealing a pronounced gap between the Northeast and the East, alongside relatively convergent Central–West trajectories. These patterns are associated with interacting differences in location and market development, fiscal capacity and transition pathways, infrastructure endowment and ecological constraints, and institutional and demographic dynamics. The findings underscore the need for place-based regional coordination and targeted investments to strengthen recovery-related capacities.

1. Introduction

China has 262 resource-based cities, accounting for approximately 40% of all cities nationwide [1]. Resource-based cities are commonly defined as cities whose economic development depends heavily on the extraction and processing of natural resources [2]. They are responsible for the exploitation of minerals, forests, and other resources and for related product processing, and can be broadly classified into mineral-resource-based, forest-resource-based, and water-resource-based cities. These cities have long made substantial contributions to China’s socio-economic development and energy supply. Within this group, mining cities constitute the dominant type. Mining cities generally refer to cities in which mineral extraction, together with related beneficiation and primary processing, forms the leading industrial base [3]. Such cities are often established “because of mining” or experience rapid growth driven by mining-related industries. However, as non-renewable resources become depleted, many mining cities have already lost their early development dividends and have become increasingly exposed to the “resource curse” [4], facing intertwined challenges in urban development and economic restructuring [5]. Notably, several mineral-resource and heavy-industry regions in developed countries have undergone transitions towards sustainable development, including Lorraine (France), Pittsburgh (USA), the Ruhr (Germany), and Kitakyushu (Japan) [6,7]. By contrast, achieving similar transitions remains a major challenge for developing countries. As one of the world’s largest developing countries with abundant mineral endowments and a large number of resource-dependent cities, China continues to face persistent difficulties in the transformation of mining cities.
International scholarship on resource-based cities and resource-dependent regions has frequently engaged with the “resource curse” debate, with much of the empirical evidence centring on economic performance and sustainable development. For instance, Destek et al. analysed 23 countries exposed to resource-curse risks and reported that natural-resource dependence can generate negative spillovers for sustainable development, which are associated with weaker macroeconomic outcomes and environmental deterioration [8]. Bjorvatn et al. further proposed a “population curse”, arguing that resource rents may reduce an economy’s capacity to absorb labour, thereby contributing to higher unemployment [9]. Nevertheless, other studies challenge the resource-curse hypothesis. Based on evidence from ten mineral-rich countries in the Global South, Chen et al. found that mining capital can stimulate economic growth, lending support to a “resource blessing” view [10]. Likewise, Liu et al. reported a positive long-run relationship between natural resources and financial development in the United States [11]. Despite this extensive body of work, how resource dependence relates to urban resilience—particularly at the city scale—has received comparatively less attention and remains to be systematically clarified.
The concept of resilience originated in mechanical engineering and was later introduced into ecology by Holling [12], where it evolved from engineering resilience to ecological resilience and, more recently, to an evolutionary perspective. Since the early 21st century, resilience thinking has been increasingly applied to regional and urban planning as well as urban governance, giving rise to the concept of the resilient city. Urban resilience emphasises the capacity of cities to withstand, adapt to, and recover from disturbances across social, economic, and ecological dimensions, thereby enhancing disaster risk reduction and long-term sustainability [13]. In recent years, the growing frequency of “black swan” events—including natural hazards, public health crises, and financial shocks—has further elevated urban resilience as a key concern in both academic research and policy practice [14]. In China, resilient city development was formally incorporated into national strategy at the Fifth Plenary Session of the 19th Central Committee in 2020 [15], and was subsequently reinforced in the 14th Five-Year Plan, which calls for the construction of liveable, innovative, smart, green, human-centred, and resilient cities. More recently, the 2024 policy document issued jointly by the General Office of the CPC Central Committee and the State Council on promoting new urban infrastructure development explicitly aims to enhance urban safety and resilience, with the goal of fostering a number of high-level resilient cities by 2030. Due to their dependence on resource extraction, limited industrial diversification, and constrained urban development foundations, mining cities face distinctive structural vulnerabilities compared with other urban types [16]. Their resilience-building pathways are therefore shaped by unique economic, spatial, and institutional conditions. How to effectively promote and enhance resilience in mining cities has thus become a pressing challenge in the context of China’s urban transformation and sustainable land-use governance.
With the development of resilient city research, the literature on urban resilience has expanded and gradually deepened. Existing studies can be broadly synthesised along three lines. The first concerns the spatial scale of analysis, with resilience examined at national [17], macro-regional [18], urban agglomeration [19], and provincial scales [20]. Evidence from China suggests an overall upward trend in urban resilience at the national level, while cities with low to medium resilience still account for a large share [21]. At the urban agglomeration scale, studies have highlighted the resilience potential of city networks, with pronounced differences in structural hierarchy and functional matching, whereas gaps in transmission and clustering effects are less evident [22]. The second line relates to research focus, including composite resilience measurement [23], resilience of the human settlement environment [24], ecological resilience [25], and economic resilience [26]. In measurement-oriented studies, resilience is most often operationalised through multi-dimensional indicator frameworks—typically incorporating economic, social, and ecological components [27,28], while some research adopts the exposure–sensitivity–adaptive capacity perspective to capture risk-related mechanisms [29]. The third line concerns city types, such as resource-based cities [30,31], coal cities [32], coastal cities [33], and provincial capitals [34]. Among these, resource-based cities have received sustained attention. Prior work indicates that the overall coupling coordination of resilience in resource-based cities has improved over time, showing signs of convergence [35], although resilience trajectories and levels differ substantially across resource-dependent city subtypes [36].
Assessing urban resilience remains a multifaceted decision-making problem. In 2019, Grafton et al. conceptualised social–ecological resilience in terms of three core dimensions—resistance, recovery, and robustness [37]—which provides a widely used basis for the quantification of urban resilience. A growing body of research has adopted this framework to evaluate urban resilience across different contexts [38,39]. Several studies have further extended it for urban applications. For instance, Jin et al. integrated the resistance–recovery–robustness model with transformative capacity and proposed a five-subsystem assessment framework to examine the relationship between urban shrinkage and resilience [40]. Moreover, Yu et al. were among the first to incorporate flood resilience into a disaster-process perspective [41]. This process-oriented approach better captures the temporal dynamics of urban responses and offers an operational lens for resilience measurement. Building on this line of work, the present study retains the response-process perspective and further links it to risk governance and control.
Although a substantial body of research has examined urban resilience worldwide, data on the resilience of mining cities remain relatively limited. Previous studies have mainly focused on spatial–morphological change [42], ecological–environmental transition [43], or specific mining/extraction areas [44], while multidimensional assessments at the whole-city scale are still scarce. Mining cities belong to the broader category of resource-based cities; however, because they depend predominantly on mineral resources and traditional fossil-fuel-based energy, they tend to face more pronounced pressures, including accelerated resource depletion and weakening growth momentum, than other resource-based city types. In contrast to the broad and highly heterogeneous policy category of “resource-based cities”, mining cities display greater internal homogeneity in their resource-dependence structures, land-use regimes, and ecological risk profiles. Moreover, compared with studies centred on a single resource type (e.g., coal cities), the mining-city category is larger and spans a wider range of mineral-resource endowments and industrial-chain configurations, making it well suited for identifying shared mechanisms and regional heterogeneity in resilience trajectories for this specific urban type.
Moreover, much of the existing literature on urban resilience has focused on documenting spatiotemporal dynamics, whereas analyses of regional disparities in resilience remain limited. A regional-disparity perspective can reveal persistent local vulnerabilities and structural inequities within regional development [45]. Therefore, attending to spatial disparities and uneven resilience represents an important shift from “overall-level assessment” towards “structural explanation” in resilience research. Resilience is deeply embedded in regional economic structures, industrial systems, land-use patterns, and the conditions governing factor mobility. As a result, concentrating only on average levels or individual-city performance may mask long-standing inter-regional constraints and uneven risk exposure. This concern is particularly salient for mining cities, which are highly resource-dependent and often characterised by pronounced spatial lock-in. Accordingly, identifying the regional roots of resilience inequality in mining cities is a key prerequisite for elucidating underlying evolutionary mechanisms and for designing differentiated, place-based governance strategies.
To address these gaps, this study investigates 73 mining cities in China during 2014–2023. We develop an urban resilience assessment framework that combines the “stability–resistance–recovery” capacity structure with a full-cycle risk-governance process—namely, “risk prevention and control–risk absorption/resistance–risk recovery”. Building on this integration, we conceptualise urban resilience as a dynamic bundle of capacities that is closely coupled with the evolution of urban risk. We then examine the spatiotemporal dynamics of resilience in mining cities and quantify associated regional disparities. This study addresses three research questions: (1) How have the resilience levels of China’s mining cities and their subsystems evolved over time? (2) What spatial patterns and distributional shifts are observed across regions? (3) What are the sources of the observed disparities, and to what extent are they attributable to within-region inequality, between-region inequality, or trans-regional variation?

2. Conceptual Framework

Given their distinctive functional roles and development trajectories, mining cities are exposed to external shocks that differ from those affecting more diversified urban economies. These shocks can be broadly grouped into four inter-related dimensions: (1) Resource and industrial shocks. These include shocks stemming from resource decline and price fluctuations in bulk commodities, particularly those dominated by mineral resources such as metals and energy minerals, as well as systemic fragility resulting from a single and highly concentrated industrial chain. (2) Socio-economic shocks. Resource downturns often trigger population outflows and exacerbate social vulnerability through dependence on a narrow employment structure. In addition, commodity price fluctuations may induce fiscal fragility, including forms of “resource-cycle poverty” associated with unstable local revenues. (3) Hazard and ecological shocks. Large-scale extraction can result in land subsidence, goaf collapse, damage to water bodies, and ecological degradation of abandoned or disturbed mining lands, thereby undermining environmental security and long-term land sustainability. (4) Engineering and safety shocks. These include mining accidents and industrial smelting incidents, which can generate abrupt disruptions to urban functioning and public safety. These shock dimensions may overlap and compound, producing complex multi-hazard risks that disrupt the stable operation of urban systems. Therefore, mining cities require a full-cycle risk management framework that links risk prevention, emergency response, and post-event recovery. Such an integrated approach can strengthen robustness, resistance, and recovery capacities under multiple stressors, thereby supporting overall resilience enhancement and sustainable safety governance.
Mining cities are often characterised by strong path dependence, resource depletion, environmental degradation, and heightened exposure to economic and ecological shocks [46]. These attributes tend to produce risk profiles that are cyclical, cumulative, and spatially uneven. Consequently, the resilience of mining cities cannot be fully captured using static or single-dimensional indicators; instead, it should be conceptualised as a dynamic set of capacities that evolves across different stages of risk [47]. Against this backdrop, this study proposes a comprehensive urban resilience assessment framework that is both multidimensional and process-oriented. Urban resilience is not simply the aggregation of favourable socio-economic and ecological attributes; rather, it denotes a city’s capacity to absorb disturbances, sustain critical functions, and recover or reorganise after shocks. Accordingly, a comprehensive framework should incorporate two components: (i) the system structure of resilience, comprising economic, social, and ecological subsystems; and (ii) the process attributes of resilience, that is, the capacities activated at different stages of disturbance.
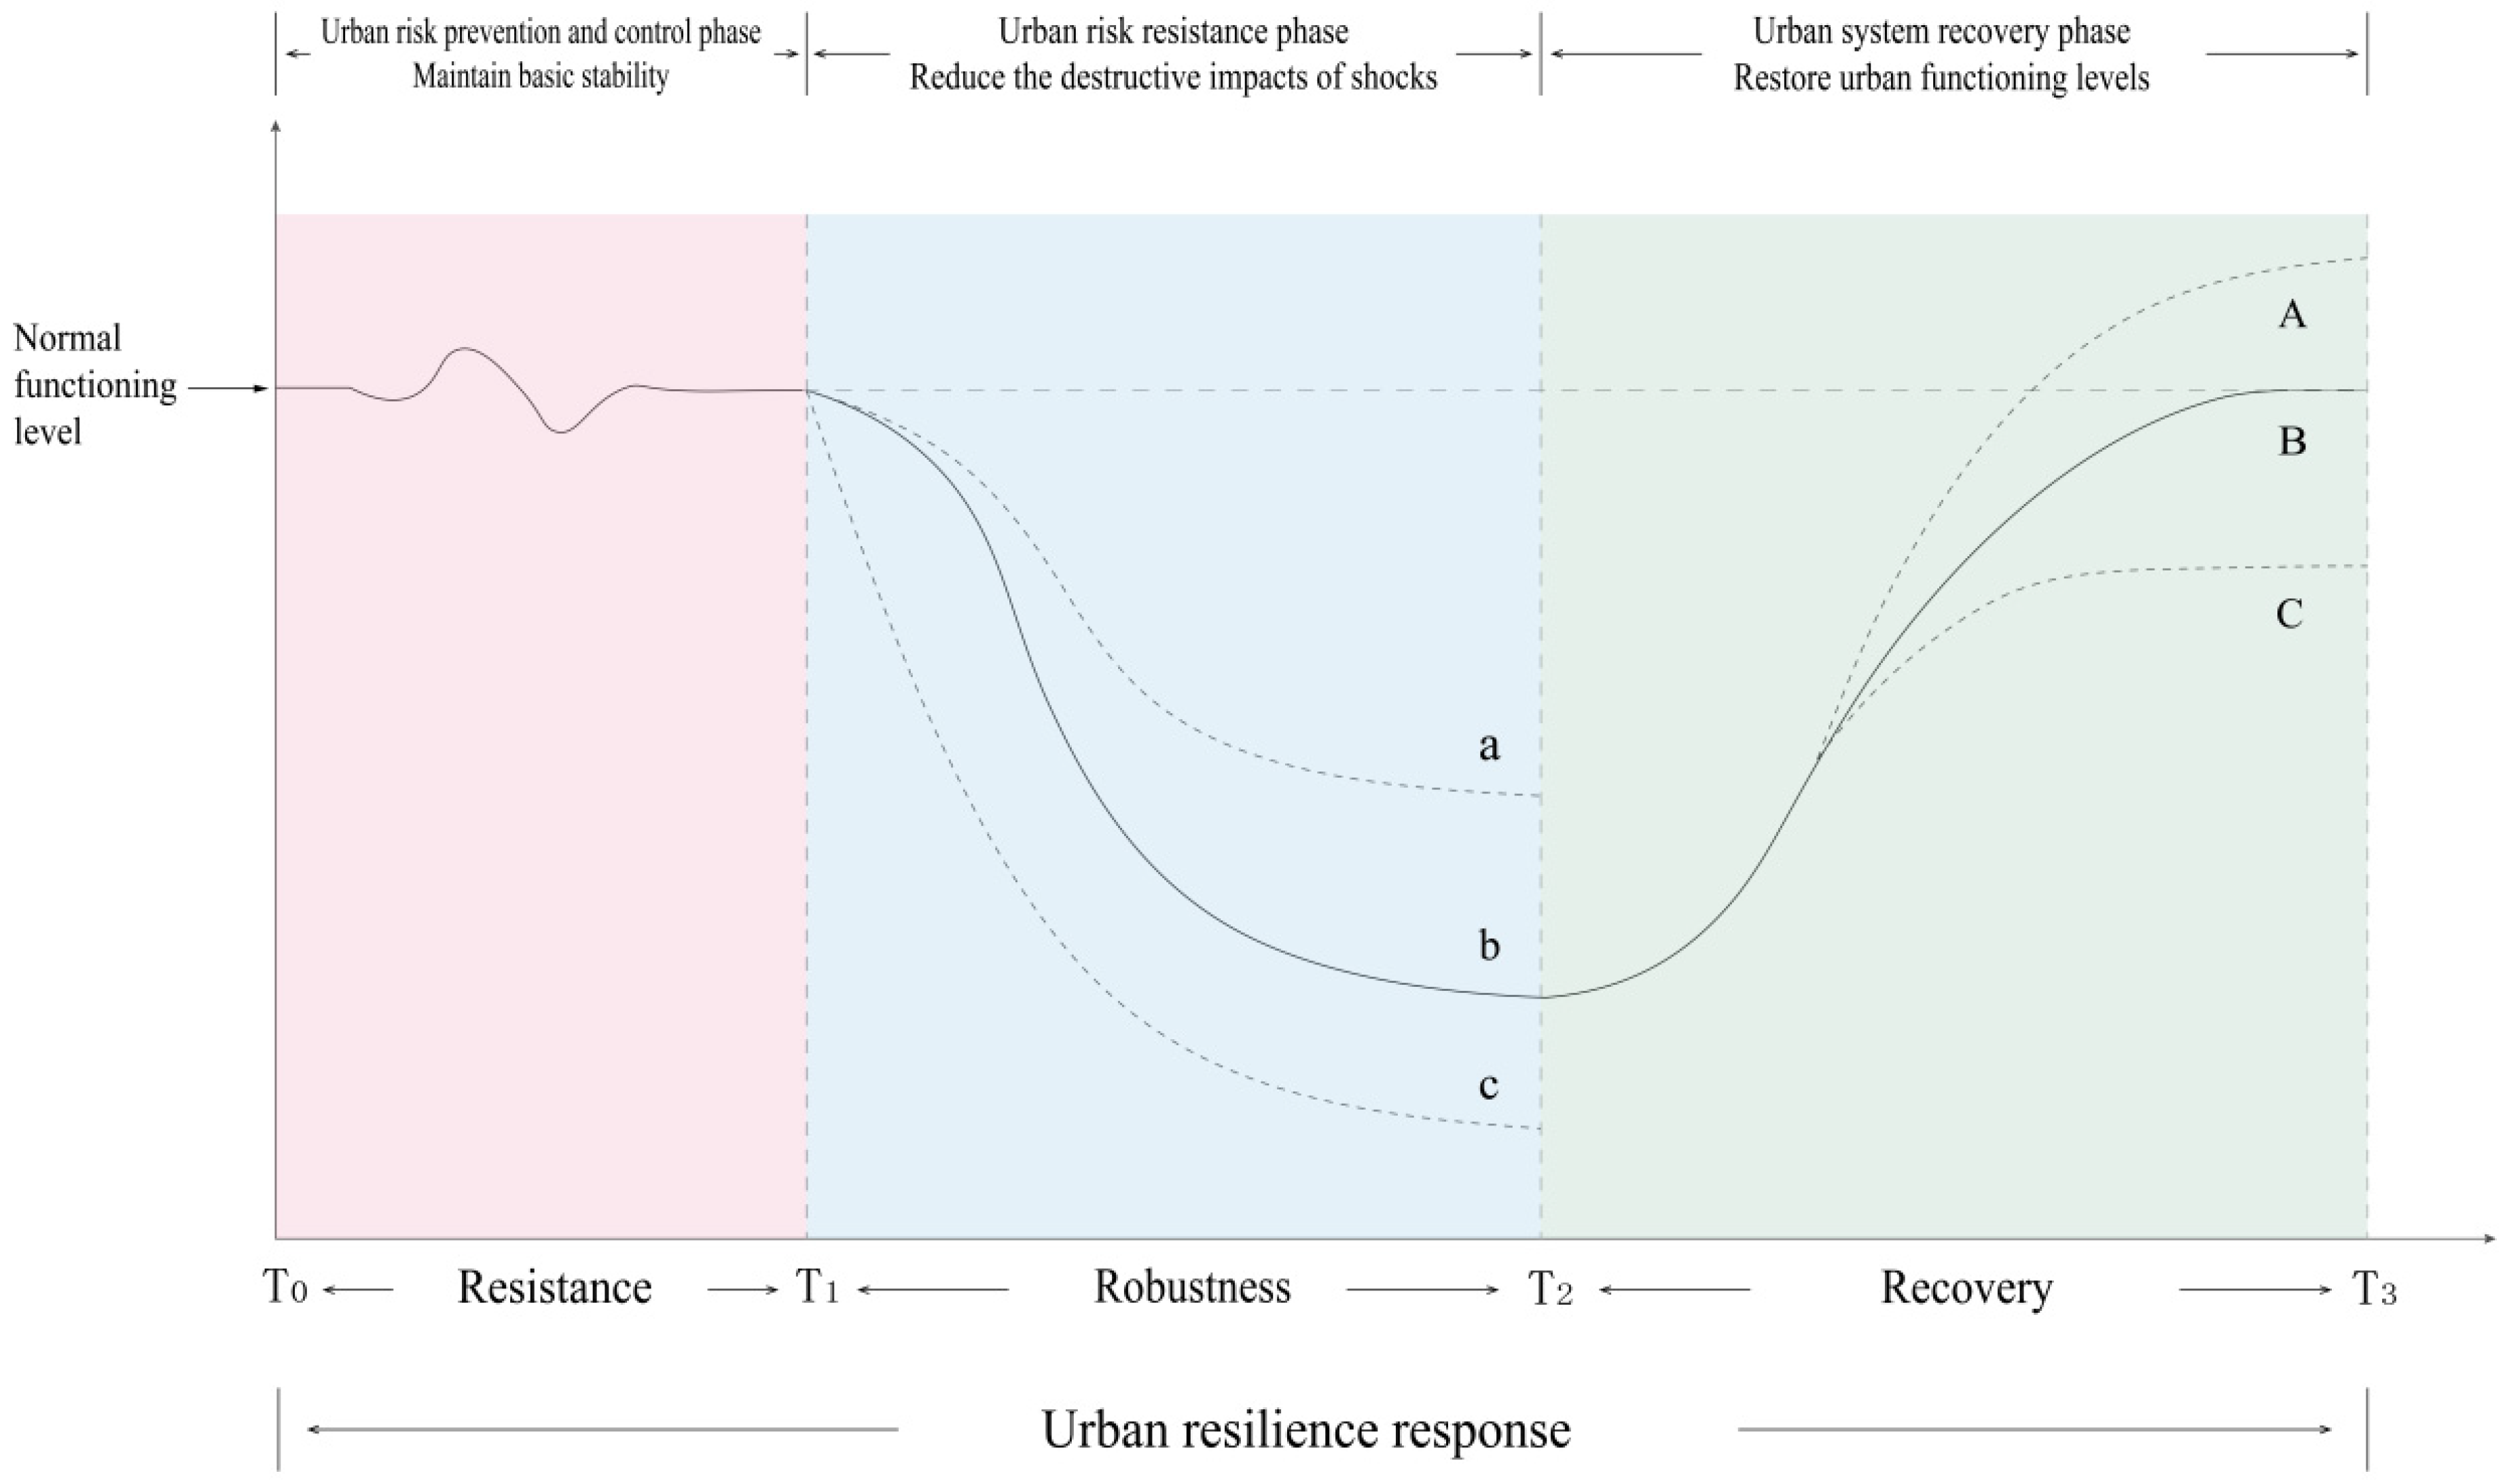
Building on this understanding, we construct the framework based around three resilience attributes—robustness, resistance, and recovery—and explicitly embed them within a cyclical risk-management process. This risk-management cycle emphasises that urban risk governance is achieved through continuous stages rather than one-off interventions, typically comprising risk prevention (ex ante), risk resistance during shocks (during the event), and risk recovery (ex post). We map the three capacities onto these stages to clarify both the conceptual meaning and the measurement logic. In this framework, robustness, resistance, and recovery are not treated as independent or parallel dimensions; rather, they are conceptualised as stage-specific capacities operating across the full cycle of risk governance. Specifically, robustness reflects a city system’s capacity to withstand potential disturbances before risks materialise; resistance captures the ability to maintain essential functions during shock events; and recovery denotes the capacity to restore, adapt, and reorganise in the post-disturbance phase. Figure 1 summarises the logical links among capacities, governance stages, and indicators, providing a process-consistent basis for measurement and interpretation.
This integration serves two purposes. First, it treats resilience capacities as stage-specific yet inter-related components within a continuous management cycle, thereby providing a theoretically coherent bridge between resilience theory and risk governance. Second, it strengthens the empirical assessment by guiding indicator selection: indicators are not chosen merely because they correlate with “good performance”, but rather because they are functionally linked to the role that a given capacity plays at a specific stage of risk governance. Accordingly, we operationalise the framework using an indicator system covering economic, social, and ecological dimensions, and classify indicators according to the capacity they most directly support. We then obtain the overall resilience level by multiplicatively aggregating the three capacities. This approach reflects the premise that resilience performance depends on the joint effects and interactions among robustness, resistance, and recovery, rather than on their simple additive contribution.

3. Data and Methodology

3.1. Study Area and Case Selection

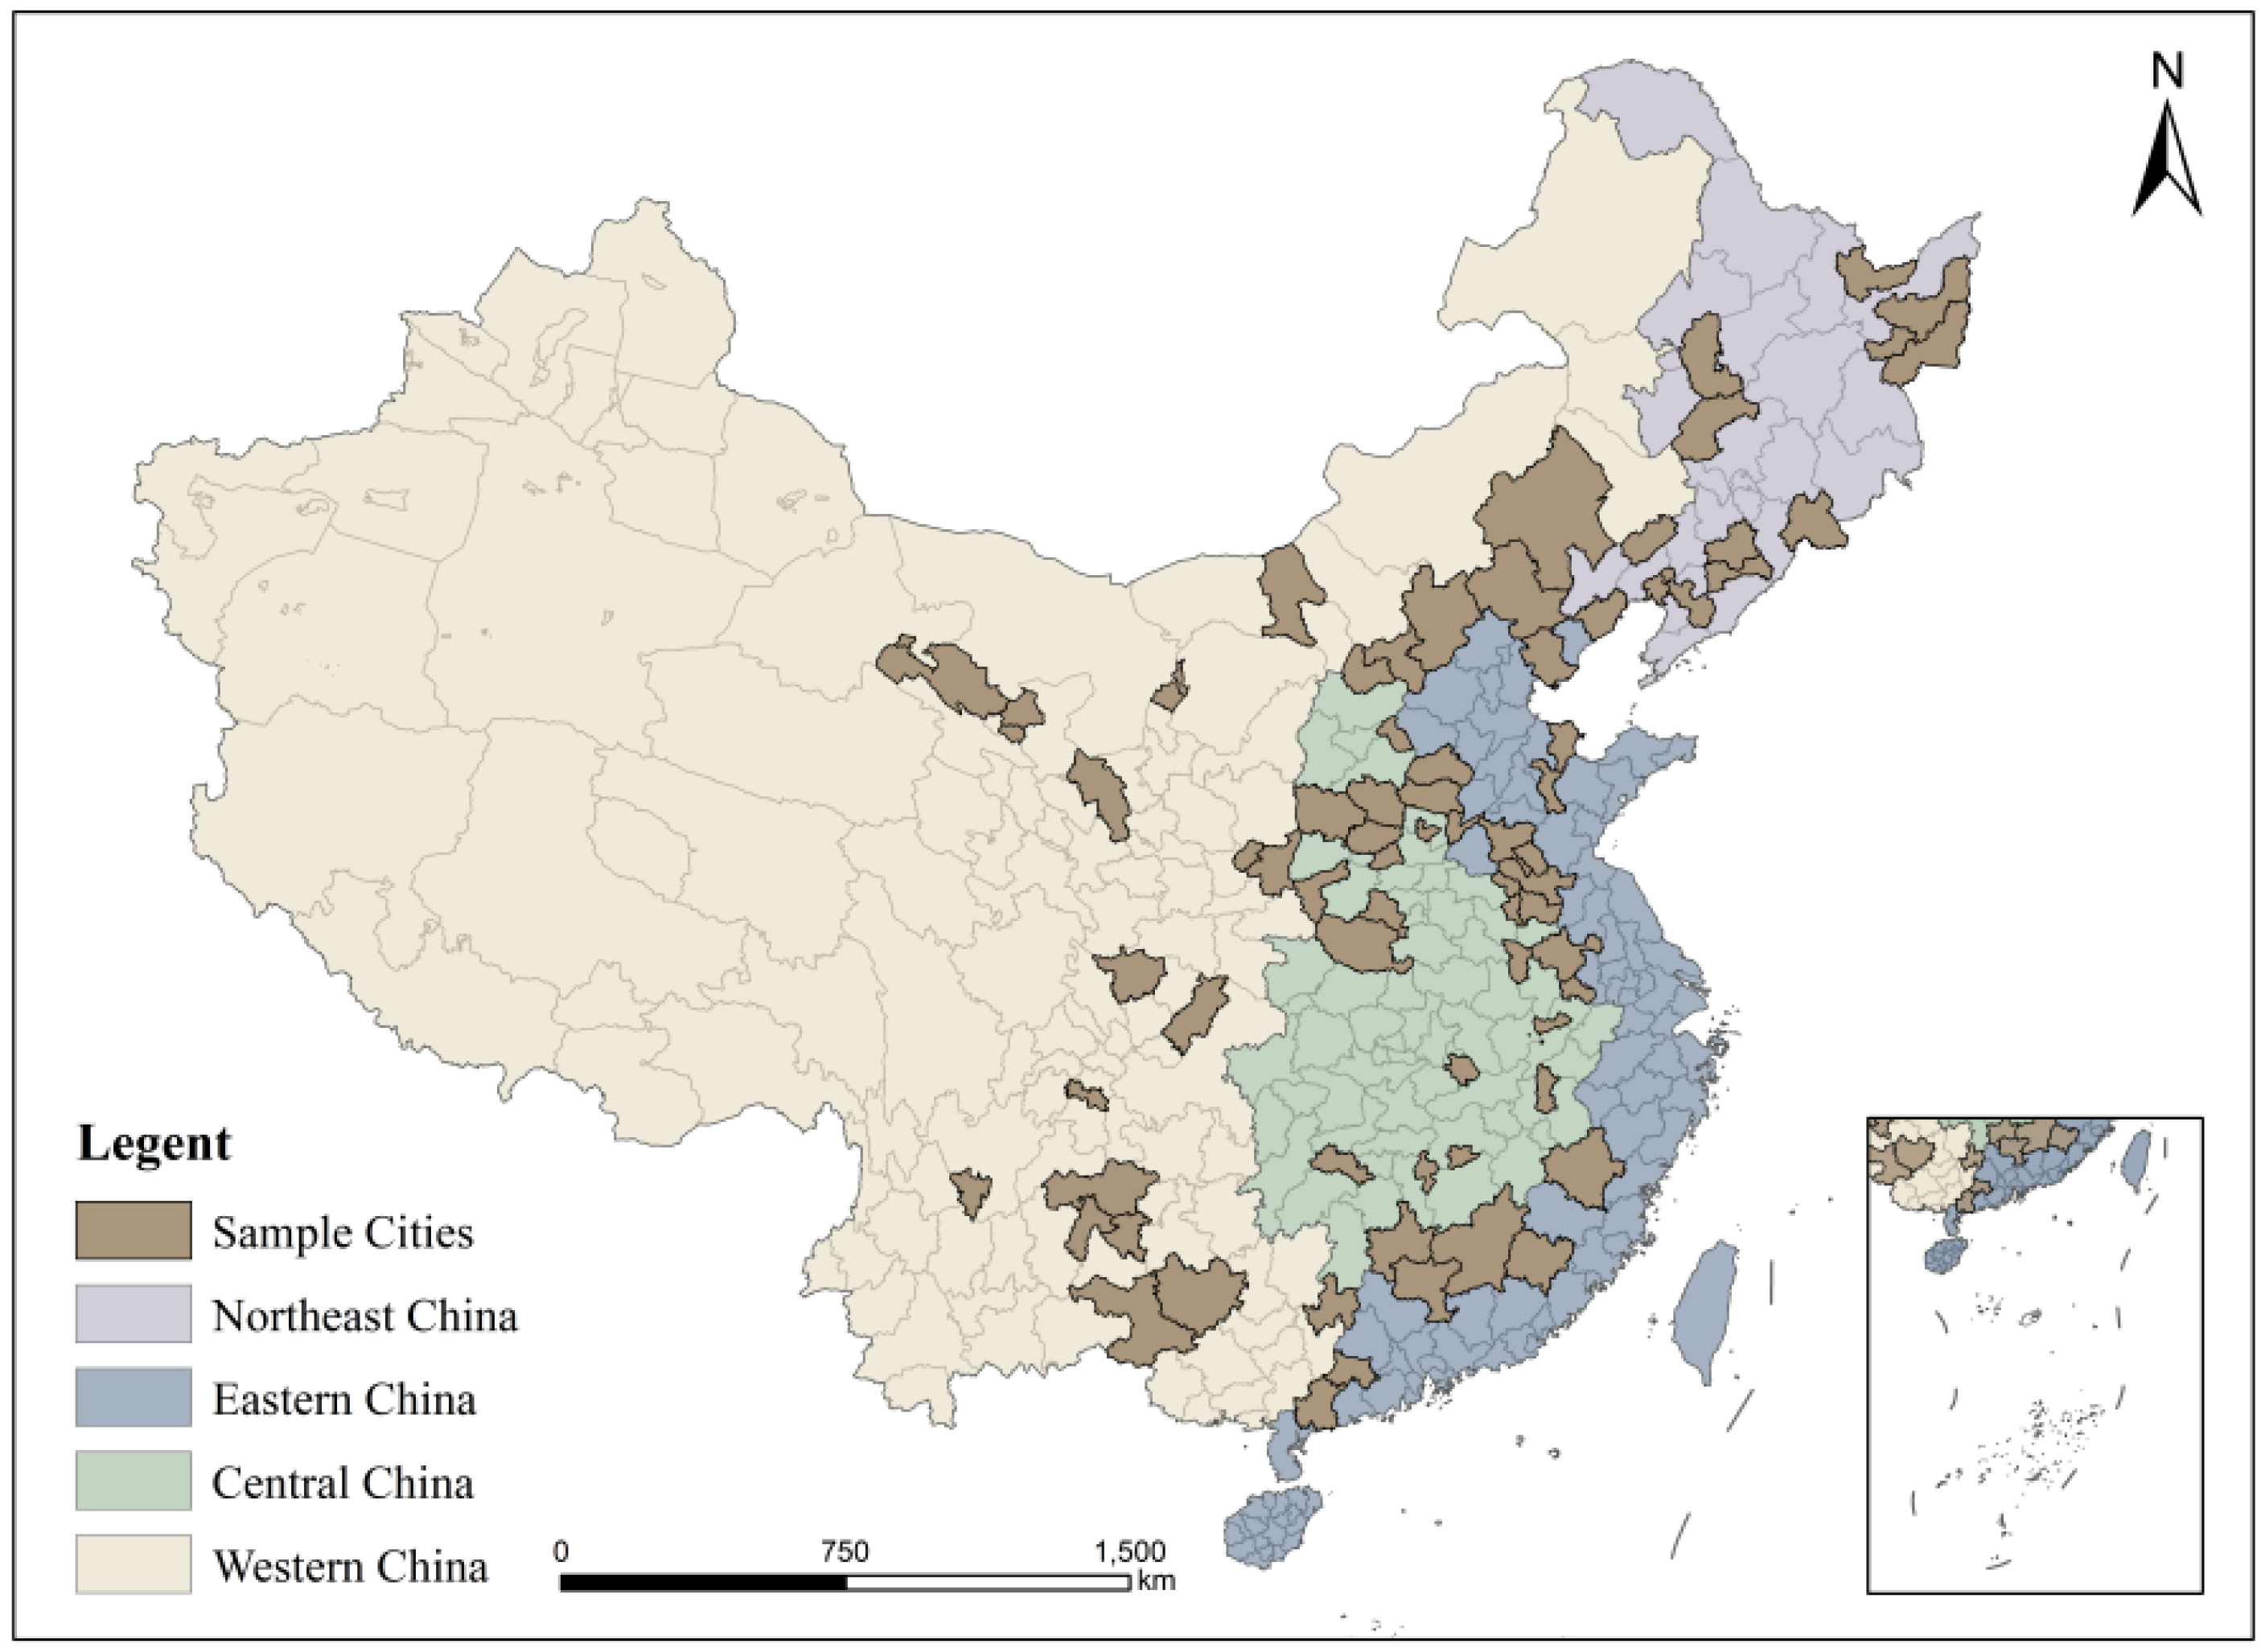
China is endowed with abundant mineral resources, with more than 170 identified mineral types [48]. Reserves of major resources such as coal, iron ore, and rare earths rank among the largest globally [49]. The spatial distribution of mineral resources in China exhibits pronounced regional patterns, often summarised as “coal in the north and phosphate in the south” and “iron in the east and copper in the west”, indicating strong geographical concentration. For example, coal resources are mainly distributed in North and Northwest China, iron ore is concentrated in Northeast and North China, and rare earth resources are primarily located in regions such as Inner Mongolia and Jiangxi. These distribution characteristics have not only driven the emergence and growth of mining cities but have also shaped regional economic structures and development trajectories. Considering data availability, this study selects 73 mining cities across China as the basic research units, including prefecture-level cities, prefectures, autonomous prefectures, and leagues (Figure 2).

3.2. Data Sources

The data used in this study comprise three components: (1) Spatial vector data. Administrative boundary data were obtained from the National Platform for Common Geospatial Information Services (Tianditu), using the official standard map (map approval code: GS (2024)0650). (2) Mining city list. The list of China’s mining cities was compiled based on the mining city catalogue reported in the China Urban Development Report [50]. (3) Indicator data. Socio-economic and environmental indicators were collected primarily from the China City Statistical Yearbook and the China County Statistical Yearbook (2014–2024), provincial and municipal statistical yearbooks, and the Statistical Communiqué on National Economic and Social Development. Missing values were supplemented using linear interpolation or trend extrapolation where appropriate.

3.3. Construction of the Urban Resilience Indicator System

Existing quantitative research on urban resilience mainly relies on two approaches. The first approach is index- or network-based quantification [51,52,53], which typically operationalises resilience through composite indices and places particular emphasis on complex network relationships. The second approach is the indicator-system method [54,55,56], which measures urban resilience by constructing a structured, multi-indicator evaluation framework. A representative example is the Rockefeller Foundation’s “100 Resilient Cities” (100RC) initiative launched in 2013, which proposed an assessment framework comprising four dimensions, 12 goals, and 52 indicators.
Urban resilience is widely conceptualised as a dynamic process. However, conventional indicator-weighting and additive aggregation approaches may implicitly portray resilience as a comparatively static condition, as they are less sensitive to interactions among different capacities. Accordingly, this study integrates a multi-indicator framework with an index-based aggregation strategy. We treat stability, resistance, and recovery as three complementary capacities that jointly characterise urban resilience, and we employ their geometric mean to construct the overall resilience index. This multiplicative form captures the “weakest-link” effect, whereby deficiencies in any single capacity can constrain overall resilience. Guided by the stability–resistance–recovery framework, we select 30 indicators covering economic, social, and ecological dimensions to measure resilience levels in mining cities.
Indicator selection in the evaluation system is guided by the functional roles of each capacity in the urban resilience response process and risk governance, while also reflecting the specific characteristics of mining cities. Accordingly, the indicator set is organised into three capacity domains. Robustness indicators (Table 1) capture preventive capacity and the ability to sustain resilience before shocks occur, thereby representing the robustness component of urban resilience. Resistance indicators (Table 2) reflect the capacity to absorb or mitigate external disturbances and maintain essential urban functions during shock events, representing the resistance component. Recovery indicators (Table 3) capture the capacity to restore functions and rebuild resilience in the post-disturbance phase, representing the recovery component. The detailed selection and classification of indicators are grounded in existing theoretical and empirical research on urban resilience.
The calculation methods for a subset of the selected indicators are outlined as follows:
(1) The industrial concentration index is measured as the sum of the squared shares of the three major industries in regional gross domestic product (GDP) [57]. (2) Industrial upgrading is proxied by the ratio of value added in the tertiary sector to that in the secondary sector [58]. This indicator has been widely used in the literature to capture structural upgrading at the urban level. (3) Research and development (R&D) input intensity is calculated as the proportion of science and technology expenditure relative to regional GDP, while education investment intensity is measured as the share of education expenditure in regional GDP. (4) The level of social consumption is represented by the ratio of total retail sales of consumer goods to regional GDP. This indicator reflects the relative intensity of consumption activity rather than absolute consumption levels.
Table 1. Indicators for Assessing Urban Robustness Capacity.
System LayerCriterion LayerIndicatorIndicator Description and AttributeEntropy MethodAHPComposite Weight
Robustness Capacity
(Urban Risk Prevention Stage)
Economic DimensionConcentration index of the three industriesMeasures the degree of industrial concentration across the primary, secondary, and tertiary sectors (+)0.10190.15160.1337
Industrial upgrading levelMeasures the degree of industrial advancement and economic shock resistance (+)0.02820.13440.0662
Intensity of R&D investmentMeasures urban technological innovation capacity (+)0.14780.11940.1428
Intensity of educationMeasures investment in education and human capital development (+)0.06250.04310.0558
Social DimensionDevelopment Stage of Mining Cities [59]Measures the stage of resource exploitation and remaining exploitable resource potential (−)0.32110.10300.1956
Unemployment RiskMeasures the level of unemployment risk faced by urban residents (−)0.05750.11950.0891
Social Consumption LevelMeasures the level of urban consumption activity (+)0.02090.05870.0377
Ecological/Environmental DimensionIndustrial Wastewater Discharge (10,000 tonnes)Measures the degree of environmental pollution and risk exposure (−)0.11860.07680.1026
Air Quality Index (AQI) [60]Measures overall urban environmental quality and environmental risk exposure (−)0.08790.14270.1204
Industrial Sulphur Dioxide (SO2) Emissions (tonnes)Measures the degree of environmental pollution and environmental risk exposure (−)0.05370.05070.0561
Table 2. Indicators for Assessing Urban Resistance Capacity.
System LayerCriterion LayerIndicatorIndicator Description and AttributeEntropy MethodAHPComposite Weight
Resistance Capacity
(Urban Risk Resistance Stage)
Economic DimensionYear-end Savings of Urban and Rural Residents (10,000 CNY)Measures households’ capacity for risk buffering (+)0.09800.04300.0649
Fiscal Self-sufficiency of Local GovernmentsMeasures fiscal autonomy and financial soundness of local governments (+)0.16440.17370.1690
Profit Share of Resource-based IndustriesMeasures the economic returns from resource-based industries (+)0.01520.05970.0301
Degree of Trade DependenceMeasures economic openness and external vulnerability (−)0.06290.17200.1040
Social DimensionNumber of Employees in Urban Non-private Units (10,000 persons)Measures formal employment capacity and urban resistance to risk (+)0.18500.03780.0836
Share of Employment in the Mining IndustryMeasures dependence on resource-based employment (−)0.04710.12460.0766
Level of Urban Construction DevelopmentMeasures urban development quality and resistance capacity (+)0.08200.11880.0987
Ecological/Environmental DimensionLand Use IntensityMeasures the intensity and efficiency of urban land development (+)0.16940.13650.1521
Density of Drainage Pipelines in Built-up Areas (km/km2)Measures urban drainage capacity and resistance to flooding risk (+)0.12790.06300.0898
Centralised Wastewater Treatment RateMeasures ecological infrastructure provision and environmental recovery capacity (+)0.04830.07070.0584
Table 3. Indicators for Assessing Urban Recovery Capacity.
System LayerCriterion LayerIndicatorIndicator Description and AttributeEntropy MethodAHPComposite Weight
Recovery Capacity
(Urban Risk Recovery Stage)
Economic DimensionAverage Wage of Employees in Urban Non-Private UnitsMeasures the average recovery level of residents (+)0.16070.07800.1281
Expenditure on Social Security and EmploymentMeasures urban social welfare expenditure (+)0.04870.14540.0963
Gross Domestic ProductMeasures the level of economic development and recovery (+)0.11870.08140.1125
Growth RateGDPMeasures the level of sustainable development and economic vitality (+)0.02420.14370.0674
Social DimensionNatural Population Growth RateMeasures urban recovery capacity (+)0.05500.11240.0899
Unemployment Insurance Coverage RateMeasures the city’s capacity to recover from unemployment risks (+)0.16700.08510.1364
Number of Hospital BedsMeasures healthcare provision and recovery capacity (+)0.16110.08370.1329
Ecological/Environmental DimensionGreen Coverage Rate in Built-up AreasMeasures ecological construction and recovery in built-up areas (+)0.03110.09030.0607
Per Capita Park Green Space AreaMeasures ecological construction and recovery at the city level (+)0.03070.14200.0756
Utilisation Rate of General Industrial Solid WasteMeasures the level of urban ecological environment construction and restoration (+)0.20270.03790.1003

3.4. Analytical Methods

3.4.1. Indicator Standardisation

To remove scale effects and unit inconsistencies across indicators and improve comparability, all variables are standardised prior to weighting [61].
For positive indicators, the normalisation formula is given in Equation (1):
x ij = X ij min ( X ij ) max ( X ij ) min ( X ij )
For negative indicators, the normalisation formula is given in Equation (2):
x ij = max ( X ij ) X ij max ( X ij ) min ( X ij )
where i denotes the indicator, j denotes the year, X ij is the original value, and max( X ij ) and min( X ij ) are the maximum and minimum values of indicator i across the sample.

3.4.2. Weighting Strategy

This study applies a combined weighting strategy that integrates objective and subjective information:
(1)
Entropy method.
The entropy method provides an objective weighting scheme based on the dispersion of each indicator, avoiding reliance on expert judgement and reducing potential subjectivity [61,62]. It is used to derive objective weights w 1 i and to mitigate redundancy among multiple indicators.
(2)
Analytic Hierarchy Process.
AHP is a widely used multi-criteria decision method that derives subjective weights by decomposing the decision problem into hierarchical levels (goal–criteria–alternatives) and combining qualitative judgement with quantitative evaluation [63,64]. It is used to obtain subjective weights w 2 i .
(3)
Integrated weights.
Objective weights w 1 i are computed using the entropy method, whereas subjective weights w 2 i are obtained via the analytic hierarchy process (AHP). As both methods may entail some bias in weight estimation, the minimum information entropy principle is adopted to compute composite weights by combining the objective and subjective weights [65], as shown in Equation (3):
w i = ( w 1 i × w 2 i ) 1 / 2 i = 1 n ( w 1 i × w 2 i ) 1 / 2

3.4.3. Composite Urban Resilience Index

Urban resilience is inherently dynamic, and the robustness–resistance–recovery capacities represent complementary stages of the resilience response. A multiplicative aggregation approach is therefore adopted to capture interdependence among capacities, as it better reflects the complex relationships among factors than simple additive integration [66,67]. Therefore, the calculation of composite urban resilience is formulated as shown in Equation (4):
U R = ( R o b u s t n e s s × R e s i s t a n c e × R e c o v e r y ) 1 / 3
where UR denotes the composite urban resilience of mining cities.

3.4.4. Kernel Density Estimation

Kernel density estimation (KDE) is a non-parametric method for estimating the distribution of a variable [68]. It uses a smooth kernel function to approximate the density curve and is widely applied to dynamic evolution analysis due to its robustness and weak dependence on parametric assumptions [69]. The kernel density estimator is defined as in Equation (5):
f ^ ( x ) = 1 n h i = 1 n K ( x x i h )
where f ^ ( x ) is the estimated density at x, n is the number of observations, K(x) is the kernel function, and h is the bandwidth.

3.4.5. Dagum Gini Coefficient and Decomposition

The Gini coefficient is a classical measure of inequality. The Dagum Gini coefficient extends the traditional Gini by decomposing overall inequality into within-group inequality (Gw), between-group inequality (Gb), and the transvariation component (Gt) [70]. The transvariation component captures the degree of distributional overlap between regions and reflects the intensity and concentration of cross-regional differences. A smaller transvariation component generally indicates clearer regional stratification and a more stable inequality gradient, with less pronounced cross-over effects. In this study, mining cities are grouped into four major regions (East, Central, West, and Northeast China) to examine overall inequality, between-region inequality, within-region inequality, and their respective contributions.

3.4.6. Conventional Gini Coefficient

The conventional Gini coefficient, originally proposed by Corrado Gini in 1912, ranges from 0 to 1, with higher values indicating greater inequality [71]. Here it is calculated using the mean resilience level of each region as the comparison term and the number of mining cities in each region as weights. It is used as a robustness check to validate inequality trends identified by the Dagum decomposition.

3.4.7. ARIMA Time-Series Model

The autoregressive integrated moving average model, ARIMA(p,d,q), is a classical approach for modelling and forecasting time-series data [72]. By combining autoregressive (AR), differencing (I), and moving average (MA) terms, the model captures temporal dependence and dynamic patterns in the series. The calculation is formulated as shown in Equation (6):
Φ p ( B ) ( 1 B ) d y t = Θ q ( B ) E t
where Φ p ( B ) is the autoregressive polynomial, Θ q ( B ) is the moving average polynomial, ( 1 B ) d is the differencing operator, y t is the observed value at time t, B is the lag operator, and E t is a white-noise error term.

4. Results

4.1. Temporal Evolution of Resilience in Mining Cities

4.1.1. Temporal Changes in Composite Resilience

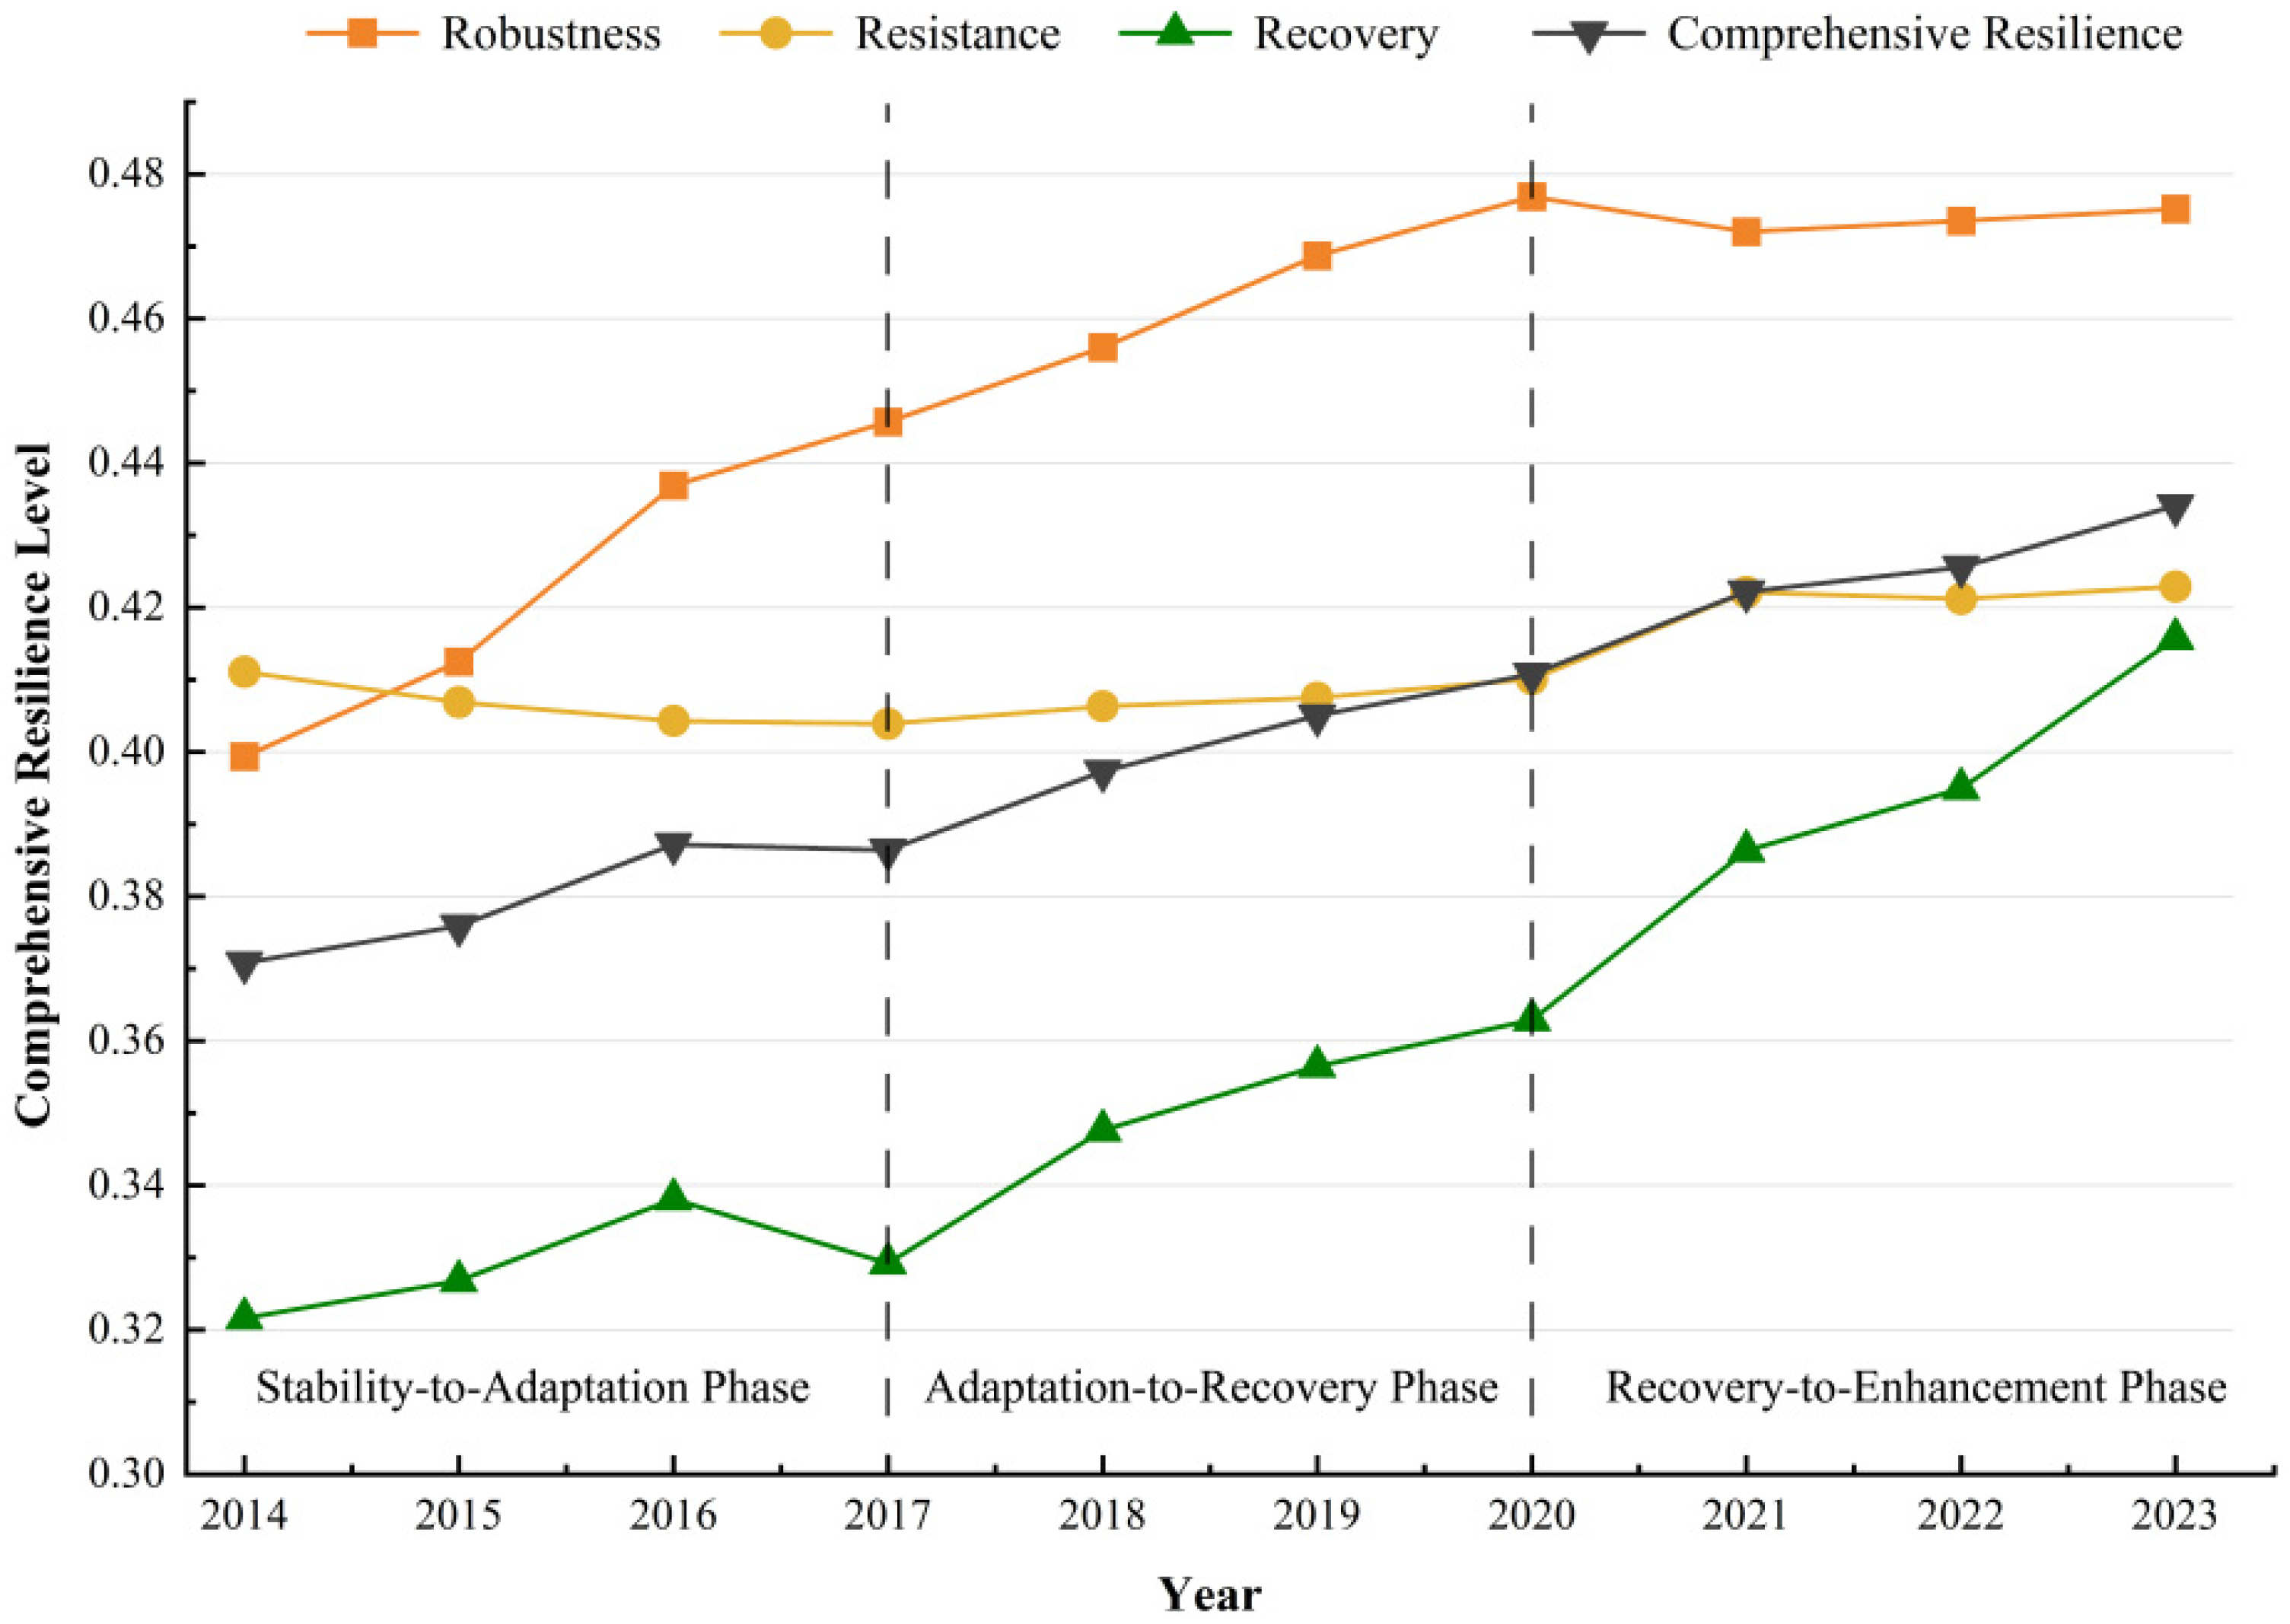
The resilience level of the mining cities in the study area increased from 0.37 in 2014 to 0.44 in 2023, representing a growth rate of 18.92%. Overall, resilience shows a gradual-to-steady upward trend, moving through three stages (stability–adaptation, adaptation–recovery, and recovery–enhancement), broadly corresponding to an urban development life-cycle trajectory (Figure 3):
  • Stability–adaptation stage (2014–2017). During this stage, resilience increased slowly. The continued implementation of the National Plan for the Sustainable Development of Resource-Based Cities (2013–2020) clarified development orientations and key tasks for different types of resource-based cities and strengthened the policy basis for sustainability-oriented initiatives in mining cities, contributing to a gradual rise in resilience. However, in 2017, persistent weakening of iron ore demand and prices, together with an increase in production restrictions among steel enterprises, constrained economic performance in mining cities, leading to a slight decline in resilience.
  • Adaptation–recovery stage (2017–2020). With the emergence of the green mine concept, many regions promoted green mine development, and by 2020, a basic green mine development pattern had largely taken shape. This was accompanied by a rapid improvement in ecological recovery capacity. In parallel, the release of policy guidance on cultivating new drivers for the transformation of resource-based cities further refined transition pathways, and resilience rebounded steadily and continued to rise.
  • Recovery–enhancement stage (2020–2023). Driven by China’s “dual-carbon” targets, the green transition accelerated, investment in digital infrastructure increased, and urban governance systems were progressively strengthened. During this period, policy initiatives under the 14th Five-Year Plan, together with targeted central funding for the comprehensive management of coal mining subsidence areas and the upgrading of independent industrial and mining districts, supported industrial restructuring and urban renewal projects. As a result, mining city resilience entered a stage of sustained improvement.
Figure 3. Spatiotemporal Evolution of Composite Resilience Levels in Mining Cities.
Land 15 00348 g003

4.1.2. Temporal Evolution of Resilience Subsystems

  • Robustness subsystem
The robustness subsystem remains at a relatively high level throughout the study period and makes a substantial contribution to overall resilience. In response to internal and external pressures, some mining cities advanced supply-side structural reforms while accelerating industrial upgrading and digital transformation. During this process, the robustness subsystem was strengthened through the phasing out of outdated capacity and the integration of local comparative advantages, leading to a more balanced industrial structure and more coherent industrial chains. These adjustments improved system stability and supported the sustained functioning of urban economic and social systems. In 2020, the global pandemic introduced temporary disturbances, resulting in short-term fluctuations and a moderation of the growth rate; nevertheless, robustness remained comparatively high.
2.
Resistance subsystem
Over the study period, the resistance subsystem exhibits a relatively stable pattern of fluctuation with an overall upward tendency. Against the backdrop of changing global economic conditions and frequent volatility in mineral commodity prices, some mining cities diversified their industrial structures and reduced dependence on a single mineral product, thereby strengthening their capacity to buffer market—related shocks. Overall, the resistance subsystem continued to improve during the study period, supported by measures such as industrial diversification, adaptation to policy shifts, and responses to resource depletion. These changes enhanced the ability of mining cities to withstand multiple types of disturbances and provided a foundation for more sustainable development.
3.
Recovery subsystem
During the study period, recovery capacity demonstrates a pronounced upward trend, increasing from 0.32 in 2014 to 0.42 in 2023, representing a growth rate of 31.25%. On the one hand, the introduction and implementation of green mining and abandoned mine remediation initiatives have steadily improved ecological recovery capacities, while the issuance of the Green Mine Evaluation Standards has provided operational and quantifiable benchmarks. On the other hand, sustained economic growth, rising urban vitality, strengthened social welfare provision, and improvements in social security systems have jointly reinforced recovery capacity. The interaction between socio-economic and ecological factors has thus played a key role in accelerating post-shock recovery in mining cities.
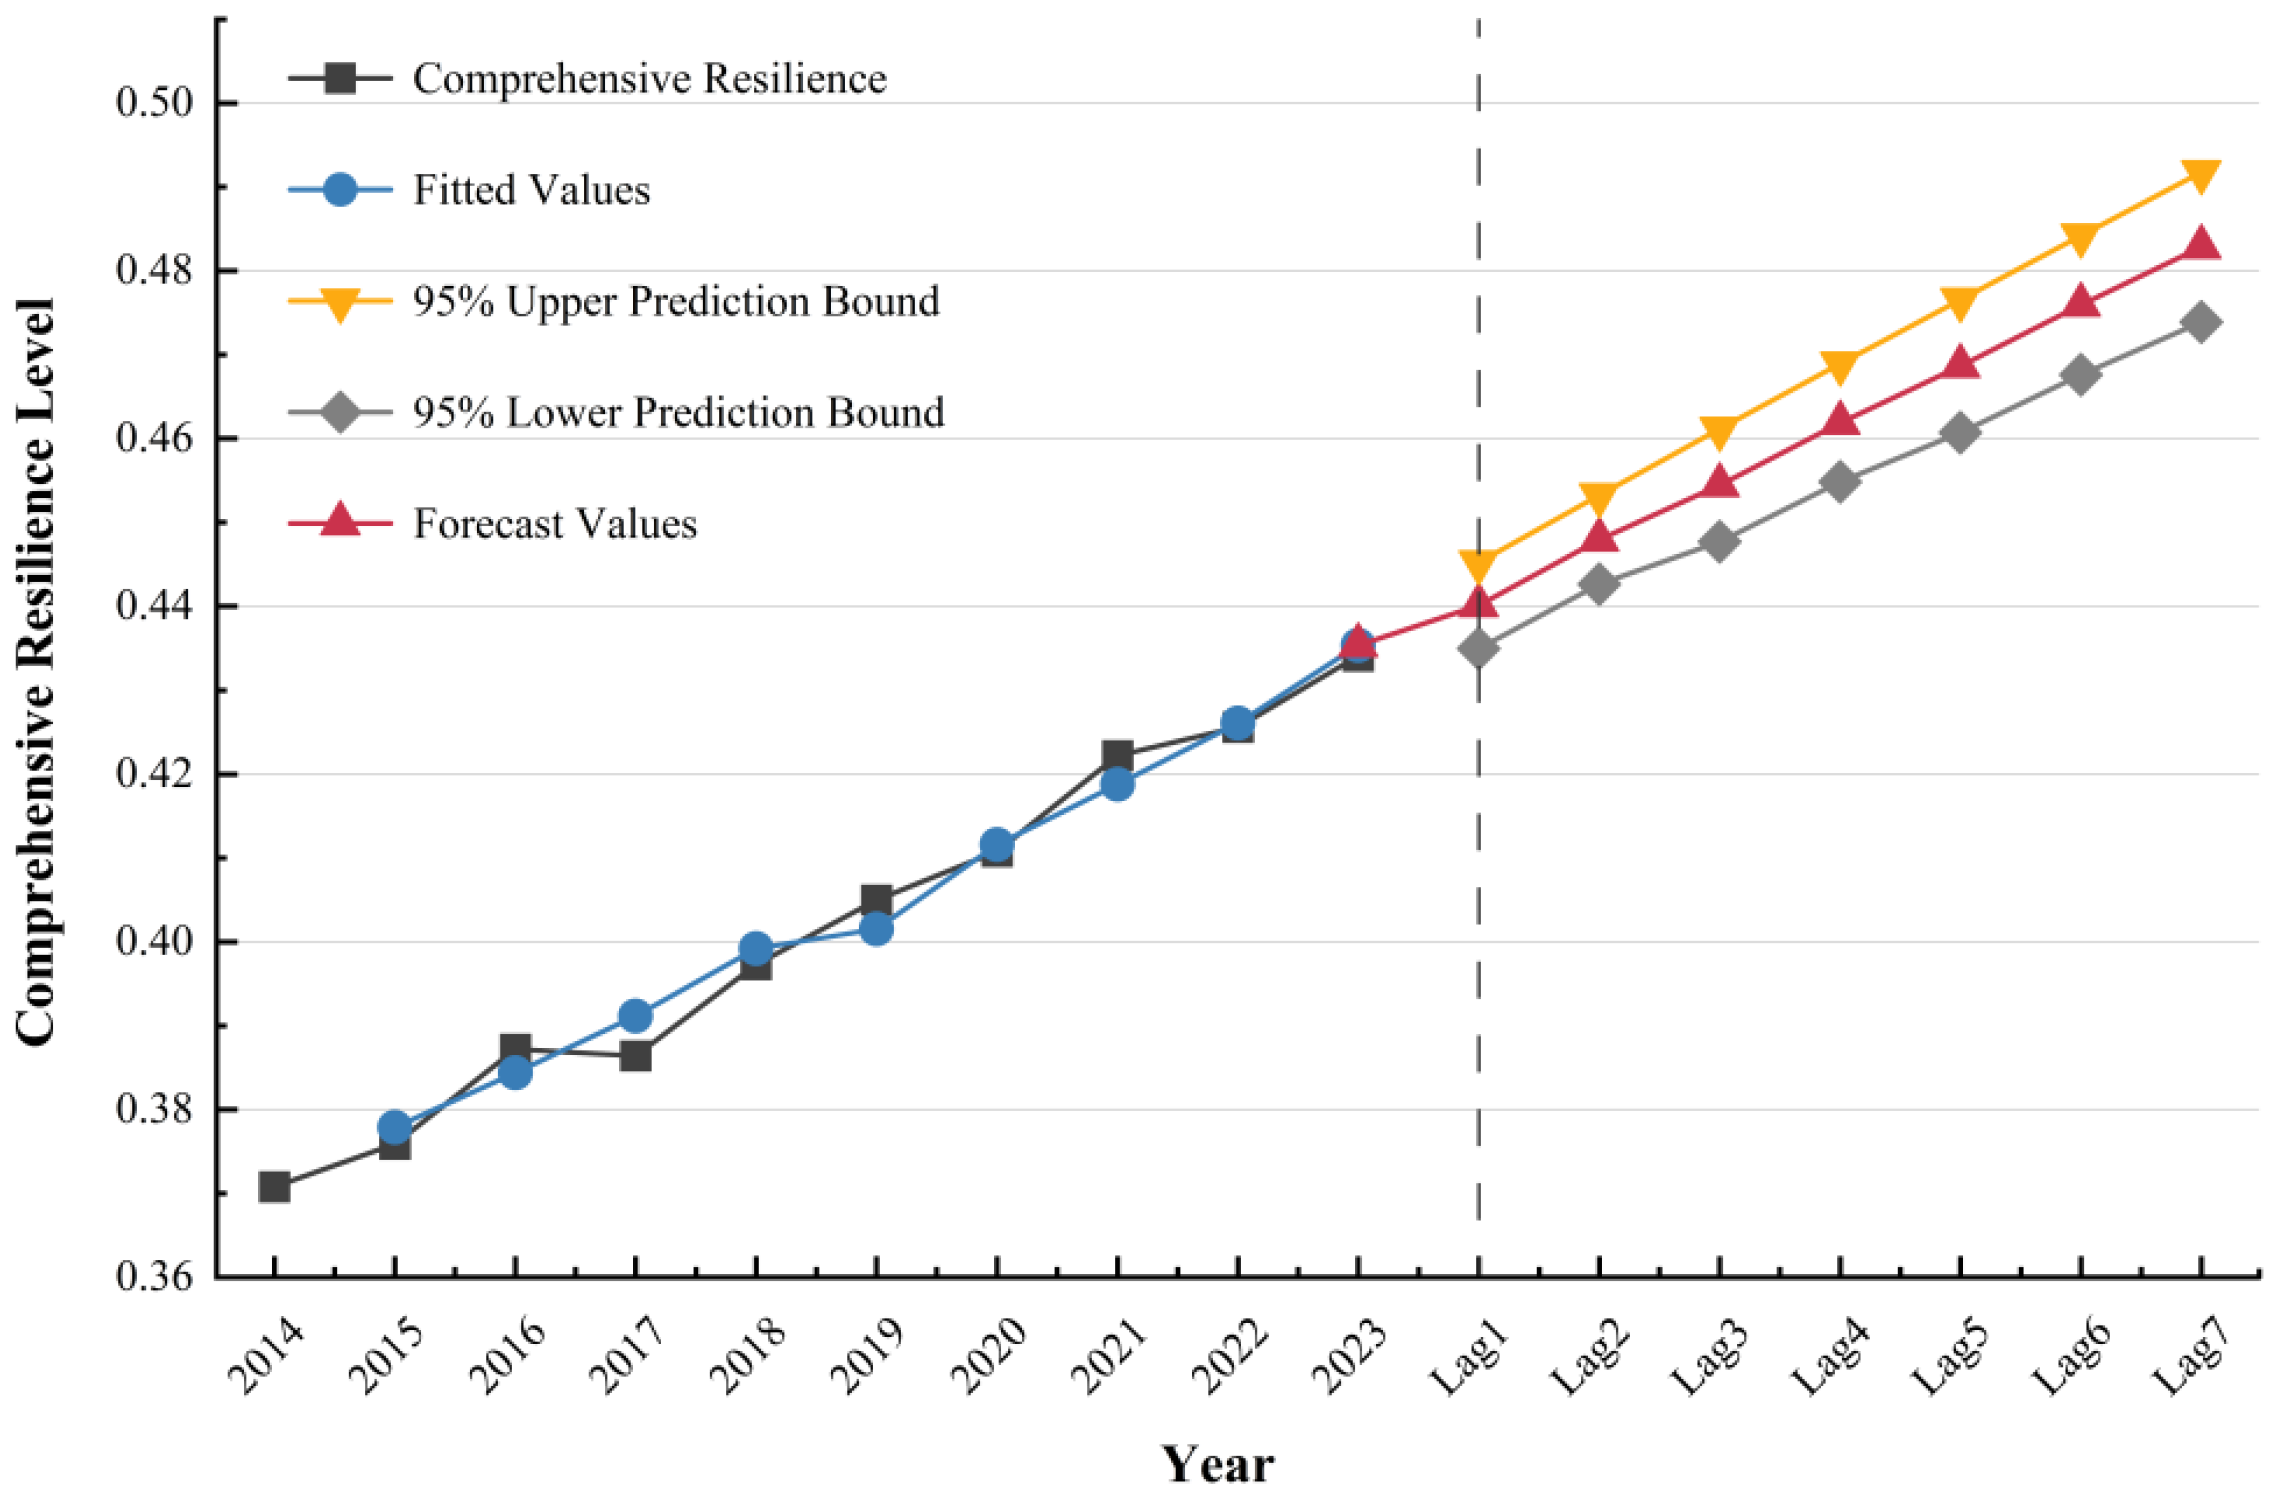
Drawing on the observed temporal evolution of resilience in mining cities over the past decade and its correspondence with the urban life-cycle perspective, an ARIMA forecasting model is employed to project resilience trends from 2024 to 2030 (Figure 4). Model specification and parameter selection are guided by standard information criteria. Based on comparisons of the Akaike Information Criterion (AIC) and the Bayesian Information Criterion (BIC), the ARIMA (1,1,0) model is identified as the optimal specification, yielding the lowest AIC value (−74.680). Diagnostic tests indicate that the residuals satisfy the white-noise assumption, as confirmed by the Q-statistic (p = 0.486), suggesting an adequate model fit. Forecast results for the subsequent seven periods reveal a steady upward trajectory in the resilience level of mining cities. This pattern indicates that mining cities have entered a phase of sustained resilience enhancement, moving gradually towards a development pathway characterised by higher resilience and improved urban quality. From a regional development perspective, the projected trend implies that continued structural adjustment, green transition, and governance improvements may contribute to the sustained strengthening of resilience in mining cities in the medium term.

4.2. Spatial Restructuring of Urban Resilience

4.2.1. Spatial Evolution and Agglomeration Patterns

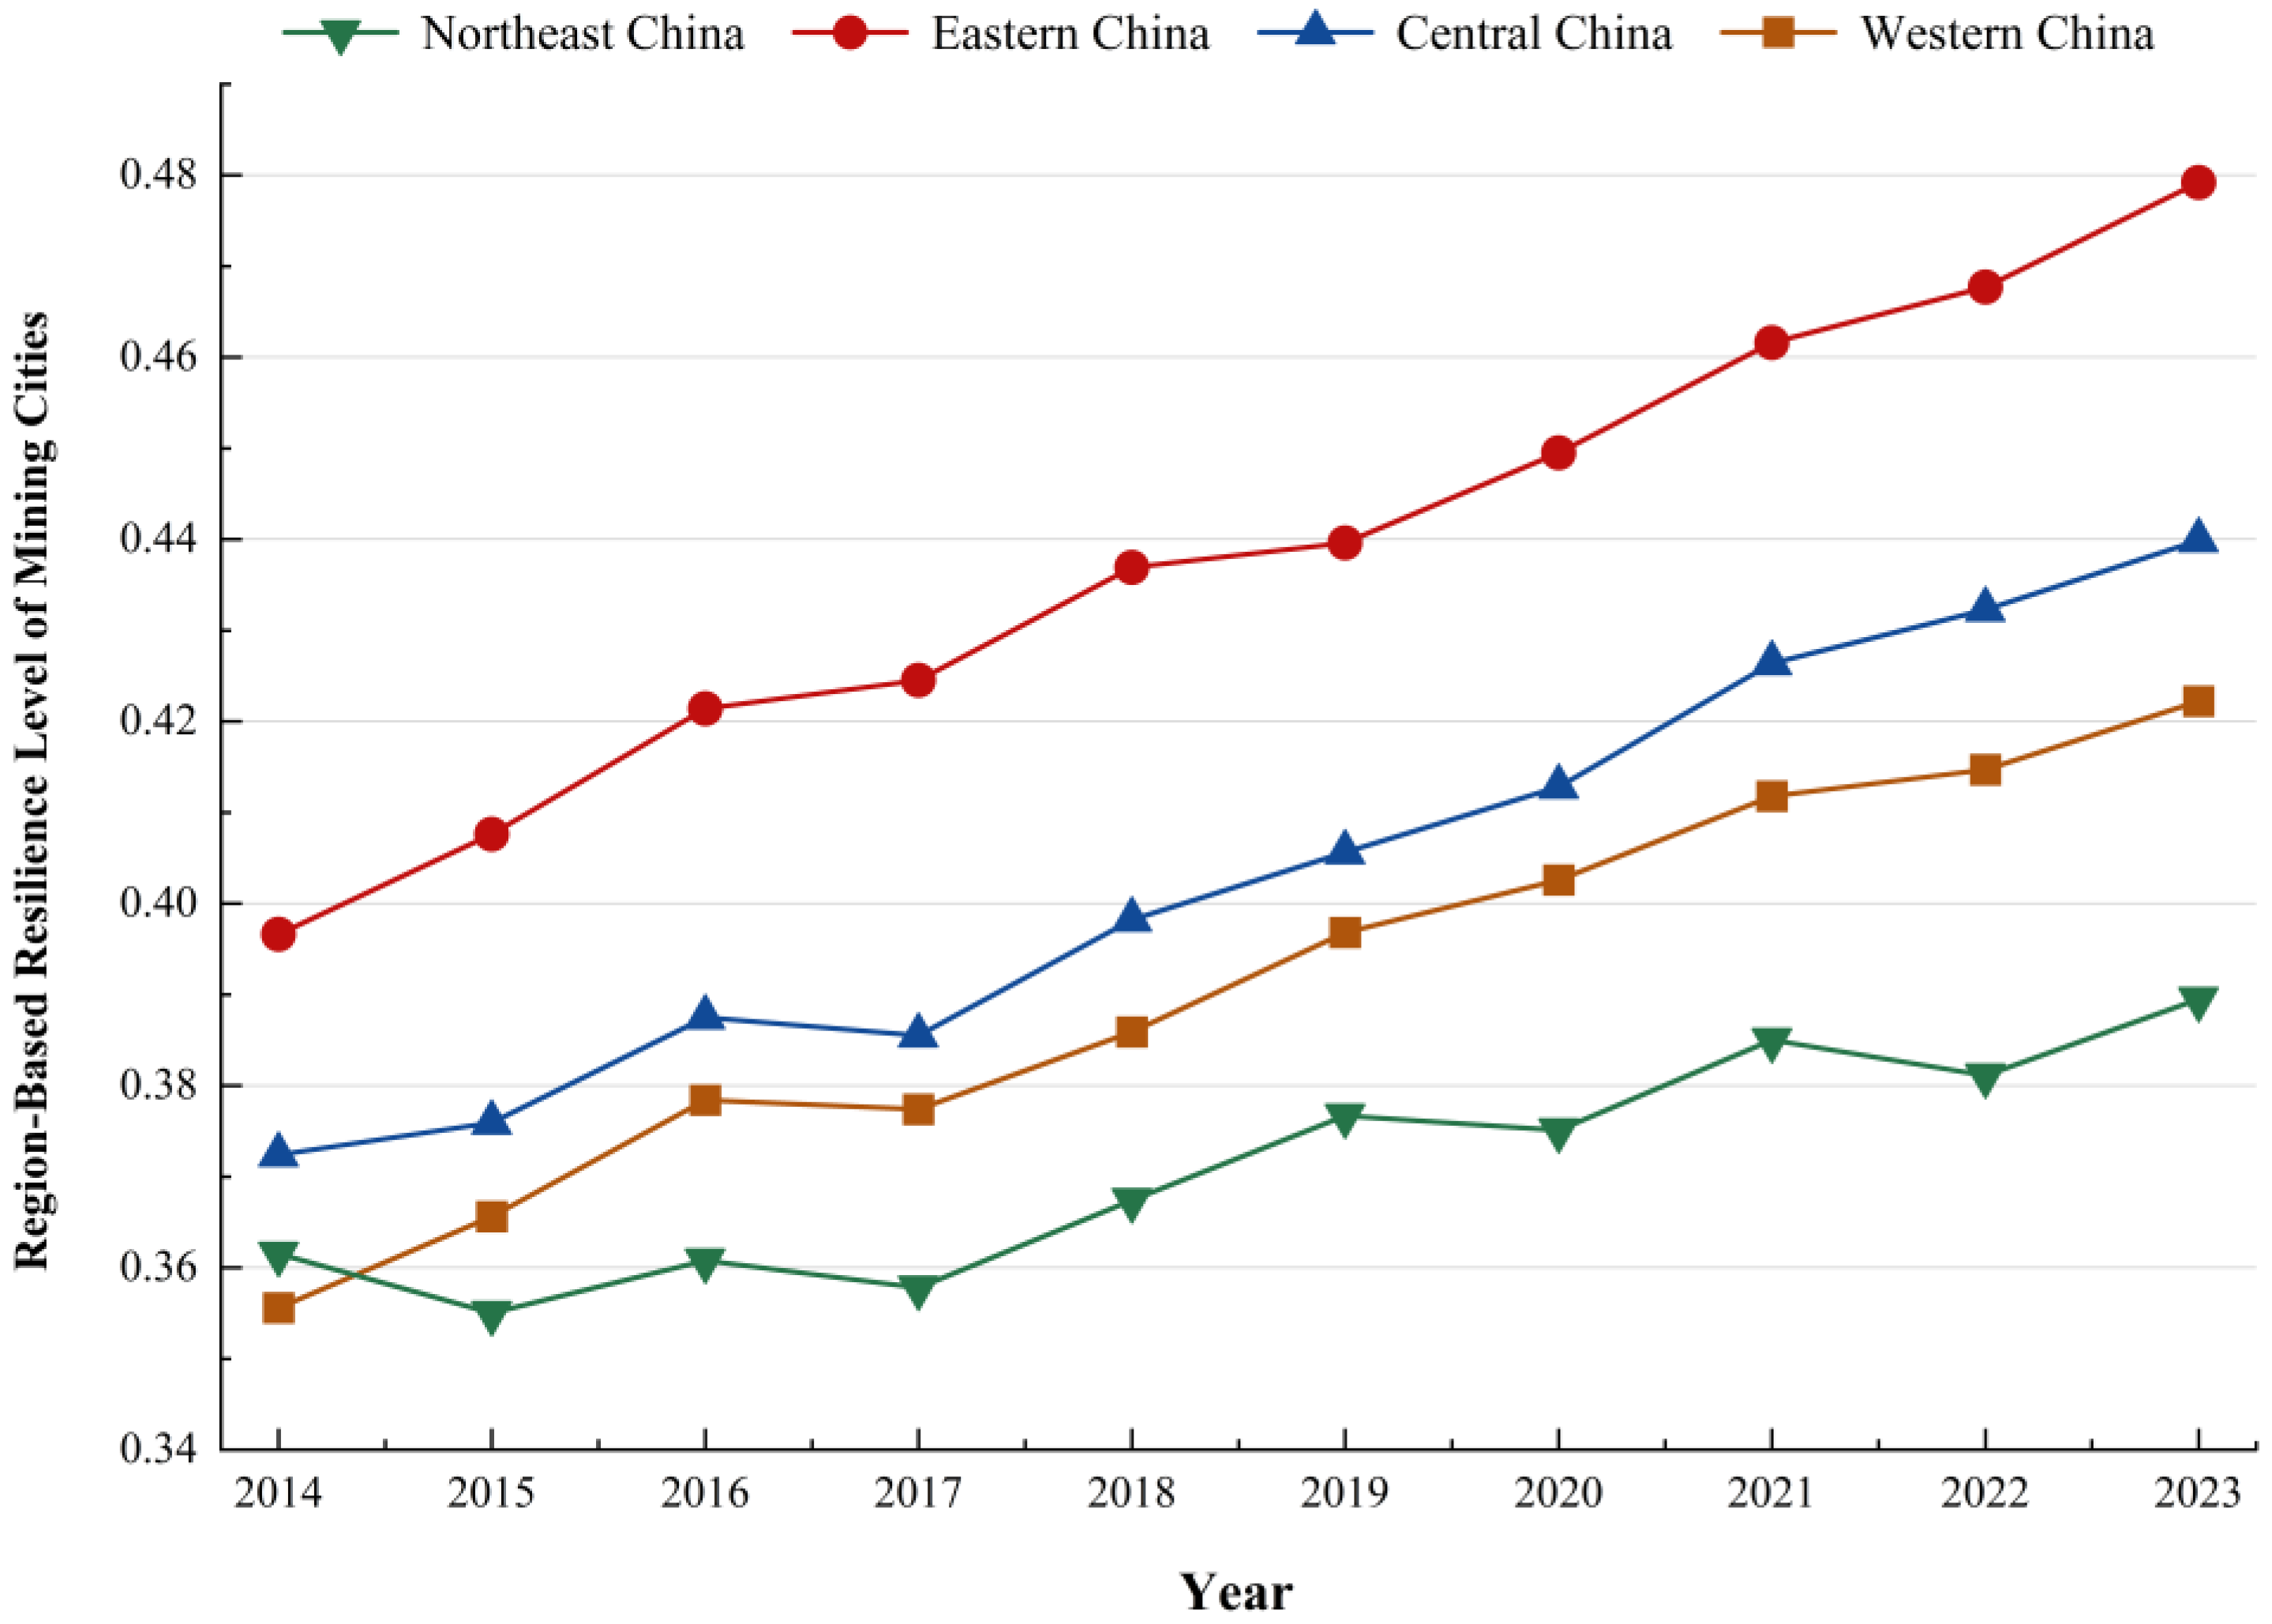
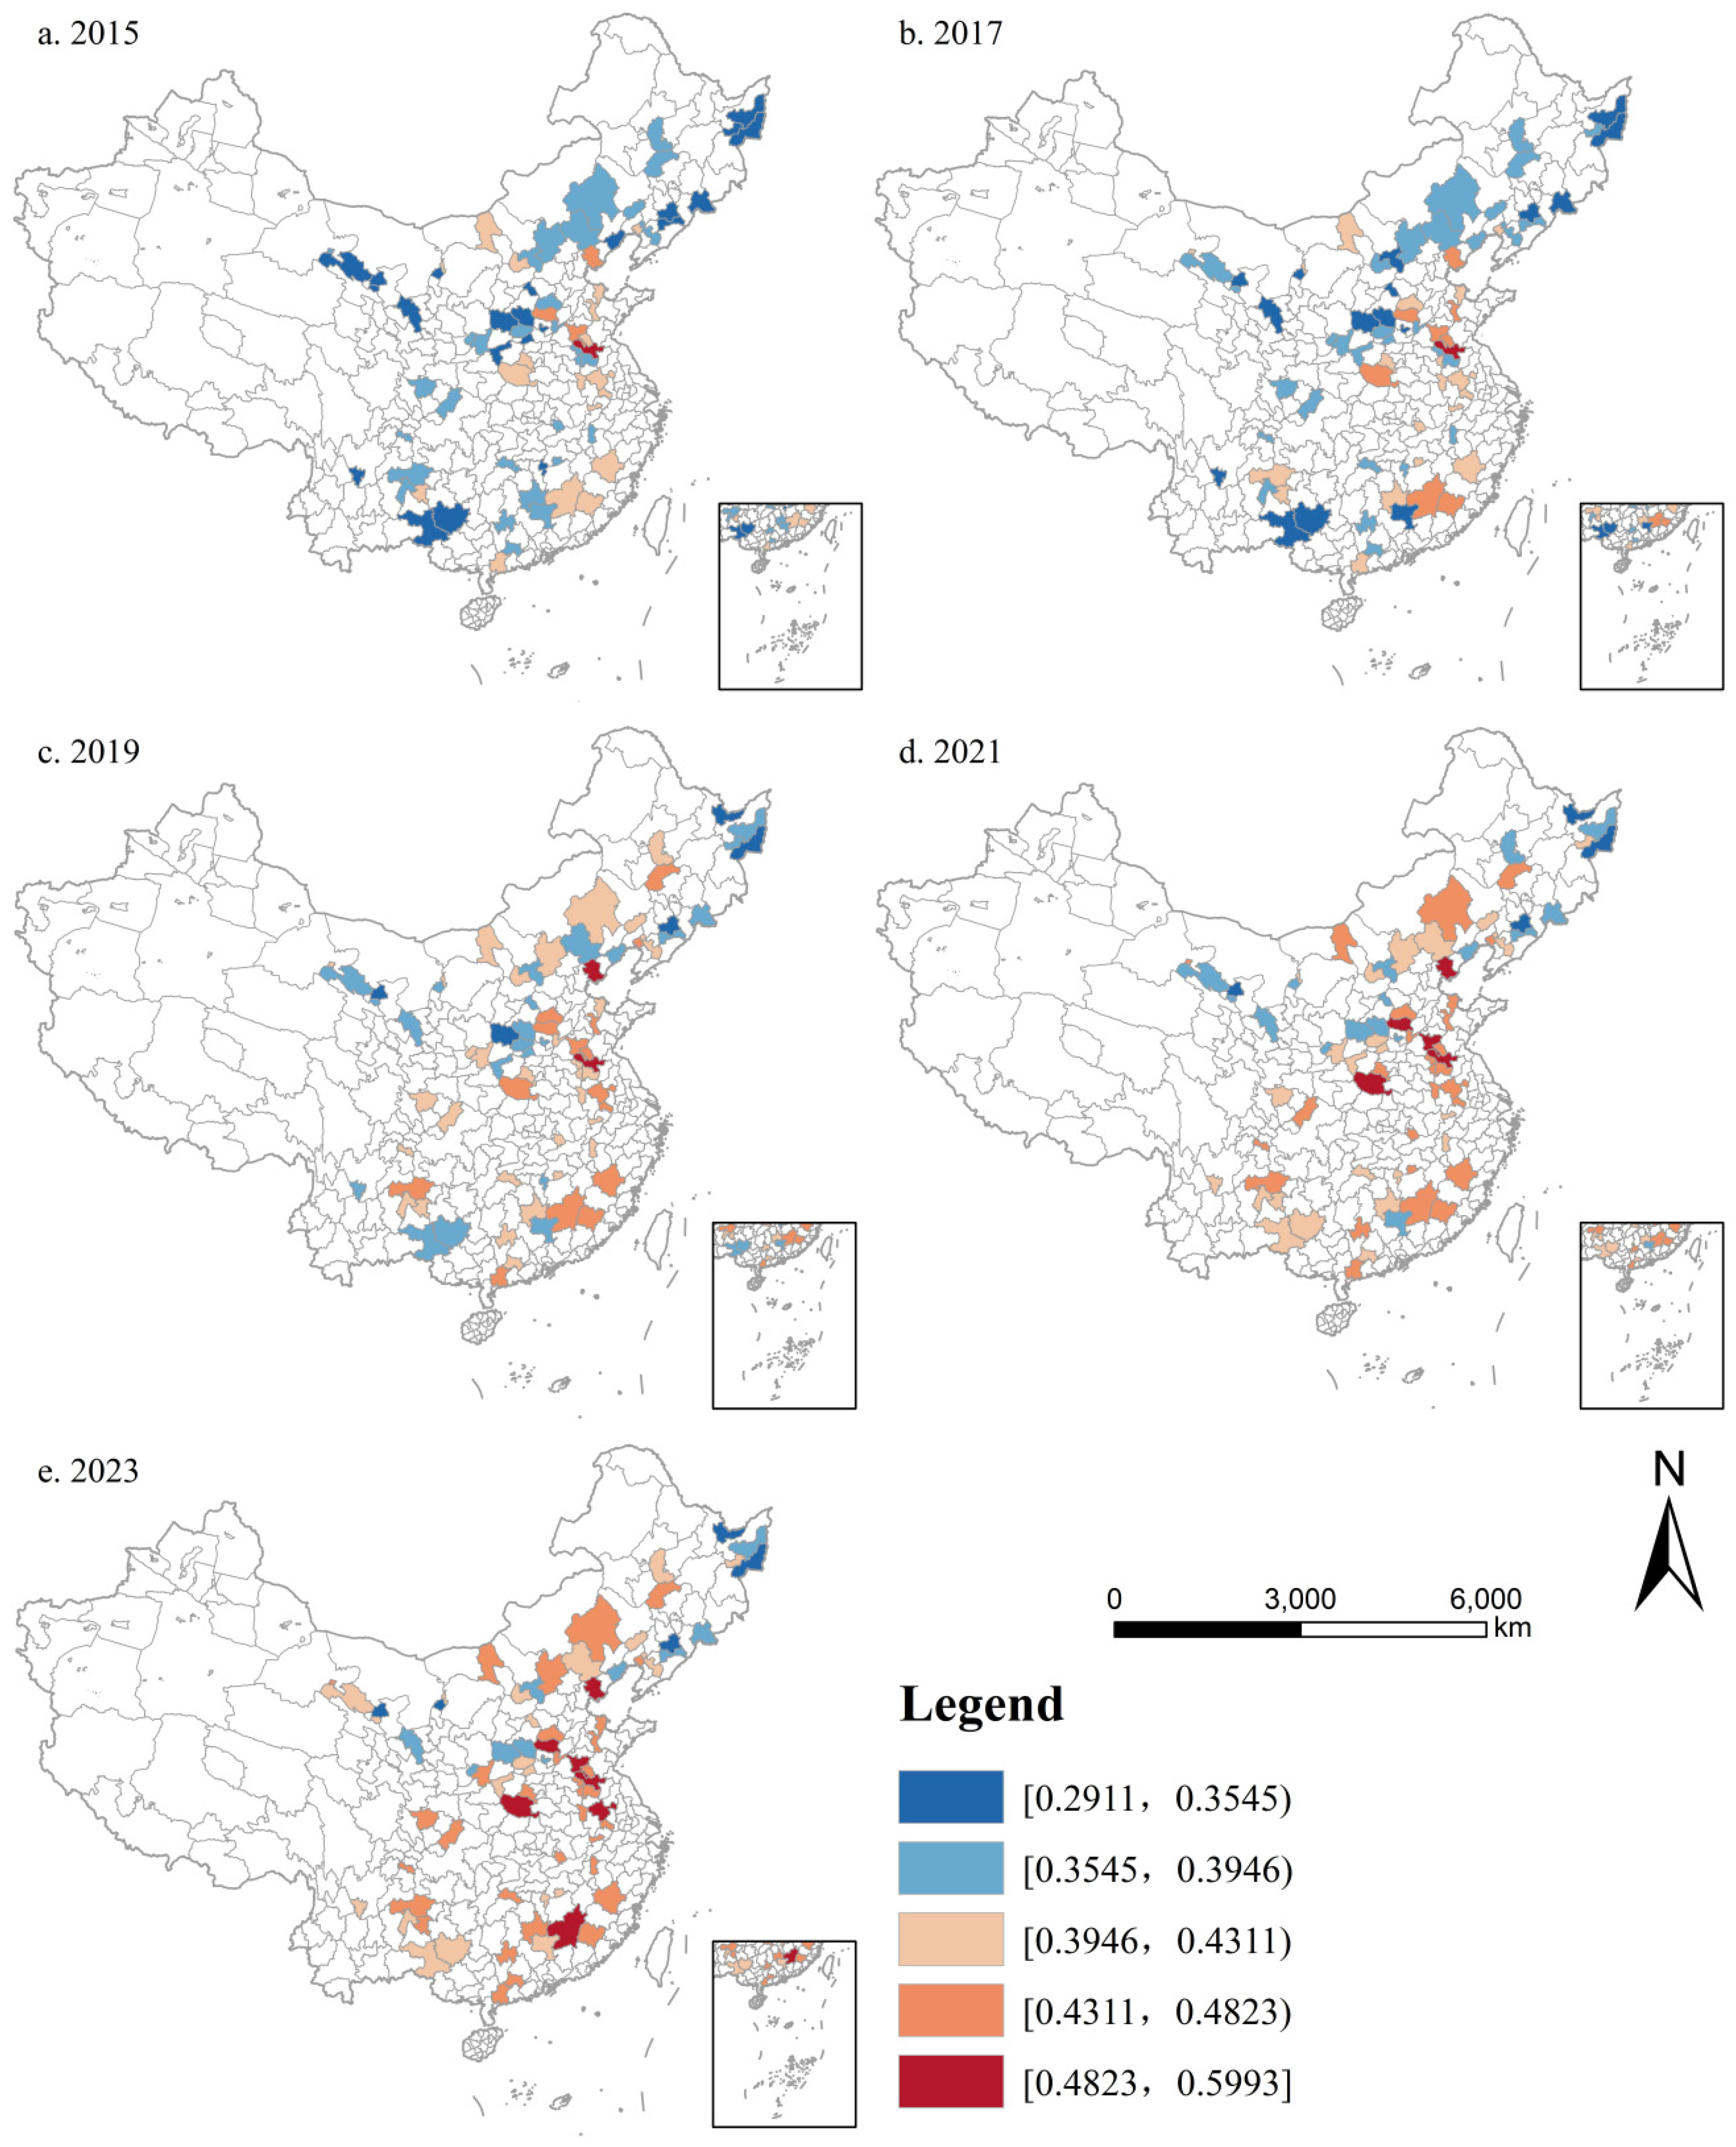
Following the regional classification proposed by Wang Shengyun et al. [73], the 73 mining cities are grouped into four major regions (Eastern, Central, Western, and Northeast China). For each region, the composite urban resilience index is calculated annually over the period 2014–2023, and temporal trends are illustrated accordingly (Figure 5). To further examine spatial differentiation, cross-sectional data for odd-numbered years within the study period are selected. Using the Jenks natural breaks classification method, the resilience levels of mining cities are categorised into five classes: low resilience [0.2911, 0.3545), relatively low resilience [0.3545, 0.3946), medium resilience [0.3946, 0.4311), relatively high resilience [0.4311, 0.4823), and high resilience [0.4823, 0.5993]. Based on this classification scheme, a series of maps is produced to depict the spatiotemporal evolution of resilience levels across the four regions (Figure 6).
Evidence from Figure 5 and Figure 6 indicates that resilience levels in mining cities across China’s four major regions show an overall upward trend during the study period. Mining cities in Eastern China exhibit the most pronounced and sustained increase, with the average resilience level rising from 0.3966 in 2014 to 0.4792 in 2023 (20.93%). By contrast, mining cities in Northeast China follow a slower and more fluctuating upward trajectory, increasing from 0.3615 to 0.3895 over the same period (7.75%). Mining cities in Central and Western China display broadly similar patterns, both characterised by gradual but steady improvements.
From a spatial perspective, high-resilience mining cities progressively expanded from isolated points to belt-like and clustered distributions between 2014 and 2023. These clusters are primarily concentrated in the Beijing–Tianjin–Hebei (BTH) urban region, North China, and the Yangtze River Delta. In contrast, low-resilience areas remain concentrated in parts of the southwestern mountainous region and the old industrial bases of Northeast China, forming a pronounced centre–periphery agglomeration pattern. Moreover, resilience levels display a clear east–west gradient, declining from coastal regions towards the central and western hinterlands. Overall, the evolution of resilience among China’s mining cities is characterised by marked spatial heterogeneity and hierarchical differentiation, manifesting as an “east-strong, west-weak” pattern with pronounced central clustering.
The classification statistics of mining city resilience levels reveal the clear stage-wise progression of urban resilience (Table 4). When examined alongside the spatial distribution patterns, the results indicate that resilience levels improved markedly across most mining cities between 2015 and 2023. Over this period, the number of cities classified as low-resilience declined from 21 to 5, while those in the relatively high-resilience category increased substantially from 3 to 32. Nevertheless, cities reaching the highest resilience level remain limited in number. As of 2023, fewer than ten mining cities fall into the high-resilience category, underscoring that the development of highly resilient and safe cities remains a central objective for mining city transformation.
In 2015, overall resilience among mining cities was relatively low, with more than half of the sample classified as low or relatively low resilience. Only four cities—Tangshan, Handan, Jining, and Xuzhou—were classified as high or relatively high resilience, all located in Eastern China, accounting for 5.48% of the sample. By 2017, the number of low-resilience cities had declined, and these cities were mainly concentrated in Shanxi, Heilongjiang, Guangxi, and Gansu, while Shaoguan remained the only low-resilience city in the eastern region. In 2019, the number of low-resilience cities fell sharply to five, while medium-resilience cities increased to 30 (41.1%). By 2023, the share of cities classified as high or relatively high resilience had risen to 53.42%, whereas the number of low and relatively low resilience cities had decreased to 15 (a reduction of approximately 71.15%). Among the high-resilience cities, six were located in Eastern China, with Nanyang in Henan Province standing out as the only high-resilience city outside the eastern region.

4.2.2. Dynamic Changes in the Spatial Distribution of Resilience Levels

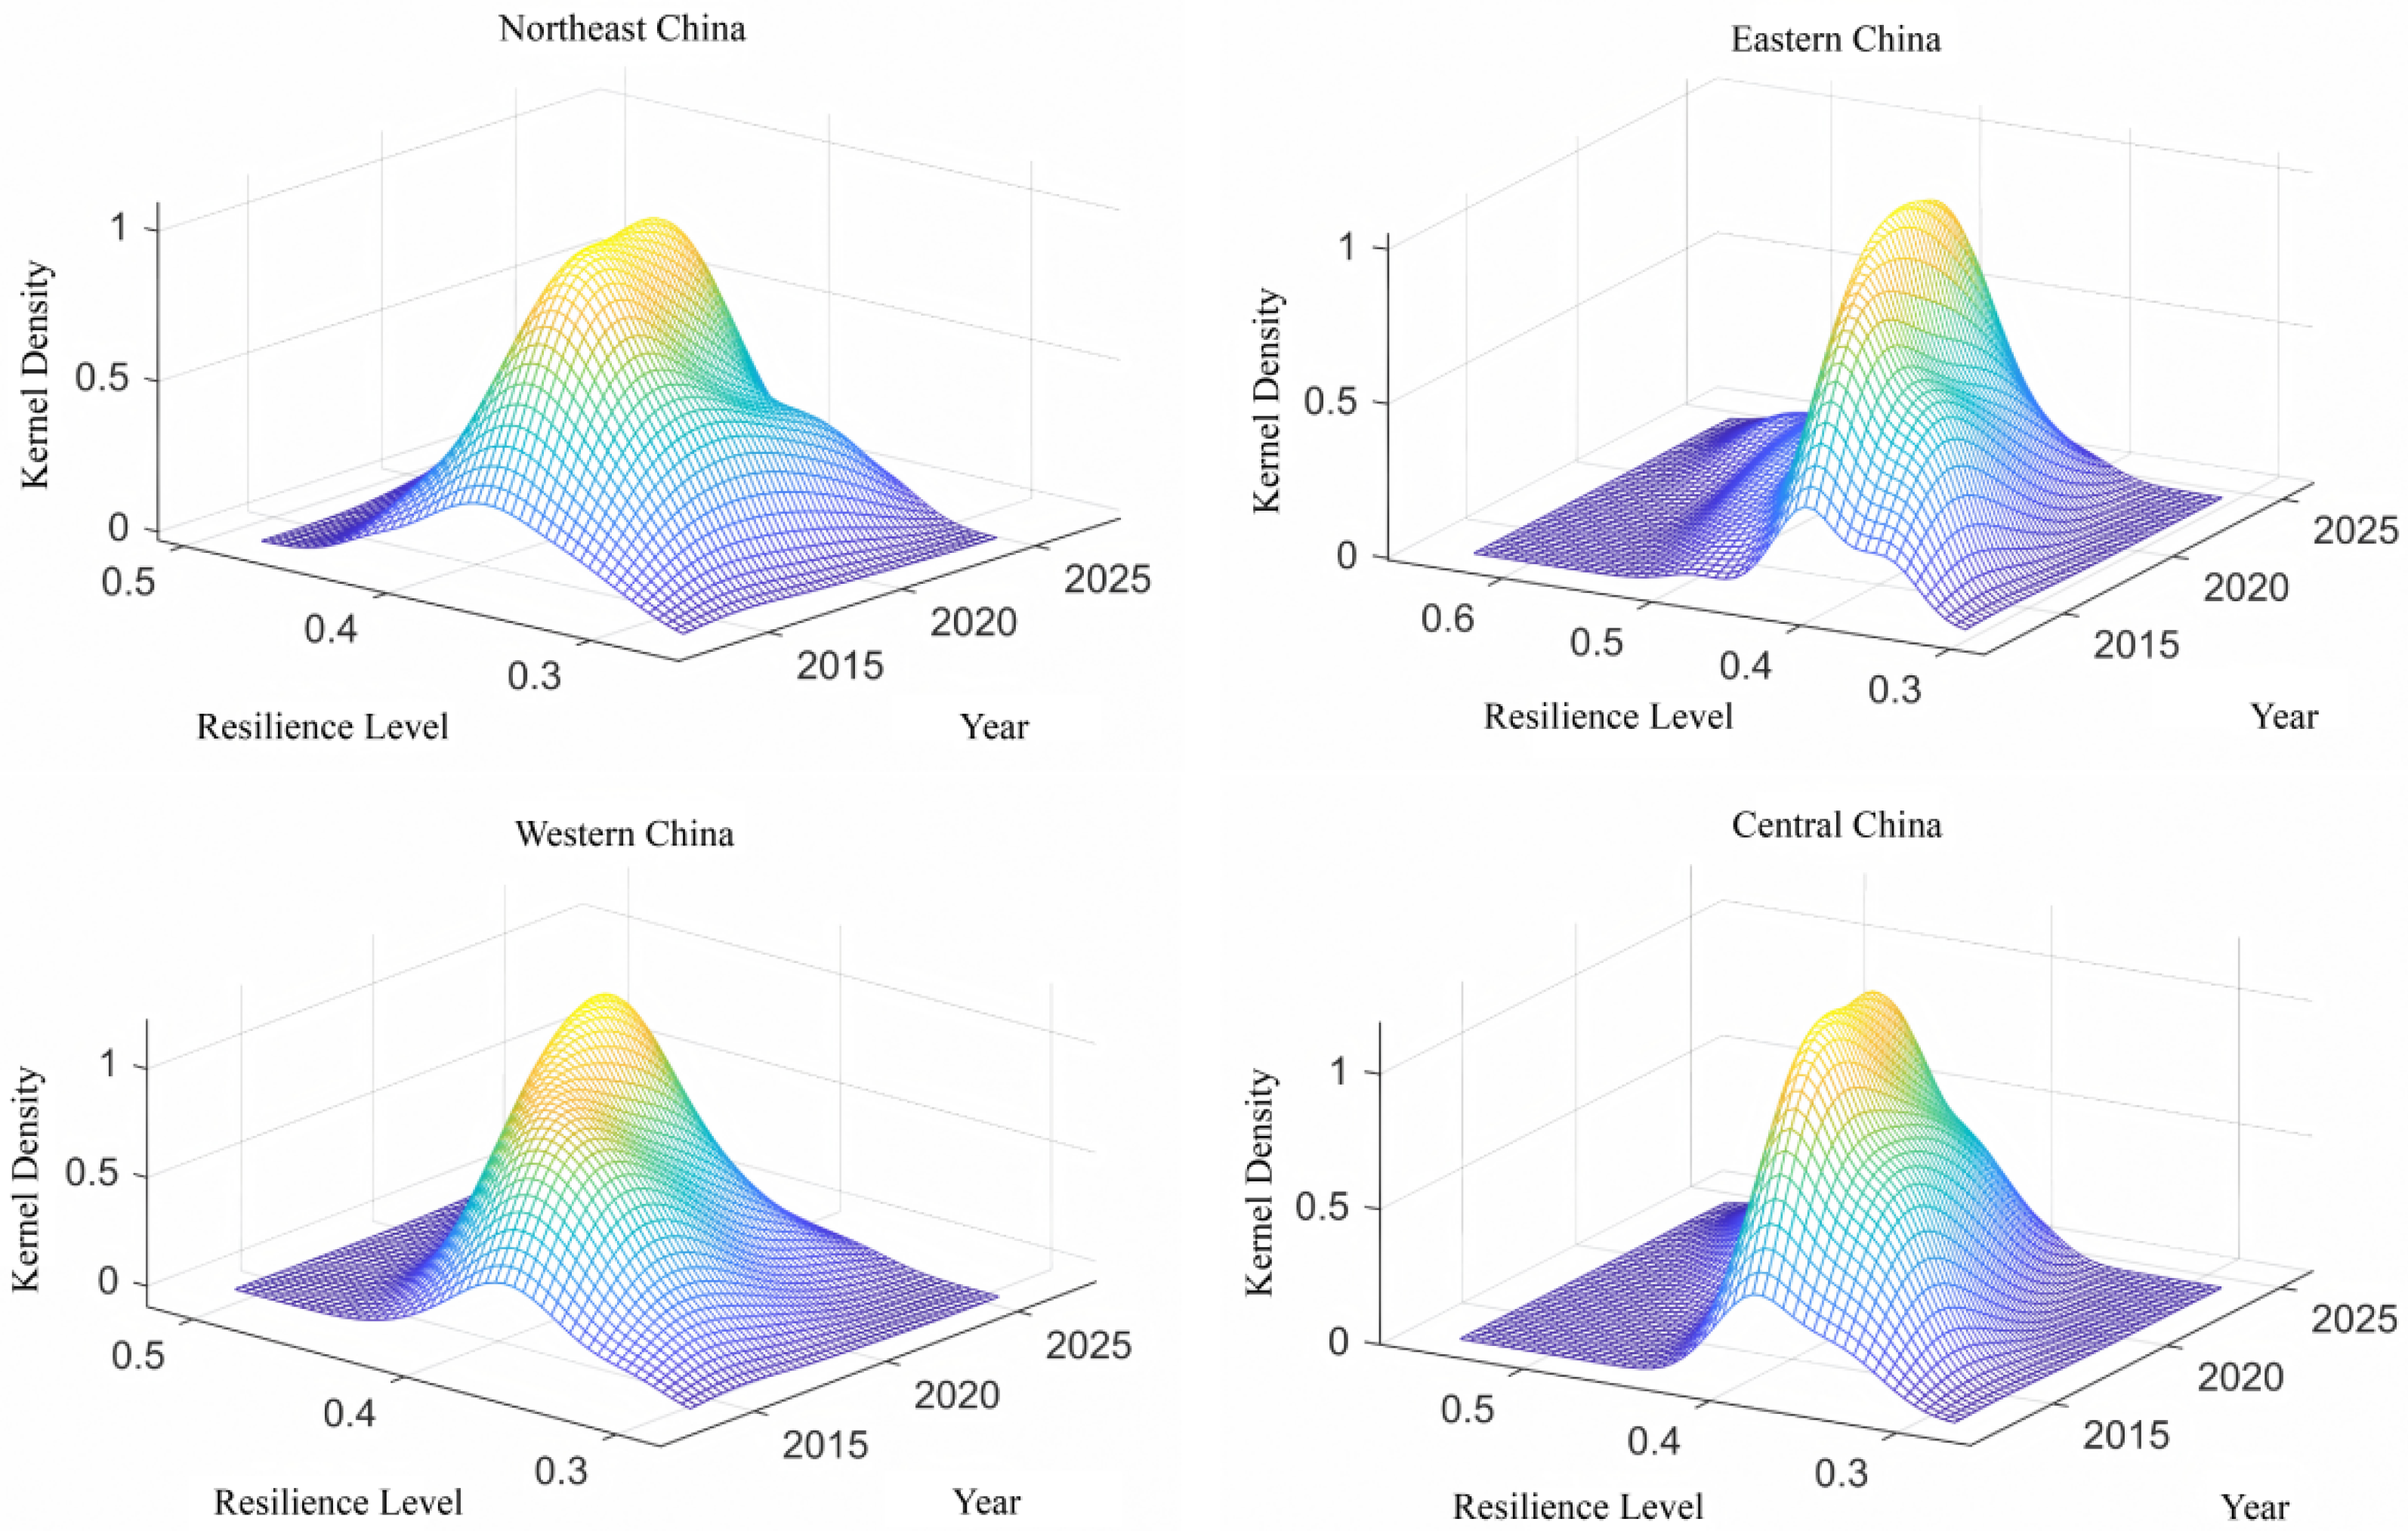
Kernel density estimation is used to further characterise the dynamic distribution of resilience levels in mining cities across China’s four major regions (Figure 7). In general, the dominant peaks of the regional density curves become higher and shift to the right, indicating an overall improvement in resilience between 2014 and 2023, which is consistent with the patterns reported above. In Northeast China, the density curve changes from a single peak to a distribution with a right-side tail and shows signs of developing multiple peaks. This suggests that resilience has increased gradually at the regional level, but the pace of improvement differs across cities, with low-resilience areas remaining. Eastern China exhibits the widest spread and clear two-sided tails, while the high-value tail forms a two-peak configuration. This implies that high-resilience cities have played a leading role in shaping the regional trajectory. At the same time, the right-side tail points to the presence of relatively lagging cities, suggesting discontinuities in resilience development within the eastern region. By comparison, Central and Western China display broadly similar curves, with sharp and narrow main peaks, indicating relatively concentrated resilience levels within each region. Notably, Western China shows a right-side tail, whereas Central China presents a left-side tail. Taken together, this pattern indicates that resilience in Western China remains lower than in Central China, with a larger number of low-resilience cities in the west and a greater concentration of relatively higher-resilience cities in the central region.

4.3. Regional Inequality and Decomposition of Urban Resilience

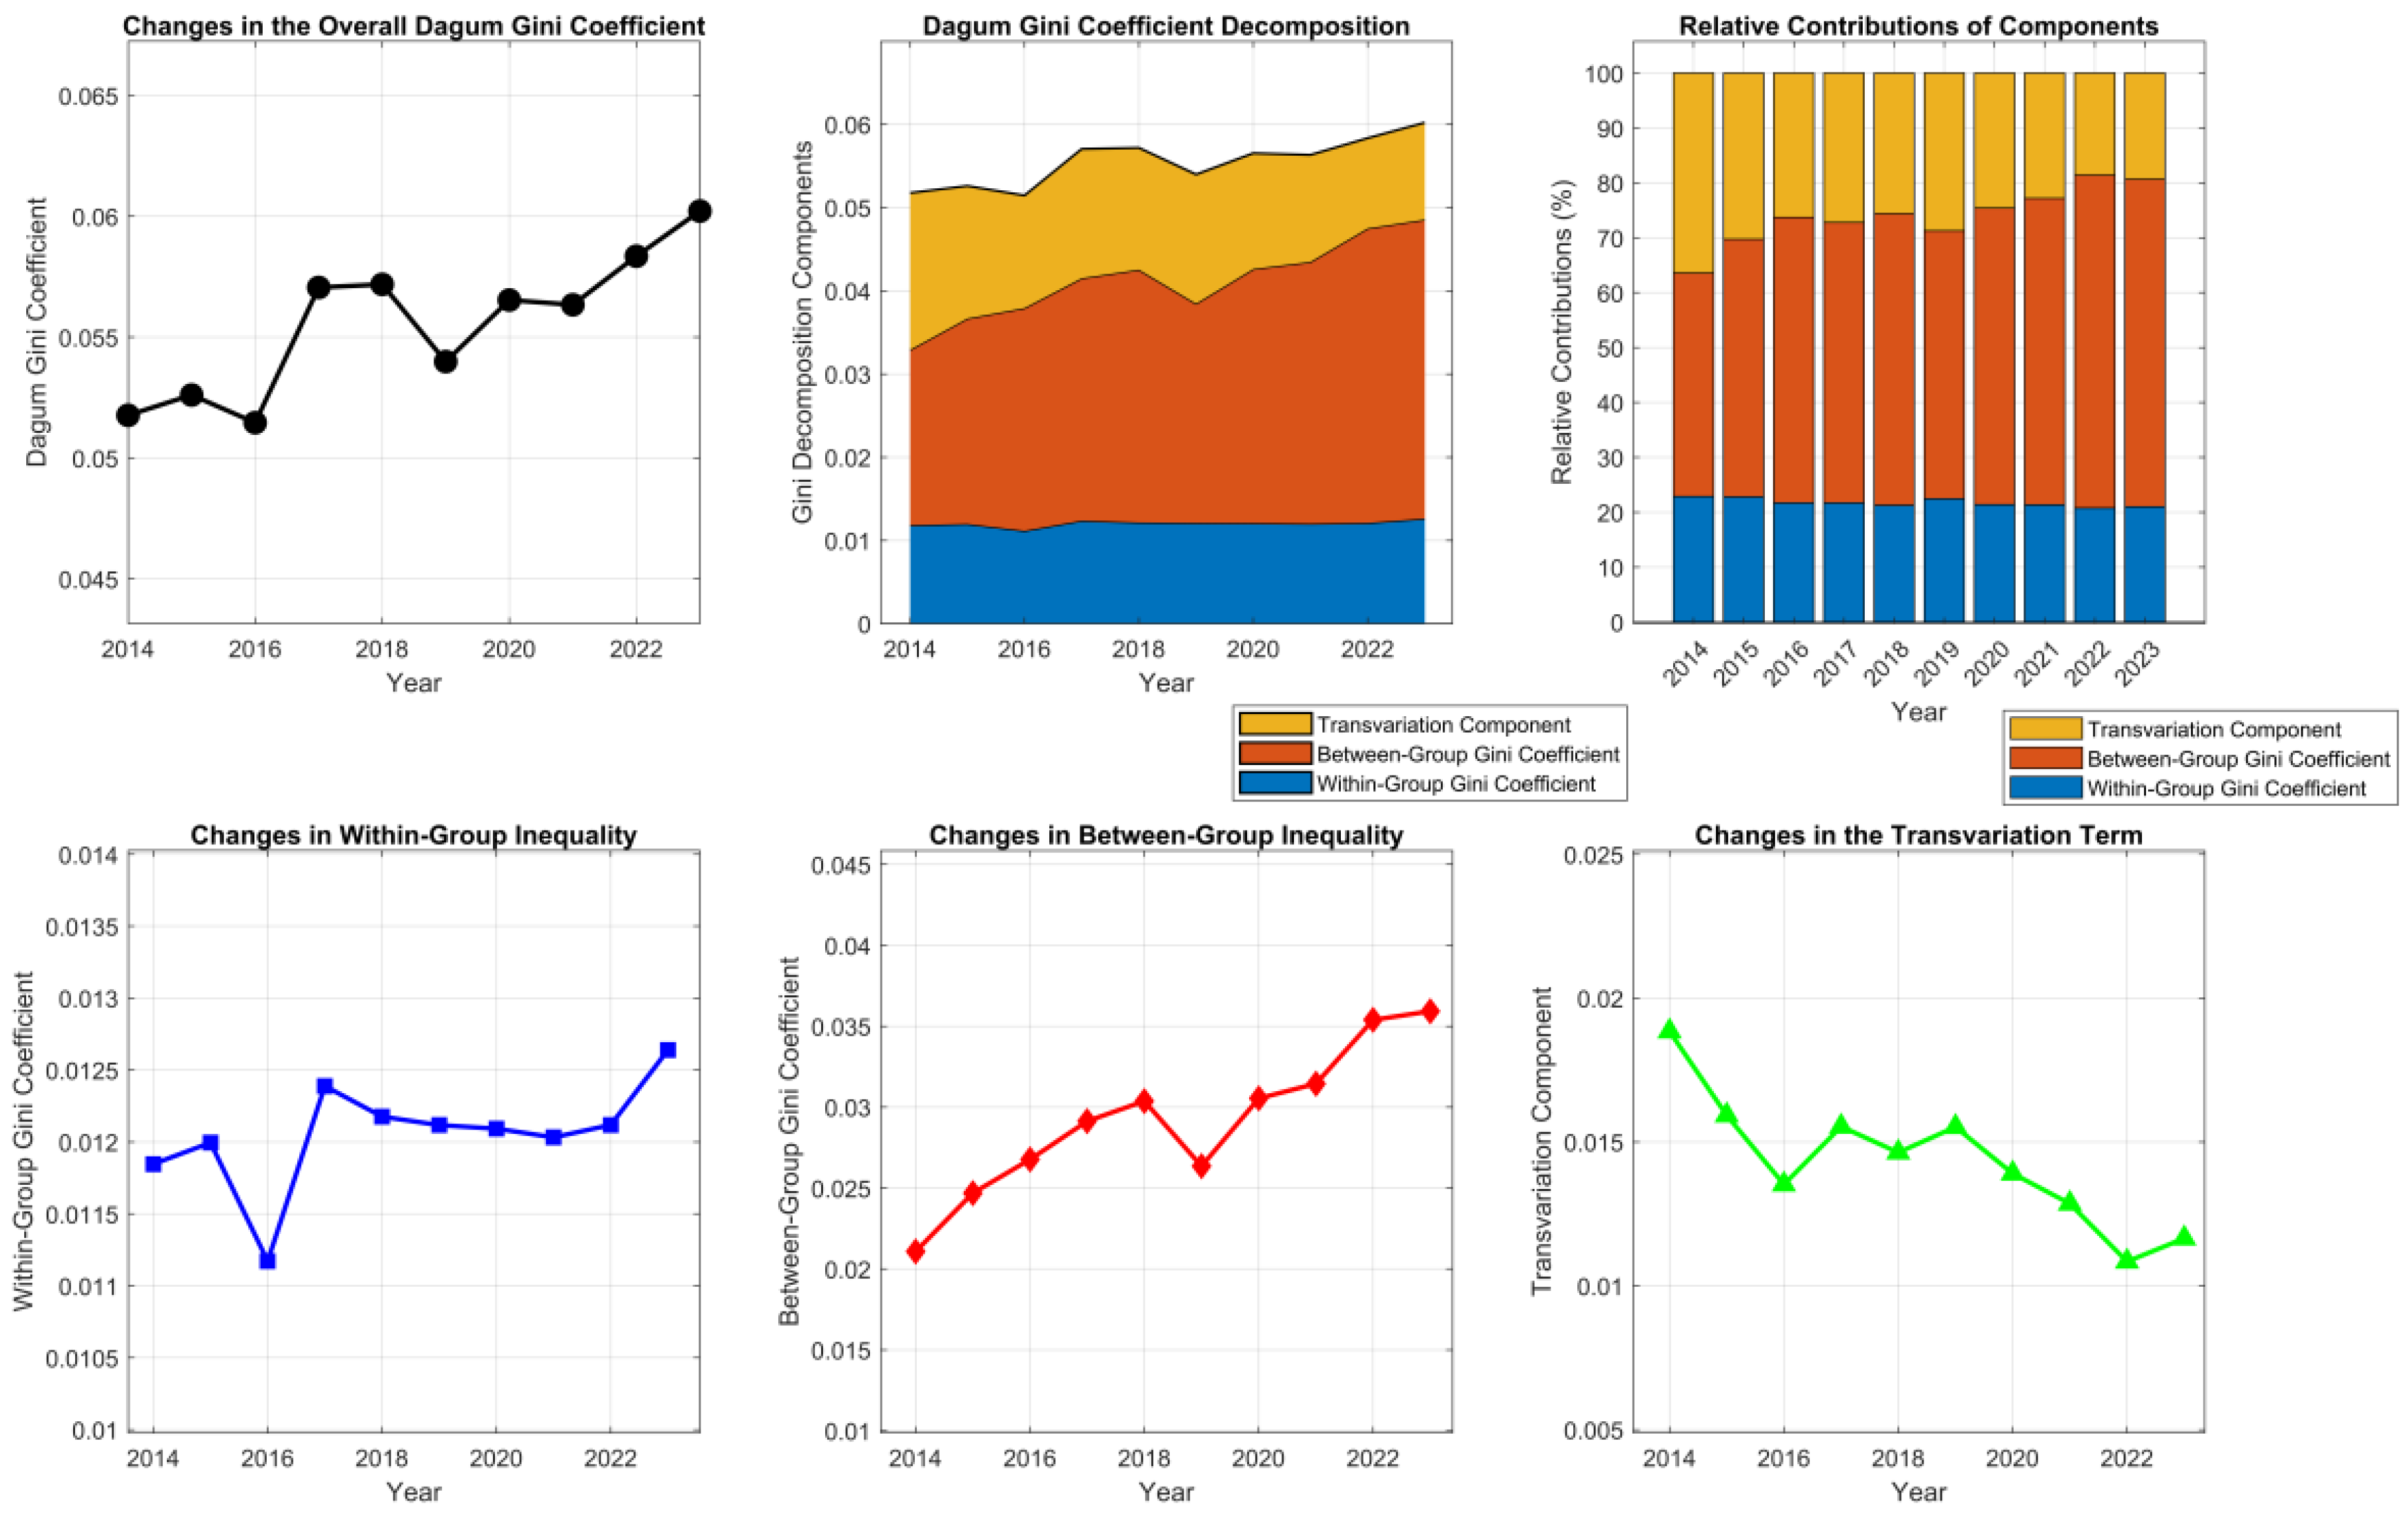
To examine regional disparities in the composite resilience of China’s mining cities and to identify their sources, this study applies the Dagum Gini coefficient and its decomposition. The overall inequality across the four major regions is first estimated and then decomposed into within-region inequality, between-region inequality, and the transvariation component (Figure 8).

4.3.1. Overall Regional Inequality

Based on the overall Dagum Gini coefficient and its contribution rates over the period 2014–2023 (Table 5), the analysis reveals a gradual widening of regional disparities in the comprehensive resilience of China’s mining cities. Specifically, the Dagum Gini coefficient exhibits a fluctuating upward trend, increasing from 0.0518 in 2014 to 0.0602 in 2023. A similar pattern is observed for the conventional Gini coefficient, which rises from 0.0211 to 0.0359 over the same period. The consistent movement of both indices indicates that resilience disparities among the four major regions have progressively intensified.
With respect to within-region inequality, the within-group Gini coefficient remains relatively stable throughout the study period, suggesting limited variation in intra-regional resilience levels and a comparatively coordinated pattern of development. Its contribution to overall inequality declines slightly from 22.88% to 20.99%, indicating that the role of within-region disparities in shaping overall inequality has weakened but remains broadly stable. In contrast, between-region inequality emerges as the dominant source of overall disparity. The between-group Gini coefficient increases steadily from 0.0211 in 2014 to 0.0359 in 2023, representing a rise of approximately 70.14%. Correspondingly, its contribution rate expands markedly from 40.72% to 59.66%, indicating that differences in resilience levels across regions increasingly account for the observed inequality. This pattern reflects the growing divergence in regional resilience trajectories, driven by uneven development processes and persistent structural differences among regions.
Meanwhile, the transvariation component declines from 0.0188 to 0.0116, accompanied by a substantial reduction in its contribution rate. This decrease indicates a diminishing degree of overlap in resilience distributions across regions, implying that regional stratification has become more pronounced and that overall inequality is increasingly explained by clear between-region differences rather than cross-regional convergence.

4.3.2. Within-Region Inequality

The decomposition results for within-region Gini coefficients (Table 6) show clear differences in the internal distribution of resilience across China’s four major regions. Northeast China records relatively high and volatile within-region Gini coefficients throughout the study period. This indicates pronounced and unstable disparities in resilience among mining cities within the Northeast, consistent with uneven adjustment during its transformation as an old industrial base, where inter-city resilience gaps remain substantial and fluctuate over time. In Eastern China, the within-region Gini coefficient rises gradually after minor fluctuations and exceeds that of the Northeast after 2022. This suggests a widening dispersion of resilience levels among mining cities within the region, despite its higher average resilience. The upward trend implies that resilience improvements have not been evenly shared across cities, with leading cities pulling further ahead. By contrast, Central and Western China exhibit relatively stable within-region Gini coefficients, fluctuating within a narrow range over the study period. This stability points to comparatively stronger internal coordination and more balanced resilience development among mining cities in these regions. Overall, the results highlight substantial regional variation in intra-regional inequality patterns.

4.3.3. Between-Region Inequality

The decomposition of the between-region Gini coefficient (Table 7) indicates that the disparity between Northeast and Eastern China exhibits the most pronounced increase, with the corresponding coefficient rising from 0.0670 to 0.1059, representing growth of 58.06%. This pattern suggests a marked intensification of polarisation in the resilience levels of mining cities between the two regions, making this regional pair the primary contributor to overall inter-regional inequality. The result reflects a fundamental spatial tension in China’s regional development, namely the widening gap between the transformation of the Northeast old industrial base and the high-quality, modernised growth trajectory of Eastern China. This divergence constitutes a major challenge for regional coordination. The between-region Gini coefficient between Eastern and Western China shows the second-largest increase, following a gradual upward trend, indicating a steady expansion of resilience disparities between the two regions. By contrast, the coefficient between Central and Western China remains largely stable throughout the study period, suggesting comparable resilience levels, balanced development trajectories, and a relatively high degree of regional coherence. Meanwhile, the Gini coefficient between Northeast and Central China also displays an upward trend, pointing to the gradual emergence of inter-regional differentiation.
Overall, inter-regional disparities in the resilience of mining cities exhibit a spatial configuration characterised by a pronounced “Northeast–East divide” alongside relatively coordinated development between Central and Western China. This pattern highlights the need for region-specific and targeted coordination strategies to address the dominant sources of disparity and to promote more synchronised resilience development across regions.

5. Discussion and Policy Implications

5.1. Discussion

Our findings indicate that the composite resilience of China’s mining cities increased steadily between 2014 and 2023 and can be characterised by distinct stages of progression. This overall upward trajectory aligns with an expanding literature reporting gradual resilience improvements in mining cities and other resource-dependent regions under structural adjustment and policy-driven transitions [74,75]. Importantly, subsystem-level evidence highlights a key nuance: recovery capacity emerges as a major constraint on overall resilience. Although many studies document improvements in composite indices, relatively few explicitly identify which capacity constitutes the principal bottleneck. This pattern is also consistent with evidence from ecological restoration in mining areas, where land occupation and degradation associated with mining can intensify soil erosion, vegetation loss, and ecosystem disruption, thereby weakening urban ecological functions [76]. In this respect, a stage-based framework not only assesses whether resilience improves, but also clarifies the pathways through which improvements occur and the domains in which constraints persist, enhancing the interpretability of resilience assessment.
The analysis further reveals a centre–periphery pattern in the spatial evolution of resilience among mining cities. High-resilience cities shift from isolated points towards belt-like and clustered agglomerations, whereas low-resilience areas persist in parts of inland China and old industrial regions. Notably, mining cities in these old industrial regions are often located in the later stages of the mining life cycle and increasingly exhibit characteristics such as resource depletion and economic decline. This pattern is consistent with long-standing insights from regional studies and economic geography, which suggest that cumulative causation and agglomeration processes tend to concentrate capabilities, investment, and innovation in already advantaged places [77,78]. Similar spatial gradients have also been documented for China’s resource-based cities, where overall resilience and subsystem resilience typically display a pronounced coastal–inland divide [79,80]. This centre–periphery pattern may also be interpreted through differences in mining-activity structures. First, higher labour dependence on mining implies that household incomes and local labour markets are more tightly coupled to mining cycles; adverse shocks can therefore trigger rapid, system-wide employment stress and undermine resistance. Second, greater employment concentration in mining and closely related sectors reduces sectoral redundancy, limiting the city’s capacity to maintain essential functions during disturbances and to redeploy labour afterward. Third, stronger socio-economic reliance on mining can amplify boom–bust dynamics and strengthen institutional and spatial lock-in. Together, these structural features are more likely to characterize late–life-cycle mining cities in old industrial regions, providing a mechanism that links spatial inequality to slower recovery and persistent low-resilience pockets.
The regional-disparity analysis shows that the East exhibits the highest overall resilience, whereas the Northeast records the lowest levels. This pattern likely reflects differences in economic development, industrial structure, and factor mobility. The eastern region—together with major urban agglomerations such as the Beijing–Tianjin–Hebei (Jing-Jin-Ji) region—tends to have a more advanced and diversified economy, which supports more complete industrial chains and provides a more enabling environment for the digital transformation of mining cities [81]. With deepening regional integration, production factors (e.g., capital, technology, and talent) can circulate more efficiently and be allocated more effectively, thereby strengthening resilience and risk-coping capacity. By contrast, in the Northeast and parts of the mountainous Southwest, many cities have long relied on heavy industry, energy, and mining, while the development of emerging technologies remains relatively weak, making transformation pathways more constrained. Moreover, as an old industrial base, the Northeast has experienced substantial out-migration and labour loss. According to China’s Seventh National Population Census, the three northeastern provinces recorded a net population outflow of 8.21 million people. Population decline can reduce market vitality and consumption capacity; coupled with industrial lock-in, this may help explain the comparatively slow growth of resilience in the Northeast and its increasing lag in the overall distribution. For the central and western regions, national policy support and gradual improvements in regional economic development are associated with a steady but moderate increase in the resilience of mining cities.
This study contributes to the literature in three ways. First, it conceptualises mining cities as a distinct type of resource-dependent city, thereby extending evidence beyond the broad and heterogeneous policy category of resource-based cities and providing a more place-specific foundation for understanding resilience building in mining-oriented urban regions. Second, it operationalises resilience through a stage-based framework aligned with the risk-governance cycle, which enables a clearer process-oriented interpretation of resilience change and facilitates the identification of capacity bottlenecks. Combined with ARIMA-based forecasting to 2030, this approach helps shift the discussion from documenting uneven resilience to elucidating its structural drivers and plausible trajectories, strengthening the empirical basis for place-based land governance and differentiated resilience strategies in mining-city transformation. Third, the study introduces a decomposition-based diagnosis of regional inequality that complements conventional level-based or cross-sectional comparisons. Collectively, these contributions move the focus from whether resilience differs across places to how such disparities are structured and where policy interventions are likely to be most effective.
Despite these contributions, several limitations warrant discussion. First, urban resilience measurement is inherently conditioned by indicator selection and aggregation choices. While this study integrates three capacity dimensions—robustness, resistance, and recovery—within a comprehensive framework, alternative conceptualisations may prioritise other functional domains or emphasise different forms of dynamic interaction. Future research could test the sensitivity of empirical results to alternative indicator sets and weighting/aggregation schemes, and incorporate more explicit institutional and governance-related variables. Second, the analysis is confined to mining cities in China, which may limit the transferability of the findings to other national and institutional settings. Future work could extend the framework by examining resilience trajectories of mining cities across countries and regions. Comparative analyses of resource-dependent cities would help clarify how institutional arrangements, development pathways, and governance mechanisms shape resilience dynamics, thereby contributing to broader discussions of uneven development, regional transition, and the resilience of extractive-based urban systems.

5.2. Policy Implications

This study investigates the evolution and regional differentiation of resilience in China’s mining cities, with the aim of informing resilience-building practice and supporting more coordinated regional development. Drawing on the empirical findings and the specific conditions of mining cities in China, several policy-relevant suggestions are proposed:
  • Prioritise the strengthening of recovery and resistance capacities to accelerate resilience improvement. The results indicate that relatively weak recovery capacity is a major constraint on composite resilience, and that resistance capacity has also become increasingly binding after 2020. This points to the need for greater investment in emergency management, economic stabilisation and restructuring, environmental protection, social welfare, and health services. In particular, emergency management could be enhanced through more systematic contingency planning and regular drills to improve preparedness and response to sudden events. Environmental measures could focus on tighter regulation of resource extraction, pollution control, and ecological restoration, thereby improving ecosystem stability and recovery capacity.
  • Adopt differentiated, region-specific approaches to enhance regional resilience. In Northeast China, stronger policy support may be needed to facilitate the transformation of the old industrial base, for example by steering resources towards emerging and high-technology industries and establishing dedicated industrial funds to support relevant firms. In Eastern China, where resilience is relatively high but intra-regional gaps are widening, greater emphasis could be placed on coordination among mining cities, enabling high-resilience cities to support lagging ones, strengthening spatial planning and governance, and reducing risks of homogeneous competition. For Central and Western China, consolidating recent gains may require sustained infrastructure investment to improve urban carrying capacity and shock tolerance, alongside stronger support for innovation and industrial upgrading.
  • Promoting inter-regional coordination appears critical for narrowing resilience gaps and strengthening resilience in China’s mining cities. This may include deepening cross-regional industrial collaboration and relocation, building inter-regional value chains to improve the allocation of industrial resources and realise complementarities, and strengthening inter-regional cooperation in human-capital development through joint talent attraction and sharing programmes. At the national level, stronger policy guidance and support could be provided through more integrated regional development planning that clarifies functional positioning and development objectives.

6. Conclusions

This study examines urban resilience across 73 mining cities in China by constructing a composite evaluation framework with 30 indicators capturing three capacities: robustness, resistance, and recovery. Using ARIMA forecasting, kernel density estimation, and Gini-based inequality measures, it analyses the spatiotemporal evolution and regional disparities of mining-city resilience over 2014–2023. Three main findings emerge. First, the overall resilience level shows a steady upward trajectory, progressing through three stages: stability–adaptation, adaptation–recovery, and recovery–enhancement. Spatially, resilience evolves towards a centre–periphery configuration characterised by an east–west gradient and core agglomeration. Among the three capacities, robustness contributes most to overall resilience, whereas recovery remains comparatively weak, indicating that strengthening post-shock recovery is pivotal for further improvement. The seven-step-ahead forecasts to 2030 suggest that resilience is likely to continue increasing. Second, pronounced regional disparities persist. Between-region differences constitute the main source of overall inequality. Eastern China consistently records the highest resilience levels, followed by Central China; Western China remains close to the central region, while Northeast China lags behind. Within-region inequality is highest in the East, followed by the Northeast, Central, and West, yielding a pattern marked by a Northeast–East divide, alongside relatively coordinated development between Central and Western China. Third, these disparities reflect the combined influence of multiple structural factors. The eastern region benefits from favourable location, higher levels of marketisation, stronger fiscal capacity, and earlier industrial diversification, which together facilitate talent agglomeration and digital transformation. Central China has achieved enhanced resilience through industrial transfer and its intermediary position between eastern and western regions. In contrast, western mining cities face constraints associated with geographical remoteness, ecological fragility, and infrastructure deficits, while Northeast China continues to experience path dependence on resource-based heavy industry, institutional rigidity, and sustained population outflows, all of which slow resilience improvement.

Author Contributions

Conceptualization, Q.L. and H.W.; methodology, H.W. and D.Z.; formal analysis, H.W. and J.Y.; writing—original draft preparation, H.W.; writing—review and editing, Q.L., D.Z. and X.H.; supervision, Q.L. and D.Z.; funding acquisition, Q.L. All authors have read and agreed to the published version of the manuscript.

Funding

The research was supported by the Art Studies Project of the National Social Science Fund of China [grant number 19BG133].

Data Availability Statement

The data presented in this study are available on request from the corresponding author.

Conflicts of Interest

The authors declare no conflicts of interest.

References

  1. Li, H.; Zou, Q. Environmental regulations, resource endowments and urbanindustry transformation: Comparative analysis of resource-based and non-resource-based cities. Econ. Res. J. 2018, 53, 182–198. [Google Scholar]
  2. Yu, J.; Li, J.; Zhang, W. Identification and classification of resource-based cities in China. J. Geogr. Sci. 2019, 29, 1300–1314. [Google Scholar] [CrossRef]
  3. Yang, R.; Fan, X.; Peng, J.; Cao, J.; Li, L.; Feng, T. A Study on the Decoupling Effect Between Economic Development Level and Carbon Dioxide Emissions: An Empirical Analysis Based on Mineral Resource-Based Cities in Southwest China. Sustainability 2024, 16, 10081. [Google Scholar] [CrossRef]
  4. Auty, R. Sustaining Development in Mineral Economies: The Resource Curse Thesis; Routledge: London, UK, 2002. [Google Scholar]
  5. Zhang, X.S.; Chen, X.Y. On the present situation, predicament and countermeasures of industrial development in resource-based cities of China. Econ. Rev. 2001, 6, 96–99. [Google Scholar]
  6. Lovra, É.; Sarihan, E. The formation and preservation of urban heritage through urban landscape transformation: A case study of pittsburgh. Land 2024, 13, 1816. [Google Scholar] [CrossRef]
  7. Yuan, D.; Dong, J. Research on ecological restoration and its impact on society in coal resource-based areas: Lessons from the Ruhr area in Germany and the Liulin area in China. Geoforum 2024, 154, 104038. [Google Scholar] [CrossRef]
  8. Destek, G.; Hossain, M.R.; Aydın, S.; Destek, M.A. Can the resource curse be reversed through financialization, human capital, and institutional quality? Evidence from Sustainable Development Index. Resour. Policy 2023, 86, 104245. [Google Scholar] [CrossRef]
  9. Bjorvatn, K.; Farzanegan, M.R. Demographic transition in resource rich countries: A blessing or a curse? World Dev. 2013, 45, 337–351. [Google Scholar] [CrossRef]
  10. Chen, Z.; Awan, U.; Nassani, A.A.; Al-Aiban, K.M.; Zaman, K. Enhancing sustainable growth in the global south: The role of mineral resource management, supply chain efficiency, technology advancement, and local downstream processing. Resour. Policy 2025, 100, 105451. [Google Scholar] [CrossRef]
  11. Liu, L.; Adebayo, T.S.; Hu, J.; Irfan, M.; Abbas, S.J.E.E. Exploring resource blessing hypothesis within the coffin of technological innovation and economic risk: Evidence from wavelet quantile regression. Energy Econ. 2024, 137, 107802. [Google Scholar] [CrossRef]
  12. Holling, C.S. Resilience and stability of ecological systems. Ann. Rev. Ecol. Syst. 1973, 4, 1–23. [Google Scholar] [CrossRef]
  13. Liao, Q.P.; Wei, H.; Hu, S.G.; Chen, Q.H.; Fan, Y.L. Evolution logic and theoretical exploration of territorial spatal resilience planning-Pathinnovation from emergency response to dynamic adaptation. Saf. Environ. Eng. 2025, 32, 38. [Google Scholar]
  14. Woodall, B.; Amekudzi-Kennedy, A.; Inchauste, M.O.; Sundararajan, S.; Medina, A.; Smith, S.; Popp, K. Institutional resilience and disaster governance: How countries respond to Black Swan events. Prog. Disaster Sci. 2024, 22, 100329. [Google Scholar] [CrossRef]
  15. Zhu, Z.W.; Liu, Y.; Yang, Y. Resilient governance: Practice and exploration of urban resilience building in China. Public Adm. Policy Rev. 2021, 10, 22–31. [Google Scholar]
  16. Yang, M.; Wang, J.; Jing, Z.; Liu, B.; Niu, H. Evaluation and regulation of resource-based city resilience: Evidence from Shanxi Province, China. Int. J. Disaster Risk Reduct. 2022, 81, 103256. [Google Scholar] [CrossRef]
  17. Liu, Y.P. Urban resilience system development measurement: Based on an empirical study of 288 Chinese Cities. Urban Dev. Stud. 2021, 28, 93–100. [Google Scholar]
  18. Zahng, K.; Chen, Q. Analysis on regional differences and influencing factors of urban economic resilience in China. Cuizhou Soc. Sci. 2022, 12, 121–129. [Google Scholar] [CrossRef]
  19. Gong, C.J.; Zhang, X.Q.; Xu, C.L. Study on the spatial-temporal evolution and collaborative improvement of economic resilience of three major urban agglomerations in China. Soft Sci. 2022, 36, 38–46. [Google Scholar]
  20. Tang, Y.; Song, Y.Y.; Xue, D.Q.; Dong, C.Y. Spatio-temporal evolution of economic resilience of resource—Based cities in Shanxi province and its obstacles. J. Arid Land Resour. Environ. 2022, 36, 53–61. [Google Scholar]
  21. Bai, L.M.; Xiu, C.L.; Feng, X.H.; Mei, D.W.; Wei, Y. A comprehensive assessment of urban resilience and its spatial differentiation in China. World Reg. Stud. 2019, 28, 77–87. [Google Scholar]
  22. Peng, X.; Lin, Y.Z.; Gu, C.L. Evaluation and optimization strategy of city network structuralresilience in the middle reaches of Yangtze River. Geogr. Res. 2018, 37, 1193–1207. [Google Scholar]
  23. Sun, Y.N.; You, X.T. On the basic form of contemporary body production. Nanjing J. Soc. Sci. 2021, 48, 31–40. [Google Scholar]
  24. Jiang, H.N.; Zheng, S.T.; Yang, Q.; Jiang, D.R.; Yu, J.H. Change of human settlement resilience and its obstacle degree in resource-based cities in the Yellow River Basin. Resour. Sci. 2024, 46, 2047–2063. [Google Scholar]
  25. Tang, Y.; Wang, Y.S. Impact of digital economy on ecological resilience of resource-based cities: Spatial spillover and mechanism. Environ. Sci. Pollut. Res. 2023, 30, 41299–41318. [Google Scholar] [CrossRef]
  26. Tan, J.; Hu, X.; Hassink, R.; Ni, J. Industrial structure or agency: What affects regional economic resilience? Evidence from resource-based cities in China. Cities 2020, 106, 102906. [Google Scholar] [CrossRef]
  27. Sun, Y.; Zhang, L.C.; Yao, S.M. Evaluating resilience of prefecture cities in the Yangtze River deltaregion from a socio ecological perspective. China Popul. Resour. Environ. 2017, 27, 151–158. [Google Scholar]
  28. Sun, J.; Zhai, N.; Mu, H.; Miao, J.; Li, W.; Li, M. Assessment of urban resilience and subsystem coupling coordination in the Beijing-Tianjin-Hebei urban agglomeration. Sustain. Cities Soc. 2024, 100, 105058. [Google Scholar] [CrossRef]
  29. Zhang, R.; Jiang, A.; Jiang, L. Exposure-Sensitivity-Adaptability (ESA) framework based evaluation and characteristics analysis of urban disasters vulnerability in China. Ecol. Indic. 2025, 176, 113662. [Google Scholar] [CrossRef]
  30. Tan, J.T.; Zhang, P.Y.; Lo, K.; Li, J.; Liu, S.W. Conceptualizing and Measuring Economic Resilience of Resource-based Cities: Case Study of Northeast China. Chin. Geogr. Sci. 2017, 27, 471–481. [Google Scholar] [CrossRef]
  31. Li, Q.Y.; Wang, G. Study on the characteristics and driving factors of spatial and temporal divergenceof ecological resilience in resource-based cities in China. Coal Econ. Res. 2024, 44, 66–78. [Google Scholar]
  32. Liu, Y.B.; Guo, Y.; Xiao, X.D.; Fu, R.Y. Classification of economic transformation capability of resource—Based citiesand transformation rule from the perspective of resilience. J. Arid Land Resour. Environ. 2023, 37, 48–56. [Google Scholar]
  33. Peng, R.X.; Tao, L.; Cao, G.Z. Spatial pattern of urban economic resilience in eastern coastal China and industrial explanation. Geogr. Res. 2021, 40, 1732–1748. [Google Scholar]
  34. Liu, L.N.; Lei, Y.L. Research on the Resilience Changes and Influencing Factors of China’s Provincial Capital Cities. J. Arid Land Resour. Environ. 2022, 35, 1–5. [Google Scholar] [CrossRef]
  35. He, M.; Xiao, W.; Zhao, L.; Xu, Y. Spatiotemporal evolution pattern and heterogeneity of resource-based city resilience in China. Struct. Change Econ. Dyn. 2024, 71, 417–429. [Google Scholar] [CrossRef]
  36. Lu, M.; Tan, Z.; Yuan, C.; Dong, Y.; Dong, W. Resilience Measurements and Dynamics of Resource-Based Cities in Heilongjiang Province, China. Land 2023, 12, 302. [Google Scholar] [CrossRef]
  37. Grafton, R.Q.; Doyen, L.; Béné, C.; Borgomeo, E.; Brooks, K.; Chu, L.; Cumming, G.S.; Dixon, J.; Dovers, S.; Garrick, D.; et al. Realizing resilience for decision-making. Nat. Sustain. 2019, 2, 907–913. [Google Scholar] [CrossRef]
  38. Deng, J.; Zhang, R.; Chen, S.; Li, Z.; Gao, L.; Li, Y.; Wei, C. Spatiotemporal evolution and influencing factors of flood resilience in Beibu Gulf Urban Agglomeration. Int. J. Disaster Risk Reduct. 2024, 114, 104905. [Google Scholar] [CrossRef]
  39. Liu, J.; Wang, J.; Chen, T.; Wang, L. Heat stress resilience assessment of urban form from physical space dimension: A case study of Guangdong-Hong Kong-Macao Greater Bay Area. Urban Clim. 2024, 55, 101905. [Google Scholar] [CrossRef]
  40. Jin, Y.; Liu, Y.; Zhou, G.; Sun, H.; Wu, H. How does urban shrinkage influence urban resilience? Empirical evidence from Northeast China. Habitat Int. 2026, 167, 103646. [Google Scholar] [CrossRef]
  41. Yu, S.; Kong, X.; Wang, Q.; Yang, Z.; Peng, J. A new approach of Robustness-Resistance-Recovery (3Rs) to assessing flood resilience: A case study in Dongting Lake Basin. Landsc. Urban Plan. 2023, 230, 104605. [Google Scholar] [CrossRef]
  42. Tao, Y.; Dai, L.; Hu, Z.; Witlox, F. Exploring the Spatial Morphological Evolution of Mineral Resource-Based Cities. Appl. Spat. Anal. Policy 2025, 18, 39. [Google Scholar] [CrossRef]
  43. Yin, Q.; Wang, Y.; Xu, Z.; Wan, K.; Wang, D. Factors influencing green transformation efficiency in China’s mineral resource-based cities: Method analysis based on IPAT-E and PLS-SEM. J. Clean. Prod. 2022, 330, 129783. [Google Scholar] [CrossRef]
  44. Zhang, Z.; Wang, Q.; Liu, Z.; Chen, Q.; Guo, Z.; Zhang, H. Renew mineral resource-based cities: Assessment of PV potential in coal mining subsidence areas. Appl. Energy 2023, 329, 120296. [Google Scholar] [CrossRef]
  45. Randolph, G.F.; Currid-Halkett, E. Planning in the Era of Regional Divergence. J. Am. Plan. Assoc. 2021, 88, 245–252. [Google Scholar] [CrossRef]
  46. Wang, M.; Qin, K.; Li, J.; Yang, S. Explaining the transmission mechanism of social-ecological systems adaptive cycling on path dependency in resource-based cities: Evidence from Shanxi Province, China. Sustain. Futures 2025, 9, 100449. [Google Scholar] [CrossRef]
  47. Li, X.; Zheng, S.; Lin, Y.; Jim, C.Y. Developing a resilience evaluation indicator system to enhance safety management in complex underground public spaces. Eng. Constr. Archit. Manag. 2025, Epub ahead of printing, 1–19. [Google Scholar] [CrossRef]
  48. Hu, R.-Z.; Liu, J.; Zhai, M. Mineral Resources Science and Technology in China: A Roadmap to 2050; Springer Science & Business Media: Berlin/Heidelberg, Germany, 2011. [Google Scholar]
  49. Guo, Q.; You, W.J.R.P. A comprehensive evaluation of the international competitiveness of strategic minerals in China, Australia, Russia and India: The case of rare earths. Resour. Policy 2023, 85, 103821. [Google Scholar] [CrossRef]
  50. Dai, F. China Urban Development Report 2005; China City Press: Beijing, China, 2006. [Google Scholar]
  51. Schlör, H.; Venghaus, S.; Hake, J.-F. The FEW-Nexus city index—Measuring urban resilience. Appl. Energy 2018, 210, 382–392. [Google Scholar] [CrossRef]
  52. Chen, A.P. Agglomeration and urban economic resilience in China. J. World Econ. 2022, 45, 158–181. [Google Scholar]
  53. Chen, X.; Ma, S.; Chen, L.; Yang, L. Resilience measurement and analysis of intercity public transportation network. Transp. Res. D Transp. Environ. 2024, 131, 104202. [Google Scholar] [CrossRef]
  54. Huang, M.H.; Zhang, W.G. Comparison of resilience levels and development strategies of four types ofresource-based cities in China. Econ. Geogr. 2023, 43, 34–43. [Google Scholar]
  55. Yin, J.J.; Hu, J.; Huang, Y.X. Spatial-temporal evolution characteristics and dynamic prediction of urban resilience in urban agglomerations in middle reaches of Yangtze River. Resour. Environ. Fangtze Basin 2023, 32, 2312–2325. [Google Scholar]
  56. Ge, Y.; Jia, W.; Zhao, H.; Xiang, P. A framework for urban resilience measurement and enhancement strategies: A case study in Qingdao, China. J. Environ. Manag. 2024, 367, 122047. [Google Scholar] [CrossRef] [PubMed]
  57. Zhu, Y.Y.; Luo, Y.; Chen, J.; Jiang, Z.L. Research on industrial transformation and its economicresilience in resource-exhausted cities: A case study of daye city, Hubei province. J. Nat. Resour. 2023, 38, 73–90. [Google Scholar]
  58. Gan, C.H.; Zheng, R.G.; Yu, D.F. An empirical study on the effects of industrial structure on economic growth and fluctuations in China. Econ. Res. J. 2011, 46, 4–16. [Google Scholar]
  59. Zhang, C. Research on the Green Transformation Composite System of China’s Resource-Based Cities; China Social Sciences Press: Beijing, China, 2022. [Google Scholar]
  60. Liu, H.; Zhou, T.; Gou, P. 10-Year NDVl Dataset Development in 361 Cities of China (250-m, 1990–2020). J. Global Chang. Data Discov 2023, 7, 65–74. [Google Scholar]
  61. Zhang, L.; Liang, T.; Wei, X.; Wang, H. An improved indicator standardization method for multi-indicator composite evaluation: A case study in the evaluation of ecological civilization construction in China. Environ. Impact Assess. Rev. 2024, 108, 107600. [Google Scholar] [CrossRef]
  62. Li, Y.; Li, Y.; Zhou, Y.; Shi, Y.; Zhu, X. Investigation of a coupling model of coordination between urbanization and the environment. J. Environ. Manag. 2012, 98, 127–133. [Google Scholar] [CrossRef]
  63. Guo, J.Y.; Zhang, Z.B.; Sun, Q.Y. Applications of AHP method in safety science. J. Saf. Sci. Technol. 2008, 4, 69–73. [Google Scholar]
  64. Acharya, A.; Mondal, B.K.; Bhadra, T.; Abdelrahman, K.; Mishra, P.K.; Tiwari, A.; Das, R. Geospatial analysis of geo-ecotourism site suitability using AHP and GIS for sustainable and resilient tourism planning in West Bengal, India. Sustainability 2022, 14, 2422. [Google Scholar] [CrossRef]
  65. Liang, L.W.; Wang, Z.B.; Fang, C.L.; Sun, Z. Spaliolemporal dilereniaion and coninaled developmenl paltem of urbanvzalion and the esologieal environmenl of the Beijing Tianjin Hebei urban aeglomeralion. Acla Ecol. Sin. 2019, 39, 1212–1225. [Google Scholar]
  66. Dong, J.; Peng, J.; He, X.; Corcoran, J.; Qiu, S.; Wang, X. Heatwave-induced human health risk assessment in megacities based on heat stress-social vulnerability-human exposure framework. Landsc. Urban Plan. 2020, 203, 103907. [Google Scholar] [CrossRef]
  67. Peng, J.; Liu, Y.; Li, T.; Wu, J. Regional ecosystem health response to rural land use change: A case study in Lijiang City, China. Ecol. Indic. 2017, 72, 399–410. [Google Scholar] [CrossRef]
  68. Kim, J.; Scott, C.D. Robust kernel density estimation. J. Mach. Learn. Res. 2012, 13, 2529–2565. [Google Scholar]
  69. Liu, H.; Qiao, L.; Sun, S. Spatial distribution and dynamic change of water use efficiency in the Yellow River Basin. Resour. Sci. 2020, 42, 57–68. [Google Scholar] [CrossRef]
  70. Gu, C.; Zhang, S.S. Level measurement, regional differences and convergence study of the industrial chain resilience. Inq. Int. Econ. Issues 2023, 6, 123–139. [Google Scholar]
  71. Jenkins, S. The measurement of income inequality. In Economic Inequality and Poverty: International Perspectives; Taylor and Francis: London, UK, 2017; pp. 3–38. [Google Scholar]
  72. Albeladi, K.; Zafar, B.; Mueen, A. Time series forecasting using LSTM and ARIMA. Int. J. Adv. Comput. Sci. Appl. 2023, 14, 313–320. [Google Scholar] [CrossRef]
  73. Wang, S.Y.; Pan, L.X.; Wang, Z.B. Spatio-temporal evolution and multi-scale effects ofregional economic differences in China. Acta Geogr. Sin. 2025, 80, 1009–1030. [Google Scholar]
  74. Wang, Z.; Fu, H.; Zhou, L. Multiple urban resilience evaluation of resource-based cities’ sustainable transformation effect. Resour. Conserv. Recycl. 2023, 191, 106912. [Google Scholar] [CrossRef]
  75. Fan, Z.; Liu, Q. The impact of transformation policies on the resilience of mining resource-based cities. J. Min. Sci. Technol. 2023, 8, 428–438. [Google Scholar]
  76. Zhong, A.; Gen, Y.; Wang, Z.; Hu, C. Evaluation of the effect of ecological restoration in mineral resource cities and analysis of driving factors. Sci Rep 2025, 15, 14543. [Google Scholar] [CrossRef]
  77. Pinheiro, F.L.; Balland, P.-A.; Boschma, R.; Hartmann, D. The dark side of the geography of innovation: Relatedness, complexity and regional inequality in Europe. Reg. Stud. 2025, 59, 2106362. [Google Scholar] [CrossRef]
  78. Caniëls, M.C.J.; Romijn, H.A. Agglomeration Advantages and Capability Building in Industrial Clusters: The Missing Link. J. Dev. Stud. 2003, 39, 129–154. [Google Scholar] [CrossRef]
  79. Zhong, X.; Zheng, R.; Chen, W.; Lv, L.; Wei, Z. Regional differences, dynamic evolution, and driving factors of ecological resilience in China’s urban agglomerations. Sci. Rep. 2025, 15, 36791. [Google Scholar] [CrossRef]
  80. Li, G.; Liu, M. Spatiotemporal evolution and influencing factors of economic resilience: Evidence from resource-based cities in China. Sustainability 2022, 14, 10434. [Google Scholar] [CrossRef]
  81. Ling, X.; Luo, Z.; Feng, Y.; Liu, X.; Gao, Y. How does digital transformation relieve the employment pressure in China? Empirical evidence from the national smart city pilot policy. Humanit. Soc. Sci. Commun. 2023, 10, 1–17. [Google Scholar] [CrossRef]
Figure 1. Analytical Framework for Assessing Urban Composite Resilience.
Land 15 00348 g001
Figure 2. Overview of the Study Area. Note: The map is produced based on the standard map downloaded from the Standard Map Service of the Ministry of Natural Resources of China (Approval No. GS (2024)0650). The base map boundaries have not been modified.
Land 15 00348 g002
Figure 4. ARIMA-Based Simulation and Forecast of Composite Resilience Levels in Mining Cities.
Land 15 00348 g004
Figure 5. Spatiotemporal Trends in Resilience Levels of Mining Cities across China’s Four Major.
Land 15 00348 g005
Figure 6. Spatiotemporal Changes in the Spatial Distribution of Resilience Levels in China’s Mining Cities.
Land 15 00348 g006
Figure 7. Dynamic distribution of resilience levels in mining cities across four regions, 2014–2023.
Land 15 00348 g007
Figure 8. Decomposition results of the Dagum Gini coefficient.
Land 15 00348 g008
Table 4. Classification of resilience levels in mining cities by year.
YearLow ResilienceRelatively Low ResilienceMedium ResilienceRelatively High ResilienceHigh Resilience
201521311731
201717281981
201952130152
202141523265
202351019327
Table 5. Overall Dagum Gini coefficient and contribution rates.
YearOverall
Gini Coefficient
(G)
Overall Dagum Gini Coefficient
(G)
Dagum Gini Coefficient DecompositionContribution Rate (%)
Within-Region Gini Coefficient
(Gw)
Between-Region Gini Coefficient
(Gb)
Transvariation Gini Coefficient
(Gt)
Contribution of Within-Region Inequality (Gw)Contribution of Between-Region Inequality (Gb)Contribution of the Transvariation Term (Gt)
20140.02110.05180.01180.02110.018822.88%40.72%36.40%
20150.02470.05260.01200.02470.015922.80%46.93%30.27%
20160.02680.05150.01120.02680.013521.71%52.01%26.28%
20170.02910.05710.01240.02910.015521.71%51.06%27.23%
20180.03040.05720.01220.03040.014621.29%53.12%25.59%
20190.02640.0540 0.01210.02640.015522.44%48.81%28.75%
20200.03050.05650.01210.03050.013921.39%54.02%24.59%
20210.03150.05630.0120 0.03150.012921.36%55.82%22.82%
20220.03540.05830.01210.03540.010820.77%60.65%18.58%
20230.03590.0602 0.01260.03590.011620.99%59.66%19.35%
Table 6. Decomposition results of within-region Dagum Gini coefficients.
YearWithin-Region Gini Coefficient Decomposition
Within-Region Gini Coefficient (Gw)Northeast ChinaEastern ChinaCentral ChinaWestern China
20140.01180.05970.0510 0.04050.0407
20150.0120 0.05000.04590.0436 0.0450
20160.01120.04510.0490 0.0380 0.0426
20170.01240.05120.05270.04370.0453
20180.01220.05930.05260.03990.0453
20190.01210.05770.04890.04340.0419
20200.01210.05980.05060.04390.0387
20210.0120 0.05740.05690.04140.0387
20220.01210.05430.05760.04330.0375
20230.01260.05520.05770.04490.0417
Table 7. Decomposition results of between-region Dagum Gini coefficients.
YearBetween-Region Gini Coefficient Decomposition
Between-Region Gini Coefficient (Gb)Northeast China &
Eastern China
Northeast China &
Central China
Northeast China &
Western China
Eastern China &
Central China
Eastern China &
Western China
Central China &
Western China
20140.02110.06700.05260.05270.05340.06510.0453
20150.02470.07590.05330.05000.05520.06350.0461
20160.02680.08200.05240.04890.05600.06390.0422
20170.02910.09130.05770.05460.06350.07060.0455
20180.03040.09320.06070.05810.06080.07200.0443
20190.02640.08400.05920.05590.05640.06120.0436
20200.03050.09570.06650.05990.05880.06370.0428
20210.03150.09540.06560.05690.05880.06680.0425
20220.03540.10470.07150.05920.05910.06770.0437
20230.03590.10590.07070.06060.06160.07090.0462
Disclaimer/Publisher’s Note: The statements, opinions and data contained in all publications are solely those of the individual author(s) and contributor(s) and not of MDPI and/or the editor(s). MDPI and/or the editor(s) disclaim responsibility for any injury to people or property resulting from any ideas, methods, instructions or products referred to in the content.