Abstract
The environmental crisis precipitated by climate change has accelerated the urgency of urban green and low-carbon transformation. In 2024, China’s Action Plan for the National Standardization Development Outline (2024–2025) stipulated requirements for continuously improving the standard system for carbon peaking and carbon neutrality in public institutions. As key venues for knowledge innovation and energy consumption, the low-carbon transformation of higher education institutions holds significant importance for China’s achievement of its dual carbon goals. However, China lacks a systematic evaluation framework specifically designed for university campus carbon emissions. Existing green campus assessment standards often suffer from inadequate indicator adaptability, a lack of update mechanisms, and limited coverage. The STARS sustainability assessment system, widely adopted in North America, offers valuable reference points for establishing campus carbon emissions evaluation frameworks due to its features of indicator adaptability, dynamic update mechanisms, and comprehensive evaluation dimensions. This paper conducts an exploratory comparative case study of Princeton University (USA) and Tianjin University (China)—two leading research-intensive institutions—within the STARS 2.2 framework. It systematically analyses their divergent approaches to carbon management and evaluation, not as representatives of their respective continents, but as exemplars of how advanced universities operationalize low-carbon transitions. Based on this analysis and a review of domestic Chinese standards, it proposes a development pathway for China’s university campus carbon emissions evaluation system: (1) Establish a differentiated indicator system combining ‘universal fundamentals with discipline-specific types’ to enhance adaptability to campus characteristics; (2) Establish a mechanism for periodic version updates to the evaluation standard itself, ensuring alignment with evolving national carbon goals and technological advancements; (3) Develop a comprehensive and transparent carbon accounting framework that integrates direct emissions, purchased energy, and indirect sources. This research provides theoretical foundations and methodological support for institutional development and practical optimization in carbon emissions evaluation within Chinese higher education institutions.
1. Introduction
As the fervor for constructing new campuses in Chinese universities gradually subsides, the sustainable low-carbon operation and quantitative evaluation of existing university campuses have progressively emerged as key issues for energy conservation and carbon reduction at the meso-urban level [1]. Universities, serving as vital platforms for scientific innovation and talent development, bear a significant responsibility in spearheading societal sustainable development and exemplifying low-carbon initiatives [2]. In 2020, China announced its ambition to ‘reach peak carbon emissions before 2030 and achieve carbon neutrality before 2060’ [3]. This significant declaration highlights the need for scientifically planned and thoroughly evaluated low-carbon operations and construction on Chinese university campuses [4]. However, current efforts to advance energy conservation, carbon reduction, and sustainable development in Chinese universities remain incomplete across several dimensions, including conceptual education, public engagement, operational design, planning management, and innovative development [5,6,7,8]. The US Association for Education in Sustainability has maintained international leadership in low-carbon operations and quantitative evaluation, serving as a pioneer in establishing sustainable low-carbon standards [9,10]. Through policy implementation and the establishment and refinement of standards, North American university campuses have fully integrated sustainable low-carbon objectives and concepts into student behavioral habits, providing an optimal campus environment for promoting low-carbon planning technologies [11,12,13]. Research indicates that an adaptive university campus carbon emissions assessment system can guide students towards adopting behaviors that reduce campus carbon emissions by approximately 20% [14,15]. Consequently, research into carbon emissions evaluation systems for Chinese university campuses holds significant importance for implementing the ‘dual carbon’ strategy at the meso-urban scale and promoting regional sustainable development.
At present, research on green campus evaluation systems has made some progress, among which are comprehensive evaluation standards such as LEED for Cities and Communities, BREEAM Communities, STARS, etc. [16,17,18], with their mature indicator framework and certification system, provide important benchmark tools for global green campus construction, suitable for systematic benchmarking and certification of campus environmental performance [19]. Among various evaluation tools, life cycle assessment (LCA) and carbon footprint analysis methods can quantify the environmental impact of campus buildings from the perspective of their entire life cycle (production, construction, operation, and demolition), and have stronger scientific and accurate characteristics, becoming core tools for in-depth evaluation of campus environmental performance [20,21,22]. However, previous research on the evaluation of university campuses has been chiefly based on universal sustainable development factors (such as energy conservation, water conservation, material conservation, etc.) to construct evaluation systems [23,24,25]. However, due to significant differences in natural environment, disciplinary characteristics, and development stages among campuses of different regions, types, and functions, it is urgent to select more targeted evaluation dimensions and driving factors based on the uniqueness of the campus [26,27,28]. For campuses in cold regions of northern China, clean energy alternatives for winter heating and building insulation performance should be the focus of evaluation [29]; For an agricultural and forestry university, the ecological carbon sequestration capacity of its experimental fields and nurseries, as well as the sustainability of its agricultural management model, should be its characteristic evaluation indicators [30]. Ignoring regional and functional specificity and using a universal evaluation system for assessment makes it difficult to identify various issues in campus sustainable development accurately [31].
This article clarifies the development process of the evaluation system for Chinese university campuses through data collection and review, identifies the shortcomings in the green evaluation system for Chinese university campuses, analyzes the research focus of the STARS system implemented by the North American Higher Education Association’s Sustainable Development Alliance, and summarizes its advanced experience. Finally, by collecting data from the main campus of Princeton University and the Beiyang Campus of Tianjin University for empirical analysis, this study summarizes the inspiration for the North American university campus sustainable evaluation system, which informs the formulation and construction of sustainable low-carbon evaluation standards for Chinese university campuses.
2. The Development Process and Key Issues of China’s University Campus Sustainability Evaluation System
2.1. Development Process
The historical development of sustainable evaluation systems for Chinese university campuses can be divided into four distinct phases (Table 1).

Table 1.
Developmental History of Sustainable Evaluation Systems for Chinese University.
2.1.1. Early Exploratory Phase (Prior to 2000): Evaluation of Institutional Scale
Following the reform and opening-up, China’s higher education system gradually recovered and was rebuilt. The global rise of environmental protection movements, spurred by concerns about pollution, prompted higher education institutions to begin addressing the environmental impact of their campuses. Although some universities initiated independent explorations into establishing and evaluating green campuses, the campus evaluation systems in Chinese universities during this period primarily focused on institutional scale [41]. Evaluation metrics remained singular, predominantly centered on foundational data such as enrollment figures, campus size, and faculty strength, resulting in evaluation frameworks that lacked systematic and scientific rigor [42,43].
2.1.2. Intermediate Development Phase (2001–2010): Evaluation of Resource Conservation
With the deepening of educational reforms, higher education has entered a period of rapid development, characterized by a swift expansion in the number and scale of universities [44]. Concurrently, growing global attention to climate change and sustainable development has spurred more institutions to embrace sustainable campus initiatives [45]. The concept of the resource-efficient university campus emerged within the broader context of building a ‘resource-efficient society’, focusing on five key aspects: energy conservation, land conservation, water conservation, material conservation, and environmental protection [46]. In the early 21st century, the Green Building Evaluation Standard GB/T 50378-2006 was promulgated, marking the beginning of China’s green building assessment framework [47]. However, at this juncture, no evaluation system existed for university campuses at the meso-urban scale; green assessment for campuses initially commenced at the individual building level.
2.1.3. Late Deepening Phase (2011–2020): Evaluation of Energy Conservation and Emission Reduction
In 2012, pursuant to the Outline of the Twelfth Five-Year Plan for National Economic and Social Development of the People’s Republic of China, the State Council issued the Energy Conservation and Emission Reduction Plan for the Twelfth Five-Year Period to address global climate change, alleviate resource and environmental constraints, and build a resource-efficient and environmentally friendly society [48]. Against this backdrop, local governments and higher education institutions across China began jointly formulating comprehensive evaluation criteria for university campuses, aiming to establish these campuses as pioneering demonstration zones at the meso-scale within cities [49]. In March 2013, the Chinese Society for Urban Studies released the industry standard Green Campus Evaluation Standard CSUS/GBC04-2013 [50], China’s first evaluation framework for university campuses. It focused on seven dimensions: site planning, energy utilization, water resource utilization, material resource utilization, indoor environment and pollution control, operational management, and educational promotion [51], thereby establishing a traceable framework for evaluating Chinese university campuses. During this period, China’s university campus evaluations gradually shifted from resource conservation assessments towards comprehensive energy conservation and emissions reduction evaluations encompassing ‘building energy efficiency [52], transport [53], landscape ecology [54], and waste management [55]’. In 2019, the Ministry of Housing and Urban-Rural Development further refined the university campus evaluation framework by issuing the Green Campus Evaluation Standard GB/T51356-2019. This standard introduced a more systematic and scientific approach to comprehensive campus assessment, focusing on five key dimensions: ecological planning, energy and resource management, environmental health, operational management, and educational promotion [56].
2.1.4. Contemporary Innovation Phase (2021–Present): Evaluation of Energy Regeneration and Low-Carbon
With macro-level national regulation, the introduction of the dual carbon targets strategy in 2020 has set higher requirements for energy-related assessments within university campuses [57]. In July 2021, the Ministry of Education issued the Action Plan for Carbon Neutrality Science and Technology Innovation in Higher Education Institutions, proposing to achieve campus carbon neutrality by ‘systematically establishing a series of scientific and technological innovation platforms in the field of carbon neutrality within the higher education system’ [58]. In October 2022, the Ministry of Education’s Notice on Issuing the Implementation Plan for Building a National Education System for Green and Low-Carbon Development explicitly stated that ‘green and low-carbon development should be integrated into campus construction’ [59]. The focus of green campus evaluation has evolved from resource-related energy conservation and emission reduction to energy-related aspects, such as energy efficiency enhancement [60], energy regeneration [61], and recycling [62], all aimed at enhancing energy storage and reducing carbon emissions. During this period, national-level green campus evaluation standards were established, featuring more comprehensive and detailed assessment criteria. Multi-departmental and multi-sectoral collaboration advanced green campus development, promoting the widespread application of these evaluation standards [63]. Critically, there has been a shift towards specialized carbon accounting and management standards. Most notably, the “Guidance on Carbon Emissions Accounting for Higher Education Institutions (T/CABEE 053-2023)” provides a dedicated framework for compiling carbon inventories. Furthermore, various local “Near-Zero Carbon Campus” evaluation standards have emerged, signaling a new phase focused explicitly on deep decarbonization pathways. These developments demonstrate the evolving focus from general green campus evaluation to targeted carbon management, making the comparative analysis with STARS both timely and highly relevant.
2.2. Comparative Analysis of the US STARS 2.2 and China’s University Campus Sustainability Evaluation System
Many Chinese standards are often a “Tick-Box” checklist for static performance, while STARS 2.2 is designed as a “Strategic Framework” for continuous development (Table 2).
Table 2.
Differences between Chinese standards and STARS indicators.
2.3. Key Issues
2.3.1. Fixed Evaluation Metrics Fail to Align with University Campuses’ Disciplinary Profiles, Developmental Stages, and Geographical Contexts
The developmental histories of Chinese university campuses vary considerably. For campuses with differing foundational conditions, there is a need to better balance the gap between limited resources and the objectives of campus development planning. However, the current evaluation system, exemplified by the Green Campus Evaluation Standard GB/T 51356-2019, employs a uniform, fixed indicator framework. It fails to provide differentiated responses to the unique attributes of research-intensive, teaching-focused, or specialized institutions, nor does it account for the regional characteristics of different climatic zones across northern and southern China. This results in a structural contradiction where rigid indicators prove inapplicable and flexible ones remain incomplete during practical implementation. Consequently, the system fails to accurately diagnose core carbon emission issues across diverse campus types or provide tailored, actionable guidance on low-carbon development suited to individual circumstances [64]. No operational, applicable evaluation metrics exist for university campuses of varying disciplinary profiles, developmental stages, or geographical locations that align with their current developmental levels.
2.3.2. Static Evaluation Outcomes Overlook the Principles of Sustainable Development in University Campuses
The evaluation of university campuses in China currently primarily references the Green Campus Evaluation Standard GB/T51356-2019 for scoring assessments. This approach focuses solely on data outcomes related to the built environment and operational characteristics of university campuses within a specific timeframe. This approach reflects only the overall quality of the campus during that specific period, overlooking long-term trends and changes in areas such as planning and design, operational management, environmental maintenance, and energy consumption. Consequently, it struggles to comprehensively evaluate an institution’s capacity for continuous improvement and innovation [65]. The development of higher education institutions is dynamic and diverse, with varying manifestations across different periods in terms of campus built environment, operational management, and policy implementation. Consequently, static evaluation mechanisms struggle to comprehensively reflect the actual developmental status of universities, capturing both tangible progress and real-world challenges across all dimensions.
2.3.3. The Established Scope of Evaluation Fails to Comprehensively Cover All Environmental Elements Within the University Campus
Within the boundaries of a university campus, the campus environment can be categorized into the built environment and the operational environment. The built environment primarily encompasses two major categories: ‘objective physical space’ and ‘subjective perceptual space’ [66]. Specifically, this includes the objective physical space comprising elements such as ‘land use, building operations, landscape design, solid waste recycling, and facility integration’ [7], alongside the subjective perceptual space encompassing factors like ‘spatial layout, functional clusters, and road distribution’ [67]. Additionally, elements related to the campus operational environment encompass the impact of energy and resource consumption on the campus environment, including intelligent energy systems, renewable and clean energy sources, and resource recycling and reuse [68]. The existing evaluation scope overlooks the additional energy consumption for campus travel indirectly caused by the unreasonable configuration of functional clusters, which is influenced by the ‘land use’ element. It fails to consider the impact of ‘transportation modes’ on the campus environment and does not evaluate the recycling of campus resources. Consequently, environmental changes and inefficient utilization arise, making it difficult to achieve the rational allocation of energy and resources within the university campus boundaries.
3. The STARS System for North American University Campuses
The Sustainability Tracking, Assessment & Rating System (STARS) for North American university campuses has been refined in alignment with the United Nations’ climate change objectives [69]. As one of the most comprehensive tools for assessing sustainable, low-carbon development in higher education, STARS had engaged 1276 higher education institutions worldwide by 24 October 2025. Participation is predominantly concentrated among university campuses in the northern United States and Canada, with 679 institutions having published at least one STARS report [70]. The vast majority of institutions are rated at Gold or Silver level (Figure 1). Institutions designated as ‘Reporters’ have chosen not to disclose their scores or pursue a rating. Participating institutions span a wide range of educational types, including small colleges, large research universities, and various research institutes, covering diverse educational and scientific organizations.
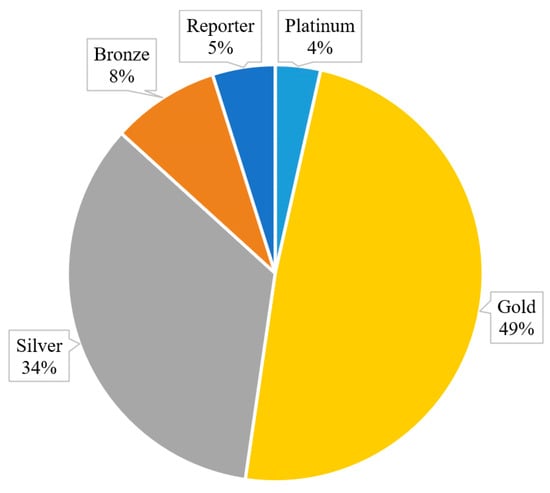
Figure 1.
Proportion of Valid Reporting Institutions by STARS Rating.
As a widely adopted framework, STARS has become the benchmark for best practice in higher education sustainability across North America. Higher education institutions frequently reference STARS’ guiding principles when formulating or refining their sustainability policies and measures. STARS (Sustainability Tracking, Assessment and Rating System) is an operational tool within the HEASC organizational framework, with its role and standing in university campus sustainability planning and evaluation illustrated in Figure 2.
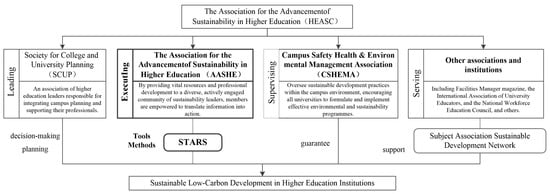
Figure 2.
Positioning of the STARS Assessment Framework within the Sustainability Alliance of the American Association of Colleges and Universities.
STARS 2.2 comprises six major categories (Figure 3): Report Preface (PR), Academics (AC), Engagement (EN), Operations (OP), Planning & Administration (PA), Innovation & Leadership (IN). The first category, the report preamble, is analogous to mandatory indicators in China’s evaluation standards and therefore carries no weighting.
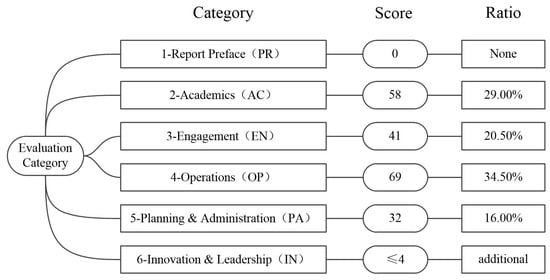
Figure 3.
Components and Proportions of STARS 2.2.
3.1. Focus on the Development of the STARS Sustainable Low-Carbon Rating System for North American University Campuses
The development of the STARS system (Table 3) within North American university campuses encompasses multiple dimensions, including academic education, engagement, operations, planning and management, and innovation. It has evolved from a focus on ‘strategic implementation of planning management’ to a core emphasis on ‘academic research and education as primary functions’, culminating in a comprehensive, sustainable, low-carbon assessment centered on addressing climate and environmental issues arising from carbon emissions associated with energy and resource consumption. This progression has progressively established systematic, multi-dimensional evaluation criteria.
Table 3.
Evolution of the STARS Assessment Framework.
The defining characteristics of the STARS framework are: continuous improvement in low-carbon sustainability and the sharing of information on sustainability practices and performance. On the one hand, the Association for the Advancement of Sustainability in Higher Education (AASHE) has progressively standardized the framework and refined the indicators within the STARS evaluation system. Evolving from 86 sub-indicators across five categories (Governance and Finance, Social Responsibility and Community Engagement, Education and Research, Operations, Innovation) in the ‘STARS 0.4’ system to 49 sub-indicators across four categories (Academic Engagement, Operations, Planning and Management, Innovation) in the ‘STARS 3.0’ system. Concurrently, AASHE requires participating higher education institutions to publicly release their sustainability and low-carbon assessment reports. This practice ensures data authenticity while subjecting institutions to societal oversight.
3.2. The Advanced Experience of the STARS Evaluation System
3.2.1. Evaluation Indicator Updates and Adaptation: Aligned with the Core Mission of Higher Education Institutions
The advanced nature of the STARS system is first demonstrated by its evaluation metrics, which are highly tailored to the unique functions of university campuses. Rather than simply applying assessment standards to commercial buildings or cities, the system deeply understands the essence of higher education institutions as integrated entities for talent cultivation, scientific research, and community engagement, and designs a corresponding indicator framework. It transcends the traditional ‘energy and building’ paradigm, incorporating core academic and operational activities such as curricula, academic research, campus engagement, and operational management into its low-carbon assessment scope. The system specifically allocates credits for ‘curriculum’ and ‘research’, encouraging the integration of sustainability principles into teaching and scholarly pursuits. This directly influences the awareness and behavioral changes of faculty and students, who constitute the primary agents of campus carbon emissions. This design ensures that evaluation metrics can accurately diagnose the carbon footprint of universities throughout knowledge production, dissemination, and application, guiding them towards more profound operational and cultural transformation towards a low-carbon approach.
However, STARS has yet to consider precise responses to the sustainable development pathways of different types of higher education institutions, failing to establish an evaluation framework capable of identifying and adapting to campus typological differences. For institutions with strengths in science and engineering, the system incorporates indicators such as ‘departmental collaborative research’ and ‘sustainability-themed research’ within the ‘Research’ category, focusing specifically on laboratory energy efficiency management, green chemistry practices, and carbon footprint accounting for major research facilities. This precisely aligns with their characteristic concentration of high-energy-consumption experimental activities. For humanities and social sciences institutions, the system reinforces evaluation dimensions such as ‘community engagement’ and ‘cross-cultural sustainability concepts’ within the “curriculum” and ‘campus participation’ modules. This guides them to leverage their disciplinary strengths, contributing to the development of a sustainability culture through curriculum design, community service, and policy research. For comprehensive universities, the framework employs indicators such as ‘diverse participatory governance’ and ‘sustainability endowments’ within the ‘planning and management’ module. This drives the establishment of cross-disciplinary and cross-departmental collaborative mechanisms, integrating diverse academic resources to form a cohesive governance force. Future sustainability assessment systems will focus on differentiated evaluation tailored to campus types.
3.2.2. Dynamic Evaluation Mechanism Updates: Establishing a Continuous Improvement Management Loop
STARS employs a cyclical, versioned dynamic update mechanism to ensure the timeliness and forward-looking nature of its evaluation system. Its assessment criteria are not static but are periodically revised and upgraded by AASHE (typically every few years) through gathering user feedback and aligning with global sustainability trends, resulting in new versions. This approach enables the continuous incorporation of the latest scientific advancements, policy directions, and best practices. More significantly, it mandates that participating institutions undergo recertification every three years, thereby establishing an effective management cycle of ‘evaluation-feedback-improvement-re-evaluation’. This mechanism compels the regularization and institutionalization of campus sustainability management, avoiding the pitfalls of static, ‘once-and-for-all’ assessments. It incentivizes universities to monitor their performance continuously, set higher emissions reduction targets, and achieve long-term, measurable, and sustained improvement.
3.2.3. Comprehensive Assessment Scope: Achieving Campus-Wide Carbon Footprint Accounting
The STARS system achieves comprehensive accounting of the campus-wide carbon footprint through its boundary integrity and dimensional diversity. Its evaluation scope broadly encompasses four core dimensions: Academics, Engagement, Operations, and Planning & Administration. This not only covers common operational aspects such as energy, transport, waste, and water resources, but also incorporates governance factors with indirect impacts on long-term sustainability and carbon emissions—including procurement policies, investment decisions, staff and student wellbeing, and diversity and equity. This comprehensive coverage enables the systematic identification of both direct and indirect drivers of campus carbon emissions, overcoming the limitations of traditional, piecemeal approaches. Consequently, it supports universities in developing synergistic, integrated low-carbon development strategies at fundamental levels—encompassing holistic governance, operational models, and campus culture—thereby achieving genuine whole-life-cycle carbon management.
4. Empirical Analysis of Case Studies from Chinese and American University Campuses
4.1. Case Selection: Exploratory Comparative Study
This research employs an exploratory comparative case study methodology (Table 4). The subjects are the main campus of Princeton University (USA) and the Weijin Road Campus of Tianjin University (China) (Figure 4). The goal is not to generalize findings to all North American or Chinese universities, but to conduct a focused, in-depth analysis of how two leading, research-intensive institutions—operating under different national contexts—engage with a sophisticated, common evaluation framework (STARS 2.2). This allows for a detailed examination of the interplay between evaluation system design and on-the-ground implementation at a high level of ambition.
Table 4.
Basic Information of the Two Universities in 2021.
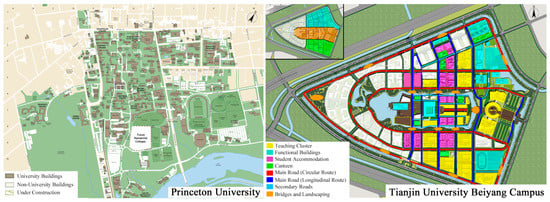
Figure 4.
Plan of Princeton University and Plan of Tianjin University’s Beiyang Campus.
4.1.1. The Rationale for Selecting These Two Universities for Comparative Analysis
- Both universities boast a long history of education and a profound cultural heritage. Tianjin University traces its origins to Beiyang University, established in 1895 as China’s first modern university. Its developmental trajectory has largely paralleled the history of modern higher education in China [71]. This signifies that Tianjin University—particularly its Weijin Road campus—bears a weighty historical legacy. Its low-carbon transition involves not only technological renewal but also the protective renovation of historic buildings and energy upgrades, presenting a challenge highly representative among China’s many century-old institutions [72]. Princeton University, founded in 1746, stands as one of America’s oldest institutions of higher learning. Its campus presents a composite of colonial-era architecture and modern facilities [73]. This enduring history similarly imposes complex demands: preserving the campus’s status as a national historic landmark while simultaneously modernising its energy systems and enhancing energy efficiency.
- The geographical environments of the two universities are comparable, controlling for natural condition variables. Both institutions are situated in the Northern Hemisphere at similar latitudes (Princeton University at 40.3° N, Tianjin University at 39.1° N), thus sharing a continental climate characterised by distinct four seasons. This similarity implies that both institutions exhibit highly comparable heating degree days (HDD) and cooling degree days (CDD). These metrics constitute key determinants of campus building heating and cooling energy consumption, thereby influencing the overall carbon emissions of university campuses [74].
- The two universities share comparable physical campus scales and functional complexities, controlling for baseline load variables. They exhibit high alignment in the physical dimensions underpinning campus energy and environmental demands. As shown in Table 3, both institutions possess similar land areas (approximately 2.5 million square metres) and building floor areas (approximately 900,000 square metres). This ensures that when fulfilling similar spatial functions (teaching, research, accommodation), both institutions face baseline energy demands and environmental management pressures of comparable magnitude. Although differences exist in total student and staff numbers, subsequent analyses will normalise these through the introduction of per capita intensity metrics and area intensity metrics [75].
- The two universities share a similar disciplinary structure, controlling for institutional type. Both are comprehensive research universities with fully developed doctoral programmes. This status implies that they possess highly complex organisational structures, deeply integrating talent cultivation, cutting-edge scientific research, and large-scale community operations [76]. Compared to single-discipline specialised institutions, comprehensive universities exhibit greater complexity in energy sources, infrastructure, and transport logistics, rendering their carbon emission profiles more representative.
- Both universities share an ambitious carbon neutrality vision, ensuring comparability in strategic momentum. Princeton University pledges to achieve carbon neutrality by 2046, while Tianjin University commits to peaking carbon emissions by 2030 and reaching carbon neutrality by 2060. This common ground is crucial, indicating that both institutions have elevated the low-carbon transition from fragmented, reactive environmental measures to a long-term, university-wide strategic planning priority. This transforms the present study from a simple comparison of ‘advanced’ versus ‘lagging’ institutions into a profound analysis of the distinct technological pathways, governance models, and transition speeds adopted by two leading universities operating within different cultural contexts and institutional frameworks as they pursue similar ambitious goals. The insights and lessons derived from this examination are thus more cutting-edge and instructive.
- Both universities adhered to the internationally recognised STARS assessment framework, ensuring consistency in data and methodology. Both institutions voluntarily and comprehensively participated in the STARS 2.2 rating process and publicly disclosed their reports. This constitutes the methodological foundation upon which this study is built. The STARS system provides a standardised, transparent accounting and evaluation methodology, ensuring complete consistency between the two institutions in defining carbon emission boundaries, data collection criteria, and benchmarking indicator scores. This fundamentally avoids issues of incomparability arising from differing evaluation standards or data sources, enabling score variations to authentically and directly reflect the actual disparities in sustainable development performance between the two universities.
4.1.2. Acknowledging Limits and Scope of Generalization
It is essential to recognize that these two cases cannot accurately represent the vast diversity of higher education institutions in either the United States or China. The comparison explicitly excludes: Firstly, teaching-oriented universities and colleges, which may have vastly different resource bases, operational priorities, and carbon profiles; Secondly, specialized institutions (e.g., arts colleges, medical schools), whose emissions are heavily shaped by their specific academic focus. Thirdly, universities with less financial stability or administrative capacity may find the comprehensive data tracking required by STARS to be a significant burden.
Therefore, findings related to high-cost strategic investments or the existence of dedicated sustainability staff and committees are most directly applicable to other well-resourced, research-intensive universities. However, findings related to evaluation system design principles—such as the importance of integrating academics and operations, the value of transparent reporting, and the need for dynamic update mechanisms—are likely to have broader relevance. These principles can inform the development of scalable and tiered evaluation systems that can be adapted to institutions of varying types and resources.
4.2. Data Sources and Harmonization for Cross-System Comparability
Data for Princeton University’s main campus in the United States is sourced from the publicly available STARS report (https://reports.aashe.org/institutions/princeton-university-nj/report/2021-08-25/, accessed on 21 April 2025); The baseline data for Tianjin University’s Beiyang Campus is sourced from the university’s Educational Teaching Information Management System, Student Affairs Office, Logistics Support Department, Personnel Office, Security Office, and other relevant departments (https://serv.tju.edu.cn/eos.html, accessed on 14 December 2025). The figures presented in the table are calculated data. The fundamental premise for comparability is that both institutions voluntarily adhered to the same standardized protocol—the STARS 2.2 Technical Manual (https://stars.aashe.org/wp-content/uploads/2019/07/STARS-2.2-Technical-Manual.pdf, accessed on 22 April 2025)—which mandates specific definitions, boundaries, and methodologies for data collection and reporting. This effectively creates a “level playing field” by overriding national administrative and statistical differences. The following specific measures were taken to ensure indicator comparability:
4.2.1. Unified Operational Boundary Definition
The most significant potential discrepancy—carbon emission boundaries—was mitigated by the STARS framework itself. Both universities were required to account for their emissions within the STARS-defined operational boundary, which includes Scope 1 (direct emissions from campus-owned sources) and Scope 2 (indirect emissions from purchased electricity, heat, and steam). This prevents one institution from excluding primary emission sources that another includes.
4.2.2. Standardized Metric Normalization
To account for differences in campus size and population, the STARS scoring system itself employs normalized metrics. For example, greenhouse gas emissions are not assessed solely on total volume, but also on intensity and reduction performance. Similarly, indicators in the “Engagement” and “Academics” categories often use percentages (e.g., percentage of students engaged in a program, percentage of courses sustainability-focused) rather than absolute numbers, making institutions of different scales directly comparable.
4.2.3. Common Data Reporting Protocols
STARS provides explicit definitions for every data point. For instance, “sustainability-focused courses” are defined using a standard set of criteria, ensuring that both universities apply the same lens when classifying their curricula. This eliminates subjectivity and differences arising from varying internal administrative definitions.
4.2.4. Third-Party Verification and Transparency
AASHE, the administrator of STARS, maintains a review process and requires public disclosure of reports. This external oversight and transparency ensure that the data submitted by both institutions have been subject to a level of scrutiny and are presented in a consistent format, further enhancing their comparability for this analysis.
4.3. Methodology
The comparative analysis uses the STARS 2.2 framework, with its scoring methodology detailed in the Technical Manual v2.2 (data source: https://stars.aashe.org/wp-content/uploads/2019/07/STARS-2.2-Technical-Manual.pdf, accessed on 22 April 2025). STARS 2.2 assigns scores to each indicator based on specific criteria detailed in the Technical Manual v2.2. Scores for each indicator are determined by the reporting organization in accordance with STARS guidelines and reviewed by AASHE.
The scores for each category and the overall total are taken directly from the STARS report. We do not modify the scores. Our analysis compares the performance of the two universities on carbon-related indicators, alongside their overall STARS scores, to understand the differences in their carbon emissions management and assessment.
4.4. Results
In 2021, under the STARS 2.2 evaluation framework, Princeton University in the United States achieved a score of 68.42 (converted to a percentage scale), resulting in a final rating of ‘Gold’ Level. Tianjin University’s Beiyang Campus in China attained a score of 60.39 (converted to a percentage scale), receiving a final rating of ‘Silver’ Level. The calculated results for both high educational institutions are detailed in Table 5.
Table 5.
Comparative Analysis of Princeton University’s Main Campus and Tianjin University’s Beiyang Campus.
4.5. Analysis
4.5.1. Energy Dimension: Dual Gaps in System Efficiency and Structural Transformation
Within the “Operations” dimension of the STARS 2.2 framework, energy-related performance stands as the primary determinant of campus carbon emissions. The disparity between Princeton University and Tianjin University in energy management primarily manifests across two dimensions: “System Efficiency” and “Energy Mix”. These factors collectively account for the nearly threefold difference in their “Greenhouse Gas Emissions” scores.
Energy efficiency manifests in the disparity between meticulous management and systematic investment. Princeton University scored 3.86/6.00 in the “Energy Efficiency” category, whereas Tianjin University scored 0 points, representing the most direct reflection of the two institutions’ differing energy performance. This significant gap stems from: ① Systematic energy-saving retrofits. Princeton University implemented a comprehensive building energy conservation program, including insulation upgrades to existing building envelopes, widespread adoption of high-efficiency lighting systems, and intelligent variable-frequency control for central air conditioning systems. These measures directly reduced the campus’s baseline energy load. ② Energy management and monitoring. Princeton established a campus-wide energy management system for real-time monitoring, analysis, and diagnostics of energy consumption data in major buildings. This refined management enables the timely detection of abnormal energy usage and the implementation of optimizations, achieving a shift from ‘extensive energy consumption’ to ‘precise energy management’. ③ Performance Deficit. Tianjin University’s score of zero in this category does not imply the absence of energy-saving measures, but rather a potential lack of campus-wide, systematic energy retrofitting programs alongside institutionalized processes for continuously tracking, verifying, and publicly reporting energy savings. This reflects shortcomings in translating fragmented energy-saving practices into measurable, verifiable, and sustainable performance outcomes.
The energy structure reveals a stark disparity in the pace of clean energy transition. Under the “Clean and Renewable Energy” category, both institutions scored extremely low (PU 0.00/4.00; TJU 0.01/4.00), although the underlying implications differ slightly: Princeton University’s “efficiency-first” strategy. With renewable energy applications yet to be widely deployed on campus, Princeton has prioritized tapping the substantial potential for energy efficiency. By significantly reducing energy demand, it indirectly lowers carbon emissions from purchased electricity, buying valuable time for the transition. Tianjin University’s ‘Starting Point’ Status: The extremely low score indicates its clean energy projects remain at the sporadic demonstration or planning stage, lacking sufficient installed capacity and generation to influence the campus’s overall energy structure. Consequently, the institution’s carbon intensity remains closely tied to the proportion of fossil fuels within the regional grid.
The disparities in these two aspects are directly reflected in the indicators of ‘greenhouse gas emissions’ (PU 4.13/8.00; TJU 1.42/8.00) and ‘emissions inventory and disclosure’ (PU 1.79/3.00; TJU 2.38/3.00). Princeton University achieves higher energy efficiency, consuming less energy while fulfilling equivalent campus functions, thereby directly reducing carbon emissions under both Scope 1 (direct emissions) and Scope 2 (purchased electricity). It is noteworthy that Tianjin University scored higher on ‘Emissions Inventory and Disclosure’, suggesting potentially stronger data monitoring and reporting transparency. However, ‘well-managed’ does not equate to ‘low emissions’. This precisely highlights a critical issue: while a robust carbon accounting system is foundational, the true drivers of emissions reduction lie in substantive energy efficiency projects and actions aimed at transforming the energy mix.
4.5.2. Academic Engagement and Participation: Soft Power and Endogenous Momentum for Campus Low-Carbon Transformation
At the academic level, the two institutions’ overall evaluation scores (PU 38.71; TJU 38.55) are comparable, yet their underlying structures reveal distinct emphases. Princeton University’s perfect score in ‘Sustainable Development Research’ demonstrates its capacity to integrate cutting-edge academic exploration with carbon neutrality objectives deeply. This signifies not only a substantial investment in research projects related to low-carbon technologies and environmental science but also reflects a systemic approach. By establishing dedicated funds and encouraging interdisciplinary research, the campus itself serves as a vital research model and innovation testing ground, enabling knowledge creation to directly support emissions reduction practices. In contrast, Tianjin University scored slightly higher in ‘Academic Programs’ and ‘Learning Outcomes’, reflecting its solid groundwork in systematically integrating sustainability knowledge into curricula and defining clear student learning outcomes. This lays the foundation for cultivating future talent equipped with low-carbon literacy. However, both institutions scored poorly in ‘sustainable development literacy assessment’, indicating a shared challenge for global universities: how to transcend mere knowledge transmission and effectively measure and drive substantive green transformations in student values and behavioral patterns. Notably, both universities achieved full marks in the ‘living laboratory’ category, demonstrating that utilizing physical campus facilities as shared platforms for teaching, research, and innovation has become a recognized advanced model by world-class universities.
Community engagement is pivotal in shaping collective behavior and fostering a low-carbon culture. Princeton University’s high score stems from its systematic “empowerment” strategy. Its outstanding performance in the “Educator Program” and “Advocacy Campaigns” demonstrates its commitment to developing faculty, staff and students as “ambassadors” and “practitioners” of sustainability. Through institutionalized training and high-impact advocacy initiatives, low-carbon values permeate every corner of the community. Tianjin University, meanwhile, demonstrates a stronger orientation towards ‘radiation’ and “service”, scoring higher in ‘Community Service’ and ‘Continuing Education’. This reflects its potential to leverage university resources to extend low-carbon concepts and practices to broader societal levels. However, its lower scores in indicators such as ‘Campus Partnerships’ and ‘Trademark Licensing’ point to a critical shortcoming: it has failed to fully leverage its supply chain management authority and commercial influence to require and drive partners towards higher environmental standards. Consequently, it has missed opportunities to leverage greater emissions reductions across a broader scope.
Upon closer examination, scholarship and engagement are not isolated entities; their most significant efficacy lies in forming synergies. Princeton’s practice demonstrates a virtuous cycle: outstanding “sustainability research” yields advanced low-carbon technologies and insights, which are then demonstrated through “living labs” on campus. Concurrently, extensive “educator programmes” and “advocacy campaigns” transform these practical examples into vivid teaching materials and community topics, thereby educating and influencing the entire community. This constitutes a self-reinforcing ecosystem of ‘research-driven innovation, practice-validated solutions, and community-wide dissemination’.
4.5.3. Management and Planning: Soft Power and Endogenous Momentum for Campus Low-Carbon Transformation
A comparison between Princeton University and Tianjin University reveals significant disparities in the strategic level and systematic nature of campus low-carbon governance. This dimension, serving as the “brain” and “central nervous system” of campus sustainability, directly determines the coordination, resource allocation, and long-term effectiveness of emissions reduction initiatives. The performance gap between the two institutions manifests primarily in two critical aspects: “strategic leadership” and “system integration”.
The strategic leadership dimension manifests in the disparity between the clarity of top-level design and its implementation capacity. Within the core indicators of the ‘Sustainable Development Plan’, Princeton University achieved a perfect score 4.00, whereas Tianjin University attained only 3.00. This one-point gap fundamentally reflects the qualitative distinction in strategic planning. In-depth analysis reveals: ① The systematic and scientific nature of planning. Princeton’s plan transcends a declarative document, functioning as a comprehensive action framework. It incorporates clear baseline benchmarks, quantifiable phased objectives, designated responsible departments, dedicated budget allocations, and periodic evaluation mechanisms. This approach effectively translates the 2046 carbon neutrality vision into actionable, measurable tasks for all departments. ② Deep integration with campus development. Its sustainability strategy forms an organic link with the university’s academic planning, campus infrastructure development, and financial planning, ensuring low-carbon objectives receive priority in resource allocation. In contrast, Tianjin University’s plan may fall short in terms of the phasing of targets, the specificity of measures, or the integration with the institution’s core development priorities, resulting in limited traction for the plan in practical implementation.
At the system integration level, disparities manifest in the maturity of governance structures and resource mobilization. This gap is primarily reflected in: ① Cross-departmental coordination mechanisms. Princeton University has established an institutionalized coordination mechanism spanning academic, operational, and financial departments through the creation of a high-level Sustainability Steering Committee. This ensures strategic objectives are effectively translated into unified action across all systems. ② Resource allocation and innovation. In the ‘Investment Finance’ domain, Princeton University achieved full marks in its ‘Investor Responsibility Committee’, indicating that it has systematically integrated sustainability principles into the management decisions of its substantial endowment fund, achieving a conceptual shift from ‘cost expenditure’ to ‘value investment’. In contrast, although Tianjin University demonstrates some performance in ‘Sustainable Investment’, it still shows deficiencies in the stability and systematic nature of its governance structure, reflecting that its sustainable governance has not yet been fully integrated into the university’s core decision-making processes.
The disparities in these two areas directly impact the overall effectiveness and capacity for continuous improvement in campus carbon reduction efforts. Princeton University, through its exceptional strategic planning and systemic integration capabilities, ensures high-level coordination and resource allocation across departments for specific reduction initiatives such as energy management, transport planning, and building retrofits. This fosters a governance framework characterized by unified objectives and concerted action. In contrast, while Tianjin University demonstrates commendable performance in specific management areas, it lacks robust top-level design and systemic integration. Consequently, reduction measures often remain confined to departmental levels, hindering the formation of university-wide synergy and sustained momentum for improvement.
4.5.4. Campus Form and Transport: The Impact of Spatial Planning on Carbon Emissions
The physical form and spatial organization of a campus are critical yet often underemphasized determinants of its carbon footprint, primarily influencing transportation emissions and the efficiency of district energy systems. The STARS 2.2 framework captures aspects of this through indicators in the “Transportation” category, particularly the “Commute Modal Split” (CMS). A comparative analysis of Princeton University’s main campus and Tianjin University’s Beiyang Campus reveals how differences in density, layout, and functional integration affect these scores and overall carbon performance.
(1) Spatial Characteristics and Modal Split. Princeton’s campus (Figure 4) exhibits a compact, pedestrian-oriented design with closely integrated academic, residential, and dining functions. This layout, supported by policies that restrict undergraduate car ownership and promote walking, cycling, and shuttle use, results in a high proportion of low-carbon commuting. Princeton’s CMS score of 2.95/5.00 reflects this success. In contrast, Tianjin University’s Beiyang Campus, although comprehensive, features larger superblocks and a more dispersed layout, which may increase reliance on motorized transport for internal travel. This is reflected in its lower CMS score of 0.77/5.00. The campus’s urban location also leads to significant off-campus commuting, where insufficient public transit connectivity may further increase carbon-intensive trips.
(2) Density and Energy Efficiency: Higher density and building clustering can reduce per capita energy demand for heating and cooling through shared walls and reduced exterior surface area. Princeton’s historically dense fabric likely contributes to lower space heating demands per square meter. Tianjin’s campus, with a mix of historic and modern buildings, may have less efficient spatial organization. While not directly measured in STARS, this spatial efficiency is indirectly reflected in the “Building Energy Efficiency” indicator (PU: 3.86/6.00; TJU: 0.00/6.00).
(3) Functional Clustering and Internal Travel: The proximity of key functions—housing, classrooms, laboratories, and dining—reduces the need for motorized internal trips. Princeton’s collegiate system minimizes daily travel distances. Tianjin’s campus, with greater separation between dormitory and academic zones, may increase reliance on bicycles, scooters, or campus buses. Although internal travel is not directly captured in STARS’ CMS, it affects overall campus energy use and emissions.
This analysis highlights that campus form is a powerful lever for reducing carbon emissions. A compact, mixed-use campus with pedestrian-priority design can significantly cut transportation emissions and enhance the viability of efficient district energy systems. For Chinese universities—whether planning new campuses or retrofitting existing ones—integrating these spatial considerations into low-carbon planning is essential.
4.6. Comparative Analysis with Recent Chinese Low-Carbon Standards
4.6.1. Analytical Framework
To ensure the proposed pathways are grounded in China’s institutional context, this section provides a qualitative comparative analysis (Table 6) between the STARS 2.2 framework (Source of data: https://stars.aashe.org/wp-content/uploads/2019/07/STARS-2.2-Technical-Manual.pdf, accessed on 14 December 2025) and emerging Chinese standards, primarily the” Guidance on Carbon Emissions Accounting for Higher Education Institutions (Source of data: https://www.cabee.org/upload/file/20230224/1677206339388350.pdf, accessed on 14 December 2025). This analysis moves beyond the Princeton-Tianjin case study to examine system-level design principles.
Table 6.
Comparative Analysis of STARS 2.2 and T/CABEE 053-2023.
4.6.2. Key Synthesis for Chinese Practice
The STARS 2.2 framework implies that the successful implementation of the T/CABEE 053-2023 accounting standard should not be an end in itself. Its greatest value is realized when the carbon data it generates is used to: Firstly, Inform Strategic Planning: Integrate carbon targets into the university’s overall strategic plan and sustainability roadmap. Secondly, Drive Educational Integration: Use the campus carbon footprint as a living lab for teaching and research across disciplines (a concept directly mirrored in STARS’ AC-8). Thirdly, Foster Community-Wide Action: Translate carbon data into engagement campaigns, green office/dormitory programs, and behavioral change initiatives involving students and staff. Fourthly, Enable Transparent Leadership: Publicly report progress in a narrative that connects carbon numbers to stories of innovation, education, and institutional change.
Thus, the Chinese standard provides the essential “dashboard” of metrics, while the principles exemplified by STARS guide how to use that dashboard to “steer” the entire university toward a sustainable future. The next evolution for Chinese campus sustainability could involve weaving the rigorous accounting of T/CABEE into a more holistic management and recognition system inspired by these broader frameworks.
4.7. Adaptability Analysis: The Suitability of STARS 2.2 for Chinese Universities
Although the STARS 2.2 framework provides a sophisticated model for multidimensional sustainability assessment, its direct transplantation into the Chinese context is neither feasible nor advisable. The question at hand is to what extent the fundamental logic of the STARS indicator system is suitable for analyzing and advancing low-carbon development in Chinese universities, and how it must be critically adapted.
4.7.1. Suitability of the Core Logic: Strengths and Necessary Refocusing
The core strength of STARS’s logic—treating carbon management not as a siloed operational task but as a strategic theme integrated across academics, governance, and engagement—is highly suitable and urgently needed in China. It aligns with the holistic intent behind policies like the ‘Near-Zero Carbon Campus Pilot,’ which seeks transformational change rather than just technical upgrades. However, adaptation is required in two key areas:
From “Governance & Planning” to “Policy-Driven Implementation”: STARS’s “Planning & Administration (PA)” category emphasizes institutional governance and internal planning. In China, the driving force is often a powerful combination of top-down national policy mandates (e.g., Dual Carbon strategy, Ministry of Education directives) and local pilot programs. A suitable adapted framework would need to re-weight indicators to strongly incentivize and measure the alignment with, and innovative fulfillment of, these national and local policy agendas. The indicator would shift from “Does the campus have a sustainability plan?” to “How effectively is the campus translating national ‘Near-Zero Carbon’ pilot requirements into actionable, funded, and academically integrated projects?”
From “Engagement & Innovation” to “Applied Solutions within Resource Realities”: STARS rewards community engagement and innovation broadly. The Chinese context, particularly for resource-intensive campuses, demands a sharper focus on applied, scalable solutions for hard-to-abate sectors (e.g., heating in northern campuses, lab energy use in science universities) and cost-effective behavioral interventions suited to high-density student living. Engagement metrics should be tied to tangible participation in energy-saving pilots or circular economy initiatives relevant to the campus’s specific carbon profile.
4.7.2. From Direct Application to Logic Hybridization
The STARS indicator system, in its specific form, is not directly suitable for evaluating Chinese universities. Its institutional context (decentralized governance, private endowment funding) differs significantly. However, its core analytical logic—the integration of carbon accountability across the core functions of a university—is not only suitable but essential for China to achieve its ambitious dual-carbon goals in the education sector. The task, therefore, is not to adopt STARS but to hybridize its integrative logic with the specific drivers, policy frameworks, and resource realities of the Chinese system.
4.8. Consideration of STARS Evolution: Implications from Version 2.2 to 3.0
The empirical analysis in this study is grounded in the STARS 2.2 framework, which provided a consistent and publicly available dataset for both case institutions at the time of study. However, the STARS system’s inherent dynamism is a core feature, with its recent evolution to version 3.0 offering critical insights that reinforce and sharpen the findings and proposed pathways of this study.
As detailed in Table 2, STARS 3.0 (released in 2024) introduces significant changes that signal the system’s strategic direction, most notably: Increased Emphasis on Energy and Climate: The total points available in the Operations category increased from 71 in v2.2 to 86 in v3.0, with a pronounced shift in weighting towards energy consumption, greenhouse gas emissions, and renewable energy. This underscores the central role of quantifiable carbon and energy metrics as the non-negotiable core of any campus sustainability development path.
The evolution from STARS 2.2 to 3.0 does not contradict the findings of this study but instead validates and amplifies them. The stark performance gap identified in the Operations dimension, particularly in energy efficiency and greenhouse gas emissions, is precisely the area STARS 3.0 assigns greater weight. This confirms that the operational carbon performance gap is the most critical one to address. Consequently, the proposed pathways for China’s system development align closely with this evolution: Firstly, the recommendation to “Develop a Comprehensive and Transparent Carbon Accounting and Management Framework” directly corresponds to STARS 3.0’s heightened focus on core climate metrics. It advocates for building a robust operational accounting foundation, which STARS continues to prioritize. Secondly, the recommendation to “Integrate Carbon Performance into Academic and Administrative Evaluation Modules” aligns with STARS 3.0’s refined academic focus. It argues for moving beyond generic “sustainability” education to creating explicit incentives for climate-focused research, curriculum, and governance, ensuring the academic engine drives the operational transition.
Therefore, while the empirical snapshot is based on STARS 2.2, its conclusions are future-proof. The development trajectory of the STARS system itself confirms that a mature campus carbon evaluation framework must continually intensify its focus on measurable climate action and its deep integration with institutional academia and strategy—the very principles underpinning this study’s recommendations.
5. Implications for Establishing Sustainable Low-Carbon Evaluation Systems in Chinese University Campuses
The STARS rating system for North American university campuses, having evolved over more than a decade, has now reached a state of maturity and stability. However, its direct application to assess sustainability and low-carbon performance in Chinese university campuses still presents certain limitations. These relate to the challenges in advancing open participation and community collaboration for co-creation and shared benefits, which hinder joint decision-making. Internationally, greater emphasis is placed on the practical implementation of measures that yield tangible environmental benefits. Furthermore, North American university campuses prioritize sustainable procurement of food and resources, whereas most domestic institutions merely meet the most basic requirements. Similarly, the majority of investment funds for North American campuses originate from corporate assistance, whereas domestic universities primarily receive funding from national or local government allocations. In reality, sustainable low-carbon campus evaluation not only imposes higher standards for North American institutions to achieve zero-carbon campuses, but also represents the primary challenge Chinese universities must confront in advancing towards ‘near-zero carbon campuses’ and ultimately ‘carbon-neutral campuses’.
The STARS evaluation system for North American university campuses offers key insights for sustainable low-carbon assessment in Chinese universities: Firstly, establishing a differentiated indicator framework combining ‘universal fundamentals with discipline-specific criteria’ to enhance precise alignment with campus types and functions; Secondly, refining a dynamic indicator update mechanism that aligns with societal development and campus realities, thereby shifting the evaluation paradigm from static assessment to process governance; Thirdly, establishing per capita carbon emission benchmarks for resident students and staff based on regional characteristics, fundamentally enhancing the scientific rigour and comparability of the assessment.
5.1. Establishing a Differentiated Indicator System Comprising ‘Common Foundations Plus Subject-Specific Types’
AASHE continually updates the STARS assessment content and metrics to align with established environmental issues designated by the United Nations Sustainable Development Goals. It further employs a series of sustainable low-carbon external oversight mechanisms to ensure the feasibility and stability of its implementation. STARS enables higher education institutions to identify priority areas based on their unique circumstances. Institutions, having defined their campus type, focus on aspects of sustainable low-carbon development most relevant to their built environment, student needs, and energy operations. While AASHE continually strives for equitable and consistent methods for allocating scores and ratings, this remains an inherently subjective task. Future iterations of STARS will explore robust scoring methodologies, including maximizing the application of environmental variability and identifying alternative approaches to accommodate regional differences and institutional typologies that influence each organization’s sustainable low-carbon impact. Conversely, STARS requires a minimum score of 25 points (on a 100-point scale) for any rating. This encourages participation from institutions with less developed sustainable low-carbon practices, enabling them to enhance their capabilities through future sustainability planning progressively.
By contrast, despite the introduction of a series of evaluation criteria for higher education institutions on Chinese university campuses, engagement among these institutions remains insufficient. A key reason for this is the lack of indicators tailored to regional and disciplinary characteristics (Figure 5). Regarding regional considerations, taking northern and southern Chinese universities as examples, northern campuses require winter heating provision, whereas southern campuses do not. Energy consumption from heating constitutes a key influencing factor in sustainable low-carbon assessments. Regarding disciplinary types, science and engineering universities conduct significantly more research experiments than arts and humanities institutions. Applying identical metrics yields markedly lower sustainability ratings for science-focused universities, thereby diminishing the perceived value of participation for most research-intensive campuses with experimental facilities. This undermines universities’ motivation to engage in sustainability assessments. Consequently, Chinese universities should emulate North American institutions by developing context-appropriate evaluation metrics tailored to diverse geographical and disciplinary contexts. Concurrently, the initial threshold for evaluating China’s university campuses is set excessively high. After conducting preliminary self-assessments, institutions that are significantly below the minimum rating threshold often opt out of participation following a cost–benefit analysis. The evaluation framework must therefore prioritize scalability and feasibility. Chinese universities should adopt the approach of lowering entry-level standards seen in North America’s STARS system. This would first encourage higher education institutions to express interest in participation, then progressively enhance their capabilities across sustainable and low-carbon dimensions. Such an approach ensures both the willingness and feasibility of campus-wide engagement.
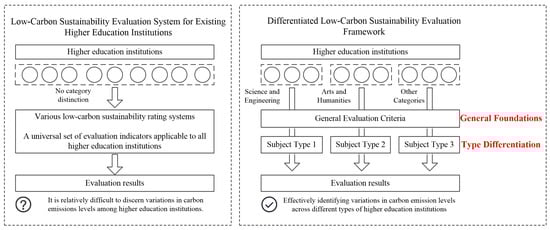
Figure 5.
Differences between the Existing Low-Carbon Sustainability Evaluation System and the Differentiated Low-Carbon Sustainability Evaluation System.
5.2. Establish a Mechanism for Periodic Version Updates to the Evaluation Standard Itself
One of the core features of the STARS rating system is its establishment of a closed-loop management mechanism comprising “assessment-feedback-adjustment,” driving continuous optimization in higher education institutions’ sustainable low-carbon development journey. The system’s three-year certification cycle serves both as institutionalized validation of phased achievements and as an incentive for ongoing improvement, compelling campuses to pursue ever-higher levels of sustainable performance within their dynamic evolution.
China’s current sustainable low-carbon evaluation of university campuses primarily relies on the Green Campus Evaluation Standard (GB/T 51356-2019), which does not stipulate the validity period for evaluation outcomes. As the dual-carbon strategy advances, subsequent low-carbon accounting and evaluation standards released also generally lack a systematic design for dynamic updating mechanisms. During the author’s involvement in drafting the Campus Carbon Neutrality Assessment Standard (submission draft) and the Near-Zero Carbon Campus Evaluation Standard (compilation draft), it was observed that the existing evaluation system suffers from structural deficiencies in establishing a fully closed-loop process encompassing ‘objectives—systems—strategies—assessment—feedback’ (Figure 6). This systemic flaw deprives campus sustainability management of external constraints and intrinsic motivation for continuous improvement, hindering its capacity to systematically respond to new demands arising from evolving national strategies and technological advancements. Without time-bound dynamic evaluation mechanisms, Chinese universities struggle to establish long-term systems for periodic assessment and sustained optimization in areas such as environmental sustainability enhancement, green infrastructure retrofitting, and refined resource management. Therefore, it is essential to leverage the advanced experience of the STARS system. By embedding periodic assessment and dynamic feedback mechanisms within existing evaluation frameworks, a resilient indicator system capable of adapting to societal development needs and actual campus changes can be established. This will genuinely propel the paradigm shift in sustainable low-carbon governance within university campuses—transitioning from static certification to process-oriented governance.
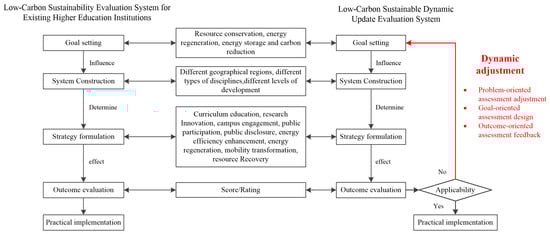
Figure 6.
Dynamic Feedback Regulation Mechanism for Periodic Evaluation in University Campuses.
5.3. Develop a Comprehensive and Transparent Carbon Accounting and Management Framework
The STARS evaluation system integrates participating institutions into a unified global benchmarking platform, enabling organizations to clearly position themselves within a comparable framework and continuously optimize their sustainable low-carbon development pathways through peer comparison. In advancing campus carbon neutrality, North American universities commonly adopt “carbon emissions intensity per unit floor area” as a core performance indicator. This forms the basis for setting reduction targets, establishing a benchmark-driven mechanism for continuous improvement.
The most significant difference lies in the depth and transparency of carbon-specific indicators. STARS 2.2 dedicates an entire sub-category to “Air & Climate,” with explicit points for a detailed greenhouse gas (GHG) emissions inventory and the level of public disclosure. This forces institutions to rigorously measure and manage their carbon footprint. In contrast, Chinese standards like GB/T 51356-2019 lack this granular focus. Carbon emissions are often implied within broader “energy conservation” or “resource utilization” indicators, without mandating a comprehensive, publicly verifiable GHG inventory.
The development of China’s campus carbon evaluation system must prioritize the establishment of a mandatory and standardized carbon accounting protocol. This should be a distinct module within any future standard, requiring campuses to: First, calculate Scope 1, 2, and key Scope 3 emissions (e.g., business travel, commuting). Second, publicly disclose this inventory to foster accountability. Third, set specific, time-bound carbon reduction targets aligned with national “dual carbon” goals. Fourth, to enhance comparability, this framework should incorporate both per-unit-area and per capita carbon intensity metrics, acknowledging the high population density of Chinese campuses.
6. Conclusions
Faced with the complex challenges of global climate change and environmental crises, North American university campuses have successfully expanded the concept of low-carbon development from a singular environmental objective into a systematic endeavor integrating academic innovation, operational practices, community engagement and institutional development through sustainability rating systems such as STARS. This framework not only internalizes sustainable development principles as behavioral norms for staff and students but also provides higher education institutions with a scientific tool for measuring progress, setting targets and demonstrating outcomes through a multidimensional evaluation structure. Against the backdrop of China’s deepening implementation of its ‘carbon peak and carbon neutrality’ strategy, university campuses—vital bastions of knowledge innovation and societal leadership—are now encountering unprecedented opportunities to advance their low-carbon transformation practices.
Based on a comparative study of the STARS system in North American university campuses, this paper proposes the following practical pathways: firstly, establishing a differentiated indicator system comprising ‘common fundamentals plus discipline-specific types’ to enhance adaptability across diverse campus types; secondly, establish a mechanism for periodic version updates to the evaluation standard itself, ensuring alignment with evolving national carbon goals and technological advancements; thirdly, develop a comprehensive and transparent carbon accounting framework that integrates direct emissions, purchased energy, and indirect sources. These insights not only facilitate the development of a more scientific and inclusive low-carbon evaluation system for Chinese university campuses but also advance campus sustainability from fragmented initiatives towards systematic governance, and from reactive compliance to proactive leadership at the methodological level. Moving forward, Chinese higher education institutions should draw upon international experience while grounding their approach in local realities, thereby charting a sustainable low-carbon development path with distinctive Chinese characteristics that embody the mission of higher education.
This study also presents several limitations. Firstly, the case analysis deliberately focused on two elite, research-intensive universities to enable a deep, controlled comparison within the STARS framework. This choice limits the direct generalizability of specific performance-based findings (e.g., score differentials in energy efficiency) to the broader, highly diverse populations of North American and Chinese universities, particularly teaching-oriented or resource-constrained institutions. Secondly, the research focuses on a comparative framework analysis of the evaluation systems, without delving into the underlying policy environment, funding support, organizational culture, and other driving factors essential for the implementation of the STARS system within specific campuses. Furthermore, the cited data and standard versions exhibit a degree of temporal lag, failing to fully capture the latest developments in both the evaluation system and low-carbon technologies. Future research could broaden the scope of case studies and intensify exploration into institutional barriers and cross-cultural adaptability during the implementation of evaluation standards.
Author Contributions
Conceptualization, Y.Y. and F.G.; methodology, Y.Y.; software, Y.Y.; validation, Y.Y. and F.G.; formal analysis, Y.Y.; investigation, Y.Y. and F.G.; resources, F.G.; data curation, Y.Y. and F.G.; writing—original draft preparation, Y.Y.; writing—review and editing, Y.Y. and F.G.; supervision, Y.Y.; project administration, F.G.; funding acquisition, Y.Y. and F.G. All authors have read and agreed to the published version of the manuscript.
Funding
This research was funded by the National Natural Science Foundation of China: The Evaluation and Design Method of the Green Renovation of the Existing University Campus Based on the Multi-objective Optimization: Take Beijing, Tianjin, Hebei Region as an Example. (NO. 52078325); Initial Scientific Research Fund for Young Teacher of School of Mechanics and Civil Engineering. China University of Mining and Technology (Beijing).
Data Availability Statement
The dataset is available on request from the authors.
Acknowledgments
The authors express thanks to the expert reviewers, editors, and everyone else who provided valuable comments and suggestions for improving the quality of this study.
Conflicts of Interest
The authors declare no conflicts of interest.
Abbreviations
The following abbreviations are used in this manuscript:
| AASHE | The Association for the Advancement of Sustainability in Higher Education (U.S.) |
| STARS | The Sustainability Tracking, Assessment & Rating System |
| PU | Princeton University |
| TJU | Tianjin University |
Appendix A
Table A1.
Comparative Analysis of Princeton University’s Main Campus and Tianjin University’s Beiyang Campus.
Table A1.
Comparative Analysis of Princeton University’s Main Campus and Tianjin University’s Beiyang Campus.
| Primary Indicator | Category | Sub-Indicator | Princeton University | Tianjin University Beiyang Campus |
|---|---|---|---|---|
| Academics (AC) | Curriculum | Academic Courses | 5.82/14.00 | 6.77/14.00 |
| Learning Outcomes | 2.29/8.00 | 3.14/8.00 | ||
| Undergraduate Program | 3.00/3.00 | 3.00/3.00 | ||
| Graduate Program | 3.00/3.00 | 3.00/3.00 | ||
| Immersive Experience | 2.00/2.00 | 2.00/2.00 | ||
| Sustainability Literacy Assessment | 0.00/4.00 | 1.00/4.00 | ||
| Incentives for Developing Courses | 2.00/2.00 | 2.00/2.00 | ||
| Campus as a Living Laboratory | 4.00/4.00 | 4.00/4.00 | ||
| Research | Research and Scholarship | 10.6/12.00 | 9.64/12.00 | |
| Support for Sustainability Research | 4.00/4.00 | 2.00/4.00 | ||
| Open Access to Research | 2.00/2.00 | 2.00/2.00 | ||
| Total for this section | 38.71/58.00 | 38.55/58.00 | ||
| Engagement (EN) | Campus Engagement | Student Educators Program | 3.50/4.00 | 2.08/4.00 |
| Student Orientation | 2.00/2.00 | 2.00/2.00 | ||
| Student Life | 2.00/2.00 | 2.00/2.00 | ||
| Outreach Materials and Publications | 2.00/2.00 | 2.00/2.00 | ||
| Outreach Campaign | 4.00/4.00 | 4.00/4.00 | ||
| Assessing Sustainability Culture | 0.50/1.00 | 0.50/1.00 | ||
| Employee Educators Program | 2.23/3.00 | 2.03/3.00 | ||
| Employee Orientation | 0.10/1.00 | 1.00/1.00 | ||
| Staff Professional Development and Training | 0.00/2.00 | 0.50/2.00 | ||
| Public Engagement | Community Partnerships | 3.00/3.00 | 3.00/3.00 | |
| Inter-Campus Collaboration | 3.00/3.00 | 2.00/3.00 | ||
| Continuing Education | 2.01/5.00 | 3.50/5.00 | ||
| Community Service | 2.19/5.00 | 3.06/5.00 | ||
| Participation in Public Policy | 2.00/2.00 | 2.00/2.00 | ||
| Trademark Licensing | 2.00/2.00 | 0.00/2.00 | ||
| Total for this section | 30.53/41.00 | 29.67/41.00 | ||
| Operations (OP) | Air & Climate | Emissions Inventory and Disclosure | 1.79/3.00 | 2.38/3.00 |
| Greenhouse Gas Emissions | 4.13/8.00 | 1.42/8.00 | ||
| Buildings | Building Design and Construction | 1.25/3.00 | 1.50/3.00 | |
| Building Design and Construction | 2.00/5.00 | 2.50/5.00 | ||
| Energy | Building Energy Efficiency | 3.86/6.00 | 0.00/6.00 | |
| Clean and Renewable Energy | 0.00/4.00 | 0.01/4.00 | ||
| Food & Dining | Food and Beverage Purchasing | 1.40/6.00 | 1.20/6.00 | |
| Sustainable Dining | 2.00/2.00 | 1.10/2.00 | ||
| Grounds | Landscape Management | 1.00/2.00 | 1.00/2.00 | |
| Biodiversity | 2.00/2.00 | 1.00/2.00 | ||
| Purchasing | Sustainable Procurement | 2.25/3.00 | 1.00/3.00 | |
| Electronics Purchasing | 0.81/1.00 | 0.50/1.00 | ||
| Cleaning and Janitorial Purchasing | 0.56/1.00 | 0.35/1.00 | ||
| Office Paper Purchasing | 0.78/1.00 | 0.40/1.00 | ||
| Transportation | Campus Fleet | 0.21/1.00 | 0.35/1.00 | |
| Commute Modal Split | 2.95/5.00 | 0.77/5.00 | ||
| Support for Sustainable Transportation | 1.00 /1.00 | 1.00/1.00 | ||
| Waste | Waste Minimization and Diversion | 5.56/8.00 | 4.25/8.00 | |
| Construction and Demolition Waste Diversion | 1.00/1.00 | 1.00/1.00 | ||
| Hazardous Waste Management | 1.00/1.00 | 1.00/1.00 | ||
| Water | Water Use | 5.00/5.00 | 1.20/5.00 | |
| Rainwater Management | 2.00/2.00 | 0.50/2.00 | ||
| Total for this section | 42.55/71.00 | 24.43/71.00 | ||
| Planning & Administration (PA) | Coordination & Planning | Sustainability Coordination | 1.00/1.00 | 1.00/1.00 |
| Sustainability Planning | 4.00/4.00 | 3.00/4.00 | ||
| Inclusive and Participatory Governance | 1.50/3.00 | 1.50/3.00 | ||
| Reporting Assurance | 0.00/1.00 | 1.00/1.00 | ||
| Diversity & Affordability | Diversity and Equity Coordination | 1.33/2.00 | 1.33/2.00 | |
| Assessing Diversity and Equity | 0.75/1.00 | 0.63/1.00 | ||
| Support for Underrepresented Groups | 2.92/3.00 | 1.25/3.00 | ||
| Affordability and Access | 2.77/4.00 | 4.00/4.00 | ||
| Investment & Finance | Committee on Investor Responsibility | 2.00/2.00 | 1.00/2.00 | |
| Sustainable Investment | 2.01/5.00 | 3.00/5.00 | ||
| Investment Disclosure | 0.00/1.00 | 0.00/1.00 | ||
| Wellbeing & Work | Employee Compensation | 0.00/3.00 | 1.50/3.00 | |
| Assessing Employee Satisfaction | 0.60/1.00 | 0.67/1.00 | ||
| Wellness Program | 0.75/1.00 | 0.75/1.00 | ||
| Workplace Health and Safety | 0.00/2.00 | 1.75/2.00 | ||
| Total for this section | 19.63/34.00 | 22.38/34.00 | ||
| Innovation & Leadership (IN) | 8 items | 0.5 points/item | 4.00/4.00 | 4.00/4.00 |
| Calculation process | — | — | ||
References
- Liu, J. Public Finance and American Urban Planning Education: History and Training Modes. Urban Plan. Int. 2023, 38, 44–52. [Google Scholar] [CrossRef]
- Cao, R.; Feng, L.; Zhang, L. Accounting and Analysis of Carbon Emissions in Universities: A Case Study of Beijing A University. Environ. Sci. 2024, 45, 1907–1916. [Google Scholar] [CrossRef]
- The Central People’s Government of the People’s Republic of China. Xi Jinping Delivered an Important Speech at the General Debate of the Seventy-Fifth Session of the United Nations General Assembly. 22 September 2020. Available online: https://www.gov.cn/xinwen/2020-09/22/content_5546168.htm (accessed on 25 May 2025).
- Liu, H.; Wang, X.; Yang, J.; Zhou, X.; Liu, Y. The ecological footprint evaluation of low carbon campuses based on life cycle assessment: A case study of Tianjin, China. J. Clean. Prod. 2017, 144, 266–278. [Google Scholar] [CrossRef]
- Long, X.; Wang, J. Visualization Analysis of Low-Carbon Campus Research Based on CiteSpace. J. Nat. Sci. Hunan Norm. Univ. 2024, 47, 106–114. [Google Scholar]
- Guan, Z.; Zhang, W.; Wang, C.; Xue, B.; Li, X.; Xu, X. LCA Analysis of Campus Photovoltaic Power Generation System and lts Application Potential in Low Carbon Campus: Case Study of Shandong Jianzhu University. Build. Sci. 2024, 40, 47–55+64. [Google Scholar] [CrossRef]
- Yang, Y.; Gao, F. Research Review on the Low-carbon Path of Built Environment in University Campus. South Archit. 2024, 2, 53–63. [Google Scholar]
- Xiao, Y.; Lv, H.; Lv, D. Analysis of carbon emission characteristics and carbon reduction potential of campus building operation based on stirpat model. Environ. Eng. 2023, 41, 117–123. [Google Scholar] [CrossRef]
- Guerrieri, M.; La Gennusa, M.; Peri, G.; Rizzo, G.; Scaccianoce, G. University campuses as small-scale models of cities: Quantitative assessment of a low carbon transition path. Renew. Sustain. Energy Rev. 2019, 113, 109263. [Google Scholar] [CrossRef]
- Rowe, D.; Gentile, S.; Clevey, L. The U.S. Partnership for Education for Sustainable Development: Progress and Challenges Ahead. Appl. Environ. Educ. Commun. Int. J. 2015, 14, 112–120. [Google Scholar] [CrossRef]
- Anthony Jnr, B. Green campus paradigms for sustainability attainment in higher education institutions—A comparative study. J. Sci. Technol. Policy Manag. 2021, 12, 117–148. [Google Scholar] [CrossRef]
- Berchin, I.I.; de Aguiar Dutra, A.R.; Guerra, J.B.S.O.d.A. How do higher education institutions promote sustainable development? A literature review. Sustain. Dev. 2021, 29, 1204–1222. [Google Scholar] [CrossRef]
- Sugiarto, A.; Lee, C.W.; Huruta, A.D. A Systematic Review of the Sustainable Campus Concept. Behav. Sci. 2022, 12, 130. [Google Scholar] [CrossRef] [PubMed]
- Li, X.; Tan, H.; Rackes, A. Carbon footprint analysis of student behavior for a sustainable university campus in China. J. Clean. Prod. 2015, 106, 97–108. [Google Scholar] [CrossRef]
- Ocloo, D.M.; Mizunoya, T. Carbon Storage and Land Use Dynamics in Ghanaian University Campuses: A Scenario-Based Assessment Using the InVEST Model. Land 2025, 14, 1987. [Google Scholar] [CrossRef]
- Lauren, E.D.; Arash, Z.; Joseph, T.K., Jr. A critical review of the effectiveness of the Sustainability Tracking, Assessment & Rating System (STARS) framework on campus sustainability. In Proceedings of the Building Simulation 2021: 17th Conference of IBPSA, Bruges, Belgium, 1–3 September 2021; pp. 629–635. [Google Scholar]
- Naji, S.; Gwilliam, J. A review of exploring collaboration and learning about climate change adaptation in BREEAM Communities. Tech. Rom. J. Appl. Sci. Technol. 2020, 2, 21–32. [Google Scholar] [CrossRef]
- Wu, P.; Song, Y.; Hu, X.; Wang, X. A Preliminary Investigation of the Transition from Green Building to Green Community: Insights from LEED ND. Sustainability 2018, 10, 1802. [Google Scholar] [CrossRef]
- Franchini, C.; Biasini, B.; Rosi, A.; Scazzina, F. Best practices for making the university campus a supportive environment for healthy and sustainable diets. Curr. Opin. Environ. Sci. Health 2023, 32, 100436. [Google Scholar] [CrossRef]
- Ma, B.; Bashir, M.F.; Peng, X.; Strielkowski, W.; Kirikkaleli, D. Analyzing research trends of universities’ carbon footprint: An integrated review. Gondwana Res. 2023, 121, 259–275. [Google Scholar] [CrossRef]
- Rugani, B.; Osset, P.; Blanc, O.; Benetto, E. Environmental Footprint Neutrality Using Methods and Tools for Natural Capital Accounting in Life Cycle Assessment. Land 2023, 12, 1171. [Google Scholar] [CrossRef]
- Wang, G.; Luo, T.; Luo, H.; Liu, R.; Liu, Y.; Liu, Z. A comprehensive review of building lifecycle carbon emissions and reduction approaches. City Built Environ. 2024, 2, 12. [Google Scholar] [CrossRef]
- Dawodu, A.; Dai, H.; Zou, T.; Zhou, H.; Lian, W.; Oladejo, J.; Osebor, F. Campus sustainability research: Indicators and dimensions to consider for the design and assessment of a sustainable campus. Heliyon 2022, 8, e11864. [Google Scholar] [CrossRef]
- Fenner, A.E.; Kibert, C.J.; Woo, J.; Morque, S.; Razkenari, M.; Hakim, H.; Lu, X. The carbon footprint of buildings: A review of methodologies and applications. Renew. Sustain. Energy Rev. 2018, 94, 1142–1152. [Google Scholar] [CrossRef]
- Liu, F.; Tait, S.; Schellart, A.; Mayfield, M.; Boxall, J. Reducing carbon emissions by integrating urban water systems and renewable energy sources at a community scale. Renew. Sustain. Energy Rev. 2020, 123, 109767. [Google Scholar] [CrossRef]
- da Silva, L.A.; Dutra, A.R.d.A.; Soares, T.C.; Birch, R.S.; Guerra, J.B.S.O.d.A. Trends in research: Carbon footprint reduction in universities as a way to achieve a green campus. Int. J. Sustain. High. Educ. 2022, 24, 584–601. [Google Scholar] [CrossRef]
- Wu, Y.; Yang, Y.; Xu, W.; Chen, Q. The Influence of Innovation Resources in Higher Education Institutions on the Development of Sci-Tech Parks’ Enterprises in the Urban Innovative Districts at the Stage of Urbanization Transformation. Land 2020, 9, 396. [Google Scholar] [CrossRef]
- Zhang, Y.-X.; Zhang, Y.-S. Spatial–Temporal Characteristics and Influencing Factors of Carbon Emission Performance: A Comparative Analysis Between Provincial and Prefectural Levels from Global and Local Perspectives. Land 2025, 14, 1146. [Google Scholar] [CrossRef]
- Chen, G.; Gong, J. Pre-Assessment Research of Regional Spatial Planning from the Perspective of Spatial Evolution. Land 2025, 14, 574. [Google Scholar] [CrossRef]
- Yu, D.; Cao, Y.; Tian, S.; Cai, J.; Fang, X. How Do Digitalization and Scale Influence Agricultural Carbon Emission Reduction: Evidence from Jiangsu, China. Land 2025, 14, 2080. [Google Scholar] [CrossRef]
- Islam, M.S.; Liu, G.; Xu, D.; Chen, Y.; Li, H.; Chen, C. University-Campus-Based Zero-Carbon Action Plans for Accelerating the Zero-Carbon City Transition. Sustainability 2023, 15, 3504. [Google Scholar] [CrossRef]
- GB/T 50378-2006; Green Building Evaluation Standard. Ministry of Construction of the People’s Republic of China: Beijing, China, 2006.
- DB12/T331-2007; Water-Saving Ecological Campus Standard. Tianjin Municipal Education Commission: Tianjin, China, 2007.
- GB/T 29117-2012; Guidelines for the Evaluation of Resource-Conserving Schools. State Administration for Market Regulation of the People’s Republic of China: Beijing, China, 2012.
- DB32/T 2946-2016; Specification for the Evaluation of Water-Conserving Schools. Jiangsu Provincial Administration for Market Regulation: Nanjing, China, 2016.
- DB11/T 1404-2017; Technical Guidelines for the Evaluation of Low-Carbon Campuses in Higher Education Institutions. Beijing Municipal Bureau of Quality and Technical Supervision: Beijing, China, 2017.
- GB/T 51356-2019; Green Campus Evaluation Standard. Ministry of Housing and Urban Rural Development of the People’s Republic of China: Beijing, China, 2019.
- DB2102/T0037-2021; Green Campus Evaluation Protocol. Dalian Housing and Urban Rural Development Bureau: Dalian, China, 2021.
- DB4403/T 144-2021; Green School Evaluation Specification. Shenzhen Municipal Bureau of Ecology and Environment: Shenzhen, China, 2021.
- T/CABEE 053-2023; Guidance on Carbon Emissions Accounting for Higher Education Institutions. China Association for Building Energy Efficiency: Beijing, China, 2023.
- Lv, Z. New Challenges in University Campus Development: Seminar on Renovation Planning for Legacy Campuses Held in Harbin. Archit. J. 1993, 11, 16. [Google Scholar]
- Zhou, F. The trend of campus construction of colleges and universities in Chinese Large cities. Mod. Urban Res. 1998, 6, 31–34+61. [Google Scholar]
- Zhang, B.; Wu, J. Reflections on University Campus Development. Mod. Univ. Educ. 1992, 2, 53–56. [Google Scholar]
- Zhang, J.; Liu, J. Thoughts on problems in new campusplan. City Plan. Rev. 2005, 3, 80–83. [Google Scholar]
- Torres-Antonini, M.; Dunkel, N.W. Green residence halls are here: Current trends in sustainable campus housing. J. Coll. Univ. Stud. Hous. 2009, 36, 10–23. [Google Scholar]
- The Central People’s Government of the People’s Republic of China. The Central Committee of the Communist Party of China on Formulating the 11th Five-Year Plan. 19 October 2005. Available online: https://www.gov.cn/ztzl/2005-10/19/content_79386.htm (accessed on 25 May 2025).
- Yuan, B.; Wang, D. Analysis of China’s Green Building Evaluation Standard. In Proceedings of the Third International Conference on Intelligent, Green Buildings and Building Energy Efficiency, Beijing, China, 26 March 2007; p. 8. [Google Scholar]
- The Central People’s Government of the People’s Republic of China. Notice of the State Council on Issuing the Comprehensive Work Plan for Energy Conservation and Emission Reduction during the Twelfth Five-Year Plan Period. 7 September 2011. Available online: https://www.gov.cn/zhengce/zhengceku/2011-09/07/content_1384.htm (accessed on 25 May 2025).
- Lv, B.; Kan, J. Research of Campus Sustainability Assessment Indicators System and Implications to China. Urban Plan. Int. 2012, 27, 44–52. [Google Scholar]
- CSUS/GBC04-2013; Evaluation Standard for Green Campus. Green Building and Energy Conservation Professional Committee of China Urban Science Research Association: Beijing, China, 2013.
- Wu, Z.; Wang, Z.; Gan, L. Research on the Development of Green Campus Evaluation Standards. Constr. Sci. Technol. 2012, 6, 52–55. [Google Scholar] [CrossRef]
- Song, Y.; Tan, H.; Zhuang, Z. Energy Audit on Campus Energy Management Mechanism. Build. Energy Effic. 2012, 40, 50–54. [Google Scholar]
- Zhang, X.; Zhong, S. Research of Traffic Planning in Campus Based on the Concept of Green Transportation: A Case Study of Tianjin University. Shanghai Urban Plan. Rev. 2018, 2, 129–134. [Google Scholar]
- Yang, Z.; Du, C. Influence of Campus Landscape on Local Thermal Environment. Chin. Landsc. Archit. 2017, 33, 88–91. [Google Scholar]
- Jia, L. Research on Waste Recycling Management in University Campuses. Master’s Thesis, Tianjin University, Tianjin, China, 2010. [Google Scholar]
- Ministry of Housing and Urban-Rural Development. Announcement by the Ministry of Housing and Urban-Rural Development on the Issuance of the National Standard ‘Green Campus Evaluation Standard’. 13 March 2019. Available online: https://www.mohurd.gov.cn/gongkai/zc/wjk/art/2019/art_17339_241758.html (accessed on 25 May 2025).
- Yang, Y.; Gao, H.; Gao, F.; Du, Y.; Maleki, P. Carbon Resilience of University Campuses in Response to Carbon Risks: Connotative Characteristics, Influencing Factors, and Optimization Strategies. Sustainability 2024, 16, 11165. [Google Scholar] [CrossRef]
- The Central People’s Government of the People’s Republic of China. Ministry of Education Notice on Issuing the Action Plan for Carbon Neutrality Science and Technology Innovation in Higher Education Institutions. 12 July 2021. Available online: http://www.moe.gov.cn/srcsite/A16/moe_784/202107/t20210728_547451.html (accessed on 25 May 2025).
- The Central People’s Government of the People’s Republic of China. Ministry of Education Notice on Issuing the Implementation Plan for Establishing a National Education System for Green and Low-Carbon Development. 26 October 2022. Available online: http://www.moe.gov.cn/srcsite/A03/moe_1892/moe_630/202211/t20221108_979321.html (accessed on 25 May 2025).
- Ding, Y.; Wang, Q.; Wang, Z.; Han, S.; Zhu, N. An occupancy-based model for building electricity consumption prediction: A case study of three campus buildings in Tianjin. Energy Build. 2019, 202, 109412. [Google Scholar] [CrossRef]
- Olivieri, L.; Caamaño-Martín, E.; Sassenou, L.-N.; Olivieri, F. Contribution of photovoltaic distributed generation to the transition towards an emission-free supply to university campus: Technical, economic feasibility and carbon emission reduction at the Universidad Politécnica de Madrid. Renew. Energy 2020, 162, 1703–1714. [Google Scholar] [CrossRef]
- Zen, I.S.; Subramaniam, D.; Sulaiman, H.; Saleh, A.L.; Omar, W.; Salim, M.R. Institutionalize waste minimization governance towards campus sustainability: A case study of Green Office initiatives in Universiti Teknologi Malaysia. J. Clean. Prod. 2016, 135, 1407–1422. [Google Scholar] [CrossRef]
- Lu, L.; Qin, W. Analysis of cross-network effect of spatial correlation of energy consumption on synergistic carbon emission reduction in Chinese cities. J. Clean. Prod. 2025, 523, 146432. [Google Scholar] [CrossRef]
- Du, Y.; Arkesteijn, M.H.; den Heijer, A.C.; Song, K. Sustainable Assessment Tools for Higher Education Institutions: Guidelines for Developing a Tool for China. Sustainability 2020, 12, 6501. [Google Scholar] [CrossRef]
- Song, K.; Liu, J.; Chen, G.; Zhong, S. Reference and Integration: Framework Construction of Assessment Standard for Green Retrofitting of Higher Education Institutions Campus. J. Hum. Settl. West China 2023, 38, 81–88. [Google Scholar] [CrossRef]
- Zhang, Z. A Study on the Impact of the Built Environment in University Campuses on Walking Activity and Its Measurement. Ph.D. Dissertation, Tianjin University, Tianjin, China, 2022. [Google Scholar] [CrossRef]
- Deng, Q. Research on the Relevance of Intensive Colleges and Universities Campus Space Form and Space Quality. Ph.D. Thesis, South China University of Technology, Guangzhou, China, 2015. [Google Scholar]
- Aghamolaei, R.; Fallahpour, M. Strategies towards reducing carbon emission in university campuses: A comprehensive review of both global and local scales. J. Build. Eng. 2023, 76, 107183. [Google Scholar] [CrossRef]
- AASHE. The Sustainability Tracking, Assessment & Rating System. 16 August 2009. Available online: https://stars.aashe.org/about-stars/ (accessed on 25 May 2025).
- AASHE. STARS Participants & Reports. 2 July 2025. Available online: https://reports.aashe.org/institutions/all-registrants/ (accessed on 24 October 2025).
- Chen, X. The Evolution of Chinese University Campus Form. Ph.D. Thesis, Tongji University, Shanghai, China, 2008. [Google Scholar]
- Ge, S. A Study of Campus Planning in Chinese Universities, 1949–1978. Master’s Thesis, Tianjin University, Tianjin, China, 2022. [Google Scholar]
- Dean, J. Democracy and Other Neoliberal Fantasies Communicative Capitalism and Left Politics; Duke University Press: Durham, NC, USA, 2009. [Google Scholar]
- Pan, W.; Li, K.; Teng, Y. Rethinking system boundaries of the life cycle carbon emissions of buildings. Renew. Sustain. Energy Rev. 2018, 90, 379–390. [Google Scholar] [CrossRef]
- Patiño, W.R.; Vlček, O.; Bauerová, P.; Belda, M.; Bureš, M.; Eben, K.; Fuka, V.; Geletič, J.; Jareš, R.; Karel, J.; et al. On the suitability of dispersion models of varying degree of complexity for air quality assessment and urban planning. Build. Environ. 2024, 264, 111892. [Google Scholar] [CrossRef]
- Findler, F.; Schönherr, N.; Lozano, R.; Reider, D.; Martinuzzi, A. The impacts of higher education institutions on sustainable development: A review and conceptualization. Int. J. Sustain. High. Educ. 2019, 20, 23–38. [Google Scholar] [CrossRef]
Disclaimer/Publisher’s Note: The statements, opinions and data contained in all publications are solely those of the individual author(s) and contributor(s) and not of MDPI and/or the editor(s). MDPI and/or the editor(s) disclaim responsibility for any injury to people or property resulting from any ideas, methods, instructions or products referred to in the content. |
© 2025 by the authors. Licensee MDPI, Basel, Switzerland. This article is an open access article distributed under the terms and conditions of the Creative Commons Attribution (CC BY) license (https://creativecommons.org/licenses/by/4.0/).