Abstract
Addressing land use carbon emissions (LUCE) is critical for mitigating climate change. Using multi-source heterogeneous data from 2010 to 2020, with Land use transition matrix and Kaya-LMDI model, this paper analyzes the spatiotemporal evolution and driving factors of LUCE on Hainan Island. The results indicate the following: (1) The study period witnessed significant land use transitions relevant to carbon stocks. Forest area (a key carbon sink) decreased substantially by 2188.74 km2, while construction land (a major emission source) expanded by 182.10 km2. (2) Consequently, total net LUCE increased by 54% over the decade. This growth was overwhelmingly driven by a 60.8% increase in carbon emissions from the expansion of construction land. (3) The driver analysis indicates that LUCE growth was significantly promoted by land finance dependence and economic development, with these effects exhibiting significant spatial heterogeneity. This study provides a scientific basis for optimizing low-carbon land use policies and offers critical insights for sustainable development in island areas.
1. Introduction
Global carbon emissions, driven by high energy consumption from sustained socio-economic development and urban expansion [1,2], have resulted in global warming. This warming poses a serious threat to sustainable development by causing severe environmental issues, such as rising sea levels, diminished biodiversity, heightened drought occurrences [3], and urban heat risk [4]. Within such emission contributors, land use and land cover change (LUCC) is acknowledged as a significant source of carbon emissions. It has accounted for roughly one-third of the total carbon emissions originating from anthropogenic activities since the Industrial Revolution [5].
Land use transition is a dynamic process, involving the adjustment and transformation of regional land use morphology and function to meet the needs of socio-economic change [6]. Land use transition theory provides a critical framework, defining the dynamic adjustment of regional land use morphology and function. Land use morphology encompasses dominant morphology, focused on quantitative and spatial structure, and recessive morphology [7]. While dominant land use/land cover change (LUCC) (e.g., cropland to construction land) are well-studied, the recessive transition is more critical. Recessive transition refers to ‘qualitative changes’ in land attributes, principally defined by three dimensions: land use input, output and intensity [8,9]. Crucially, these factors, particularly high inputs and high intensity, are directly linked to industrial structure and energy consumption, making recessive transition a key mechanism influencing the evolution of land use carbon emissions (LUCE) [10,11,12].
In China, land allocation and land use intensity are heavily influenced by regulation intervention [13]. Motivated by economic development and political promotion [14], local governments’ strategic competition directly impacts land use [15,16]. First, government-led land allocation influences the land supply structure, determining land use input and industrial structure [5], often favoring high-energy-consumption, high-emission secondary industries, which are a primary source of carbon [17]. Second, to control urban sprawl, and maximize revenue, local governments utilize institutional norms and competitive land transfer models to aggressively enhance land use intensity [18,19]. This often entails excessively enhancing the land carrying capacity [20]. This high-intensity use [21], principally construction land, which acts as the main carbon source (89.89–95.28% from 2000 to 2004 in China) [22,23,24], is inevitably associated with massive fossil energy consumption [25]. Furthermore, government preference for lower-cost newly increased construction land over redeveloping stock land [26,27], exacerbates LUCC and this high-carbon development model [28].
In the field of carbon emissions research, scholars have employed various methods, including SBM-DEA model [29], the Kaya Identity, the Logarithmic Mean Divisia Index (LMDI) decomposition method [22], and the STIRPAT model [30]. The LMDI model is frequently applied due to its distinct advantages. It can decompose influencing factors without leaving a residual term, offers high interpretability, provides unique results, and it is a mature and accessible technique [31]. Existing literature indicates that the primary factors influencing China’s LUCE include economic growth [7], technological advancement [21], rapid urbanization [18], and industrial structure [22].
However, this body of work suffers from two critical limitations. First, a crucial institutional driver, namely local government behavior, is often neglected. Since China’s 1994 tax-sharing reform, ‘land-based development’ strategies have become a primary driver of land use change. Yet, there has been scant research quantitatively exploring the impact of local government dependency on land finance on LUCE. Second, though existing studies examine LUCC and associated LUCE in mainland coastal cities, island regions remain critically understudied. Islands are ecologically sensitive frontlines directly threatened by sea-level rise [32], yet simultaneously face intense land use competition due to finite land resources [33]. This unique conflict between development pressure and ecological survival, combined with their high dependency on external energy, creates distinct LUCE driving mechanisms that mainland-based models fail to capture. Consequently, there is a lack of research estimating the spatiotemporal dynamics of LUCC-driven carbon emissions across an entire island system.
To address these limitations, Hainan Island provides an ideal case study. As China’s second largest island, it epitomizes the LUCE in ‘island’ gap identified previously. Furthermore, its accelerated urbanization since 2010 and the implementation of the Free Trade Port (HFTP) policy since 2018 have intensified development pressures. This context makes Hainan a critical nexus for examining the conflict between economic growth, local government development strategies, and carbon mitigation goals.
Therefore, this study analyzes the spatiotemporal evolution of LUCE on Hainan Island (2010–2020) and decomposes its driving factors. Methodologically, we first quantify land use conversions and their resulting carbon emissions. We then employ LMDI method based on an extended Kaya identity to analyze the drivers. The primary contribution of this paper is its incorporation of a government land finance dependency indicator into the LMDI framework. This study enriches the analytical framework of LUCE driving mechanisms by incorporating and quantifying the impact of the government development strategies.
Based on our findings, we propose targeted policy suggestions for implementing appropriate land use controls to mitigate LUCE, offering insights for Hainan and other island regions facing similar development pressures.
The remainder of this paper is organized as follows. Section 2 introduces the Materials and Methods. Section 3 presents the spatio-temporal patterns of LUCE in Hainan Island and analyses the drivers. Section 4 discusses the results and potential directions for future research. Section 5 concludes the paper with a summary of our key findings.
2. Materials and Methods
2.1. Study Area
Hainan Island covers a total land area of 33,900 square kilometers, with flat terrain on the edges and a towering central area, forming a dome-shaped mountainous terrain. The landforms include mountains, hills, plateaus, and terrace plains, creating a circular, layered topography with clear tiered structures (as shown in Figure 1). In 2020, Hainan Province’s per capita GDP was 55,131 yuan, with the secondary and tertiary sectors accounting for 19.1% and 60.4%, respectively. In the same year, the population density was 228 persons/km2, representing a 17.07% increase compared to 2010. Hainan island’s development trajectory has been significantly influenced by key national policies. In 2018, Hainan Island focused on building the HFTP and introduced institutional innovations such as tax incentives and customs supervision models, encompassing reforms in trade investment liberalization, cross-border financial services, optimization of the business environment, and ecological civilization. In 2019, China unveiled ‘the Implementation Plan for the National Ecological Civilization Pilot Zone (Hainan),’ foreseeing comprehensive ecological reforms in the southern island province. Both sustainable land use and robust ecological environmental protection are a central focus, with a clear aim to mitigate carbon emissions.

Figure 1.
The location of the study area. Map Approval No.: GS(2024)0650. Note: Based on the standard map from the Standard Map Service System, Ministry of Natural Resources of the People’s Republic of China. The base map is unmodified. (The same applies below).
2.2. Data Source
The land cover maps from 1990 to 2020 were derived from the China Land Cover Dataset (CLCD), provided by [34]. The overall accuracy of CLCD reached 79.31% based on 5463 visually interpreted samples. The dataset was processed using ArcGIS version 10.8 software. The energy consumption quantities, permanent resident population, GDP, and gross output value of various industries in Hainan Province are sourced from the Hainan Statistical Yearbook (2011–2021). The energy carbon emission coefficients are sourced from the China Energy Statistical Yearbook. The electricity carbon emission coefficient for Hainan Province is sourced from the Research on China’s Power Grid CO2 Emission Factors.
2.3. Methods
2.3.1. LUCC Calculation
This study utilizes the land use transfer matrix to assess the dynamics of land use transitions on Hainan Island during the 2010–2020 period. This methodological approach enables a dual-perspective analysis of LUCC patterns. Initially, it clarifies the composition and spatial distribution of each LUCC category at a specific point in time. Subsequently, it meticulously tracks the ‘from-to’ conversions, detailing the quantity of land that transitioned from a baseline category to a terminal one. This permits a comprehensive evaluation of the structure and trajectory of conversions among different LUCC types. Moreover, to investigate the intensity of these changes, the Dynamics Degree is incorporated. This metric quantifies the rate of spatial transformation for individual LUCC types within a specific timeframe, which helps in understanding their prospective trajectories.
2.3.2. LUCE Calculation
The calculation function for LUCE of cultivated land, forest land, grass land and unused land is as follows [35]:
where Cub,i is the LUCE except for built-up land, and Si,j is the area of the jth land type in region i, is the carbon emission/absorption coefficient of the jth Land use type. The coefficients of each land use type are shown in Table 1. Drawing upon the study by [36], represents the carbon emission coefficient for the jth land use type, where positive values indicate emissions and negative values indicate sequestration.

Table 1.
Carbon emission coefficient of land use type (kg·m−2·a−1).
The calculation of built-up land was obtained by multiplying the built-up land area and carbon source/sink coefficients. With reference to previous studies [35], the formula is as follows:
where Cb,i is the carbon emissions of built-up land in region i, and is the carbon source/sink coefficient, respectively, the value is 56.46 t/(hm2·a) and 2.38 t/(hm2·a) [1].
Based on Equations (1) and (2), the total LUCE (Ci) of region i were calculated as follows:
2.3.3. Kaya-LMDI Model
Kaya identity was initially proposed by Kaya (1989) [40]. The term indicates the impact of the relevant human driving forces on carbon dioxide emissions, including economic, social, and environmental elements from human activity. The original Kaya identity combines carbon emissions with energy, population levels, and economic size to quantify the comparative effects of the main factors of CO2 emissions in human production and life. In this paper, we decompose the factors influencing LUCE based on the modified equation of Kaya’s identity as: Population size (POPi,t), Economic growth (Gpc,i,t), Fiscal Leverage (Fgdp,i,t), land finance dependency (Flis,i,t) and carbon intensity of land conveyance revenue (Clcr,i,t).
where Ct is the total CO2 emissions from the energy use in Hainan Island of the given year t; POPi,t stands for the total population at the year-end of the year t; GDP is the; Fisi,t is the general public budget Revenue of region i; LCR refers to the state-owned land conveyance revenue. The simplified expression is shown in Equation (5).
After the extended Kaya identity was established, it was decomposed in this study using the LMDI methodology. The aim was to explore the effects of the five indicators on the LUCE. The LMDI additive decomposition of the carbon footprint change ΔC over the period 0–t is shown in Equation (6):
where Ct and C0 are the total LUCE in the year t and base year 0, respectively. , , , , indicates the driving factors of LUCE. In specific, indicates the population effect, is the economic effect, refers to the fiscal leverage effect, is the land finance dependency effect, and measures the carbon intensity effect.
The individual effects for a total of N regions in Hainan Island are calculated as follows:
3. Results
3.1. Characteristics of LUCC
From 2010 to 2020, Hainan Island’s LUCC matrix reveals two dominant, concurrent trends: a major agricultural shift and significant urban expansion (Table 2). The most substantial transition observed was the conversion of Forest to Cropland (3276.40 km2), which, despite a partial reverse flow, resulted in a stark net loss of Forest (2188.75 km2) and a corresponding net gain in Cropland (2132.96 km2). Simultaneously, Built-up land experienced a net increase of 182.11 km2, indicating rapid urbanization. Critically, this urban growth was primarily fueled by the encroachment upon agricultural land, with the conversion of Cropland accounting for 138.88 km2, or 72.6%, of all new built-up areas. These dynamics, alongside net reductions in water bodies and Grassland, highlight a landscape under dual pressure, where urban development directly competes with and displaces essential agricultural land. However, this change was not linear. in the 2012–2014, a large-scale conversion from forest to cropland occurred, amounting to 1282.82 km2, primarily in the northern and western areas. According to Table 3, the 2018–2020 period was the most dynamic phase of LUCC within the decade, accounting for 1899.63 km2, or nearly 40%, of the total transitions observed since 2010. This intensification was defined by two critical and conflicting trends. First, urbanization accelerated to its decadal peak, with new Built-up land expanding by 78.15 km2. Critically, this urban growth became disproportionately reliant on agricultural land, as a stark 87.4% of this new development was sourced directly from Cropland. Concurrently, the landscape’s primary dynamic remained the large-scale mutual conversion between Forest and Cropland. This confluence peak urbanization encroached heavily on cropland, while cropland itself was simultaneously expanding by clearing forests, highlighting an acute escalation of land use competition and resource pressure on Hainan Island during this final period.
Table 2.
Land use transition matrix (excluding unchanged areas) of Hainan Island (2010–2020) (km2).
Table 3.
Land use transition matrix (excluding unchanged areas) of Hainan Island (2018–2020) (km2).
Spatially, this new development was not widespread but highly concentrated in specific coastal and urban-adjacent zones, particularly the northern districts of Haikou (Longhua, Meilan, Xiuying), northern Chengmai County, and key coastal urban areas in Sanya (Figure 2).
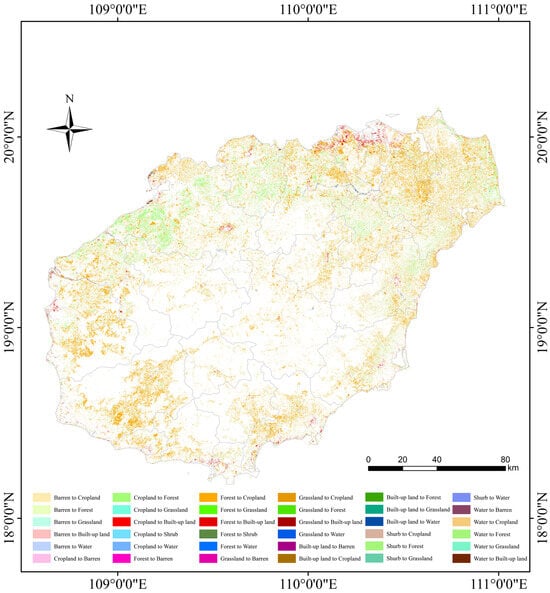
Figure 2.
LUCC of Hainan Island during 2010~2020.
3.2. Characteristics of LUCE
3.2.1. LUCE in Hainan Island
Overall, total LUCE in Hainan Island increased from 2010 to 2020, rising from 22.01 million t in 2010 to 33.91 million t in 2020 (Table 4). This represents an increase of 11.89 million t (a 54% growth rate relative to 2010). Although the highest growth rate occurred during the 2010–2012 period, the peak total emissions were recorded in 2020. Built-up land was the primary source of carbon emissions, with its contribution trending upward annually. During 2010~2020, its share of total emissions was 80.9%, 83.3%, 83.2%, 84.7%, and 84.5%. Consequently, driven by urbanization, carbon emissions from built-up land in 2020 were 60.8% higher than in 2010. On the sink side, forests were the dominant component, consistently accounting for 97.6% of all carbon sequestration during these periods. Although Hainan Island possesses extensive forests, its total absorption capacity decreased annually. Over the decade, total sequestration fell by 1.20 million t (a 9.2% reduction). Analysis indicates this decline is primarily attributable to the reduction in forest area. Concurrently, the net absorption from water bodies and grassland also showed a decreasing trend.
Table 4.
LUCE of Hainan Island during 2010–2020(104 t).
Based on an analysis of net land use carbon emissions from 2010 to 2020, municipalities on Hainan Island can be classified into three distinct categories. First, five municipalities, that is Wuzhishan City, Tunchang County, Qiongzhong, Baoting, and Baisha, successfully maintained a carbon-neutral (net sink) status throughout the decade. It is noteworthy, however, that Tunchang County’s net sink capacity diminished to −0.0702 million t by 2020, indicating that its neutral status may be compromised if current trends continue. Second, two counties transitioned from net sinks to net emitters, driven by urbanization: Ding’an County in 2012 and Ledong County in 2016, implying their local sequestration capacity is no longer sufficient to offset local emissions. Third, eleven regions were persistent net carbon sources, including Haikou, Sanya, Wenchang, Qionghai, Wanning, Chengmai, Lingao, Danzhou, Dongfang, Lingshui, and Changjiang. Among these, Haikou, Danzhou, and Sanya consistently ranked as the top three net emitters. Over the decade, Haikou’s net LUE increased by 3.70 million t (69.49%), Sanya’s by 1.60 million t (110.01%), and Danzhou’s by 0.40 million t (14.44%). This comparison indicates that while Haikou experienced the largest absolute growth in LUCE, Sanya’s development led to the most significant proportional increase, whereas Danzhou’s LUCE, though high, remained relatively controlled.
3.2.2. Spatial Variations in LUCE on Hainan Island
Regarding the overall temporal trend, the net LUCE in Hainan Island exhibited a significant and continuous upward trajectory during the 2010–2020 research period. The total regional net emissions escalated from 8.90.63 million t in 2010 to 22.00 million t in 2020, marking a 147% increase over the decade. This development clearly indicates that the LUCC process within the region is characterized by an intensified carbon release. Consequently, the net carbon source effect of the regional land use system is being continuously reinforced, which undoubtedly heightens the pressure on the region to meet its peak carbon and carbon neutrality objectives.
Net LUCE of Hainan Island in County-level is shown in Figure 3. In terms of spatial differentiation, the region’s LUCE exhibited high heterogeneity, with a distinct polarization between carbon sources and sinks. Major carbon sources were highly concentrated in the economically developed and rapidly urbanizing northern and southern coastal cities. Based on 2020 data, for instance, the three largest net emission areas were Haikou (9.03 million t), Danzhou (3.39 million t), and Sanya (3.05 million t). Conversely, major carbon sinks were predominantly distributed in the central mountainous regions, characterized by intact ecosystems and high forest coverage. These are represented by Qiongzhong (−1.03 million t), Baisha (−0.71 million t), and Wuzhishan (−0.35 million t), which play a critical role in maintaining the regional carbon balance. This distribution clearly reflects a co-existing spatial pattern of ‘high-carbon-source economic zones’ and ‘strong-carbon-sink ecological cores.’

Figure 3.
Net LUCE of Hainan Island in County-level.
Finally, a dynamic trend analysis of key regions reveals an alarming phenomenon: a divergent and deteriorating trend between carbon source and sink areas. Major source areas, represented by Haikou and Sanya, experienced continuously climbing net emissions during the study period (e.g., Haikou increased from 5.33 million t in 2010 to 9.03 million t in 2020). Meanwhile, the carbon sequestration capacity of core sink areas, such as Qiongzhong and Baisha, was simultaneously weakening (e.g., Qiongzhong’s sequestration capacity decreased from −1.28 million t to −1.03 million t), as evidenced by the declining absolute value of the negative figures. This ‘source-increase, sink-decrease’ scissors effect is presumed to be the primary driver of the overall regional net LUCE growth. The underlying reasons are hypothesized to be twofold: in the source areas, rapid urbanization and the expansion of construction land led to substantial carbon releases; conversely, the sink areas may be experiencing reduced sequestration efficiency due to factors such as forest ecosystem degradation, forest land conversion, or aging stand structures.
3.2.3. Spatial Autocorrelation of LUCE in Hainan Island
The LISA (Local Indicators of Spatial Autocorrelation) cluster map (Figure 4) reveals distinct spatial patterns in land use carbon emissions across the study periods. High-High (H-H) clusters, indicating hotspots of high LUCE, were primarily concentrated in Haikou City; these hotspots were initially centered in Xiuying District before shifting to Longhua District in later periods, confirming Haikou as the dominant emission area. Conversely, stable Low-Low (L-L) clusters, representing areas of low emissions, were consistently located in the central municipalities of Wuzhishan City and Qiongzhong Li Automous County. Additionally, Low-High (L–H) outliers, which represent low-emission districts surrounded by high-emission neighbors, were mainly identified in the northern part of the island, specifically in Lingao County and Meilan District.

Figure 4.
LISA map of LUCE for Hainan Island (2010 and 2020).
3.3. Analysis on Driving Factors of LUCE
Based on LUCE data for Hainan Island from 2010 to 2020, the contribution of each influencing factor to the changes in net carbon emissions was quantified using the Kaya Identity and the LMDI model. The results of this decomposition analysis are presented in Table 5.
Table 5.
Cumulative contribution of LUCE driving effects in Hainan Island 2010–2020.
Economic growth and population growth were identified as persistent drivers of LUCE. Throughout the 2010–2020 period, both factors consistently made positive contributions (Figure 5). Economic growth emerged as the most significant and stable driver; its contribution (e.g., 6.19 million t during 2010–2012) substantially exceeded all other factors, identifying economic growth as the core determinant of LUCE. This finding is consistent with the region’s major development policies. The 2010 ‘International Tourism Island’ initiative spurred extensive tourism-related infrastructure and real estate development, directly coupling economic growth with land urbanization and its associated emissions. Subsequently, the 2018 ‘Free Trade Port’ initiative stimulated a new wave of economic development while simultaneously attracting high-end industries and talent. In sharp contrast, the population growth effect exhibited a stark spatial polarization. Contributions were overwhelmingly concentrated in the two core gateways, Haikou (66.266) and Sanya (23.836).

Figure 5.
Cumulative effect of each influencing factor from 2010 to 2020.
The fiscal leverage effect predominantly acted as a carbon emission ‘inhibitor’, though its influence was volatile. In four of the five periods, Fgdp registered negative values, indicating its dampening effect on LUCE growth, with the strongest inhibition recorded in 2018–2020 (−1.76 million t) (Figure 6). However, this factor abruptly shifted to a significant positive driver in 2012–2014 (2.77 million t), illustrating the instability of fiscal impacts on land-use carbon, likely reflecting shifts in macroeconomic priorities.
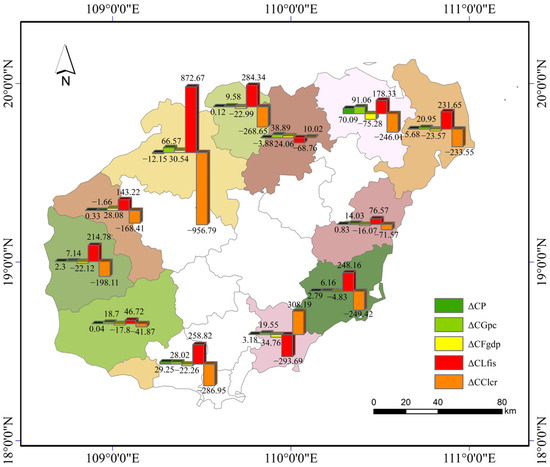
Figure 6.
Cumulative effect of each influencing factor from 2018 to 2020.
The land finance dependence effect is the pivotal factor in LUCE dynamics. It exhibited extreme fluctuations, registering the largest absolute contribution in several periods (e.g., −12.83 million t in 2012–2014; 24.11 million t in 2018–2020). While land finance dependence acted as a powerful inhibitor for most of the 2010–2018 period, it underwent a dramatic reversal after 2018, becoming the single strongest positive driver. Spatially, land finance dependence effect exhibited the most pronounced heterogeneity, emerging as the central driver of regional differentiation. Danzhou (6.53 million t) showed an exceptionally high positive contribution, identifying it as the primary ‘hotspot’ for land-finance-driven emissions. In period 2018–2020, land finance dependence effect in Haikou and Sanya were 1.68 million t and 2.11 million t, respectively.
The land finance carbon intensity effect emerged as the primary, policy-driven offset to land finance dependence. This inverse, ‘mirror-image’ relationship was evident in both temporal dynamics and spatial distribution. Temporally, the volatility of land finance dependency directly mirrored that of land finance dependence. This pattern culminated in the 2018–2020 period, when the immense positive emissions impact from land finance dependence effect (24.11 million t) was fully negated by the decade’s single strongest inhibitory effect from land finance carbon intensity effect (−26.21 million t). Spatially, this dynamic was starkest in development hotspots; the very regions with the highest land finance dependency driven emissions also exhibited the strongest corresponding inhibitory effects. For instance, Danzhou registered an and finance dependency impact of 6.53 million t, which was met by a powerful land finance carbon intensity inhibitory effect of −7.13 million t.
4. Discussion
This study investigated the spatiotemporal evolution and driving mechanism of LUCE. While earlier studies have explored the impact of LUCC on LUCE, they have not explicitly addressed the influence of governments’ intervention on LUCE, and less pay attention to coastal areas especially Island region.
The significant increase in net LUCE (2.47 times) between 2010 and 2020 underscores the mounting pressure of development on Hainan’s carbon balance. This trend is driven by two parallel processes: significant forest loss, which reduced the carbon sink, and the rapid expansion of built-up land, which increased carbon sources. Crucially, the decline in forest area was primarily driven by the synergistic effects of rapid urbanization and the Cropland Requisition-Compensation Balance policy. To offset high-quality cropland lost to urban expansion, marginal lands, including shrublands and sparse forests, were reclaimed for agriculture under Requisition-Compensation mandates. Additionally, following the International Tourism Island strategy and the subsequent establishment of the HFTP, the expansion of coastal tourism infrastructure and real estate encroached upon coastal vegetation, directly converting forest lands into impervious surfaces. Consequently, a land use cascade was observed where forest land was displaced by cropland and built-up land, while existing cropland was further encroached upon by urbanization.
The dominance of economic growth as a driver aligns with broader literature on GDP and carbon emissions [41,42]. However, our findings uniquely highlight the role of policy-driven development initiatives. While the contribution of the economic growth effect has diminished over time, Land Finance Dependence emerged as the primary driver of LUCE, especially during 2018–2020. Our quantitative analysis reveals a critical turning point, i.e., the influence of land finance on LUCE intensified significantly following the 2018 HFTP launch. Specifically, the contribution of land finance dependence surged to 24.11 million t in the post-2018 period. A plausible explanation is that the HFTP initiative generated immense demand for new infrastructure, industrial parks, and logistics hubs, triggering a wave of land-based financing to fund this construction boom. Consequently, land finance dependence transformed from an inhibitor into the most potent accelerator of LUCE. A direct consequence of these policies has been the rapid expansion of built-up land at the expense of ecological lands, converting vital carbon sinks into emission sources. Contrary to Hainan’s strict ‘quantity control’ policy aimed at limiting total construction land, our data reveals a structural surge in land consumption driven by the FTP initiative. Specifically, the annual expansion rate of built-up land skyrocketed from 14.1 km2/year during the pre-FTP period (2010–2018) to 39.1 km2/year during the FTP initiation phase (2018–2020), representing a 2.77-fold increase. This discrepancy suggests that while residential land was curtailed, Construction Land Quotas were aggressively reallocated to infrastructure and key industrial parks, thereby accelerating the physical displacement of cropland and generating a new wave of carbon emissions.
Spatially, the effects of land finance and industrial policies were concentrated in the west and north. Consistent with [43], Hainan’s development-suitable coastal zones (Haikou, Danzhou, Sanya) hosted the most intense LUCE. The increasing urbanization in Haikou and Sanya drove the conversion of cropland to built-up land, contributing significantly to net LUCE. In contrast, industrial development in Danzhou was dominated by equipment manufacturing and petrochemicals, resulting in high energy consumption per unit of land. This spatial pattern confirms that the ‘port-industry-city’ functional spaces have become the primary hotspots for regional carbon emissions.
To achieve regional carbon targets and high-quality sustainable development, policymakers must integrate physical land use management with macroeconomic strategies. This requires rigidly enforcing spatial constraints defined by China’s territorial space planning policy by strictly adhering to the Ecological Protection Red Lines, Permanent Basic Farmland Protection Red Lines, and Urban Development Boundaries to prevent the encroachment of cropland and built-up land onto forest areas. Concurrently, since economic growth is a primary driver of emissions, higher-level governance must accelerate the transition from scale-driven to innovation-driven development, using land allocation to prioritize clean industries and set high entry thresholds for high-emission enterprises. This economic shift must be supported by incentivizing land use efficiency, guiding local administrations to move beyond GDP-centric indicators. Instead, new performance metrics focused on economic quality should be implemented to promote the efficient utilization of urban construction land.
This study provides important insights into the effects of driving mechanism on LUCE. However, the diverse data sources were primarily derived from publicly published studies, the completeness of the data remained limited, which may limit the generalizability of the findings. Future studies should use more comprehensive and precise data.
5. Conclusions
Based on multi-source heterogeneous data fusion, this paper presents a comprehensive analysis of the temporal and spatial evolution and drivers of LUCE in Hainan Island.
The findings reveal that LUCE in Hainan surged by 54% between 2010 and 2020, a trend fundamentally driven by the expansion of built-up land at the expense of critical cropland and forests. While forests provided a stable carbon sink, a stark spatial divergence emerged. Carbon-neutral mountainous municipalities now stand in sharp contrast to the high-emission coastal development hubs of Haikou, Danzhou, and Sanya, where net emissions have rapidly escalated.
Crucially, the drivers of LUCE were not static but were dynamically shaped by major policy shifts. Land finance dependence was identified as the pivotal factor, dramatically reversing from an emissions inhibitor to the single strongest positive driver. This transformation coincides precisely with the 2018 HFTP policy, which appears to have triggered a surge in land-financed construction. Spatially, this effect, along with pressures from economic growth and population, was highly concentrated in coastal hubs. This concentration is linked to their geographical suitability for industrial development and their preeminent socio-economic status.
These findings suggest several implications for future research, land use policy development, and carbon reduction practices in island regions. This study’s primary contribution is its empirical demonstration of the profound influence of government intervention on LUCE drivers.
Author Contributions
Conceptualization, M.J.; methodology, B.L.; software, Y.M.; validation, H.M.; formal analysis, Y.M.; data curation, Y.M.; writing—original draft preparation, Y.M. and M.C.; writing—review and editing, M.J.; supervision, M.J.; funding acquisition, M.J. All authors have read and agreed to the published version of the manuscript.
Funding
This research was funded by the Education Department of Hainan Province, project number: Hnky2024-4; This research was supported by Humanities and Social Science Foundation of the Ministry of Education in China, grant number 25YJC630051. This research was supported by Hainan Provincial Natural Science Foundation, grant number 725QN271; This research was supported by The 2024 Hainan Provincial Philosophy and Social Science Planning Project (HNSK(JD)24-08); This research was supported by The Hainan University Start-up Funding (XJ2400002964); This research was supported by Hainan University Research Capacity Enhancement Program (DC2500002416).
Data Availability Statement
The raw data supporting the conclusions of this article will be made available by the authors on request.
Conflicts of Interest
The authors declare no conflicts of interest.
References
- Rong, T.; Qin, M.; Zhang, P.; Chang, Y.; Liu, Z.; Zhang, Z. Spatiotemporal evolution of land use carbon emissions and multi scenario simulation in the future—Based on carbon emission fair model and PLUS model. Environ. Technol. Innov. 2025, 38, 104087. [Google Scholar] [CrossRef]
- Li, L.; Zheng, Y.; Ma, X.; Ma, S.; Zuo, J.; Goodsite, M. Clear skies after the haze: How the climate policy uncertainty impacts urban resilience in China. J. Asian Public Policy 2025, 1–22. [Google Scholar] [CrossRef]
- Zou, B.; Fan, C.; Li, J.; Wang, M.; Liao, Y.; Zhou, X. Assessing the impact of land use changes on urban heat risk under different development scenarios: A case study of Guangzhou in China. Sustain. Cities Soc. 2025, 130, 106532. [Google Scholar] [CrossRef]
- Li, L.; Ma, X.; Zheng, Y.; Ma, S.; Zuo, J.; Goodsite, M. Facilitating urban green innovative efficiency from intergovernmental perspective in China. Sci. Rep. 2025, 15, 22751. [Google Scholar] [CrossRef]
- Zhu, E.; Li, W.; Chen, L.; Sha, M. Spatiotemporal coupling analysis of land urbanization and carbon emissions: A case study of Zhejiang Province, China. Land Degrad. Dev. 2023, 34, 4594–4606. [Google Scholar] [CrossRef]
- Huang, P.; Qu, Y.; Shu, B.; Huang, T. Decoupling relationship between urban land use morphology and carbon emissions: Evidence from the Yangtze River Delta Region, China. Ecol. Inform. 2024, 81, 102614. [Google Scholar] [CrossRef]
- Song, M.; Peng, C.; Liu, G.; Du, A.M.; Boateng, A. The impact of industrial land prices and regional strategical interactions on environmental pollution in China. Int. Rev. Financ. Anal. 2025, 98, 103921. [Google Scholar] [CrossRef]
- Liao, L.; Long, H.; Gao, X.; Ma, E. Effects of land use transitions and rural aging on agricultural production in China’s farming area: A perspective from changing labor employing quantity in the planting industry. Land Use Policy 2019, 88, 104152. [Google Scholar] [CrossRef]
- Wang, L.; Liang, A.; Li, X.; Jiang, C.; Wu, J.; Omrani, H. Understanding recessive transition of cultivated land use in Jilin Province, China (1990–2020): From perspective of productive-living-ecological functions. Land 2023, 12, 1758. [Google Scholar] [CrossRef]
- Shen, X.; Wu, C.; Wang, J.; Zhang, X.; Li, G. Local government competition and centralised urban growth management policy implementation: Evidence from China. J. Chin. Gov. 2024, 9, 348–371. [Google Scholar] [CrossRef]
- Cheng, Y.; Geng, X.; Tian, W. Achieving low-carbon production: Impacts of land misallocation and industrial structure in urban China. Appl. Energy 2025, 378, 124791. [Google Scholar] [CrossRef]
- Gennaio, M.; Hersperger, A.M.; Bürgi, M. Containing urban sprawl-Evaluating effectiveness of urban growth boundaries set by the Swiss Land Use Plan. Land Use Policy 2009, 26, 224–232. [Google Scholar] [CrossRef]
- Li, S.; Liu, Y.; Wei, G.; Bi, M.; He, B.J. Carbon surplus or carbon deficit under land use transformation in China? Land Use Policy 2024, 143, 107218. [Google Scholar] [CrossRef]
- Jin, Y.; Xu, Y. Carbon reduction of urban form strategies: Regional heterogeneity in Yangtze River Delta, China. Land Use Policy 2024, 141, 107154. [Google Scholar] [CrossRef]
- Xiao, R.; Yin, H.; Liu, R.; Zhang, Z.; Chinzorig, S.; Qin, K.; Tan, W.; Wan, Y.; Gao, Z.; Xu, C.; et al. Exploring the relationship between land use change patterns and variation in environmental factors within urban agglomeration. Sustain. Cities Soc. 2024, 108, 105447. [Google Scholar] [CrossRef]
- Lian, H.; Li, H.; Ko, K. Market-led transactions and illegal land use: Evidence from China. Land Use Policy 2019, 84, 12–20. [Google Scholar] [CrossRef]
- Yang, Y.; Yang, M.; Zhao, B.; Lu, Z.; Sun, X.; Zhang, Z. Spatially explicit carbon emissions from land use change: Dynamics and scenario simulation in the Beijing-Tianjin-Hebei urban agglomeration. Land Use Policy 2025, 150, 107473. [Google Scholar] [CrossRef]
- Zhou, Y.; Chen, M.; Tang, Z.; Mei, Z. Urbanization, land use change, and carbon emissions: Quantitative assessments for city-level carbon emissions in Beijing-Tianjin-Hebei region. Sustain. Cities Soc. 2021, 66, 102701. [Google Scholar] [CrossRef]
- Qi, Y.; Lin, R.; Zhu, D. Impact of rising industrial land prices on land-use efficiency in China: A study of underpriced land price. Land Use Policy 2025, 151, 107490. [Google Scholar] [CrossRef]
- Zhong, T.; Qian, Z.; Huang, X.; Zhao, Y.; Zhou, Y.; Zhao, Z. Impact of the top-down quota-oriented farmland preservation planning on the change of urban land-use in-tensity in China. Habitat Int. 2018, 77, 71–79. [Google Scholar] [CrossRef]
- Liu, C.; Hu, S.; Wu, S.; Song, J.; Li, H. County-level land use carbon emissions in China: Spatiotemporal patterns and impact factors. Sustain. Cities Soc. 2024, 105, 105304. [Google Scholar] [CrossRef]
- Jiang, P.; Gong, X.; Yang, Y.; Tang, K.; Zhao, Y.; Liu, S.; Liu, L. Research on spatial and temporal differences of carbon emissions and influencing factors in eight economic regions of China based on LMDI model. Sci. Rep. 2023, 13, 7965. [Google Scholar] [CrossRef]
- Wang, N.; Chen, X.; Zhang, Y.; Pang, J.; Long, Z.; Chen, Y.; Zhang, Z. Integrated effects of land use and land cover change on carbon metabolism: Based on ecological network analysis. Environ. Impact Assess. Rev. 2024, 104, 107320. [Google Scholar] [CrossRef]
- Wang, Y.; Fan, J.; Liu, D.; Fu, J.; Ding, L.; Zhang, J. Air pollution outcomes, land misallocation, and the transmission through urban sprawl. J. Environ. Manag. 2023, 345, 118730. [Google Scholar] [CrossRef]
- Zhou, D.; Huang, Q.; Chong, Z. Analysis on the effect and mechanism of land misallocation on carbon emissions efficiency: Evidence from China. Land Use Policy 2022, 121, 106336. [Google Scholar] [CrossRef]
- Guo, Z.; Hu, Y.; Wang, J.; Bai, Y. Has China completed the supply-side structural reform of construction land supply? Evidence from 335 cities. Habitat Int. 2025, 156, 103271. [Google Scholar] [CrossRef]
- Zhu, E.; Deng, J.; Zhou, M.; Gan, M.; Jiang, R.; Wang, K.; Shahtahmassebi, A. Carbon emissions induced by land-use and land-cover change from 1970 to 2010 in Zhejiang, China. Sci. Total Environ. 2019, 646, 930–939. [Google Scholar] [CrossRef]
- Chuai, X.; Huang, X.; Wang, W.; Zhao, R.; Zhang, M.; Wu, C. Land use, total carbon emissions change and low carbon land management in Coastal Jiangsu, China. J. Clean. Prod. 2015, 103, 77–86. [Google Scholar] [CrossRef]
- Kuang, B.; Lu, X.; Zhou, M.; Chen, D. Provincial cultivated land use efficiency in China: Empirical analysis based on the SBM-DEA model with carbon emissions considered. Technol. Forecast. Soc. Change 2020, 151, 119874. [Google Scholar] [CrossRef]
- Zhang, W.J.; Xu, H.Z. Effects of land urbanization and land finance on carbon emissions: A panel data analysis for Chinese provinces. Land Use Policy 2017, 63, 493–500. [Google Scholar] [CrossRef]
- Ang, B.W. LMDI decomposition approach: A guide for implementation. Energy Policy 2015, 86, 233–238. [Google Scholar] [CrossRef]
- Martyr-Koller, R.; Thomas, A.; Schleussner, C.F.; Nauels, A.; Lissner, T. Loss and damage implications of sea-level rise on Small Island Developing States. Curr. Opin. Environ. Sustain. 2021, 50, 245–259. [Google Scholar] [CrossRef]
- Chatterjee, U.; Majumdar, S. Impact of land use change and rapid urbanization on urban heat island in Kolkata city: A remote sensing based perspective. J. Urban Manag. 2022, 11, 59–71. [Google Scholar] [CrossRef]
- Yang, J.; Huang, X. 30 m annual land cover and its dynamics in China from 1990 to 2019. Earth Syst. Sci. Data Discuss. 2021, 13, 3907–3925. [Google Scholar] [CrossRef]
- Yu, Z.Q.; Chen, L.Q.; Tg, H.X.; Chen, L.G.; Zhang, T.; Li, L.; Yuan, L.N.; Xiao, J.; Wu, R.; Bai, L.F.; et al. Spatial correlations of land-use carbon emissions in the Yangtze River Delta region: A perspective from social network analysis. Ecol. Indic. 2022, 142, 109147. [Google Scholar] [CrossRef]
- Fan, J.S.; Yu, X.F.; Zhou, L. Carbon emission efficiency growth of land use structure and its spatial correlation: A case study of Nanjing city. Geogr. Res. 2018, 37, 2177–2192. [Google Scholar]
- Sun, H.; Liang, H.M.; Chang, X.L.; Cui, Q.C.; Tao, Y. Land Use Patterns on Carbon Emission and Spatial Association in China. Econ. Geogr. 2015, 35, 154–162. [Google Scholar]
- Fang, J.Y.; Guo, Z.D.; Piao, S.L.; Chen, A. Terrestrial vegetation carbon sinks in China, 1981–2000. Sci. China Ser. D Earth Sci. 2007, 50, 1341–1350. [Google Scholar] [CrossRef]
- Chen, H.; Zhou, S.; Wu, N.; Wang, Y.F.; Luo, P.; Shi, F.S. Advance in studies on production, oxidation and emission flux of methane from wetlands. Chin. J. Appl. Environ. Biol. 2006, 12, 726. [Google Scholar]
- Kaya, Y. Impact of Carbon Dioxide Emission Control on GNP Growth: Interpretation of Proposed Scenarios; Intergovernmental Panel on Climate Change/Response Strategies Working Group: Geneva, Switzerland, 1989. [Google Scholar]
- Liu, B.L.; Zhang, Z.K.; Ji, X.P.; Jiang, S.N.; Wei, G.E.; Zhou, K.X.; Wang, P.Y. Research on suitability evaluation of land space development and functional space allocation in coastal zone: A case study of Hainan Island. J. Nat. Resour. 2022, 37, 862–879. [Google Scholar] [CrossRef]
- Li, Y.; Chen, Y.; Wang, Y. Grey forecasting the impact of population and GDP on the carbon emission in a Chinese region. J. Clean. Prod. 2023, 425, 139025. [Google Scholar] [CrossRef]
- Lin, B.; Benjamin, N.I. Influencing factors on carbon emissions in China transport industry. A new evidence from quantile regression analysis. J. Clean. Prod. 2017, 150, 175–187. [Google Scholar] [CrossRef]


Disclaimer/Publisher’s Note: The statements, opinions and data contained in all publications are solely those of the individual author(s) and contributor(s) and not of MDPI and/or the editor(s). MDPI and/or the editor(s) disclaim responsibility for any injury to people or property resulting from any ideas, methods, instructions or products referred to in the content. |
© 2025 by the authors. Licensee MDPI, Basel, Switzerland. This article is an open access article distributed under the terms and conditions of the Creative Commons Attribution (CC BY) license (https://creativecommons.org/licenses/by/4.0/).