Spatiotemporal Dynamics and Forecasting of Ecosystem Service Value in Zhengzhou Using Land-Use Scenario Simulation
Abstract
1. Introduction
2. Materials and Methods
2.1. Study Area
2.2. Data Sources
2.3. Methods
2.3.1. Land-Use Transition Matrix
2.3.2. SSP-RCP Scenarios
2.3.3. Land-Use Demand Projection Under SSP-RCP Scenarios
2.3.4. PLUS Model
2.3.5. Calculation of ESV
- (1)
- Revision of socioeconomic coefficients
- (2)
- Revision of Biomass Coefficients
- (3)
- Revision of construction land area Coefficients
2.3.6. PLS-SEM
2.3.7. Quantifying Trade-Offs and Synergies
3. Result
3.1. Land Use/Cover Patterns
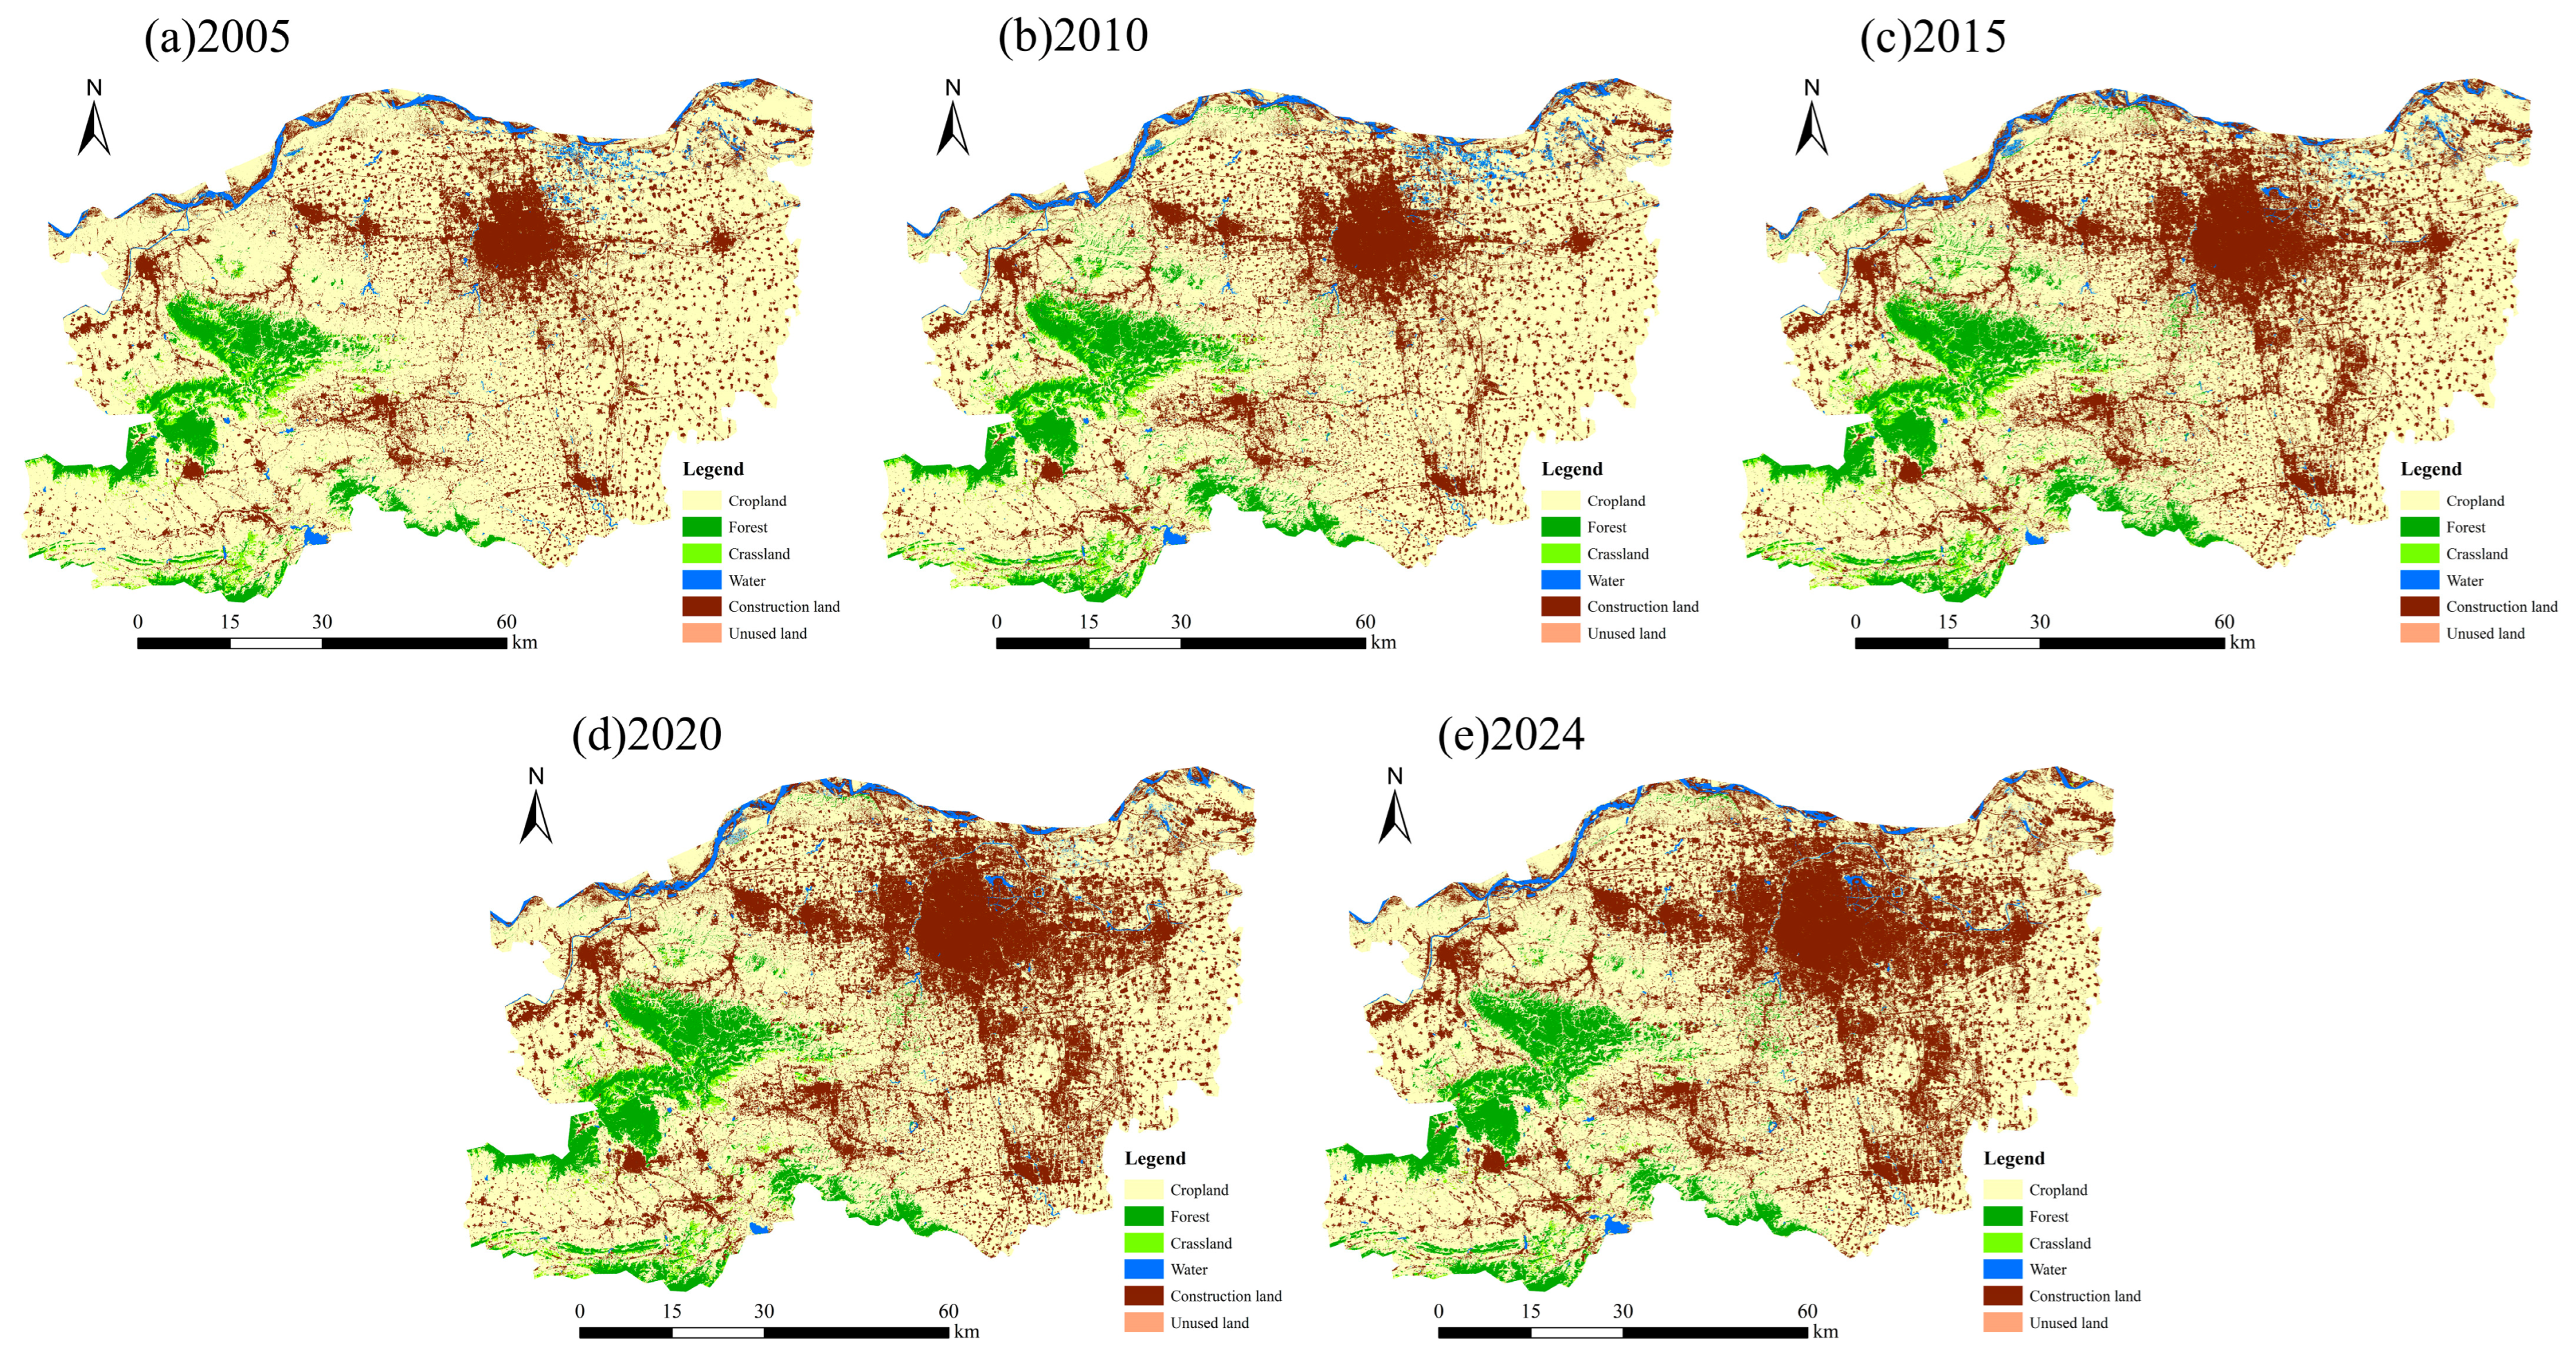
3.1.1. Changes in Land-Use Structure from 2005 to 2024
3.1.2. Land-Use Demand Projections Under the SSP-RCP Scenario
3.1.3. Spatial Distribution Simulation of Land Use Under the SSP-RCP Scenario
3.2. Characteristics of ESV Change
3.2.1. The Change in ESV from 2005 to 2024
3.2.2. Changes in the Value of ESV from 2005 to 2024
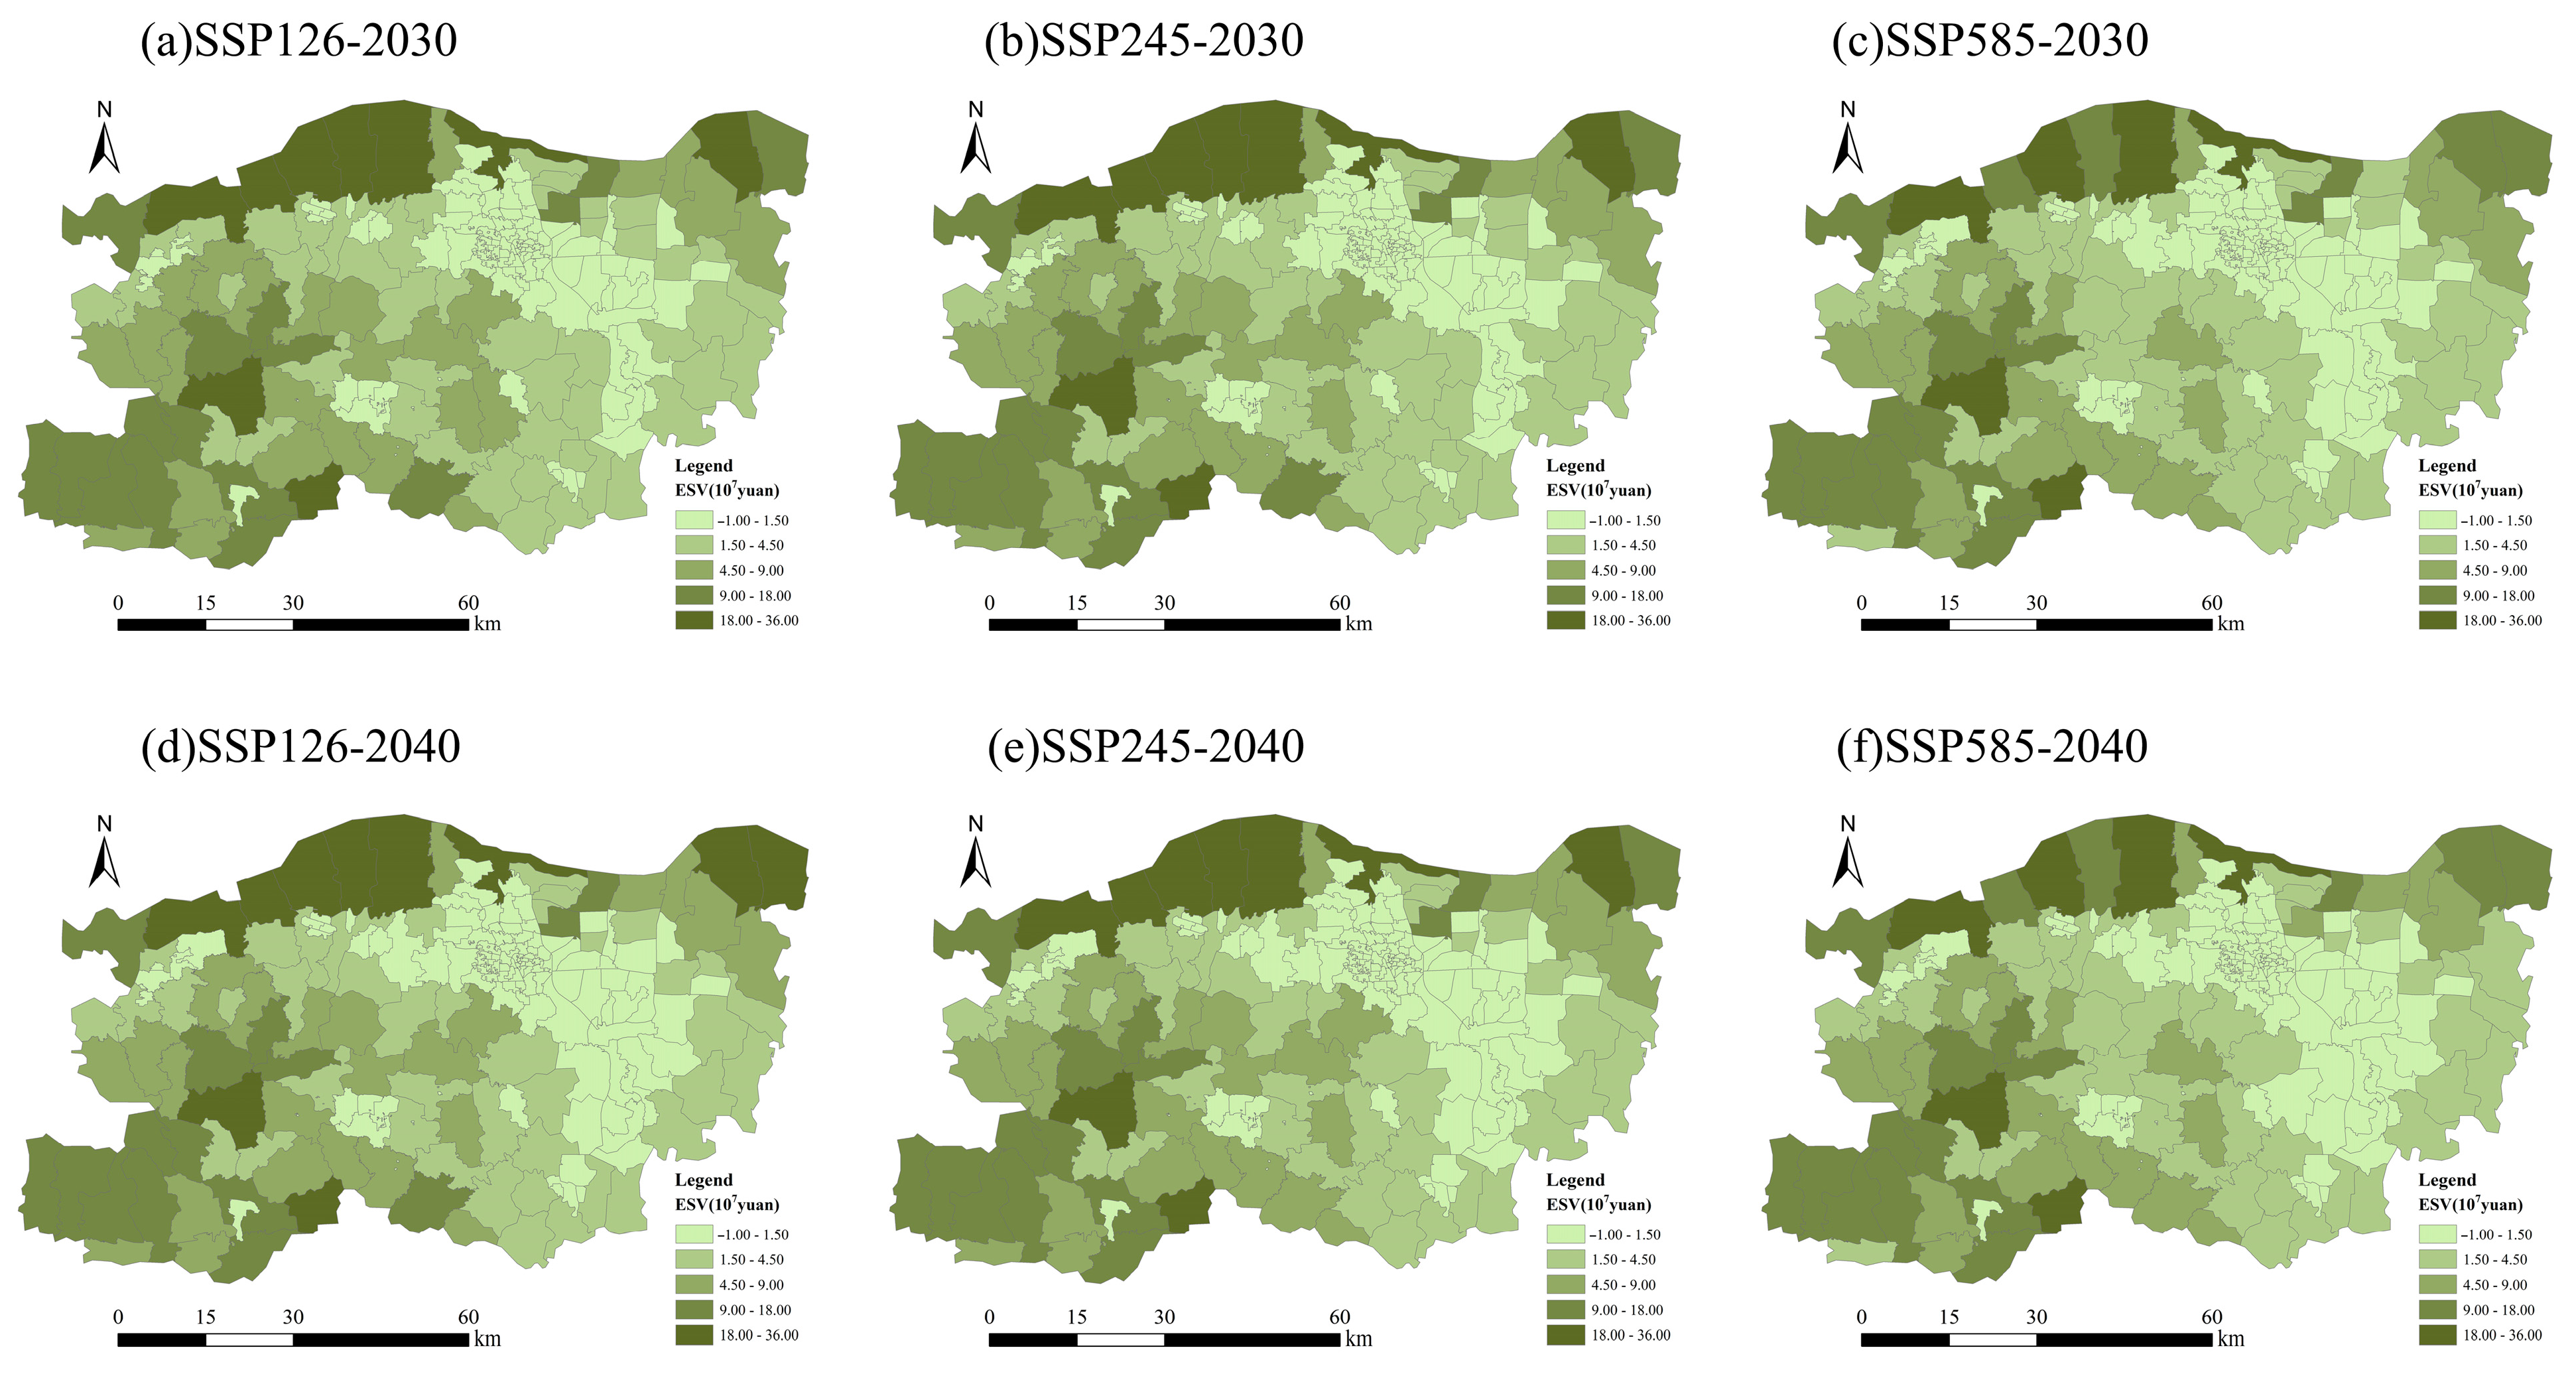
3.2.3. Changes in the Value of Different SSP-RCP Scenarios
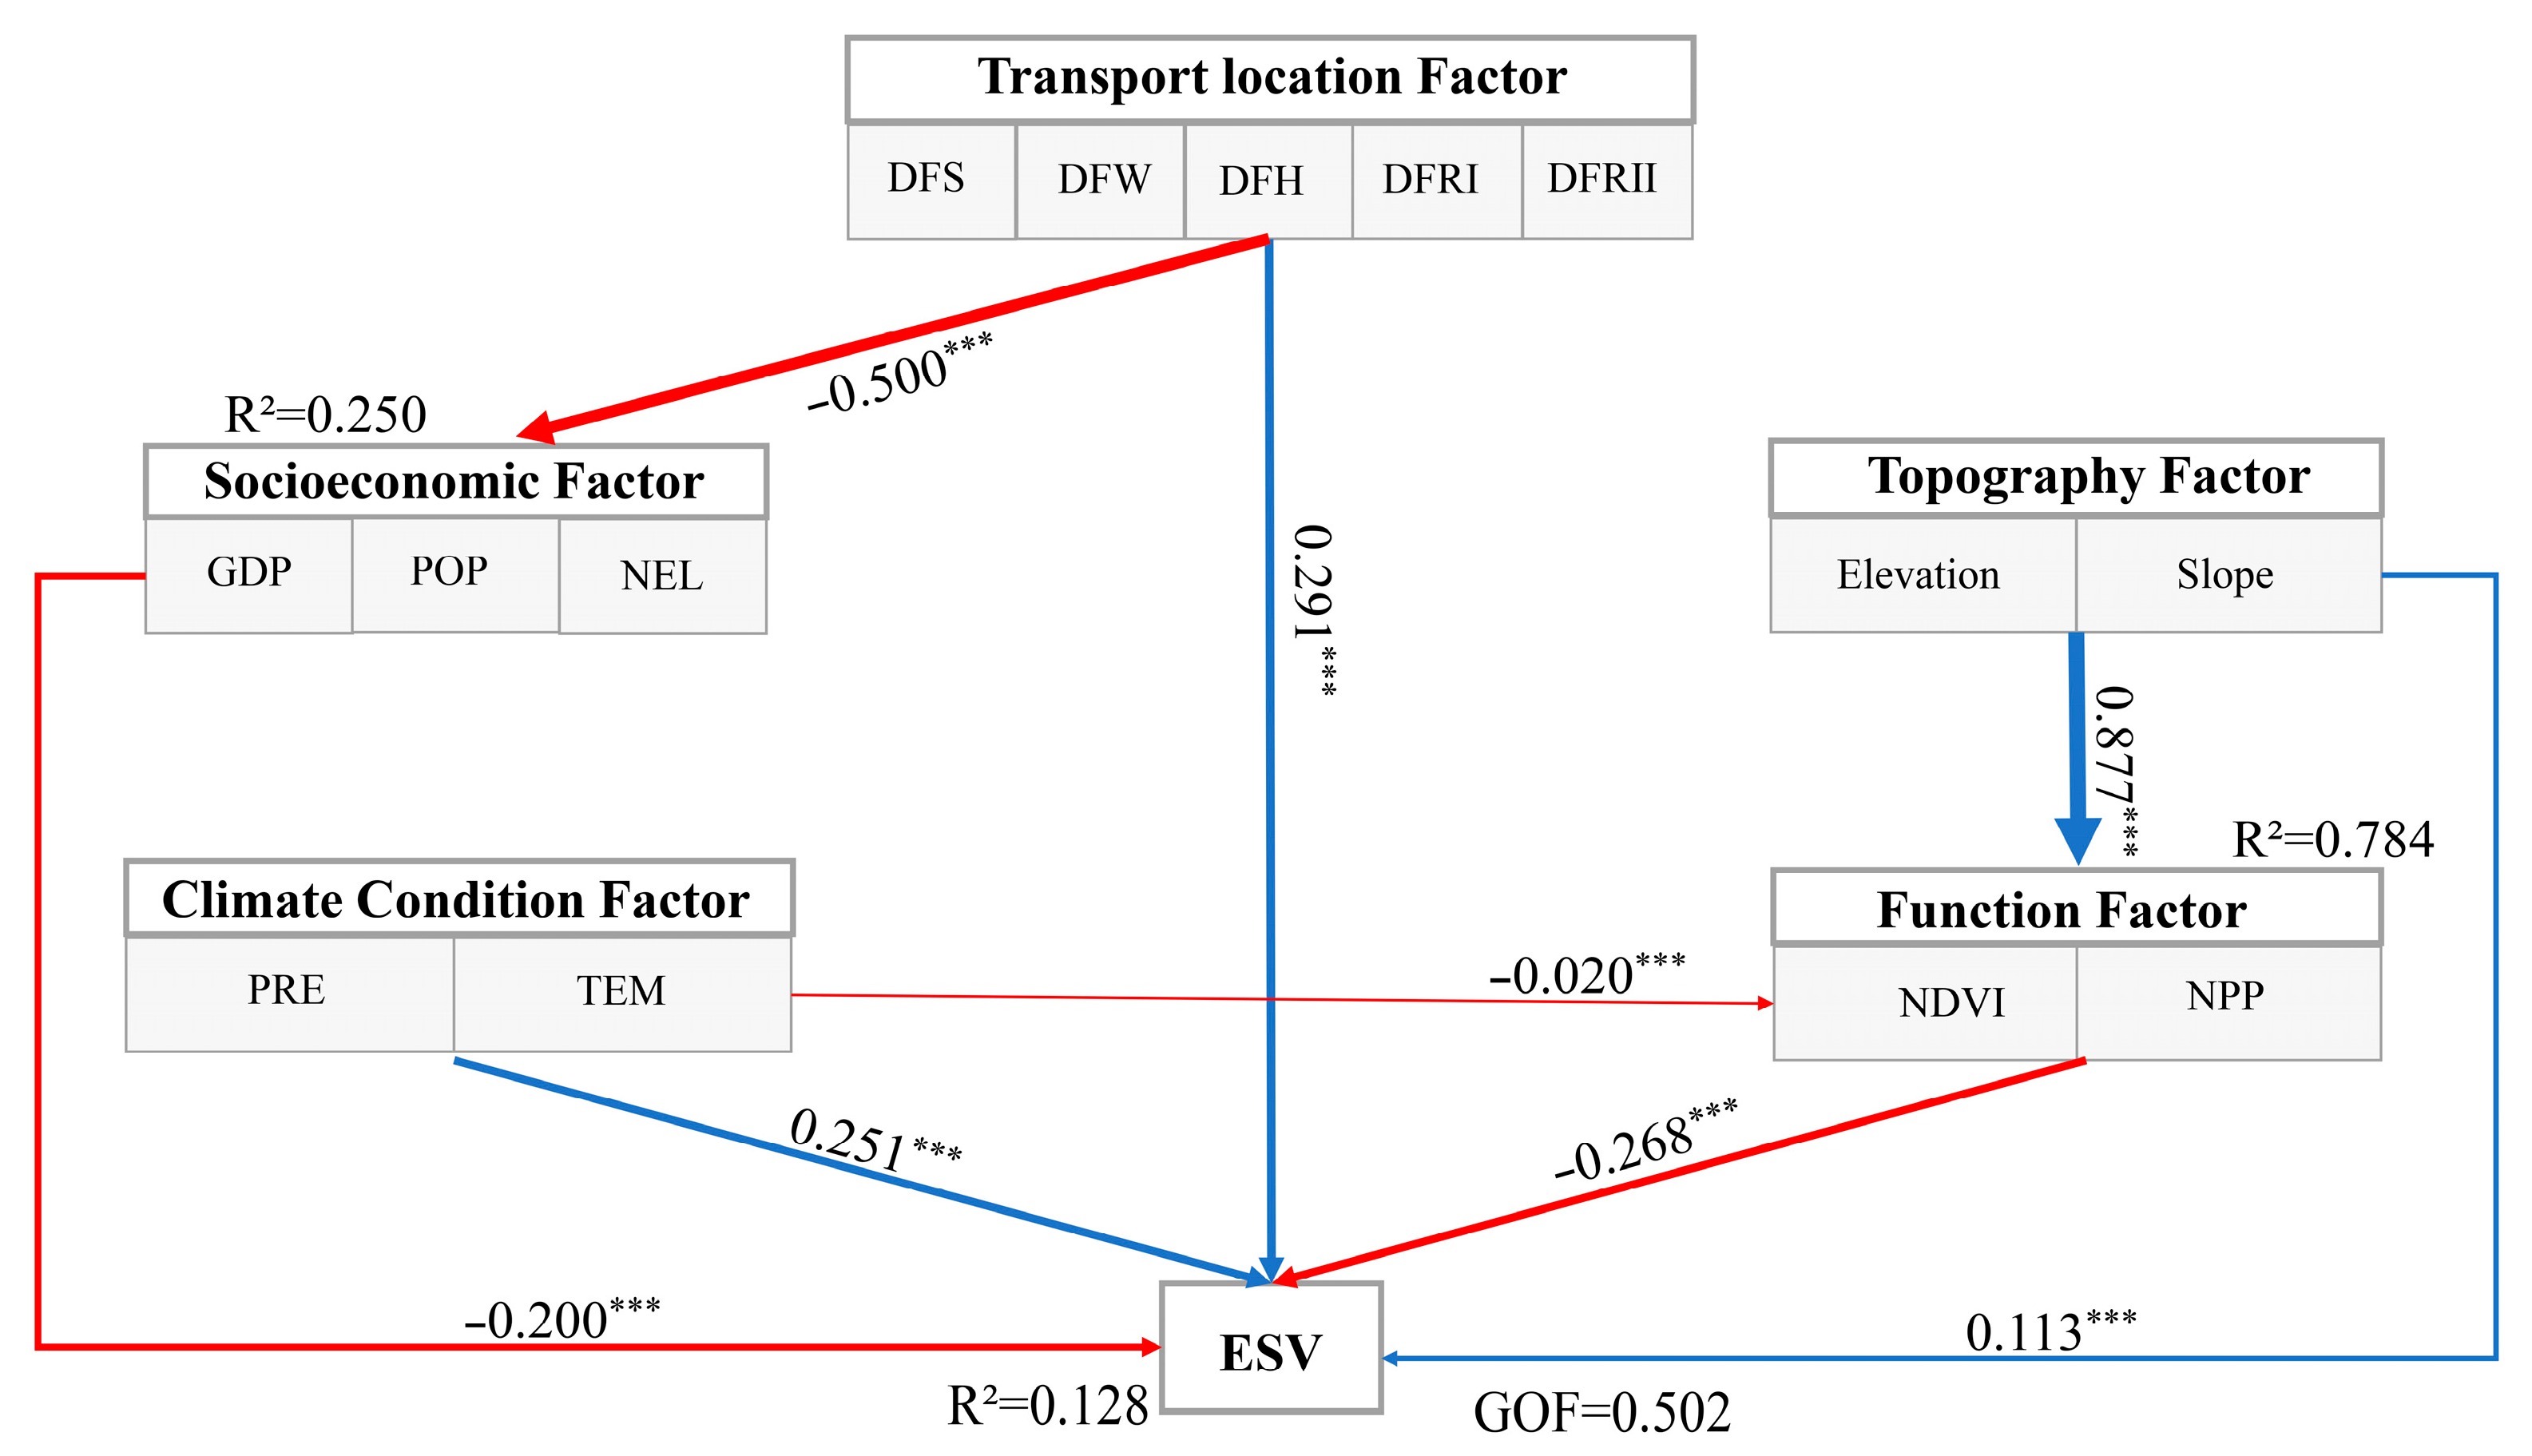
3.2.4. The Driving Mechanism of the ESV
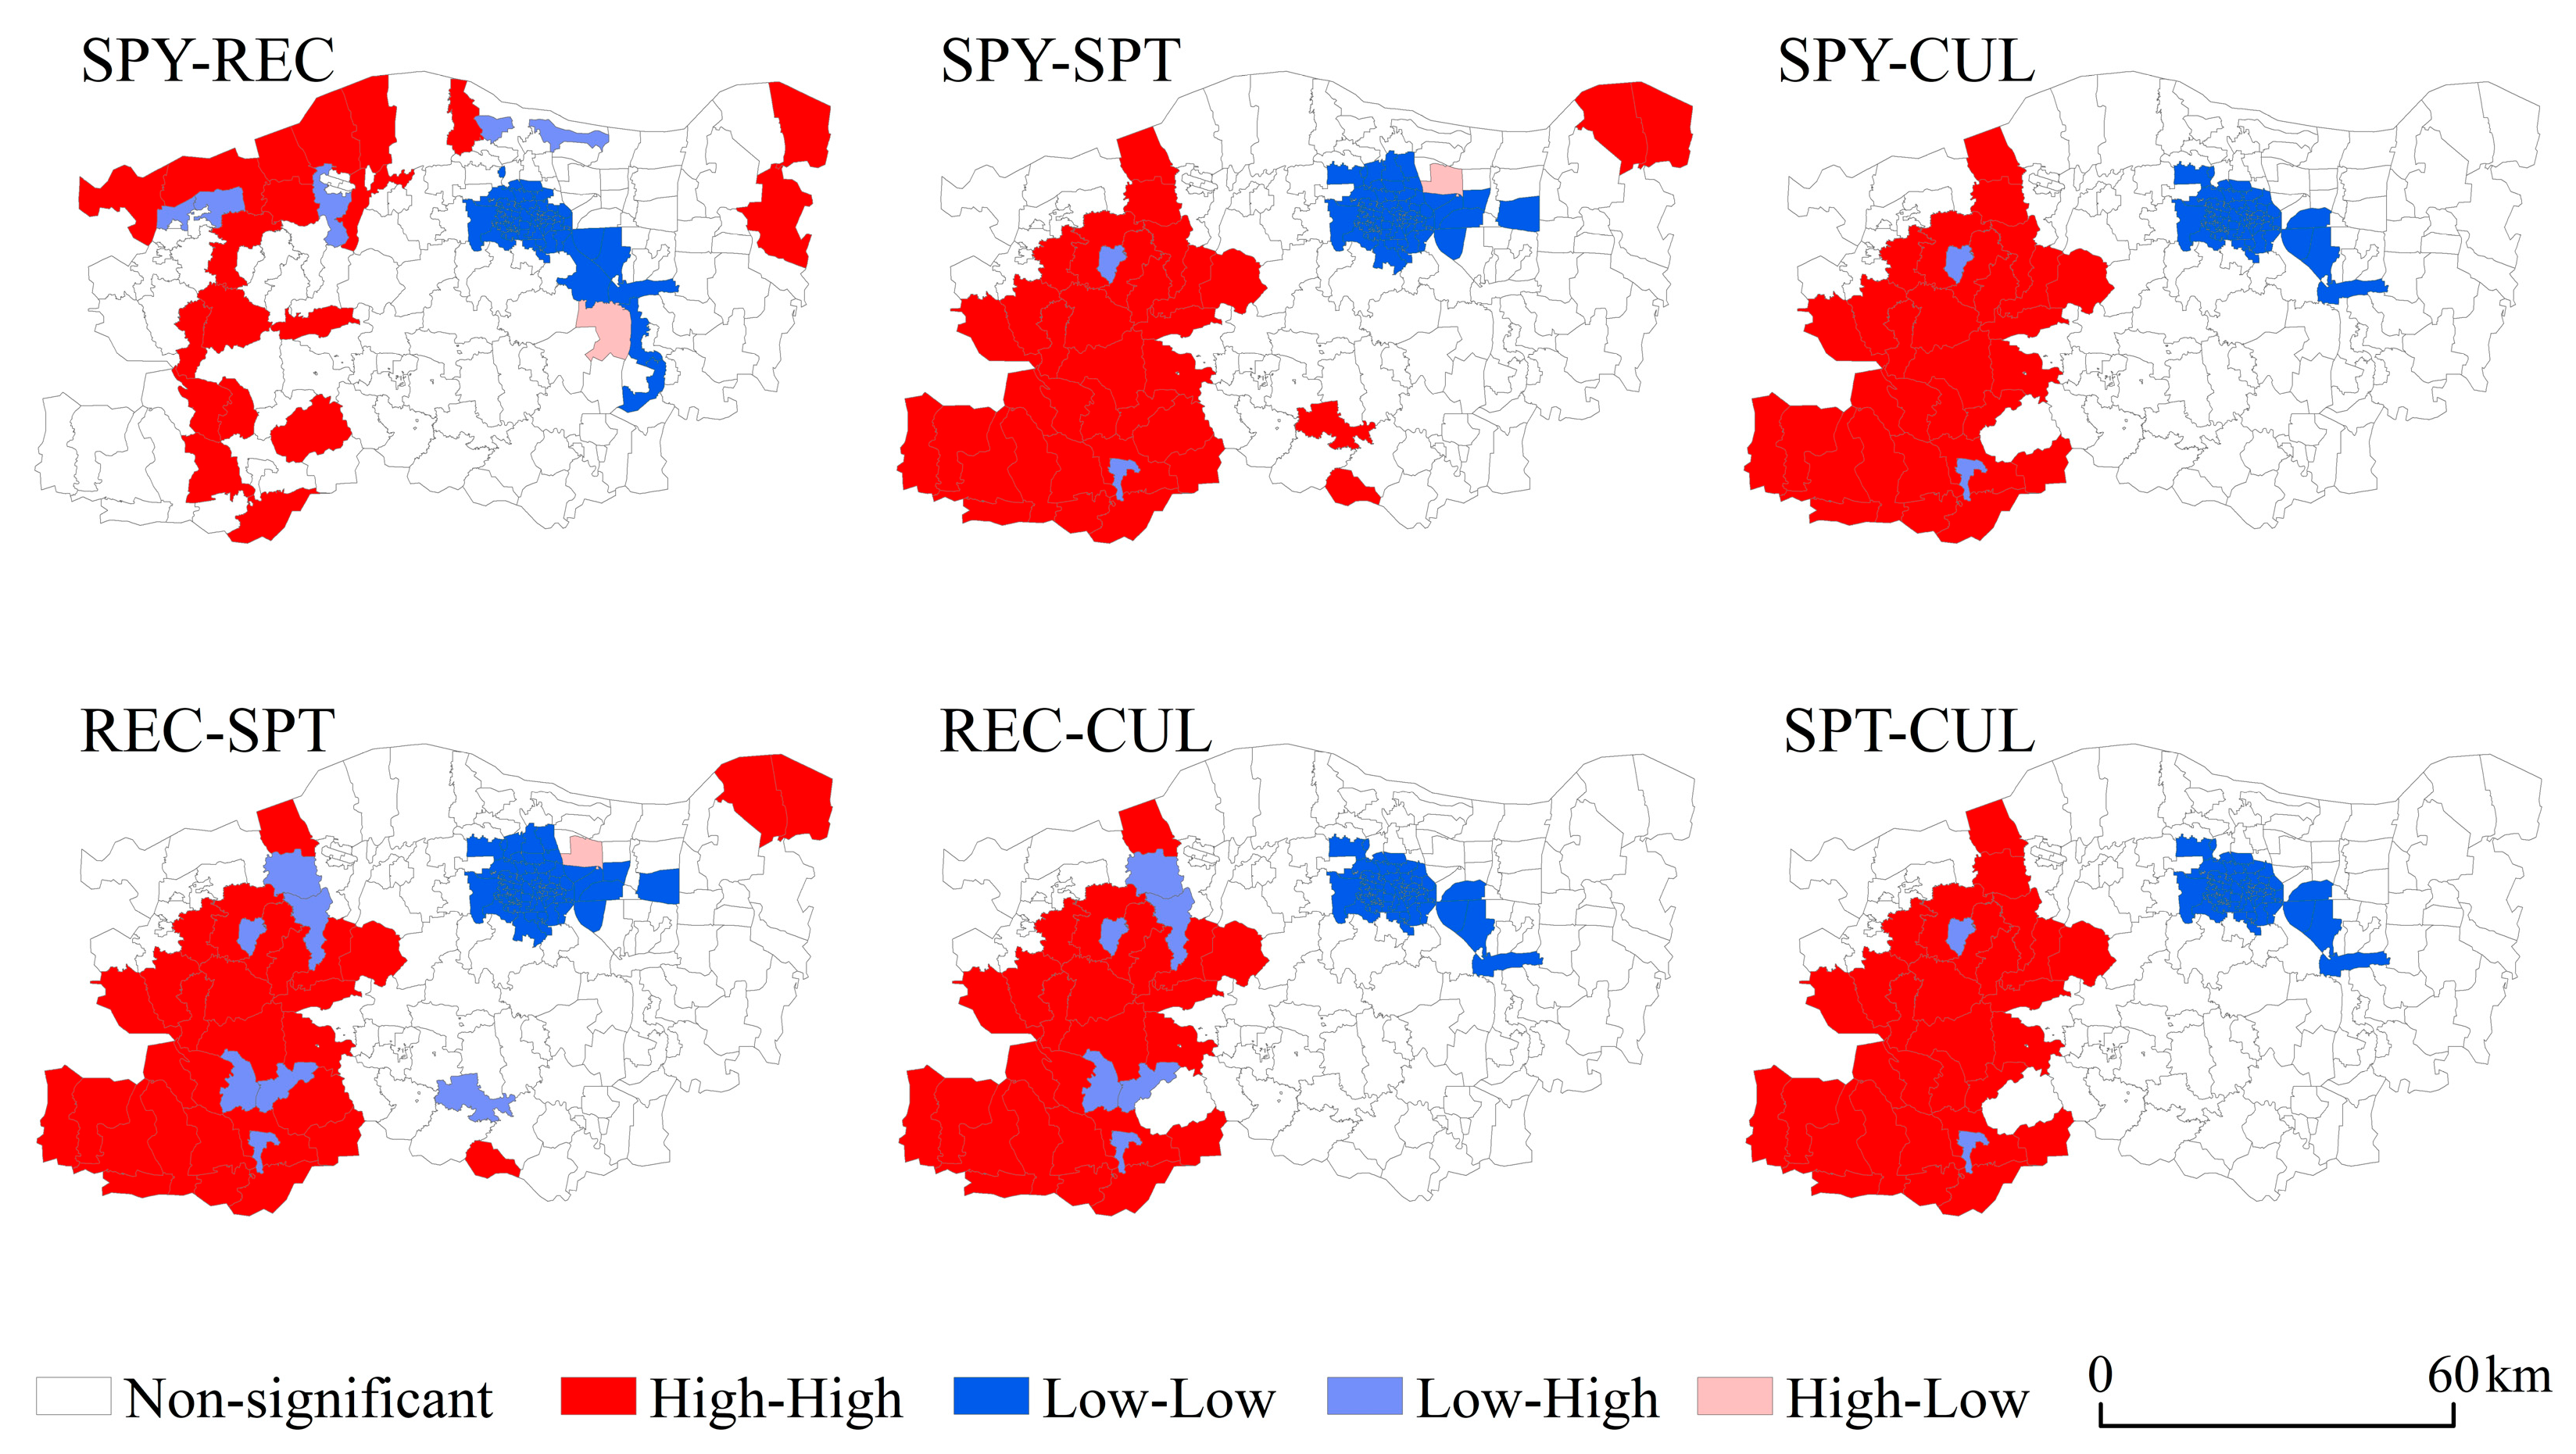
3.2.5. Assessment of Interactions Between ESV
4. Discussion
4.1. The Impact of LUCC on ESV
4.2. Patterns of Change and Political Implications
4.3. Multiple Factors Influencing ESV
4.4. Trade-Offs and Synergies Between Ecosystem Services
4.5. Limitations
5. Conclusions
Author Contributions
Funding
Data Availability Statement
Conflicts of Interest
References
- Daily, G.C. Nature’s services: Societal dependence on natural ecosystems (1997). In The Future of Nature; Libby, R., Sverker, S., Paul, W., Eds.; Yale University Press: New Haven, CT, USA, 2013; pp. 454–464. [Google Scholar]
- Bongaarts, J. IPBES, 2019. Summary for policymakers of the global assessment report on biodiversity and ecosystem services of the Intergovernmental Science-Policy Platform on Biodiversity and Ecosystem Services. Popul. Dev. Rev. 2019, 45, 680–681. [Google Scholar] [CrossRef]
- Xia, H.; Yuan, S.; Prishchepov, A.V. Spatial-temporal heterogeneity of ecosystem service interactions and their social-ecological drivers: Implications for spatial planning and management. Resour. Conserv. Recycl. 2023, 189, 106767. [Google Scholar] [CrossRef]
- Reid, W.V.; Mooney, H.A.; Cropper, A.; Capistrano, D.; Carpenter, S.R.; Chopra, K. Millennium Ecosystem Assessment. Ecosystems and Human Well-Being: Synthesis; Island Press: Washington, DC, USA, 2005. [Google Scholar]
- Costanza, R.; de Groot, R.; Sutton, P.; van der Ploeg, S.; Anderson, S.J.; Kubiszewski, I.; Farber, S.; Turner, R.K. Changes in the global value of ecosystem services. Glob. Environ. Chang. 2014, 26, 152–158. [Google Scholar] [CrossRef]
- Costanza, R.; d’Arge, R.; de Groot, R.; Farber, S.; Grasso, M.; Hannon, B.; Limburg, K.; Naeem, S.; O’Neill, R.V.; Paruelo, J.; et al. The value of the world’s ecosystem services and natural capital. Nature 1997, 387, 253–260. [Google Scholar] [CrossRef]
- Xie, G.; Zhang, C.; Zhang, L.; Chen, W.; Li, S. Improvement of the evaluation method for ecosystem service value based on per unit area. J. Nat. Resour. 2015, 30, 1243–1254. [Google Scholar] [CrossRef]
- Vatitsi, K.; Ioannidou, N.; Mirli, A.; Siachalou, S.; Kagalou, I.; Latinopoulos, D.; Mallinis, G. Lulc change effects on environmental quality and ecosystem services using eo data in two rural river basins in Thrace, Greece. Land 2023, 12, 1140. [Google Scholar] [CrossRef]
- Nazombe, K.S.; Nambazo, O.; Mdolo, P.; Bakolo, C.; Mlewa, R. Assessing changes in the ecosystem service value in response to land use and land cover dynamics in Malawi. Environ. Monit. Assess. 2024, 196, 741. [Google Scholar] [CrossRef]
- Zhao, F.; Liu, X.; Zhao, X.; Wang, H. Effects of production–living–ecological space changes on the ecosystem service value of the Yangtze River Delta urban agglomeration in China. Environ. Monit. Assess. 2023, 195, 1133. [Google Scholar] [CrossRef]
- Birhane, E.; Negash, E.; Getachew, T.; Gebrewahed, H.; Gidey, E.; Gebremedhin, M.A.; Mhangara, P. Changes in total and per-capital ecosystem service value in response to land-use land-cover dynamics in north-central Ethiopia. Sci. Rep. 2024, 14, 6540. [Google Scholar] [CrossRef]
- Chen, J.; Dong, Z.; Shi, R.; Sun, G.; Guo, Y.; Peng, Z.; Deng, M.; Chen, K. Urban multi-scenario land use optimization simulation considering local climate zones. Remote Sens. 2024, 16, 4342. [Google Scholar] [CrossRef]
- Dammag, A.Q.; Dai, J.; Cong, G.; Derhem, B.Q.; Latif, H.Z. Assessing and predicting changes of ecosystem service values in response to land use/land cover dynamics in Ibb City, Yemen: A three-decade analysis and future outlook. Int. J. Digit. Earth 2024, 17, 2323174. [Google Scholar] [CrossRef]
- Lin, Y.; Xu, X.; Tan, Y.; Chen, M. Identifying ecosystem supply–demand response thresholds for land use optimization: A case study of the Taihu Lake Basin, China. Ecol. Indic. 2025, 175, 113569. [Google Scholar] [CrossRef]
- Li, C.; Wu, Y.; Gao, B.; Zheng, K.; Wu, Y.; Li, C. Multi-scenario simulation of ecosystem service value for optimization of land use in the Sichuan-Yunnan ecological barrier, China. Ecol. Indic. 2021, 132, 108328. [Google Scholar] [CrossRef]
- Tan, J.; Li, A.; Lei, G.; Xie, X. A SD-MaxEnt-CA model for simulating the landscape dynamic of natural ecosystem by considering socio-economic and natural impacts. Ecol. Model. 2019, 410, 108783. [Google Scholar] [CrossRef]
- Feng, H.; Lei, X.; Yu, G.; Changchun, Z. Spatio-temporal evolution and trend prediction of urban ecosystem service value based on CLUE-S and GM (1,1) compound model. Environ. Monit. Assess. 2023, 195, 1282. [Google Scholar] [CrossRef]
- Wang, A.; Zhang, M.; Kafy, A.; Tong, B.; Hao, D.; Feng, Y. Predicting the impacts of urban land change on LST and carbon storage using InVEST, CA-ANN and WOA-LSTM models in Guangzhou, China. Earth Sci. Inform. 2023, 16, 437–454. [Google Scholar] [CrossRef]
- Zhang, P.; Liu, L.; Yang, L.; Zhao, J.; Li, Y.; Qi, Y.; Ma, X.; Cao, L. Exploring the response of ecosystem service value to land use changes under multiple scenarios coupling a mixed-cell cellular automata model and system dynamics model in Xi’an, China. Ecol. Indic. 2023, 147, 110009. [Google Scholar] [CrossRef]
- Li, X.; Wu, C. Sensitivity assessment and simulation of ecosystem services in response to land use change in arid regions: Empirical evidence from Xinjiang, China. Ecol. Indic. 2025, 171, 113150. [Google Scholar] [CrossRef]
- Liang, X.; Guan, Q.; Clarke, K.C.; Liu, S.; Wang, B.; Yao, Y. Understanding the drivers of sustainable land expansion using a patch-generating land use simulation (PLUS) model: A case study in Wuhan, China. Comput. Environ. Urban Syst. 2021, 85, 101569. [Google Scholar] [CrossRef]
- Luan, C.; Liu, R.; Zhang, Q.; Sun, J.; Liu, J. Multi-objective land use optimization based on integrated NSGA–II–PLUS model: Comprehensive consideration of economic development and ecosystem services value enhancement. J. Clean. Prod. 2024, 434, 140306. [Google Scholar] [CrossRef]
- Zhou, M.; Ma, Y.; Tu, J.; Wang, M. SDG-oriented multi-scenario sustainable land-use simulation under the background of urban expansion. Environ. Sci. Pollut. Res. 2022, 29, 72797–72818. [Google Scholar] [CrossRef]
- Cook, B.I.; Mankin, J.S.; Marvel, K.; Williams, A.P.; Smerdon, J.E.; Anchukaitis, K.J. Twenty-first century drought projections in the cmip6 forcing scenarios. Earth’s Future 2020, 8, e2019EF001461. [Google Scholar] [CrossRef]
- Lu, Z.; Li, W.; Yue, R. Investigation of the long-term supply–demand relationships of ecosystem services at multiple scales under SSP–RCP scenarios to promote ecological sustainability in China’s largest city cluster. Sustain. Cities Soc. 2024, 104, 105295. [Google Scholar] [CrossRef]
- Chen, Q.; Ning, Y. Projecting LUCC dynamics and ecosystem services in an emerging urban agglomeration under SSP-RCP scenarios and their management implications. Sci. Total Environ. 2024, 949, 175100. [Google Scholar] [CrossRef]
- Feng, Y.; Zhai, S.; Song, G.; Song, H.; Dong, G.; Jiang, X.; Dong, C.; Jayathilaka, H.B.T.P. Spatio-temporal variations of habitat quality under 8 ssp-rcp scenarios in China. J. Geophys. Res. Biogeo. 2024, 129, e2024JG008030. [Google Scholar] [CrossRef]
- Cai, G.; Xiong, J.; Wen, L.; Weng, A.; Lin, Y.; Li, B. Predicting the ecosystem service values and constructing ecological security patterns in future changing land use patterns. Ecol. Indic. 2023, 154, 110787. [Google Scholar] [CrossRef]
- Quan, L.; Jin, S.; Chen, J.; Li, T. Evolution and Driving Forces of Ecological Service Value in Anhui Based on Landsat Land Use and Land Cover Change. Remote Sens. 2024, 16, 269. [Google Scholar] [CrossRef]
- Wang, W.; Xu, J.; Luan, X.; Zhang, Z. Wetland ecosystem service values in beijing significantly increased from 1984 to 2020: Trend changes, type evolution, and driving factor. Ecol. Indic. 2024, 166, 112235. [Google Scholar] [CrossRef]
- Liu, J.; Pei, X.; Liao, B.; Zhang, H.; Liu, W.; Jiao, J. Scale effects and spatial heterogeneity of driving factors in ecosystem services value interactions within the Tibet autonomous region. J. Environ. Manag. 2024, 351, 119871. [Google Scholar] [CrossRef]
- Chen, S.; Wu, J. The Driving Factors of the Tradeoff-Synergistic Relationship Among Forest Ecosystem Service Values in the Yangtze River Delta, China. Forests 2024, 15, 2031. [Google Scholar] [CrossRef]
- Xie, L.; Wang, H.; Liu, S. The ecosystem service values simulation and driving force analysis based on land use/land cover: A case study in inland rivers in arid areas of the Aksu River Basin, China. Ecol. Indic. 2022, 138, 108828. [Google Scholar] [CrossRef]
- Jiang, W.; Guo, P.; Lin, Z.; Fu, Y.; Li, Y.; Kasperkiewicz, K.; Gaafar, A.-R.Z. Factors influencing the spatiotemporal variation in the value of ecosystem services in Anxi county. Heliyon 2023, 9, e19182. [Google Scholar] [CrossRef]
- Liu, X.; Chen, X.; Hua, K.; Wang, Y.; Wang, P.; Han, X.; Ye, J.; Wen, S. Effects of land use change on ecosystem services in arid area ecological migration. Chin. Geogr. Sci. 2018, 28, 894–906. [Google Scholar] [CrossRef]
- Ren, L.; Li, J.; Li, C.; Dang, P. Can ecotourism contribute to ecosystem? Evidence from local residents’ ecological behaviors. Sci. Total Environ. 2021, 757, 143814. [Google Scholar] [CrossRef]
- Yang, Y.; Huang, L.; Deng, S.; Zhang, X.; Hou, W.; Xiao, S.; Shen, R.; You, X.; Yang, Y.; Pan, H. Tradeoffs among ecosystem services under ecological engineering construction: Donor and receiver evaluation of 25 soil and water conservation projects in China. Ecol. Eng. 2025, 219, 107685. [Google Scholar] [CrossRef]
- Xiao, J.; Song, F.; Su, F.; Song, S.; Wei, C. Exploring the interaction mechanism of natural conditions and human activities on wetland ecosystem services value. J. Clean. Prod. 2023, 426, 139161. [Google Scholar] [CrossRef]
- Li, Y.; Liu, W.; Zhu, M.; Feng, Q.; Yang, L.; Zhang, J.; Yin, Z.; Yin, X. Influencing factors and paths of the coupling relationship between ecosystem services supply–demand and human well-being in the hexi regions, northwest China. Remote Sens. 2025, 17, 1787. [Google Scholar] [CrossRef]
- Yang, J.; Huang, X. The 30 m annual land cover dataset and its dynamics in China from 1990 to 2019. Earth Syst. Sci. Data 2021, 13, 3907–3925. [Google Scholar] [CrossRef]
- Murakami, D.; Yoshida, T.; Yamagata, Y. Gridded GDP Projections Compatible With the Five SSPs (Shared Socioeconomic Pathways). Front. Built Environ. 2021, 7, 2021. [Google Scholar] [CrossRef]
- Wang, X.; Meng, X.; Long, Y. Projecting 1 km-grid population distributions from 2020 to 2100 globally under shared socioeconomic pathways. Sci. Data 2022, 9, 563. [Google Scholar] [CrossRef]
- Chen, Y.; Guo, F.; Wang, J.; Cai, W.; Wang, C.; Wang, K. Provincial and gridded population projection for China under shared socioeconomic pathways from 2010 to 2100. Sci. Data 2020, 7, 83. [Google Scholar] [CrossRef]
- Han, L.; Li, Y.; Ge, Z.; Fang, F.; Gao, L.; Zhang, J.; Du, Z.; Cui, L. Study on the spatial and temporal evolution of ecosystem service value based on land use change in Xi’an City. Sci. Rep. 2025, 15, 66. [Google Scholar] [CrossRef]
- Li, J.; Chen, X.; Kurban, A.; Van de Voorde, T.; De Maeyer, P.; Zhang, C. Coupled SSPs-RCPs scenarios to project the future dynamic variations of water-soil-carbon-biodiversity services in Central Asia. Ecol. Indic. 2021, 129, 107936. [Google Scholar] [CrossRef]
- Ren, Y.; Zhang, L.; Li, X.; Zhang, G.; Li, Y.; Lian, Z. Spatiotemporal variations and driving mechanisms of carbon storage in Central Asia: Insights from the PLUS-InVEST models and machine learning. J. Environ. Manag. 2025, 389, 126123. [Google Scholar] [CrossRef]
- Yun, X.; Tang, Q.; Li, J.; Lu, H.; Zhang, L.; Chen, D. Can reservoir regulation mitigate future climate change induced hydrological extremes in the Lancang-Mekong River Basin? Sci. Total Environ. 2021, 785, 147322. [Google Scholar] [CrossRef]
- Wang, Z.; Li, X.; Mao, Y.; Li, L.; Wang, X.; Lin, Q. Dynamic simulation of land use change and assessment of carbon storage based on climate change scenarios at the city level: A case study of Bortala, China. Ecol. Indic. 2022, 134, 108499. [Google Scholar] [CrossRef]
- Liang, G.-M.; Xiao, Y.; Liu, M.-M.; Lin, S.; Wu, Z.-L.; Hu, X.-S. Simulation and elicitation of land use and carbon storage changes in Fuzhou under the background of traffic planning. J. Nat. Resour. 2023, 38, 3074–3092. [Google Scholar] [CrossRef]
- Usman, M.; Liedl, R.; Shahid, M.A.; Abbas, A. Land use/land cover classification and its change detection using multi-temporal MODIS NDVI data. J. Geogr. Sci. 2015, 25, 1479–1506. [Google Scholar] [CrossRef]
- Fetene, D.T.; Lohani, T.K.; Mohammed, A.K. LULC change detection using support vector machines and cellular automata-based ANN models in Guna Tana watershed of Abay basin, Ethiopia. Environ. Monit. Assess. 2023, 195, 1329. [Google Scholar] [CrossRef]
- Zhao, Y.; Zhang, X.; Wu, Q.; Huang, J.; Ling, F.; Wang, L. Characteristics of spatial and temporal changes in ecosystem service value and threshold effect in Henan along the Yellow River, China. Ecol. Indic. 2024, 166, 112531. [Google Scholar] [CrossRef]
- Xie, G.; Zhang, C.; Zhen, L.; Zhang, L. Dynamic changes in the value of China’s ecosystem services. Ecosyst. Serv. 2017, 26, 146–154. [Google Scholar] [CrossRef]
- Hu, S. Research on Ecosystem Service Value and Ecological Compensation Standard Based on Land Use Change. Ph.D. Thesis, China University of Mining and Technology, Beijing, China, 2020. (In Chinese). [Google Scholar]
- Ye, Y.; Bryan, B.A.; Zhang, J.; Connor, J.D.; Chen, L.; Qin, Z.; He, M. Changes in land-use and ecosystem services in the Guangzhou-Foshan Metropolitan Area, China from 1990 to 2010: Implications for sustainability under rapid urbanization. Ecol. Indic. 2018, 93, 930–941. [Google Scholar] [CrossRef]
- Xue, M.; Luo, Y. Dynamic variations in ecosystem service value and sustainability of urban system: A case study for Tianjin city, China. Cities 2015, 46, 85–93. [Google Scholar] [CrossRef]
- Qiu, J.; Yu, D.; Huang, T. Influential paths of ecosystem services on human well-being in the context of the sustainable development goals. Sci. Total Environ. 2022, 852, 158443. [Google Scholar] [CrossRef]
- Deng, C.; Shen, X.; Liu, C.; Liu, Y. Spatiotemporal characteristics and socio-ecological drivers of ecosystem service interactions in the Dongting Lake Ecological Economic Zone. Ecol. Indic. 2024, 167, 112734. [Google Scholar] [CrossRef]
- Wetzels, M.; Odekerken-Schröeder, G.; Van Oppen, C. Using pls path modeling for assessing hierarchical construct models: Guidelines and empirical illustration. MIS Q. 2009, 33, 177–195. Available online: http://www.jstor.org/stable/20650284 (accessed on 15 March 2025). [CrossRef]
- Xu, S.; Wang, K.; Wang, F. Monitoring changes and multi-scenario simulations of land use and ecosystem service values in coastal cities: A case study of Qingdao, China. Environ. Monit. Assess. 2025, 197, 173. [Google Scholar] [CrossRef]
- Cao, A.; Zhang, J. Multi-scenario prediction of ecosystem services value and mechanism of its trade-offs under the township scale—evidence from Liaoning province. Environ. Monit. Assess. 2025, 197, 204. [Google Scholar] [CrossRef]
- Loukika, K.N.; Keesara, V.R.; Buri, E.S.; Sridhar, V. Predicting the effects of land use land cover and climate change on munneru river basin using ca-markov and soil and water assessment tool. Sustainability 2022, 14, 5000. [Google Scholar] [CrossRef]
- Li, Y.; Qiao, X.; Wang, Y.; Liu, L. Spatiotemporal patterns and influencing factors of remotely sensed regional heat islands from 2001 to 2020 in Zhengzhou Metropolitan area. Ecol. Indic. 2023, 155, 111026. [Google Scholar] [CrossRef]
- Wu, K.; Han, L. Assessing urban ecosystem health using emergy and set pair analysis: A comparative study of typical chinese cities. Ecol. Indic. 2025, 178, 114102. [Google Scholar] [CrossRef]
- Wan, L.; Ye, X.; Lee, J.; Lu, X.; Zheng, L.; Wu, K. Effects of urbanization on ecosystem service values in a mineral resource-based city. Habitat Int. 2015, 46, 54–63. [Google Scholar] [CrossRef]
- Yan, S.; Chen, H.; Quan, Q.; Liu, J. Evolution and coupled matching of ecosystem service supply and demand at different spatial scales in the Shandong Peninsula urban agglomeration, China. Ecol. Indic. 2023, 155, 111052. [Google Scholar] [CrossRef]
- Liang, B.-Y.; Cao, C.; Li, J.-C.; Tang, Q.-H.; Wu, Y.-Y.; Xiao, X.; Rao, Y.-L.; Wang, J.-W.; Yang, L.-Q. Spatiotemporal Response of Ecosystem Service Value to Land Use Change in theLanzhou-Xining Urban Agglomeration over the Past 20 Years. Environ. Sci. 2024, 45, 3329–3340. [Google Scholar] [CrossRef]
- Shi, X.; Xia, H.; Machimura, T.; Matsui, T.; Haga, C.; Wang, Q.; Pan, H.; Peng, L. Scenario-based land use simulation and integrated analysis of karst ecosystem service bundles. Glob. Ecol. Conserv. 2024, 54, e03096. [Google Scholar] [CrossRef]
- Ai, X.; Zheng, X.; Zhang, Y.; Liu, Y.; Ou, X.; Xia, C.; Liu, L. Climate and land use changes impact the trajectories of ecosystem service bundles in an urban agglomeration: Intricate interaction trends and driver identification under SSP-RCP scenarios. Sci. Total Environ. 2024, 944, 173828. [Google Scholar] [CrossRef]
- Li, G.; Wang, W.; Li, B.; Duan, Z.; Hu, L.; Liu, J. Spatiotemporal simulation of blue-green space pattern evolution and carbon storage under different SSP-RCP scenarios in Wuhan. Sci. Rep. 2025, 15, 4017. [Google Scholar] [CrossRef] [PubMed]
- Li, D.; Fan, Q.; Guo, D. Hydrological effectiveness of ecological governance in the Yellow River Basin: A meta-analysis of water quality and ecosystem responses. Hydrol. Res. 2025, 56, 1065–1082. [Google Scholar] [CrossRef]
- Chen, W.; Zeng, Y.; Zeng, J. Impacts of traffic accessibility on ecosystem services: An integrated spatial approach. J. Geogr. Sci. 2021, 31, 1816–1836. [Google Scholar] [CrossRef]
- Bai, Y.; Sun, S.; Xu, Y.; Zhao, Y.; Pan, Y.; Xiao, Y.; Li, R. Exploring the dynamic impact of future land use changes on urban flood disasters: A case study in Zhengzhou City, China. Geogr. Sustain. 2025, 6, 100287. [Google Scholar] [CrossRef]
- Liu, M.; Bai, X.; Tan, Q.; Luo, G.; Zhao, C.; Wu, L.; Hu, Z.; Ran, C.; Deng, Y. Monitoring impacts of ecological engineering on ecosystem services with geospatial techniques in karst areas of SW China. Geocarto Int. 2022, 37, 5091–5115. [Google Scholar] [CrossRef]
- Li, Z.; Deng, X.; Jin, G.; Mohmmed, A.; Arowolo, A.O. Tradeoffs between agricultural production and ecosystem services: A case study in Zhangye, Northwest China. Sci. Total Environ. 2020, 707, 136032. [Google Scholar] [CrossRef]
- Hu, Y.; Zhang, S.; Shi, Y.; Guo, L. Quantifying the impact of the Grain-for-Green Program on ecosystem service scarcity value in Qinghai, China. Sci. Rep. 2023, 13, 2927. [Google Scholar] [CrossRef] [PubMed]
- Bai, L.; Tian, J.; Peng, Y.; Huang, Y.; He, X.; Bai, X.; Bai, T. Effects of climate change on ecosystem services and their components in southern hills and northern grasslands in China. Environ. Sci. Pollut. Res. 2021, 28, 44916–44935. [Google Scholar] [CrossRef] [PubMed]
- Bi, J.; Hao, R.; Li, J.; Qiao, J. Identifying ecosystem states with patterns of ecosystem service bundles. Ecol. Indic. 2021, 131, 108195. [Google Scholar] [CrossRef]
- Su, C.; Dong, M.; Fu, B.; Liu, G. Scale effects of sediment retention, water yield, and net primary production: A case-study of the Chinese Loess Plateau. Land Degrad. Dev. 2020, 31, 1408–1421. [Google Scholar] [CrossRef]
- Liu, H.; Liu, Y.; Wang, C.; Zhao, W.; Liu, S. Landscape pattern change simulations in Tibet based on the combination of the SSP-RCP scenarios. J. Environ. Manag. 2021, 292, 112783. [Google Scholar] [CrossRef]
- Li, Y.; Wang, P.; Lou, Y.; Chen, C.; Shen, C.; Hu, T. Assessing urban drainage pressure and impacts of future climate change based on shared socioeconomic pathways. J. Hydrol. Reg. Stud. 2024, 53, 101760. [Google Scholar] [CrossRef]
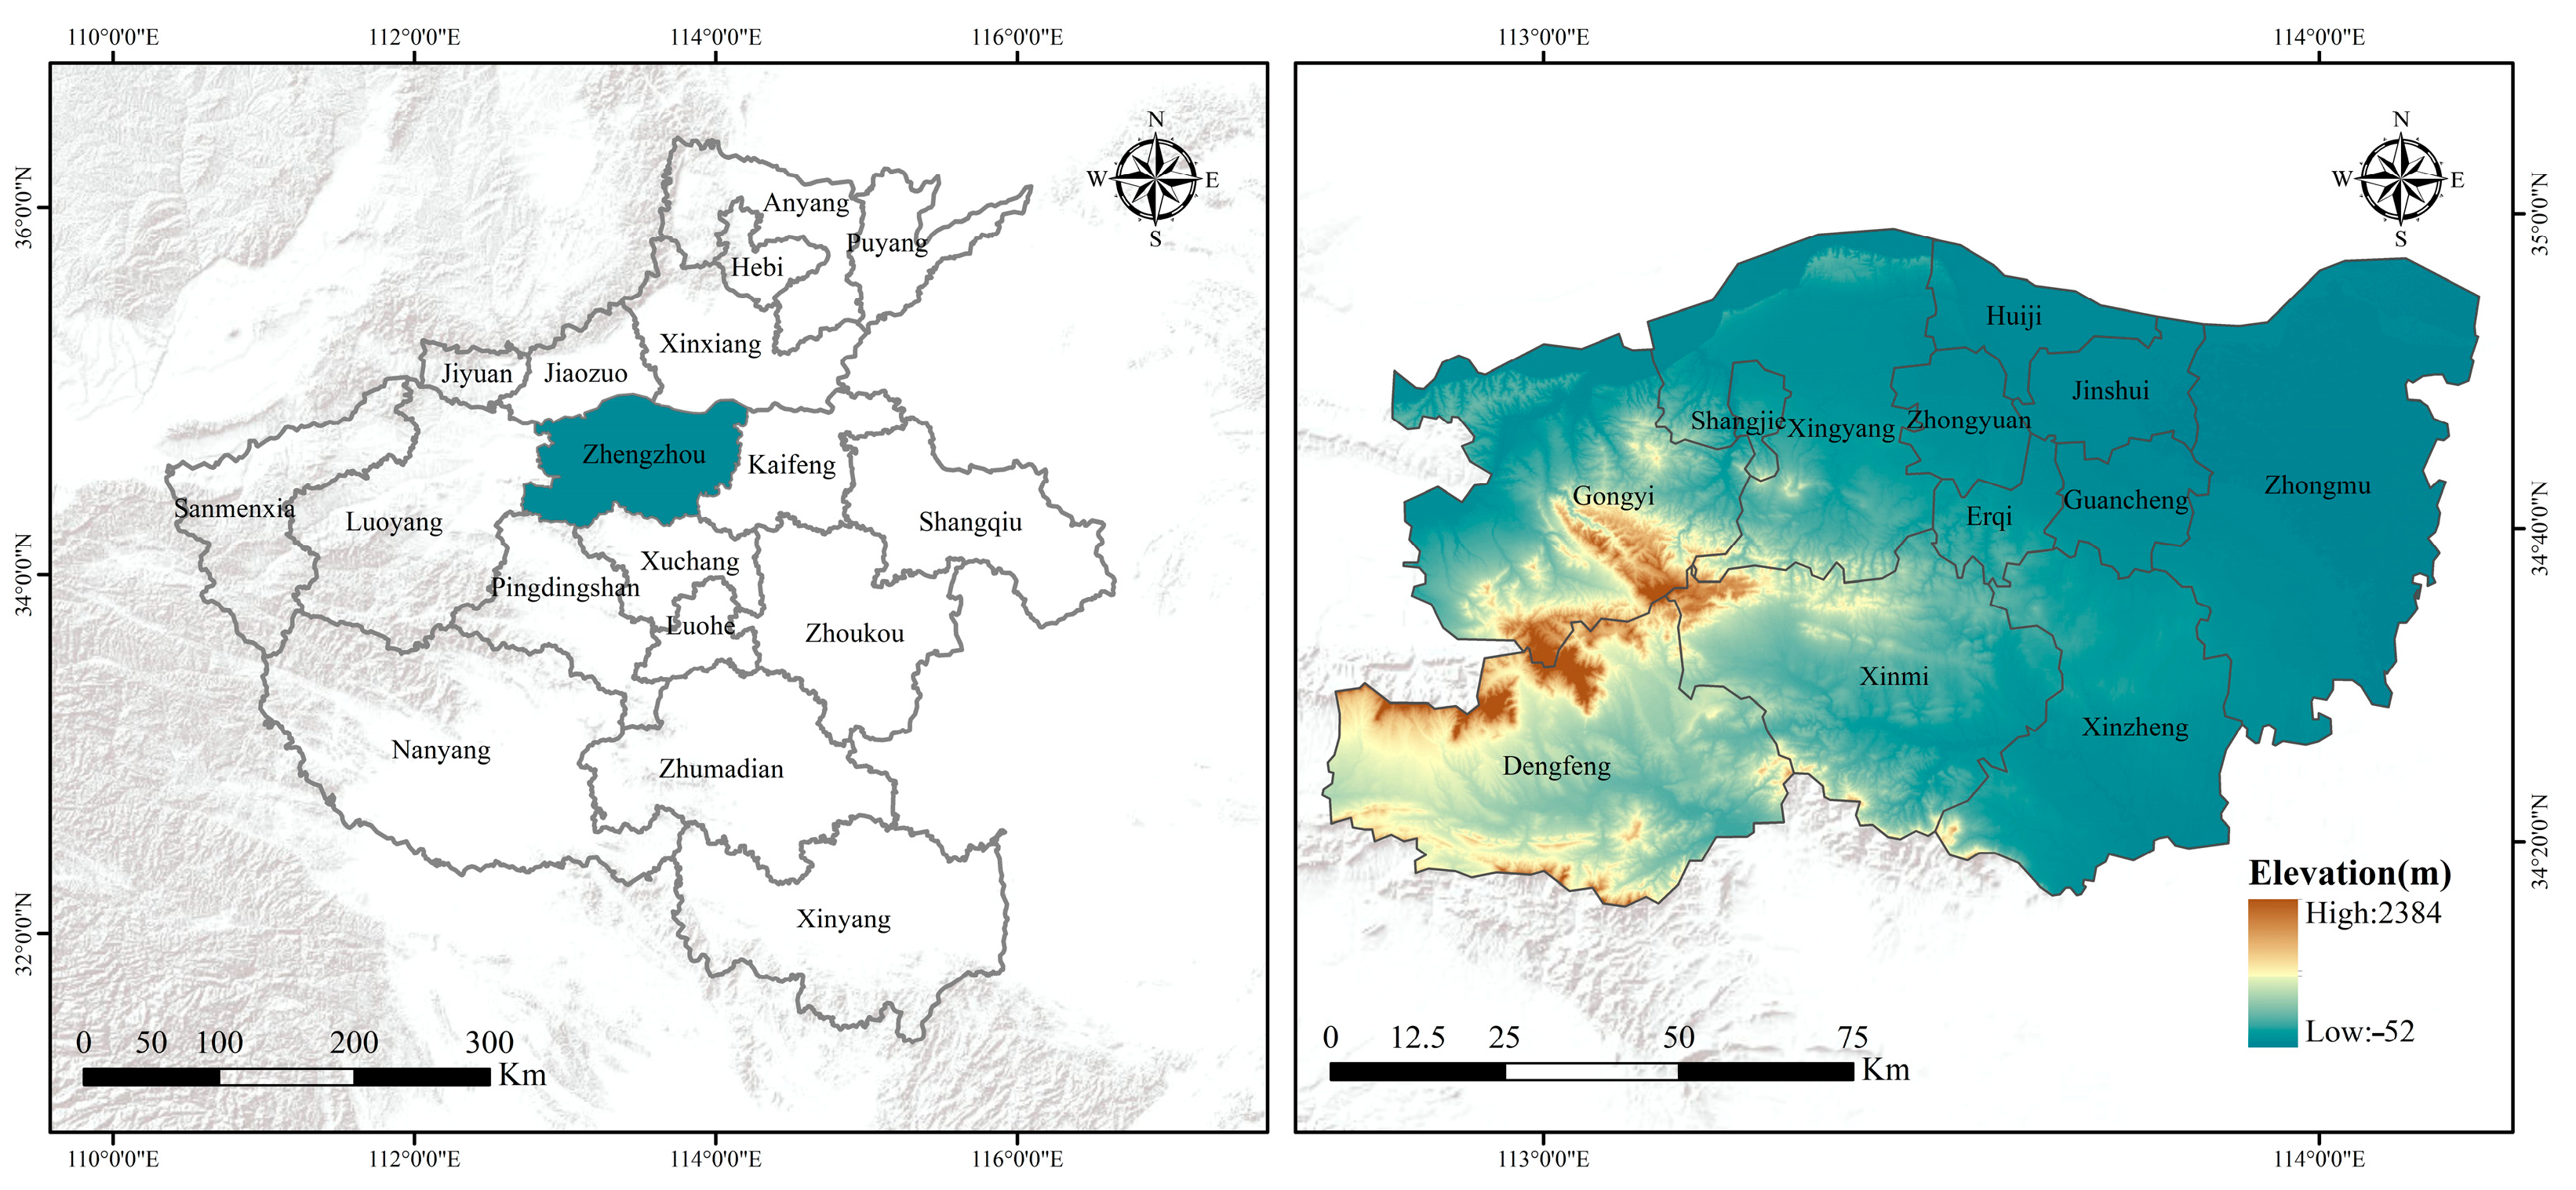
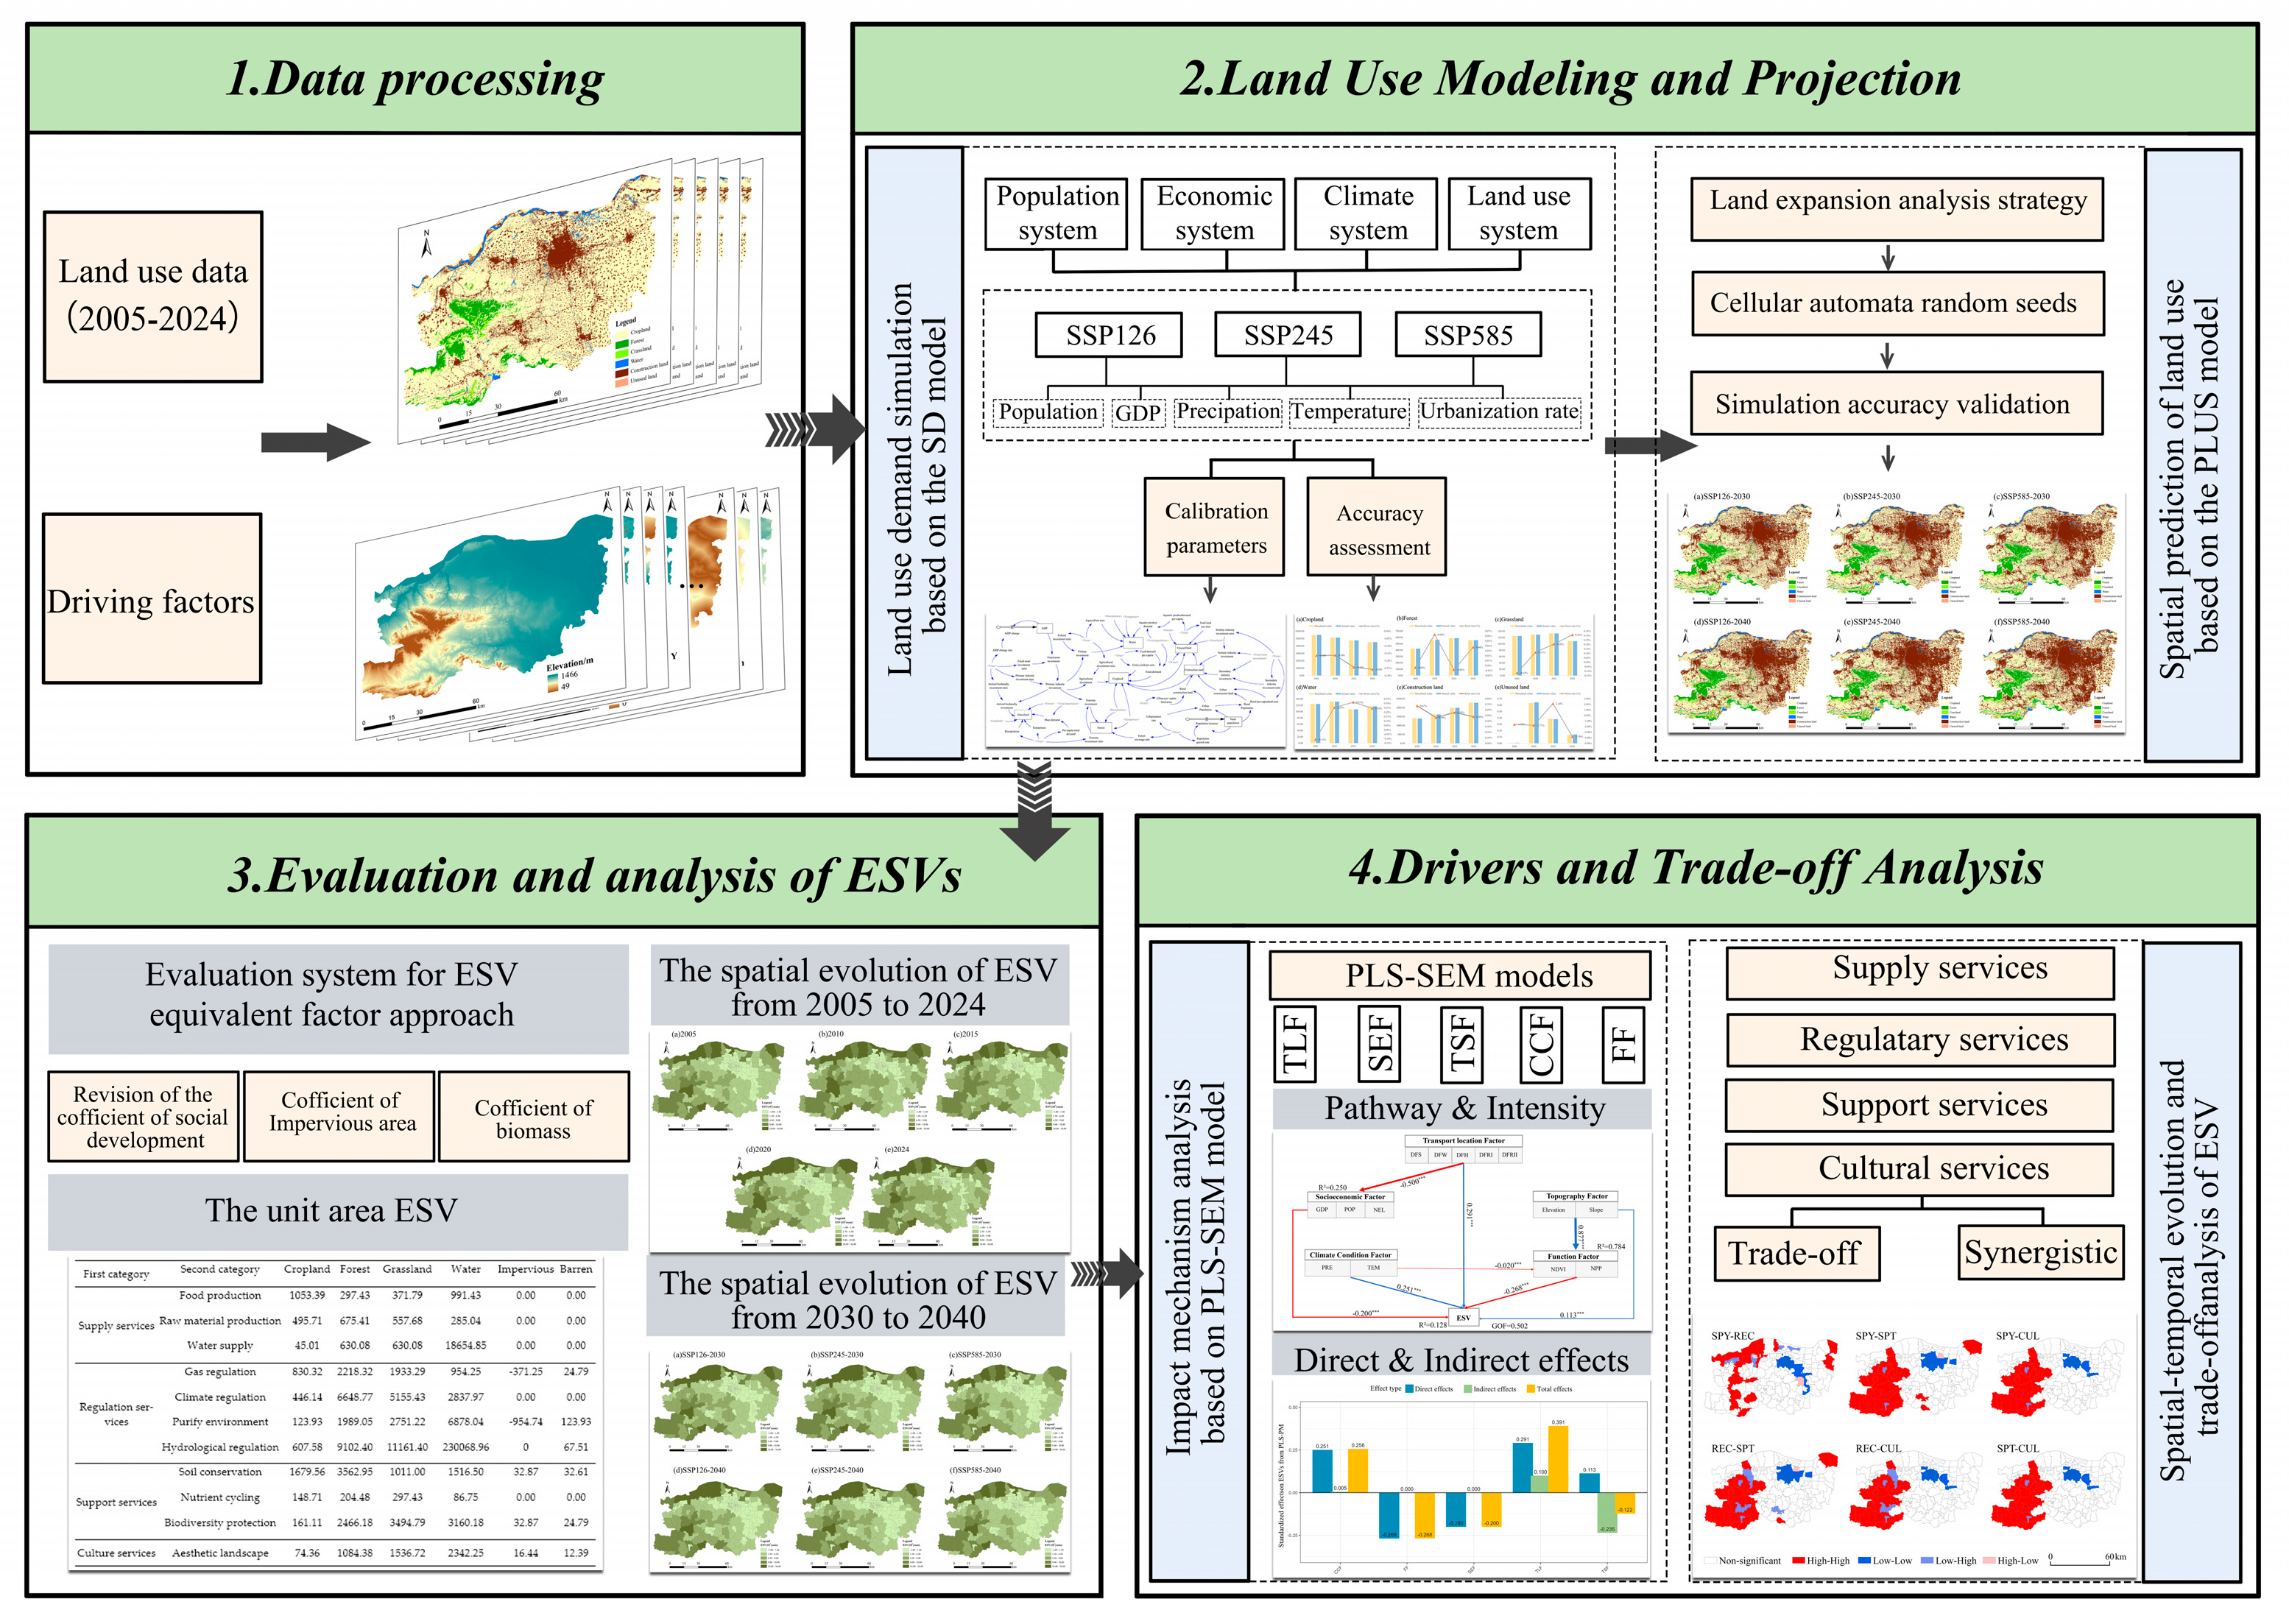
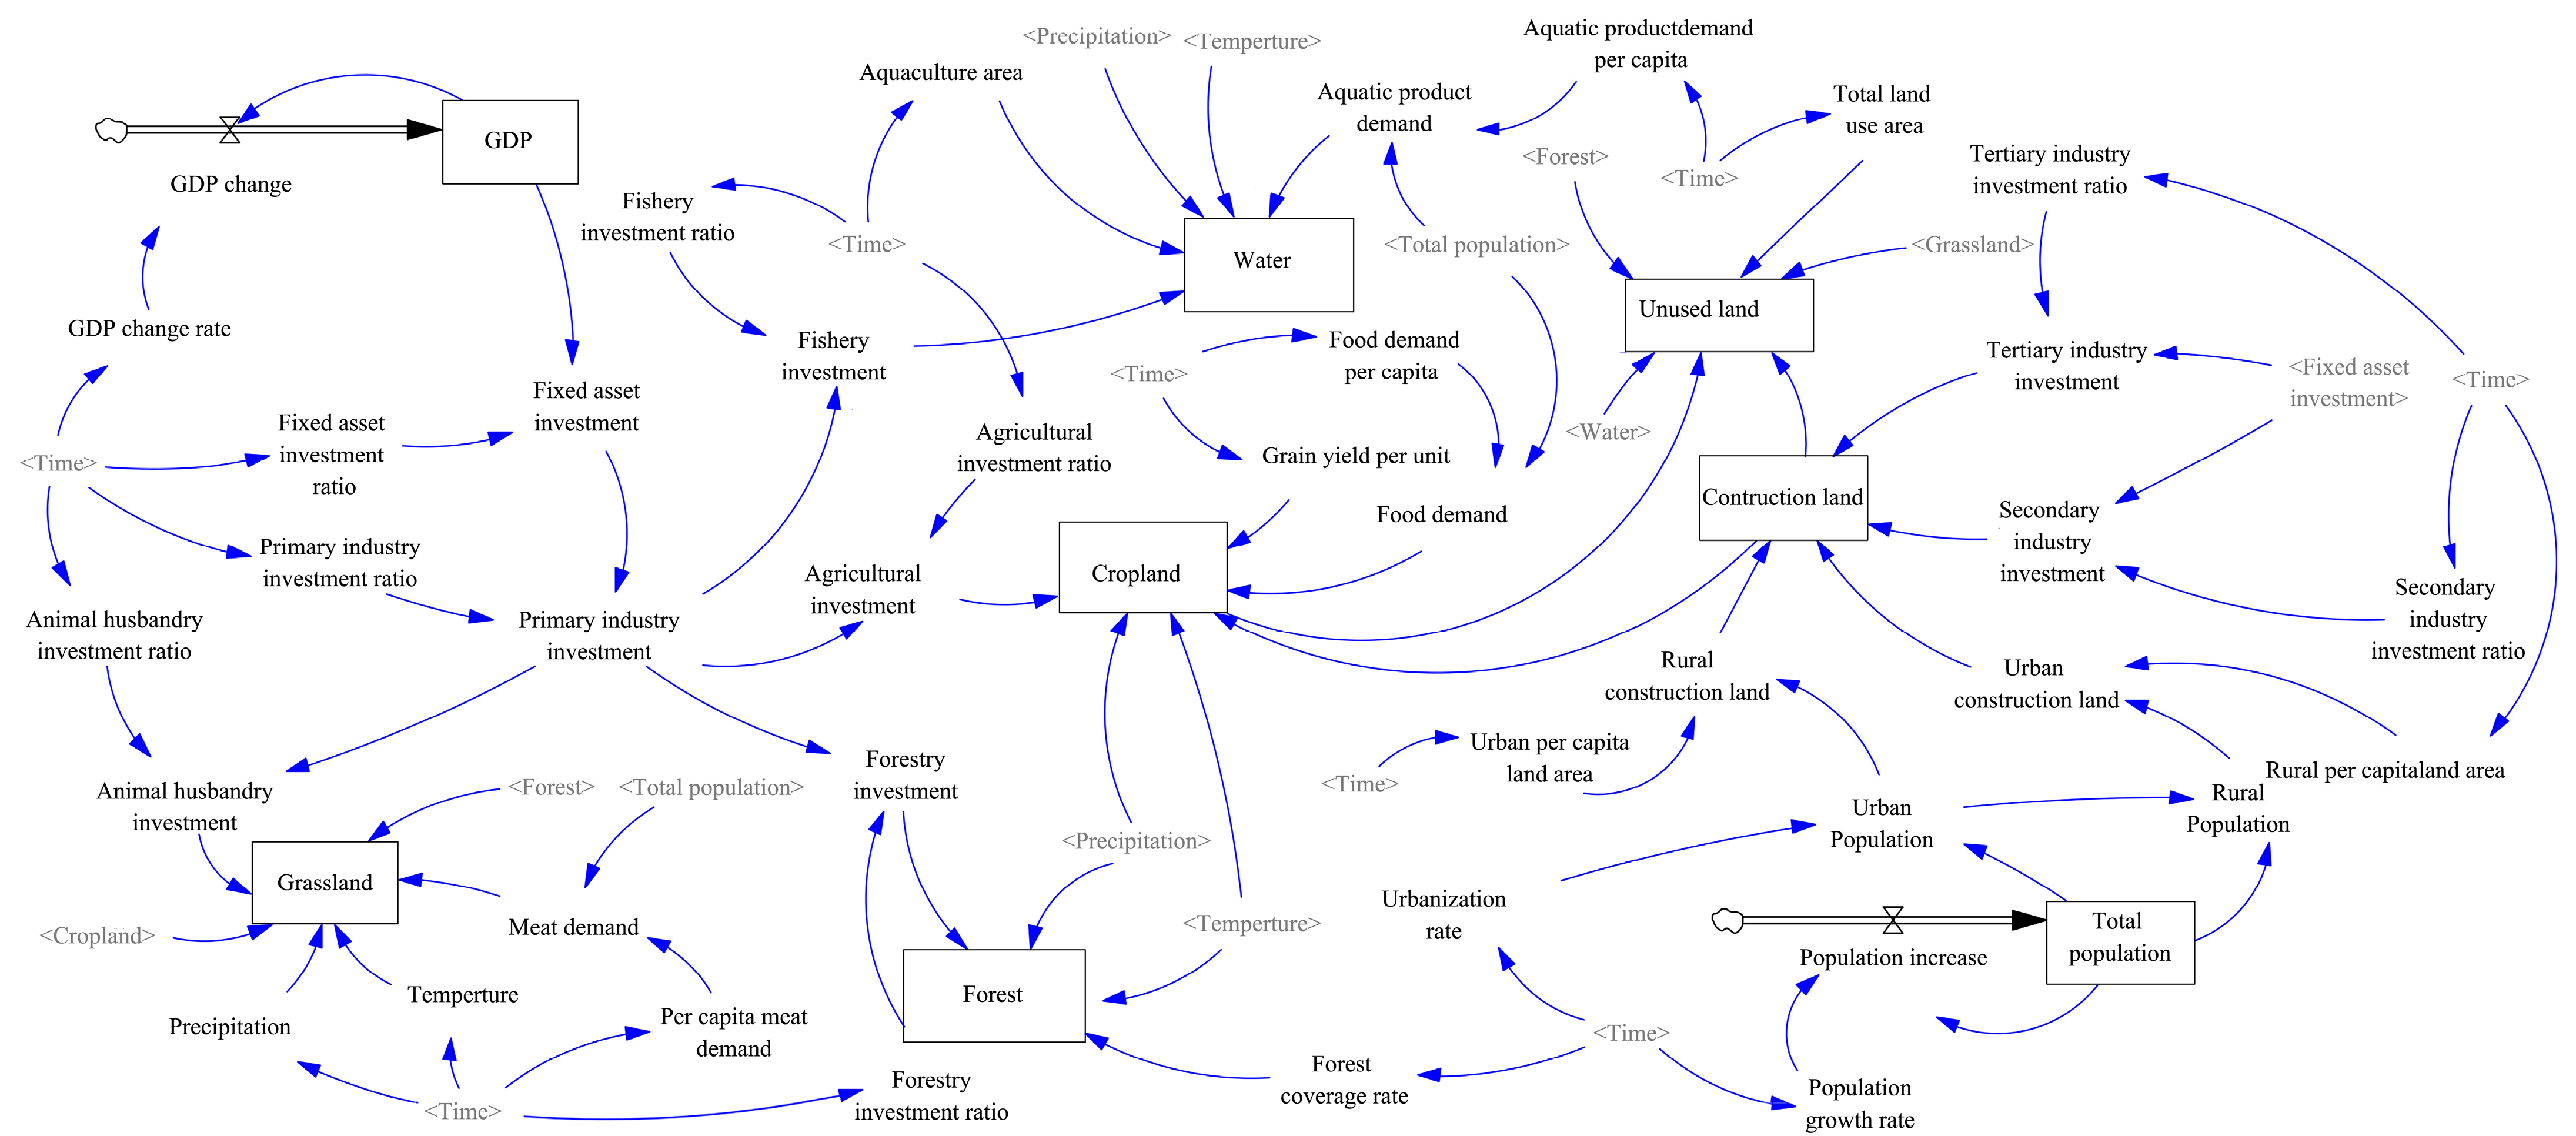
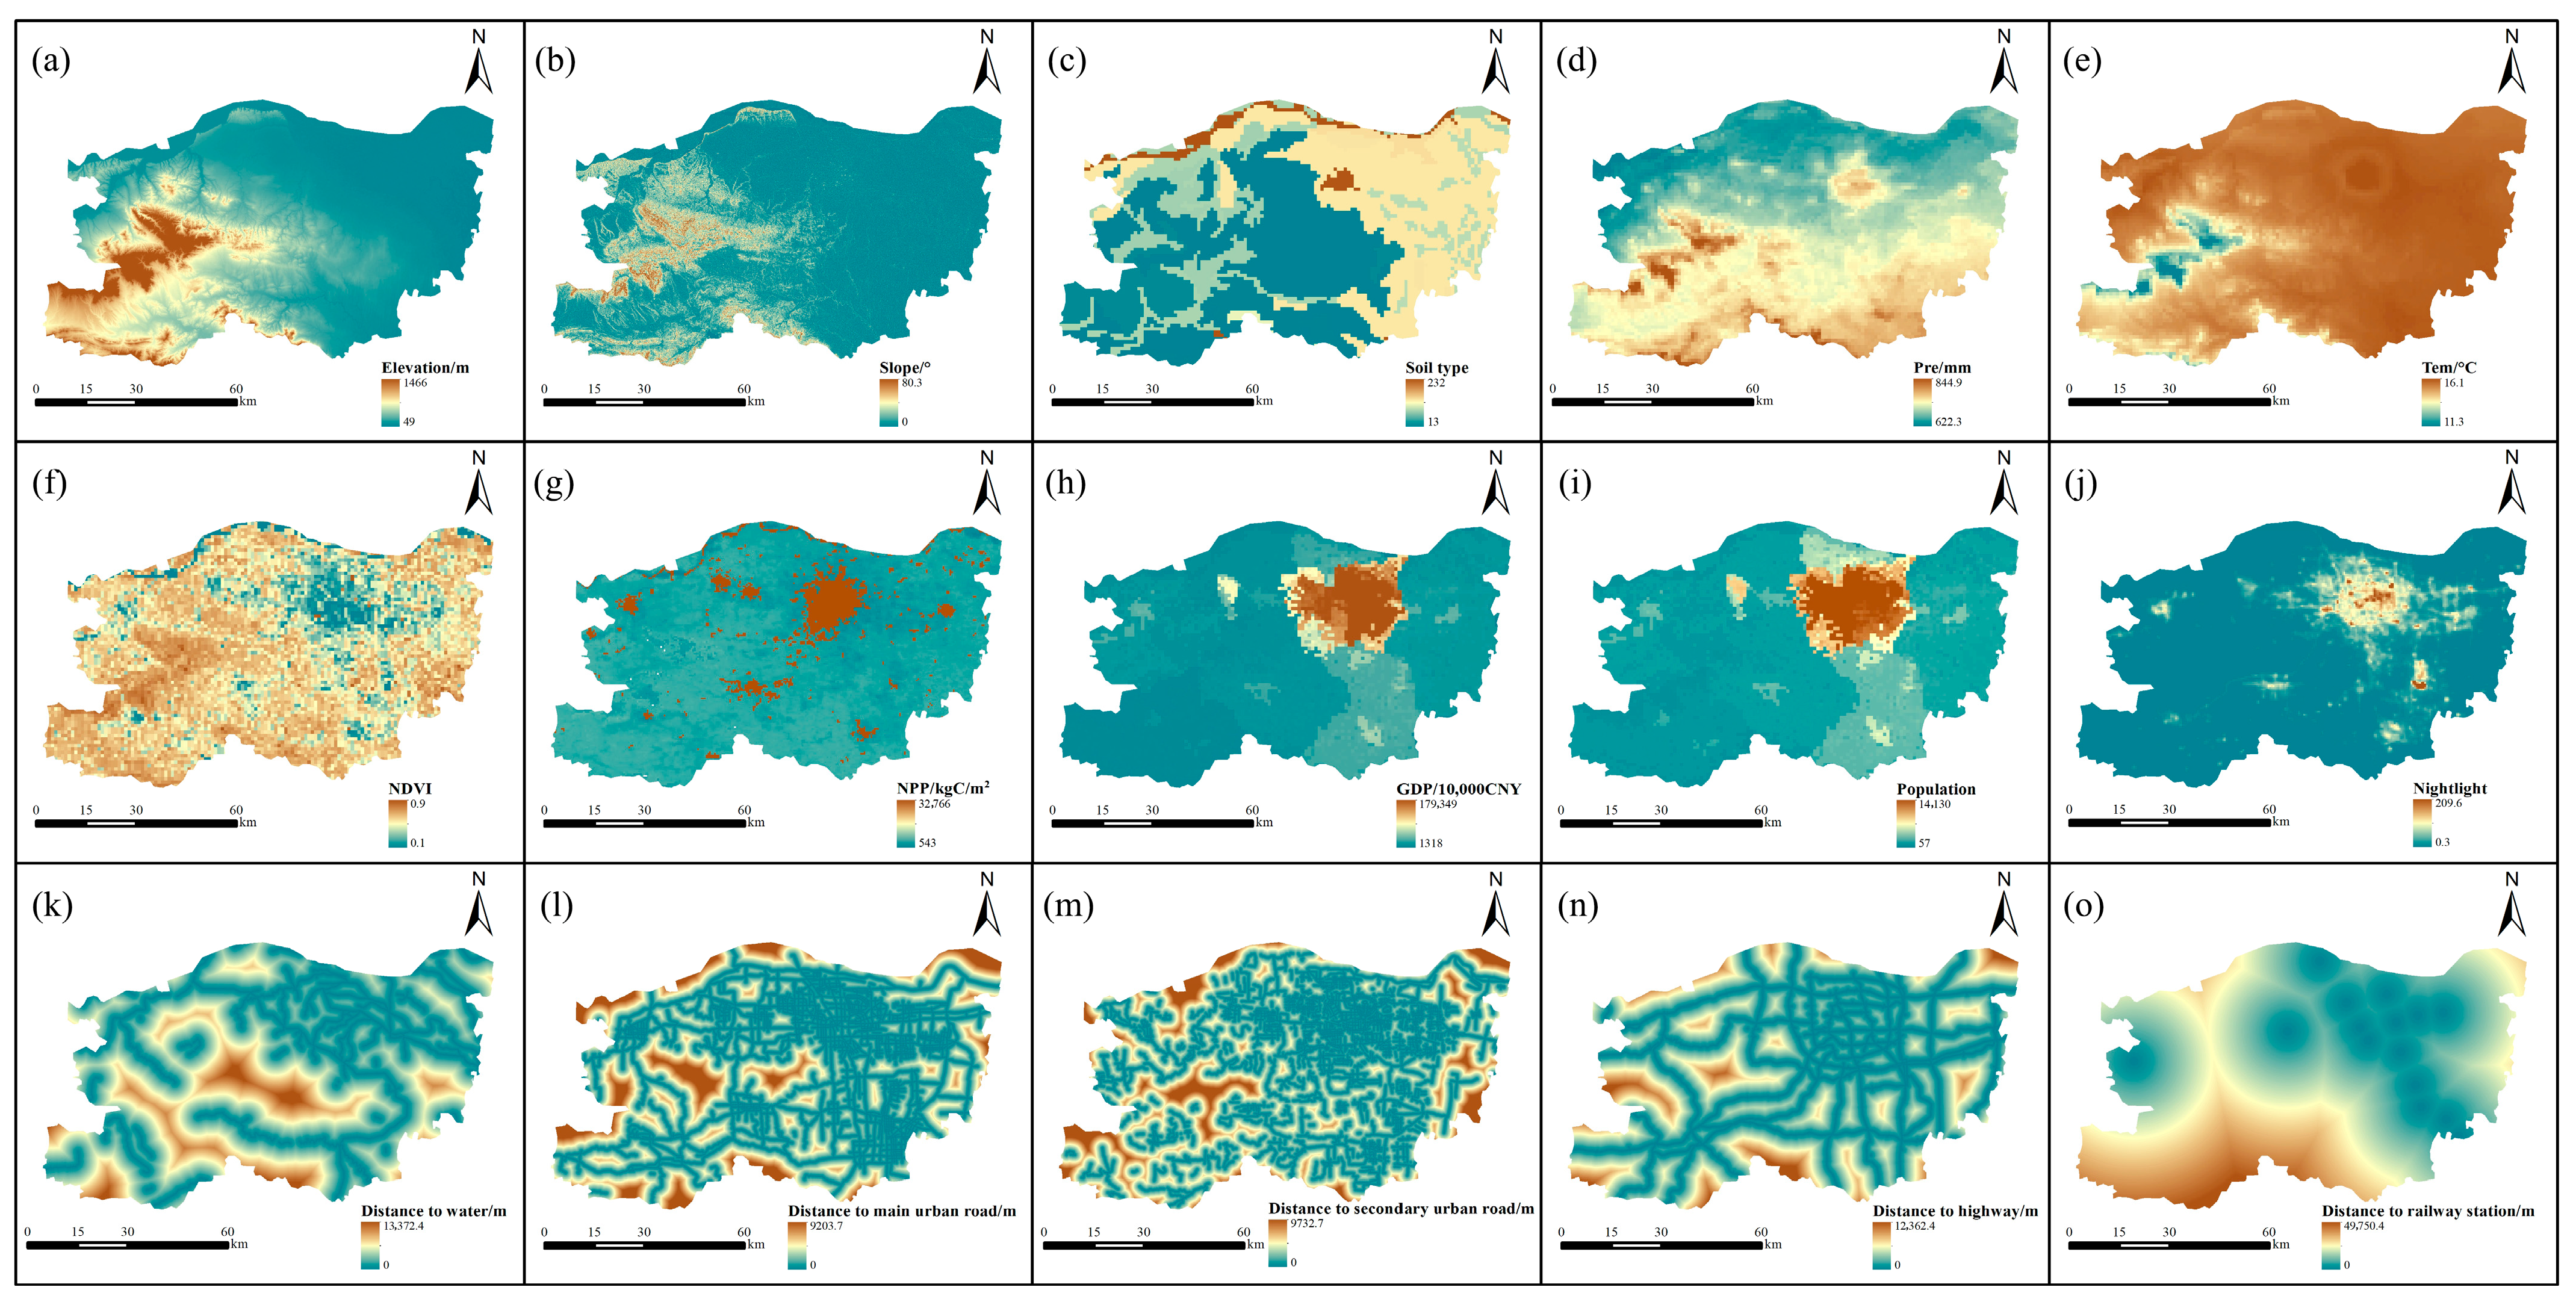



| Data | Details | Spatial Resolution | Source |
|---|---|---|---|
| Land cover data | Land cover data | 30 m | https://doi.org/10.5281/zenodo.5816591 (accessed on 15 March 2025) |
| Meteorological data | Elevation | 12.5 m | https://search.asf.alaska.edu/#/ (accessed on 15 March 2025) |
| Slope | 12.5 m | Calculated from DEM data | |
| Temperature | 1 km | http://data.tpdc.ac.cn/ (accessed on 15 March 2025) | |
| Precipitation | 1 km | http://data.tpdc.ac.cn/ (accessed on 15 March 2025) | |
| Soil type | 1 km | https://www.resdc.cn/ (accessed on 15 March 2025) | |
| Net Primary Production data | 500 m | http://www.geodata.cn/ (accessed on 15 March 2025) | |
| NDVI | 500 m | https://www.resdc.cn/ (accessed on 15 March 2025) | |
| Socioeconomic data | Population data | 1 km | https://www.resdc.cn/ (accessed on 15 March 2025) |
| GDP data | 1 km | ||
| Nighttime light | 1 km | ||
| Transportation location date | railway stations | - | OpenStreetMap (https://www.openstreetmap.org/ accessed on 15 March 2025) |
| highway | - | ||
| Urban road | - | ||
| Water | - | ||
| Price, planting area and output of agricultural products | - | - | Zhengzhou City Statistical Yearbook |
| Land-Use Type | Cropland | Forest | Grassland | Water | Construction Land | Unused Land |
|---|---|---|---|---|---|---|
| Actual Area in 2005/km2 | 5505.71 | 423.09 | 124.99 | 124.03 | 1390.500 | 0.01 |
| Simulated Area in 2005/km2 | 5496.65 | 423.07 | 124.84 | 123.90 | 1399.86 | 0.01 |
| Relative Error | −0.16% | 0.00% | −0.12% | −0.11% | 0.67% | −1.59% |
| Actual Area in 2010/km2 | 5128.32 | 558.95 | 129.01 | 131.35 | 1620.050 | 0.64 |
| Simulated Area in 2010/km2 | 5119.98 | 559.30 | 129.16 | 131.69 | 1627.56 | 0.63 |
| Relative Error | −0.16% | 0.06% | 0.11% | 0.25% | 0.46% | −1.77% |
| Actual Area in 2015/km2 | 4752.75 | 588.11 | 132.87 | 106.87 | 1987.34 | 0.38 |
| Simulated Area in 2015/km2 | 4741.18 | 588.06 | 133.14 | 107.21 | 1998.34 | 0.39 |
| Relative Error | −0.24% | −0.01% | 0.20% | 0.31% | 0.55% | 2.14% |
| Actual Area in 2020/km2 | 4515.05 | 556.07 | 108.30 | 116.53 | 2272.23 | 0.14 |
| Simulated Area in 2020/km2 | 4503.40 | 556.27 | 108.63 | 116.82 | 2283.06 | 0.13 |
| Relative Error | −0.26% | 0.04% | 0.31% | 0.24% | 0.48% | −3.78% |
| SSPs-RCPs Scenarios | 2023–2030 | 2030–2040 | ||||
|---|---|---|---|---|---|---|
| SSP126 | SSP245 | SSP585 | SSP126 | SSP245 | SSP585 | |
| Rate of GDP change (%) | 1.61 | 2.87 | 1.79 | −2.25 | −1.37 | −2.14 |
| Rate of population change (%) | 8.63 | 6.57 | 10.44 | 4.74 | 3.11 | 5.68 |
| Rate of change in urbanisation rate (%) | 1.95 | 1.78 | 1.95 | 1.08 | 0.94 | 1.08 |
| Annual Average Temperature Variation (°C) | 0.58 | 0.81 | 0.88 | 0.43 | 0.45 | 0.48 |
| Annual Average Precipitation Variation (mm) | 2.23 | 10.96 | 4.44 | 4.45 | −7.36 | 9.42 |
| LULC Type | 2020 | 2024 | ||
|---|---|---|---|---|
| P.accuracy | U.accuracy | P.accuracy | U.accuracy | |
| Cropland | 93.32% | 93.32% | 96.28% | 96.28% |
| Forest | 87.41% | 85.93% | 90.75% | 83.60% |
| Grassland | 70.3% | 70.3% | 74.09% | 74.09% |
| Water | 65.01% | 70.36% | 66.45% | 66.45% |
| Construction land | 89.00% | 89.03% | 93.81% | 95.67% |
| Unused land | 63.60% | 63.60% | 61.85% | 61.85% |
| Kappa | 0.832 | 0.781 | ||
| Revision Category | Revised Formula | Meaning |
|---|---|---|
| Socioeconomic coefficient | refer to the urban and rural Engel coefficients, respectively; and U and R indicate the proportions of urban and rural populations, respectively. | |
| Biomass Coefficient | indicate the corresponding national mean values of NPP and precipitation. | |
| Construction land area Coefficients | represent the costs of treating municipal solid waste and industrial waste, respectively. | |
| Total ESV | is the value coefficient of a single service function. |
| First Category | Second Category | Cropland | Forest | Grassland | Water | Construction Land | Unused Land |
|---|---|---|---|---|---|---|---|
| Supply services | Food production | 1053.39 | 297.43 | 371.79 | 991.43 | 0.00 | 0.00 |
| Raw material production | 495.71 | 675.41 | 557.68 | 285.04 | 0.00 | 0.00 | |
| Water supply | 45.01 | 630.08 | 630.08 | 18,654.85 | 0.00 | 0.00 | |
| Regulation services | Gas regulation | 830.32 | 2218.32 | 1933.29 | 954.25 | −371.25 | 24.79 |
| Climate regulation | 446.14 | 6648.77 | 5155.43 | 2837.97 | 0.00 | 0.00 | |
| Purify environment | 123.93 | 1989.05 | 2751.22 | 6878.04 | −954.74 | 123.93 | |
| Hydrological regulation | 607.58 | 9102.40 | 11,161.40 | 230,068.96 | 0 | 67.51 | |
| Support services | Soil conservation | 1679.56 | 3562.95 | 1011.00 | 1516.50 | 32.87 | 32.61 |
| Nutrient cycling | 148.71 | 204.48 | 297.43 | 86.75 | 0.00 | 0.00 | |
| Biodiversity protection | 161.11 | 2466.18 | 3494.79 | 3160.18 | 32.87 | 24.79 | |
| Culture services | Aesthetic landscape | 74.36 | 1084.38 | 1536.72 | 2342.25 | 16.44 | 12.39 |
| Factors | Loading | CR | AVE |
|---|---|---|---|
| TLF | 0.780 | 0.520 | |
| DFS | 0.663 | ||
| DFW | 0.559 | ||
| DFH | 0.670 | ||
| DFRⅠ | 0.756 | ||
| DFRⅠⅠ | 0.654 | ||
| SEF | 0.870 | 0.870 | |
| GDP | 0.952 | ||
| POP | 0.956 | ||
| NEL | 0.889 | ||
| TSF | 0.711 | 0.585 | |
| DEM | 0.958 | ||
| Slope | 0.926 | ||
| CCF | 0.940 | 0.888 | |
| PRE | 0.799 | ||
| TEM | 0.910 | ||
| FF | 0.845 | 0.733 | |
| NDVI | 0.987 | ||
| NPP | 0.543 |
| LULC Type | 2024 | 2030 | 2040 | ||||
|---|---|---|---|---|---|---|---|
| SSP126 | SSP245 | SSP585 | SSP126 | SSP245 | SSP585 | ||
| Cropland | 4504.86 | 4354.18 | 4273.01 | 4154.06 | 4005.57 | 3915.21 | 3813.02 |
| Forest | 558.53 | 564.34 | 556.47 | 546.43 | 582.59 | 537.25 | 524.76 |
| Grassland | 45.31 | 92.30 | 88.94 | 85.41 | 101.95 | 99.53 | 97.44 |
| Water | 108.87 | 120.06 | 113.40 | 110.39 | 124.72 | 119.04 | 114.42 |
| Construction land | 2350.68 | 2437.30 | 2536.25 | 2671.68 | 2753.34 | 2897.11 | 3018.43 |
| Unused land | 0.07 | 0.15 | 0.24 | 0.36 | 0.14 | 0.20 | 0.25 |
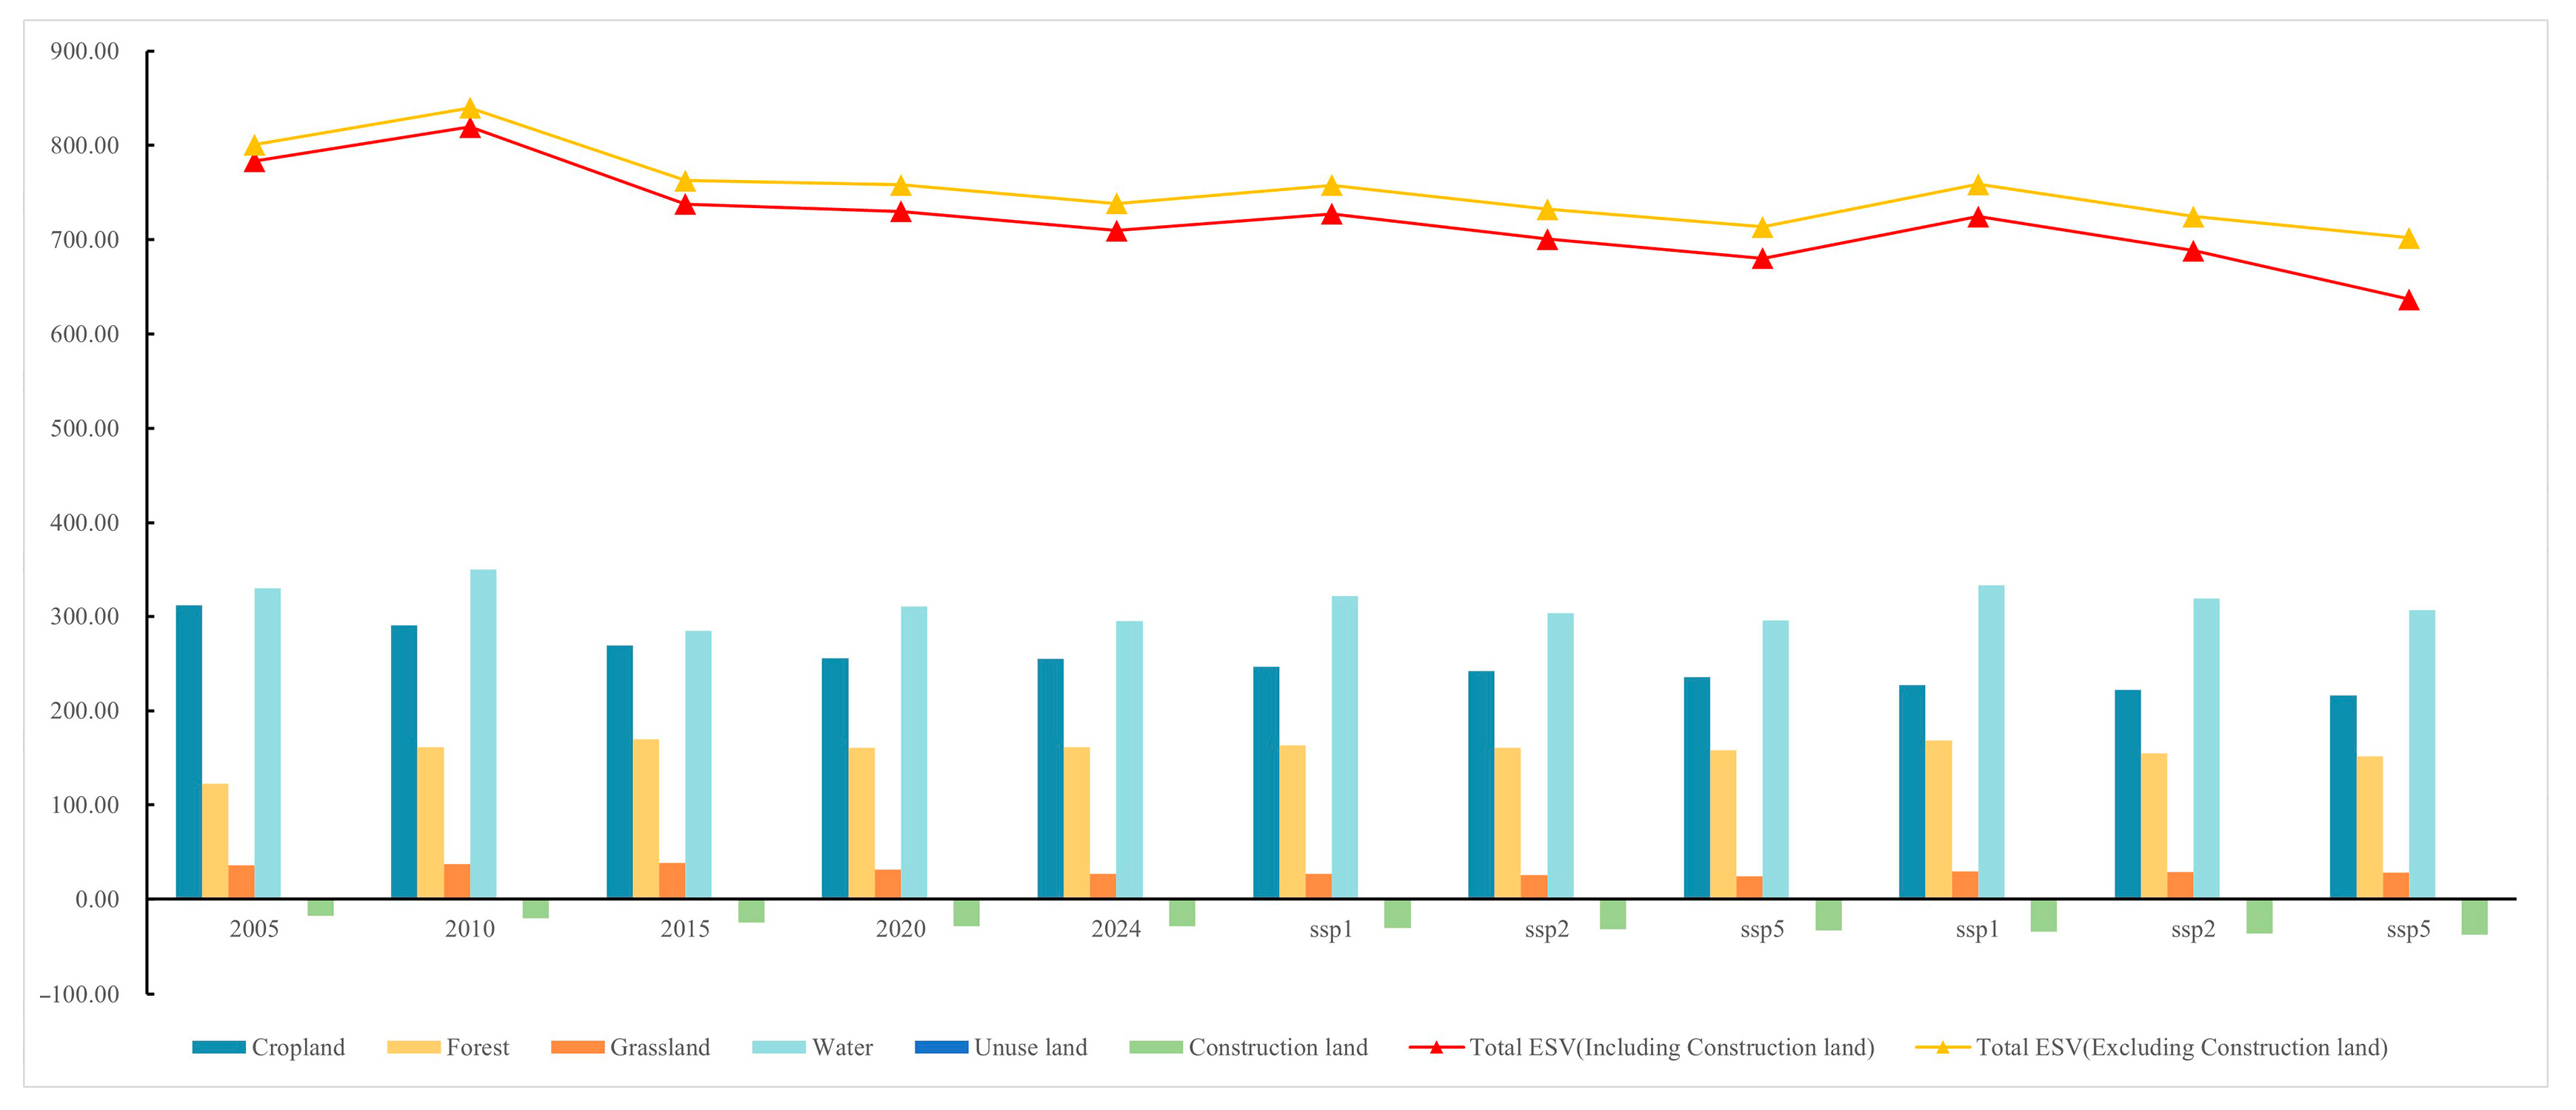
| Year | Factor | Cropland | Forest | Grassland | Water | Construction Land | Unused Land |
|---|---|---|---|---|---|---|---|
| 2005 | ESV | 311.98 | 122.31 | 36.16 | 330.24 | −17.29 | 0.00 |
| Percentage | 39.82% | 15.61% | 4.62% | 42.15% | −2.21% | 0.00% | |
| 2010 | ESV | 290.60 | 161.57 | 37.32 | 350.28 | −20.14 | 0.00 |
| Percentage | 35.46% | 19.71% | 4.55% | 42.74% | −2.46% | 0.00% | |
| 2015 | ESV | 269.31 | 170.01 | 38.45 | 284.86 | −24.71 | 0.00 |
| Percentage | 36.50% | 23.04% | 5.21% | 38.60% | −3.35% | 0.00% | |
| 2020 | ESV | 255.83 | 160.74 | 31.35 | 310.32 | −28.26 | 0.00 |
| Percentage | 35.05% | 22.02% | 4.30% | 42.51% | −3.87% | 0.00% | |
| 2024 | ESV | 255.21 | 161.30 | 27.25 | 294.75 | −28.62 | 0.00 |
| Percentage | 35.95% | 22.72% | 3.84% | 41.52% | −4.03% | 0.00% |
| LULC Type | 2024 | 2030 | 2040 | ||||
|---|---|---|---|---|---|---|---|
| SSP126 | SSP245 | SSP585 | SSP126 | SSP245 | SSP585 | ||
| Cropland | 255.21 | 246.70 | 242.10 | 235.36 | 226.95 | 221.83 | 216.04 |
| Forest | 161.30 | 162.98 | 160.71 | 157.80 | 168.25 | 155.16 | 151.55 |
| Grassland | 27.25 | 26.68 | 25.71 | 24.69 | 29.47 | 28.76 | 28.16 |
| Water | 294.75 | 321.49 | 303.66 | 295.60 | 333.97 | 318.76 | 306.40 |
| Construction land | −28.62 | −30.32 | −31.55 | −33.23 | −34.25 | −36.03 | −37.54 |
| Unused land | 0.00 | 0.00 | 0.00 | 0.00 | 0.00 | 0.00 | 0.00 |
| Path | Path Coefficient (Direct Effects) | Indirect Effects | Total Effects |
|---|---|---|---|
| TLF → SEF | −0.5 *** | 0 | −0.5 |
| TLF → ESV | 0.291 *** | 0.100 | 0.391 |
| SEF → ESV | −0.2 *** | 0 | −0.2 |
| TSF → FF | −0.02 *** | 0 | −0.02 |
| TSF → ESV | 0.113 *** | −0.235 | −0.122 |
| CCF → FF | 0.877 *** | 0 | 0.877 |
| CCF → ESV | 0.251 *** | 0.005 | 0.256 |
| FF → ESV | −0.268 *** | 0 | −0.268 |
| Ecosystem Service | Pearson Coefficient | Moran’s I | ||||||||
|---|---|---|---|---|---|---|---|---|---|---|
| 2005 | 2010 | 2015 | 2020 | 2024 | 2005 | 2010 | 2015 | 2020 | 2024 | |
| SPY-REC | 0.868 | 0.885 | 0.885 | 0.893 | 0.882 | 0.482 | 0.468 | 0.485 | 0.471 | 0.497 |
| SRY-SPT | 0.845 | 0.820 | 0.833 | 0.816 | 0.843 | 0.379 | 0.383 | 0.392 | 0.385 | 0.409 |
| SPY-CUL | 0.708 | 0.719 | 0.709 | 0.719 | 0.741 | 0.332 | 0.335 | 0.371 | 0.343 | 0.367 |
| REC-SPT | 0.636 | 0.632 | 0.676 | 0.649 | 0.673 | 0.331 | 0.334 | 0.351 | 0.327 | 0.35 |
| REC-CUL | 0.728 | 0.727 | 0.733 | 0.724 | 0.753 | 0.556 | 0.571 | 0.587 | 0.583 | 0.584 |
| SPT-CUL | 0.886 | 0.905 | 0.918 | 0.922 | 0.922 | 0.349 | 0.364 | 0.368 | 0.354 | 0.355 |
Disclaimer/Publisher’s Note: The statements, opinions and data contained in all publications are solely those of the individual author(s) and contributor(s) and not of MDPI and/or the editor(s). MDPI and/or the editor(s) disclaim responsibility for any injury to people or property resulting from any ideas, methods, instructions or products referred to in the content. |
© 2025 by the authors. Licensee MDPI, Basel, Switzerland. This article is an open access article distributed under the terms and conditions of the Creative Commons Attribution (CC BY) license (https://creativecommons.org/licenses/by/4.0/).
Share and Cite
Liang, Y.; Zhang, L.; Li, Q.; Yang, L.; Sun, J.; Tian, G.; Wang, T.; Zhao, H.; Wang, D. Spatiotemporal Dynamics and Forecasting of Ecosystem Service Value in Zhengzhou Using Land-Use Scenario Simulation. Land 2025, 14, 2255. https://doi.org/10.3390/land14112255
Liang Y, Zhang L, Li Q, Yang L, Sun J, Tian G, Wang T, Zhao H, Wang D. Spatiotemporal Dynamics and Forecasting of Ecosystem Service Value in Zhengzhou Using Land-Use Scenario Simulation. Land. 2025; 14(11):2255. https://doi.org/10.3390/land14112255
Chicago/Turabian StyleLiang, Yazhen, Lei Zhang, Qingxin Li, Liu Yang, Jinhua Sun, Guohang Tian, Ting Wang, Hui Zhao, and Decai Wang. 2025. "Spatiotemporal Dynamics and Forecasting of Ecosystem Service Value in Zhengzhou Using Land-Use Scenario Simulation" Land 14, no. 11: 2255. https://doi.org/10.3390/land14112255
APA StyleLiang, Y., Zhang, L., Li, Q., Yang, L., Sun, J., Tian, G., Wang, T., Zhao, H., & Wang, D. (2025). Spatiotemporal Dynamics and Forecasting of Ecosystem Service Value in Zhengzhou Using Land-Use Scenario Simulation. Land, 14(11), 2255. https://doi.org/10.3390/land14112255


