Abstract
Analysis of land use sustainability (LUS) coupling socioeconomic and ecological systems has drawn the interest of researchers and decision-makers concerned with sustainable development. Exploring the relationships between land use systems can offer a coordinated route for localized and effective land governance strategies. We proposed a new theoretical framework for LUS considering coordinated development between socioeconomy and ecology. We applied it further to the Xiongan New Area, typical of a new region with government-led construction in eastern China, to explore in depth the coupling and coordination relationship among land use systems and their driving factors. Results revealed that: (1) ecological sustainability grew while socioeconomic sustainability declined in most areas of Xiongan New Area during 2010–2020 at the township level, (2) relationships among land use systems in 2010–2020 showed a trend of coordinated development, but generally, their coordination was still only at a primary and moderate level, with a shift from prominent ecological lag to prominent socioeconomic lag, (3) economic factors are critical to the coordinated development of land use systems, while the influence of ecological factors is also increasing, and (4) four development types were identified for the towns: coupling and developed, coupling and undeveloped, tradeoff and developed, and tradeoff and undeveloped. Policymakers can better appreciate the importance of government interventions in future land use planning in terms of sustainable development with the help of land use zoning optimization and sustainable land governance.
1. Introduction
Critical land use benefits including crop output, economic advancement, and ecological security play an indispensable part in guaranteeing the basic survival and development of human beings [1]. However, constrained by the limited resources of the land system, these benefits might lead to tradeoffs and potential conflicts because of divergent demands [2,3,4]. For instance, pursuing economic benefits blindly leads to disorderly urban expansion, contributing to the irrecoverable loss of ecological services and undermining the social and environmental benefits of land use [5,6]. Also, the blind pursuit of high crop yields generates high levels of greenhouse gases (GHGs) and other land ecological problems [7]. Hence, a fundamental norm to realize mutually beneficial results of various benefits of land use such as grain output, economic growth, and environmental protection is to promote coordination among them. For a long time, contradictions between socioeconomic progress and the ecological protection generated by land use patterns emphasizing economic outcomes in China have been prominent [8,9,10]. Hence, it has been prioritized to create a harmonious relationship between people and the land through scientific and prudent land development. According to the idea of ecological civilization, the core of harmonious cohabitation between human beings and nature is to focus on the LUS during the urbanization process, creating an ecologically safe regional model, and improving the interactions between beings and nature [11].
Currently, relevant studies on sustainable land use mainly focus on the definition of the connotation of sustainable land use, the construction of the evaluation index system, and the identification of influencing factors [12,13,14,15]. In the context of the definition of content, numerous frameworks have been established and used locally, regionally, and globally to achieve sustainability, such as the vulnerability framework developed by Turner et al. [16] and the socioecological systems framework of Ostrom [17]. However, as of today, the connotation of sustainable development remains fuzzy [18,19], and this lack of a single definition is often recognized as an advantage that provides the flexibility necessary to respond to changes in a specific context [20]. However, this definitional ambiguity also leads to an overly broad concept of sustainable development, which is a disadvantage for monitoring sustainable development targets [21]. Concerning the selection of indicators for evaluating LUS, some studies have selected indicators for evaluation from the perspective of the ecological-economic-social dimension, the production-living-ecological space, the global sustainable development goals, and the soil quality [22,23,24,25,26]. The United Nations 2030 Agenda for Sustainable Development depicts the global sustainable development goals (SDGs) considering socioeconomic and ecological aspects. The 17 SDGs involving land use include SDGs 1, 2, 6, 8, 9, 11, and 15. Since the introduction of the SDGs, little research has examined the system of sustainable development indicators from the standpoint of land use. Simultaneously, existing research mostly focuses on the relationship between land use systems and external factors of the system, such as climate change, urbanization, rural revitalization, human activities, water quality, and surface temperature [2,27,28,29]. These studies emphasize the potential for establishing mutually reinforcing states, specifically coupling and coordination. However, there is a notable scarcity of research exploring the interaction within the internal systems [30,31]. In particular, few studies have specifically examined the links between ecological security and socioeconomic growth within land use. If the main determinants and mechanisms underlying coupling and coordination within the land use system cannot be scientifically identified, it won’t be easy to lead the system on a sustainable development path.
Previous studies on the evaluation of sustainable land use and factor interactions have used a variety of methods, each of which has its advantages and disadvantages. In the context of the evaluation of sustainable land use, indicator estimation methods have been frequently utilized in land sustainability evaluation [24,32] because they provide comprehensive information directly to decision-makers through a set of indicators. In exploring the interaction between two or more elements/systems, commonly used methods include the coupled coordination degree model [33], structural equation modeling [34], etc. Among them, the coupled coordination degree model is most frequently utilized to examine the relationships between many aspects, including urban environmental sustainability, regional development coordination [31,35], etc. because it can be easily visualized and compared regionally [36].
New urban area refers to the new urban areas expanded on undeveloped land, original suburbs, or development zones. It is undertaken to align with the demands of social and economic growth, seeking fresh development space to achieve diverse objectives, including relieving or transferring urban functions, stimulating regional economic development, enhancing the level of innovation, etc. With the continuous expansion of cities, problems such as “big city disease” have become more and more prominent, and the theory and practice of new urban areas have been enriched and improved. At the moment, the research on new urban areas mainly centers on the innovation of investment and financing modes of new areas [37], ecological construction [38,39], land use planning [40,41,42], and land policy research [43], and the research on LUS and management in new zones still needs to be deepened. Since the establishment of the Xiongan New Area, obvious progress has been made in the preparation of territorial spatial planning and the undertaking of non-capital functions. Nonetheless, the current allocation of blue and green spaces within the Xiongan New Area constitutes a relatively small percentage of the total area, with a significant proportion dedicated to arable land. Therefore, in-depth research is required to explore and coordinate the timing of the construction of land for production, living, and ecological purposes.
This paper used Xiongan New Area as a case study to evaluate the changes in the subsystem of LUS and its coupling and coordination connection before and after the progression of Xiongan New Area, taking into account the constraints described above. The main objectives consist of (1) orienting to the framework of sustainable development goals, formulating the evaluation indicator system, and putting forward the theoretical framework of sustainable development of land use from the viewpoint of the relationship between socioeconomic development and ecological protection; (2) evaluating the spatial-temporal distribution, coupling coordination, and its driving variables of the subsystem of LUS at the township level in Xiongan New Area; (3) dividing Xiongan New Area into four different development patterns based on the level of coupled coordination and proposing corresponding policy recommendations. This study added a few things to evaluate LUS compared to earlier ones. Existing research on LUS is more concerned with comprehensive evaluation, and little research has been conducted on the relationship between human well-being and ecological performance in the land use system, therefore, this paper mainly contributes to the integrated consideration of the mutual harmonization of land use between socioeconomic development and ecological protection. Also, Xiongan New Area is a representative new area in China to ease the non-capital functions and promote the coordinated development of urban areas through providing comprehensive policy suggestions. This study is expected to provide valuable references on sustainable land use and management for policymakers in countries or regions at the same stage of development.
2. Construction of an LUS Index System Based on Social-Ecological Systems Theory and SDGs
2.1. Theoretical Framework
The term “social-ecological system” refers to the coupling system formed by the interaction between people and nature, sometimes referred to as a “complex human-earth system” or “human-nature coupling system”, which has the characteristics of complexity, nonlinearity, uncertainty, and multi-layer nesting [44,45]. This theory, put out by Nobel Laureate Ostrom [46], offers a fresh analytical approach and a new theoretical viewpoint for addressing the issue of sustainable resource management. According to the theory, human actions alter and change the structure and function of the ecosystem, resulting in ecosystem products and services that improve human well-being. Humans and nature are intertwined and dependent on one another [47].
We built the land use system using the theory of the social-ecological system. Humans use land sophisticatedly for both commercial and natural reproduction to produce goods and sustain themselves. The land use system contains the socioeconomic system, which has human activities at its core, and the ecological system, which has land ecological products and services at its center. Ecosystems can give high-quality ecological products, services, and protection, whereas socioeconomic systems can offer economic advantages, social security, and life services [48]. There is interaction between the two subsystems. Among them, the social and economic system can increase the effectiveness of resource exploitation through technological advancement, and financial assistance can restore ecological balance. The ecological system, in turn, serves as the social and economic foundation for growth and ensures and supports how those systems function. Geographically, the terms “socioeconomic development system” and “ecosystem” refer to the entirety of the territorial space, including all agricultural, undeveloped, and construction land.
In land utilization, land users can realize rational and efficient use of land through territorial planning, among other ways, to enhance the quality of human life as much as possible, protect land resources from harm, and gain the best social-economic benefits and ecological benefits. The United Nations’ 2030 Agenda for Sustainable Development guides a new development direction for land sustainability. The objectives related to land use can be summarized into two main categories: fair and efficient land use, and improvement of the ecological habitat. The main socioeconomic goals related to land use include SDGs 1 (no poverty), 2 (zero hunger), 3 (good health and well-being), 8 (economic growth), and 11 (social security). The main ecological goals related to land use include SDGs 6 (water conservation) and 15 (life on land).
The notion of coupling coordination degree (CCD) was proposed to explore the intricate interactions between the socioeconomic system and the ecosystem in a sustainable land use system. “Coordination” denotes the level of consistency between subsystems and the degree of proximity to the desired goal. At the same time, “coupling” represents the phenomena of two or more systems interacting with one another in different modes of motion [49]. To gauge the degree of synergy among interacting subsystems, the level of coupling coordination serves as an index. The synergy between subsystems is more potent when the value is higher.
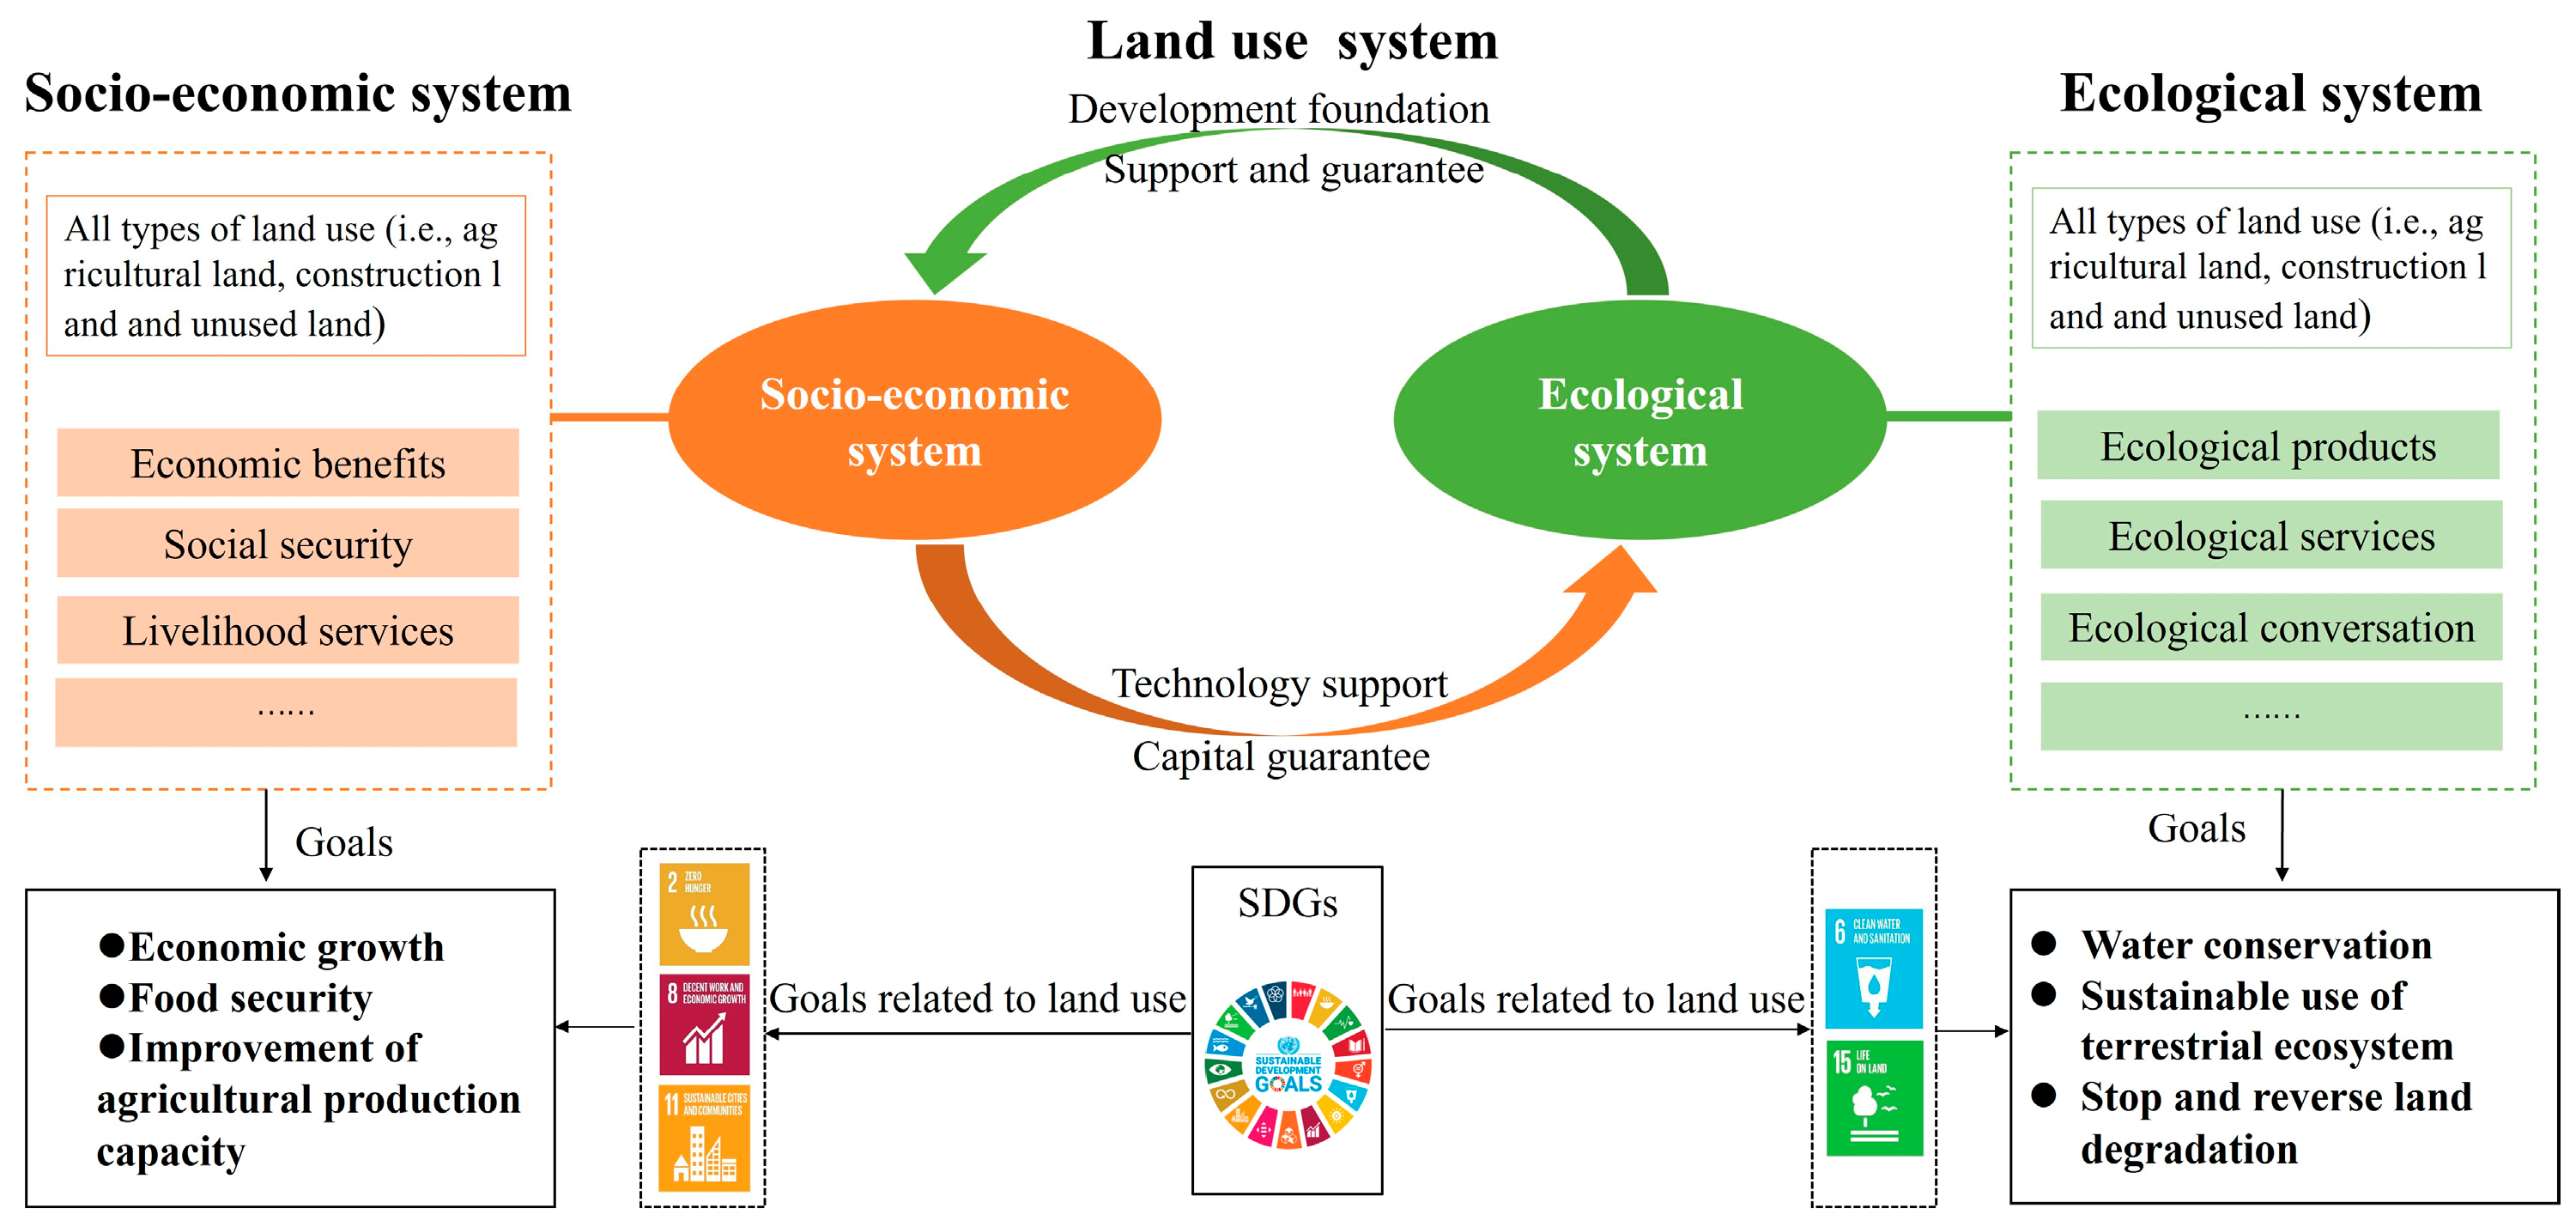
In conclusion, this paper linked the SDGs with the social-ecological systems theory to explore the level of LUS and used the coupling coordination degree model to examine the interactions between sustainable land use subsystems (Figure 1). The graphic illustrates how human activities can combine several components of the land use system to create a closed-loop system. Ideally, each of the subsystems should be in some state of equilibrium, suggesting that a high degree of connectivity and coordination between the different subsystems is necessary for the regional land-use system to continue functioning correctly. However, coordination among land use subsystems is uncommon. One cause could be that excessive human activity greatly strains the equilibrium point. Therefore, local governments would be assisted in adopting targeted policies and actions to manage the link between various land use systems and bolster the joint development of the socioeconomy and ecology.
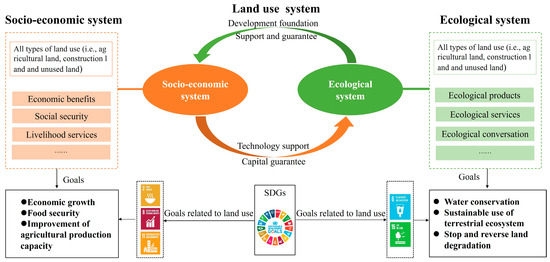
Figure 1.
Theoretical framework of the coordination relationships between sustainable land use subsystems.
2.2. Construction of Indicator System
Drawing on existing research and following the norms of systematization, scientificity, representativeness, and accessibility, we developed the evaluation indicator system of LUS by using the above theoretical framework (Table 1) [1,50]. Based on SDG 1, 2, 8, and 11, four indicators were selected for the socioeconomic aspects, including population density [24,51,52], average GDP per km2 [53], grain output, and output of agriculture, forestry, animal husbandry, and fisheries (AFAHF). Among them, population reflects the size of a region’s labor force and the scale of demand for social services and market potential, and changes in population size are of great significance for social stability and high-quality development of the population and economy. GDP is a core indicator of the size of a region’s economy. These two indicators correspond to the entire national land space, including arable land, construction land, ecological land, and unused land. Grain output is the basis for social development, reflecting the region’s food security situation, and the proportion of cultivated land in the Xiongan New Area consistently accounts for more than 50%. The AFAHF reflects the economic vitality of the agricultural sector, helping to increase employment opportunities and improve the economic situation of farmers. These two indicators mainly refer to arable land, namely paddy fields and drylands.

Table 1.
Indicatory system for land use sustainability.
Based on SDG6 and SDG15, four indicators were selected in terms of ecological sustainability, including normalized difference vegetation index (NDVI), soil conservation, net ecosystem productivity (NEP), and water production [54,55,56,57]. Among them, NDVI reflects the ecological characteristics of the region, and the ecological performance of the region can be traced by measuring NDVI [58]. Water yield and soil conservation are the main ecosystem services in Xiongan New Area, which are important for the sustainable development of the land [59]. Land use change can not only change the carbon sequestration in the land ecosystem but also change the carbon emission in the anthropogenic intensive area [60]. The sustainable development of the Beijing-Tianjin-Hebei region pays much attention to the carbon cycle and is committed to improving the ecosystem’s carbon sink function [61]. Therefore, NEP is chosen as an indicator to measure the carbon balance of the Xiongan New Area.
3. Materials and Methods
3.1. Study Area
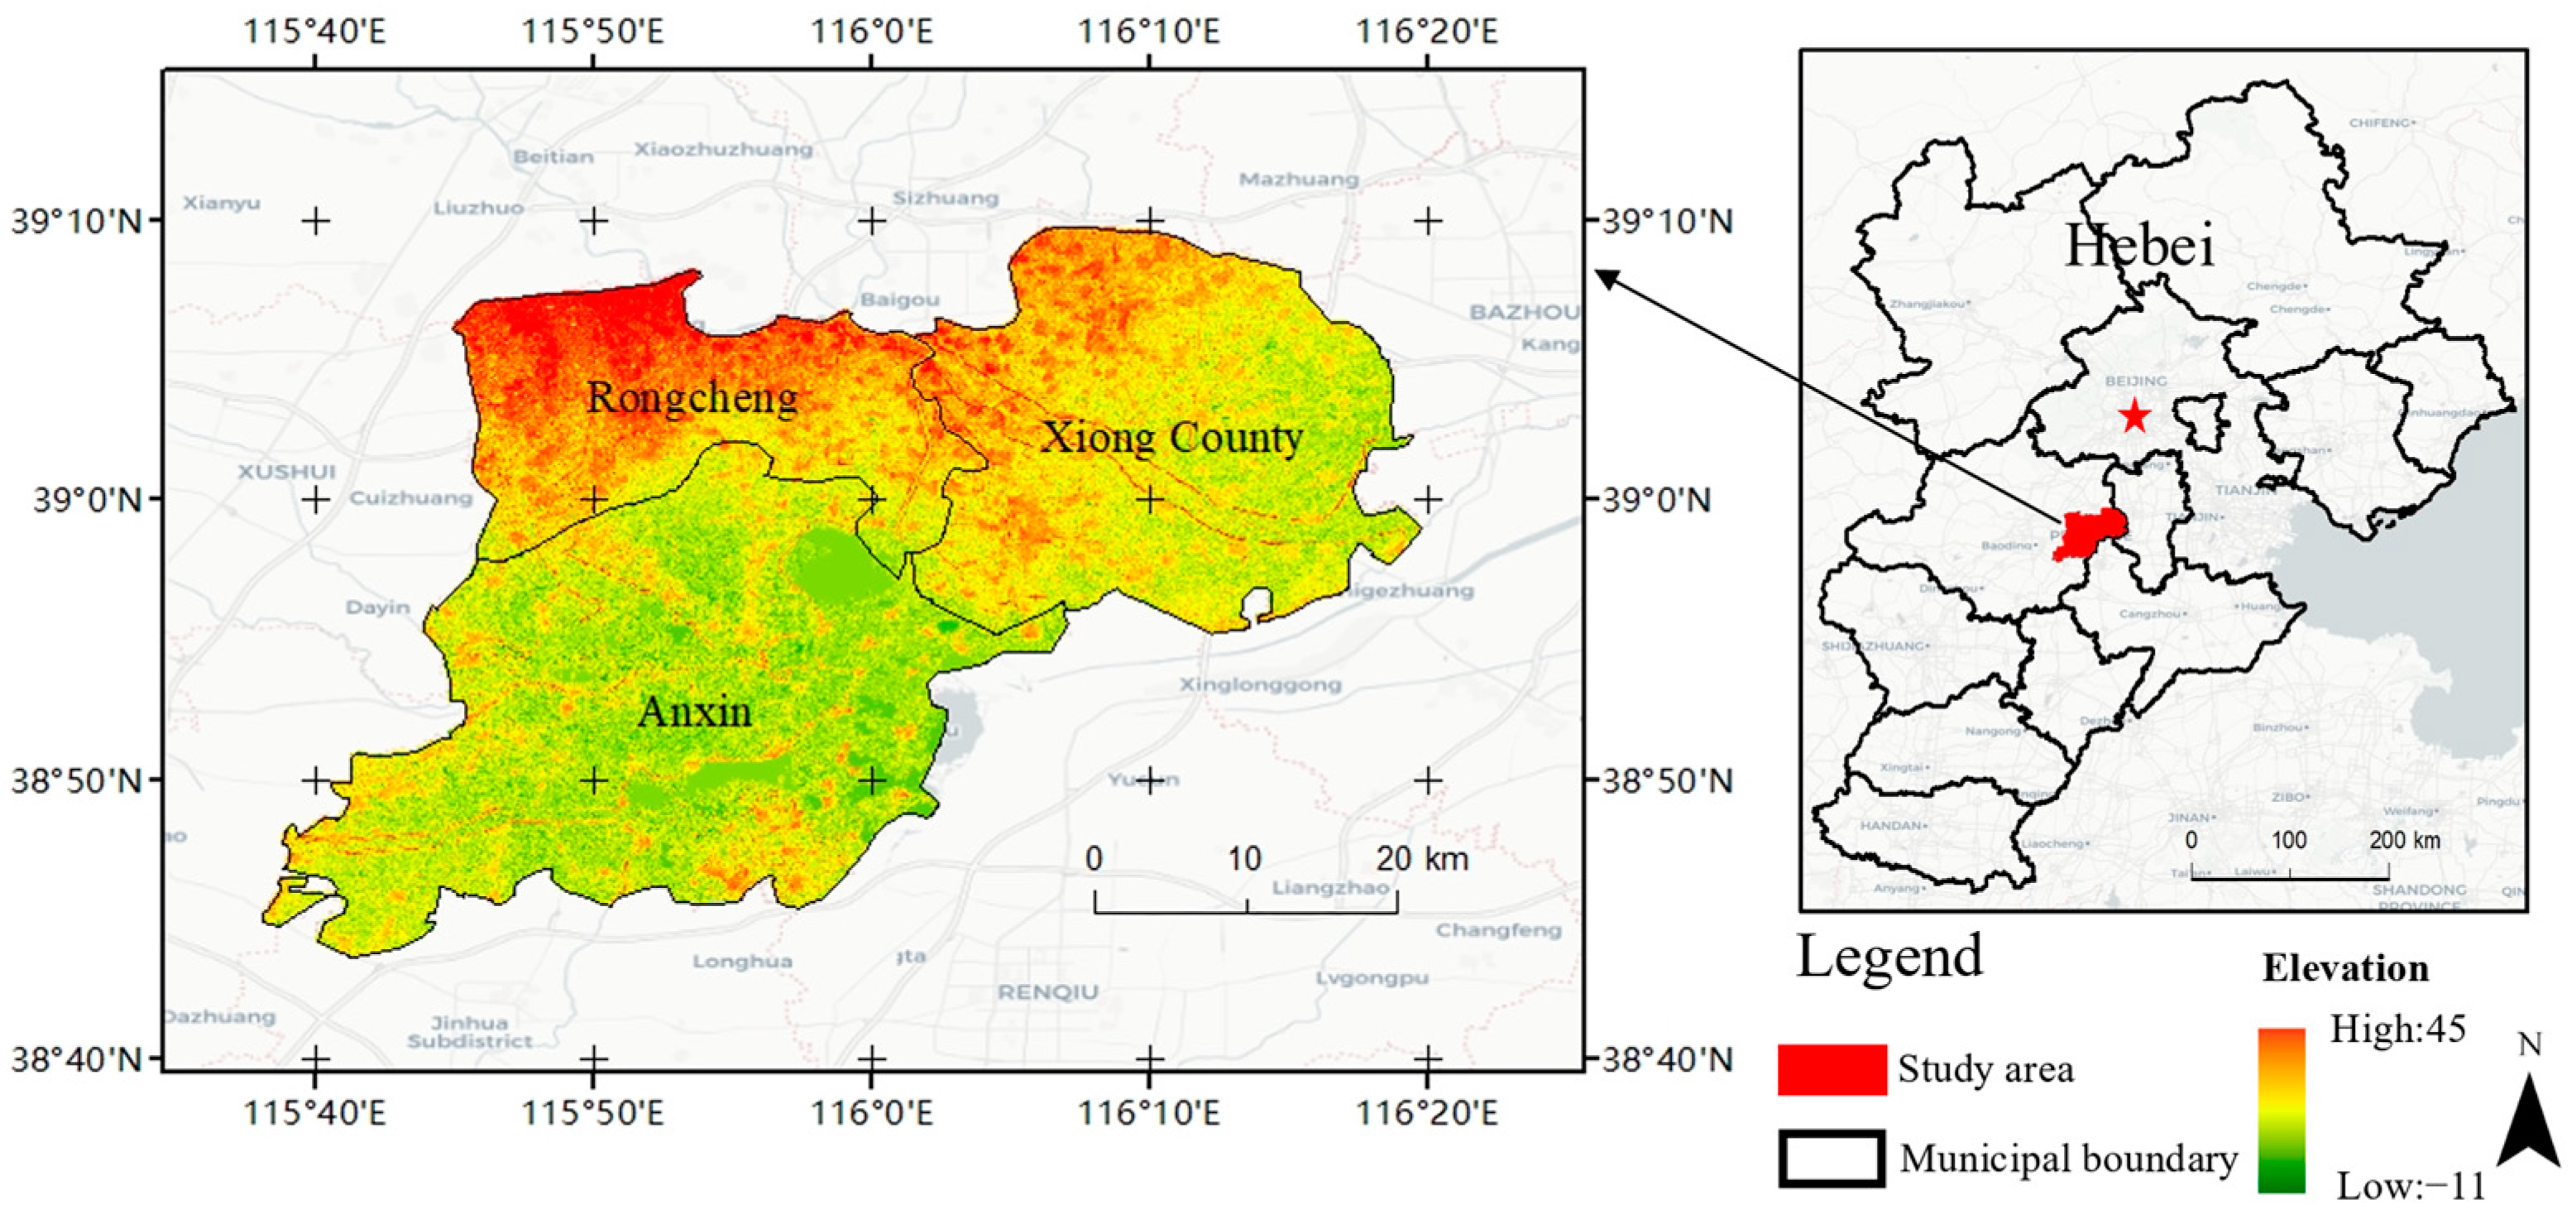
The middle Hebei province location of Xiongan New Area is 55 km from Beijing Daxing Airport, 155 km from Shijiazhuang, and 105 km from Tianjin (Figure 2). Xiong County, Anxin County, Rongcheng County, and the neighboring areas make up the region, which has a total size of 1770 km2. In the northwest and southeast, the terrain is high and low, respectively. At the end of 2020, Xiongan New Area had 1.29 million people, a per capita GDP of 20,294 yuan, and a 42.75% urbanization rate. The Chinese government vigorously pushed for the Xiongan New Area in 2017 after the Shenzhen Special Economic Zone and the Pudong New Area in Shanghai. Since its founding, over 800 billion yuan has been allocated to important projects that Xiongan New Area has planned and supported. The Master Plan of Xiongan New Area of Hebei Province (2018–2035) states that Xiongan New Area will take over Beijing’s non-capital functions, explore and implement new development modes, and deal with urban sprawl and “urban diseases”. Xiongan New Area would unavoidably undergo significant land use cover/change due to the forthcoming massive urban building, and will also have to deal with issues like population change, industrial transformation, and mounting strain on natural resources [40,62]. The research areas for this study were Rongcheng, Xiong County, and Anxin County.

Figure 2.
Location of Xiongan New Area.
3.2. Data Sources
In this paper, data from 2010 and 2020 were collected, respectively. Heterogeneous data from multiple sources in this research include socioeconomic statistical data and spatial data. All data are converted to township-based statistical units using the ArcGIS “subdistrict statistics”.
The spatial data includes land use, NDVI, DEM, meteorological, soil, depth of bedrock, and Net Primary Productivity (NPP) data in 2010 and 2020. The land use data of 30 m in the Xiongan New Area was obtained from the 30 m annual land cover in China (http://doi.org/10.5281/zenodo.4417810, accessed on 28 November 2023). The dataset utilizes LandSat data, which consists of nine land use types. The NDVI data with 30 m resolution are from the National Data Center for Ecological Sciences (https://earthdata.nasa.gov/esds/competitive-programs/measures/nasadem, accessed on 28 November 2023). DEM data is from the National Aeronautics and Space Administration (NASA) global 30-m resolution DEM data (https://earthdata.nasa.gov/esds/competitive-programs/measures/nasadem, accessed on 28 November 2023). Meteorological data covers 1 km of monthly precipitation (1960–2020), 1 km of mean monthly temperature (1901–2022), China’s annual spatially interpolated dataset of meteorological elements, and 1 km of monthly potential evapotranspiration data. They are from the National Earth System Science Data Center (http://www.geodata.cn/data/datadetails.html?dataguid=34595274939620&docid=1065, accessed on 28 November 2023; http://www.geodata.cn/data/datadetails.html?dataguid=34595274939620&docid=1065, accessed on 28 November 2023) and Resource and Data Science Center of the Chinese Academy of Sciences (https://www.resdc.cn/DOI/DOI.aspx?DOIID=96, accessed on 28 November 2023). Soil data are obtained from the 1:1 million soil map of China in the Harmonized World Soil Database (https://cuesdata.pku.edu.cn/index.php?c=content&a=show&id=730, accessed on 28 November 2023). Root depth data were obtained from 100 meters depth-to-bedrock map of China (https://wwwnature.53yu.com/articles/s41597–019-0345–6, accessed on 28 November 2023). NPP data at 500 m resolution were obtained from MODID MOD17A (https://lpdaac.usgs.gov/product_search/?view=list, accessed on 28 November 2023).
Socioeconomic statistics include grain production, AFAHF, population, and GDP for Xiongan New Area in 2010 and 2020. Grain production and AFAHF are based on townships as statistical units, and they are from the Hebei Rural Statistical Yearbook and Baoding Economic Statistical Yearbook. Population data and GDP data were provided by the Resources and Environmental Sciences and Data Center, Chinese Academy of Sciences (https://www.resdc.cn/DOI/DOI.aspx?DOIID=32, accessed on 28 November 2023).
3.3. Methods
3.3.1. Calculation of Indicators of LUS
The indicators of LUS include two dimensions: socioeconomic sustainability and ecological sustainability, of which the socioeconomic sustainability indicators and NDVI in ecological sustainability, totaling five indicators, can be obtained directly through the field calculator of ArcGIS. Three indicators of soil conservation, water yield, and NEP are calculated as follows.
- (1)
- Soil conservation model
The soil conservation function is calculated using the InVEST model and integrates land use data, soil attributes, and data such as DEM data, rainfall data, and vegetation cover factors. It also operates on a raster basis, and produces two assessment results based on the watershed and the raster cells. Two kinds of evaluation results are based on watershed and raster cells.
where is the amount of soil retention (t) of grid x. is the sediment retention of grid x (t). is the actual erosion amount of grid x and its upslope grid y (t). factor denotes rainfall erosive force factor; denotes soil erodibility coefficient; L denotes slope length coefficient; denotes slope degree coefficient; denotes vegetation cover coefficient (dimensionless); denotes preservation measures coefficient (dimensionless). is the sediment retention effectiveness of grid x.
- (2)
- Water Production Model
The water production module of the InVEST model determines the amount of water produced for each unit by deducting the actual evapotranspiration from the precipitation for that unit. The formula is:
where denotes the water yield of unit x of land cover type j; denotes the actual evapotranspiration of unit x of land cover type j; denotes the annual precipitation of unit x, is the ratio of the potential evapotranspiration to the precipitation, denotes the effective utilization of water content of the plant in mm, denotes the potential evapotranspiration of unit x in mm, denotes the evapotranspiration coefficient of a vegetation type.
- (3)
- Net ecosystem productivity (NEP) estimation methods
NEP is essential for determining carbon sources/sinks in vegetated ecosystems and is calculated from the difference between NPP of vegetation and soil dissimilarity respiration (Rh). The calculation formula is as follows:
where is soil dissimilarity respiration, and the unit of the above parameters is gC/m2. When NEP > 0, it means that vegetation absorbs more carbon than respiratory emission, which is manifested as a carbon sink. On the contrary, it is a carbon source.
where T is the temperature (°C) and R is precipitation (mm).
3.3.2. Global Entropy Method
The weight of each index is determined in this study using the global entropy approach (Table 1). The following are specific calculation steps:
Construct the global evaluation matrix X:
where m denotes towns, n denotes evaluation indicators, and T denotes years.
Data standardization. For the positive indicators, the bigger the better, the formula is adopted:
where i = 1, 2…, m; j = 1, 2…, n; t = 1, 2…, T.
For negative indicators, the smaller the better, the formula is adopted:
The proportion of the ith index in the jth index in the t year was calculated using Equation (14).
Equation (15) were used to determine the entropy of the jth index.
where 0 ≤ ≤ 1; K = 1/ln(mT).
The weight was calculated using Equation (16).
where is the weight of the jth index, 0 ≤ ≤ 1; () is known as the difference coefficient.
The sustainability of the land use subsystem was calculated using Equations (17) and (18).
where is the socioeconomic sustainability of the ith township in the t year, and is the ecological sustainability of the ith township in the ith year.
3.3.3. Coupling Coordination Degree Model
Physics is the source of coupling coordination, which describes the degree of system interaction and is used to determine whether there is a coordination relationship between various elements. Therefore, using Equations (19)–(21), the degree of linkage coordination among the subsystems of land sustainable use was estimated.
where is the degree of coupling and coordination between sustainable land use subsystems in the year t of the i town, 0 ≤ ≤ 1. When the value of the is larger, it denotes a higher degree of coordination of the sustainable land use system. To comparatively analyze the characteristics of CCD in various geographic areas, we divide the CCD into six levels based on previous studies [30,63]. To further understand the aspects of relative lag that impede the coordinated development of coupling, we compare the relative sustainability of the socioeconomic and ecological subsystems [49] (Table 2).
Table 2.
Level of the CCD.
3.3.4. Geographical Detectors
In this paper, the geographic detector model was used to examine the influence degree of main factors on CCD [64]. The formula is:
where q is the degree of influence of each factor on the coupling coordination; h is the classification number of the independent variable X, h = 1, 2… L; and N are the number of samples of the independent variable type h and the number of samples in the whole study area, respectively and are the variances of h and R, respectively. The range of q’s value is 0 to 1.
4. Results
4.1. Spatial-Temporal Pattern of Sustainable Land Use Subsystems at the Township Level
To examine the changing features of four socioeconomic indicators, four ecological indicators, and the sustainability performance of the land use subsystem in each town, data from Xiongan New Area were collected in 2010 and 2020.
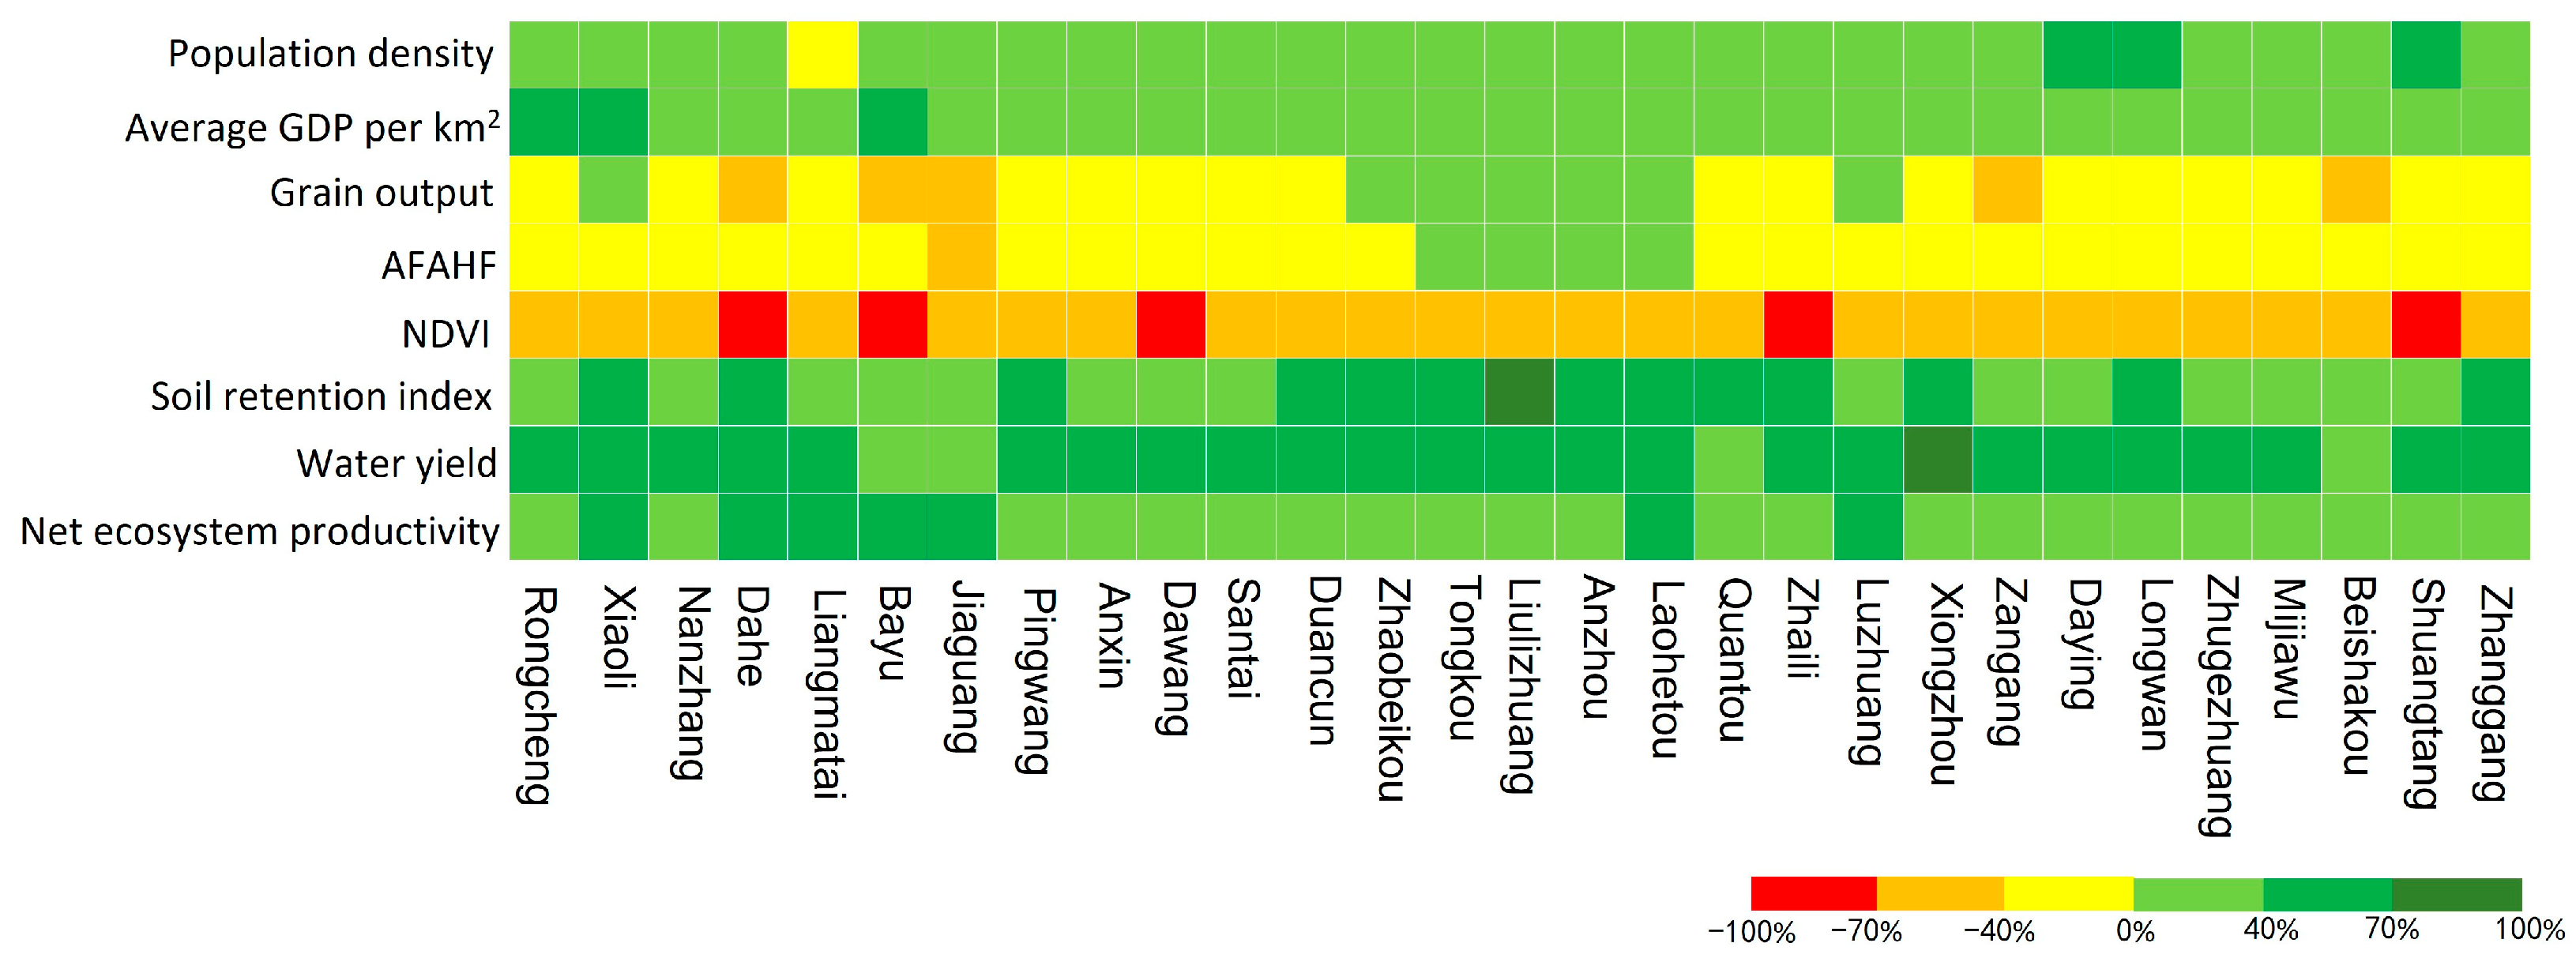
With the construction and development of Xiongan New Area, half of the socioeconomic indicators—population density and average GDP per square kilometer—increased in most of the towns, while the other half—grain output and the output of AFAHF—decreased in most of the towns from 2010 to 2020. This is according to the perspective of the change characteristics of various indicators regarding social economy (Figure 3). It suggests that while the new area’s economy is more robust and its population is growing, the agricultural output, particularly the yield of grain, is somewhat impacted. Ecology-wise, following the development of the new district, except NDVI, which significantly decreased, soil conservation, water production, and net ecosystem productivity all exhibited a trend toward growth, indicating that the service functions of water and soil conservation, water supply, and carbon sequestration gradually improved. Based on the land use transfer matrix (Table 3), it can be found that cropland and impervious surfaces are the land use types with the largest increase or decrease in area. Specifically, the decrease in NDVI is due to the continuous occupation of cropland and grassland by the development of new areas, and the significant decrease in the area of cropland and grassland, resulting in a decrease in vegetation cover. The increase in soil conservation services is mainly related to the increase in the area of forested land, where vegetation can reduce soil erosion and improve soil conservation capacity. The increase in water production is related to the increase in precipitation in the region, in addition to the increase in water area, which enhances ecosystem diversity to provide ecosystem services such as water production. The increase in NEP is mainly related to the increase in forested land area and the improvement of forested land quality, and the increase in the rate of plant photosynthesis, which accelerates the efficiency of ecosystems in absorbing and storing carbon.
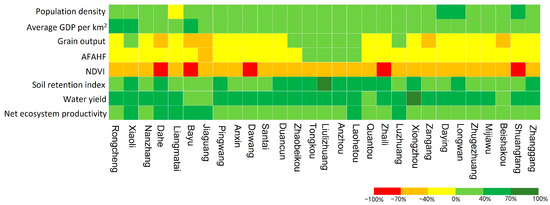
Figure 3.
Change rate of the index of each town in the Xiongan New Area from 2010 to 2020.
Table 3.
Land use transition matrix of Xiongan New Area from 2010 to 2020 (km2).
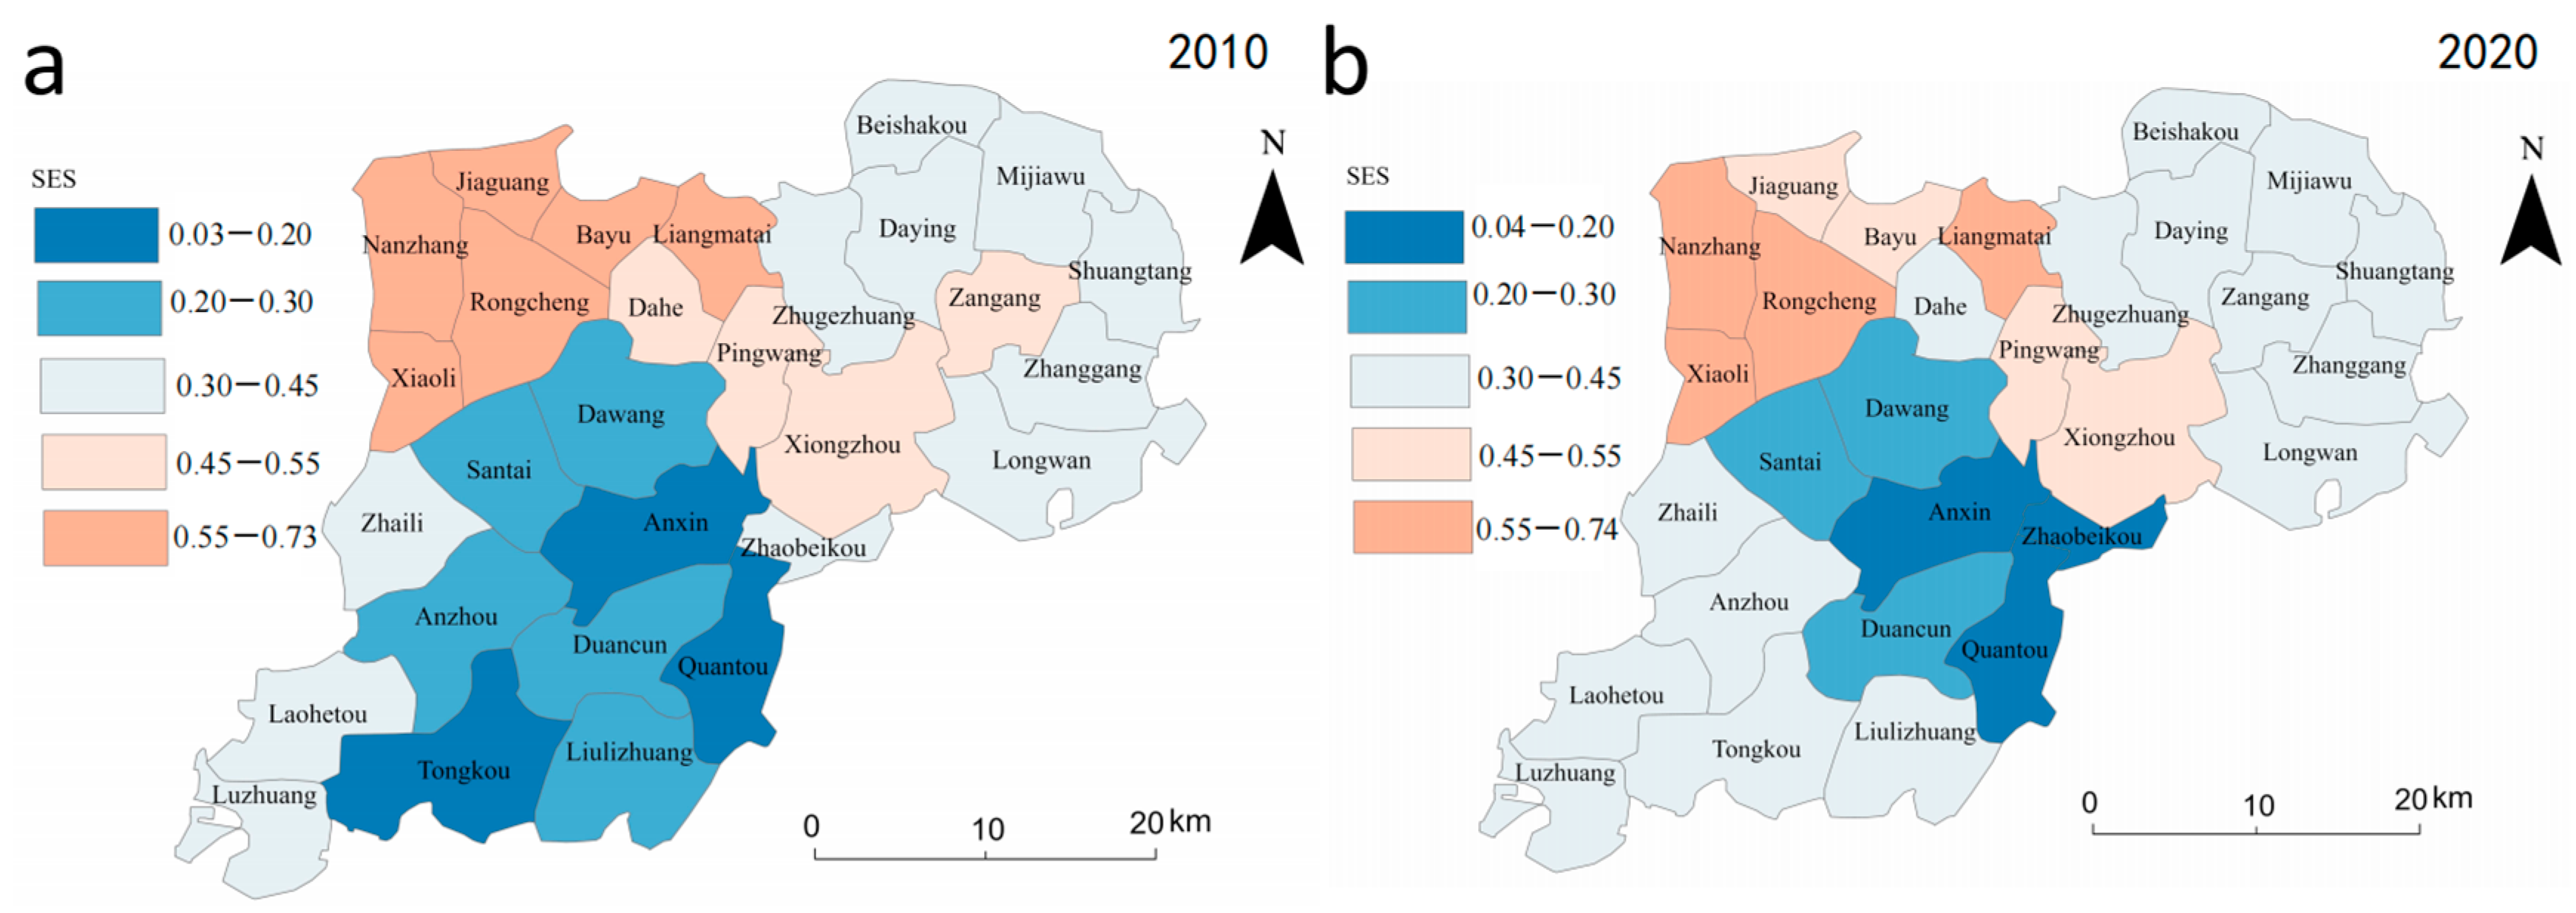
From the standpoint of the socioeconomic sustainability of the subsystem of land use, Xiongan New Area exhibits regional disparities (Figure 4a,b) and the imbalance of socioeconomic growth is still pronounced. Compared to Xiong County and Anxin County, Rongcheng County has a much better economic advantage. The southern townships of Anxin County show a more pronounced increase in socioeconomic sustainability between 2010 and 2020 (Figure 4e), with about half of the townships showing a decreasing trend. In general, the Xiongan New Area is still under development, has little industrial transformation, and has more room for social and economic sustainability growth.


Figure 4.
Sustainability and change of land use subsystem in Xiongan New Area in 2010 and 2020. (a,b) represent the spatial distribution of socio-economic sustainability in 2010 and 2020, respectively, (c,d) represent the spatial distribution of ecological sustainability in 2010 and 2020, respectively, and the (e,f) represent changes in socio-economic sustainability and changes in ecological sustainability, respectively.
From the standpoint of ecological sustainability, towns in the western Xiongan New Area are always better than those in the east (Figure 4c,d). Environmental sustainability has increased during the last 10 years in all municipalities, mainly in the southern parts of Xiong County and Anxin County (Figure 4f). The findings demonstrate that Xiongan New Area follows the planning philosophy of ecological priority and sustainable development and actively pursues ecological quality improvement projects like “Millennium Forest” and reclaiming farmland from lakes against the backdrop of China’s ecological civilization construction.
4.2. Coupling Coordination between Sustainable Land Use Subsystems at the Township Level
4.2.1. Spatial and Temporal Coupling Coordination Degree of Sustainable Land Use Subsystems at the Township Level
Xiongan New Area’s total coupling coordination improved between 2010 and 2020 as indicated in Table 4, with a trend of “primary coordination narrowing and moderate coordination expanding”. Regarding primary coordination, the aggregate mean across the 29 research units increased from 0.61 to 0.65. The extreme value increased to varying degrees (both the maximum and minimum values did as well).
Table 4.
Measurement results of the CCD of Xiongan New Area in 2010 and 2020.
From 2010 to 2020, we looked at the spatial-temporal changes in the connection between socioeconomic sustainability and ecological sustainability in all of the towns in the Xiongan New Area (Figure 5). In 2010, the spatial pattern of CCD in Xiongan New Area was enhanced from the southeast to the northwest (Figure 5a), with high-value areas centered primarily in Rongcheng County, and low-value areas primarily centered in Anxin Town, Duancun Town, Tongkou Town, and Quantou Town in Baiyangdian Basin. In 2020, the geographical heterogeneity of the coupling coordination degree was evident (Figure 5b), with high-value areas dispersed in Rongcheng County, the south of Anxin County, and Xiong County, all of which had a significant synergistic impact, namely moderate cooperation. The Quantou Town and Anxin Town had a weak coupling coordination. We used the linear regression method to examine the trends of CCD from 2010 to 2020 to depict the trend more fully. CCD increased in 24 out of 29 towns between 2010 and 2020 (Figure 5c), especially in the southern part of Anxin County, showing that Xiongan New Area has made significant progress toward realizing the coordinated growth of the land use system.
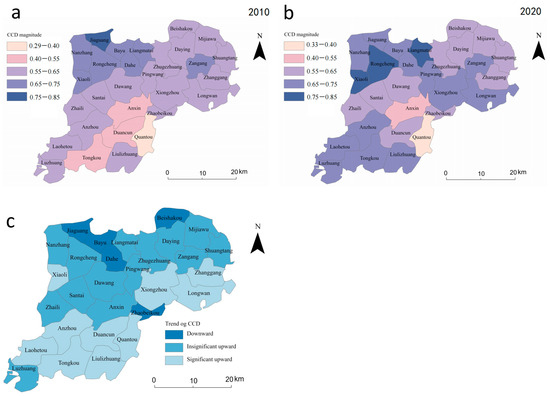
Figure 5.
Spatial distribution and trend of CCD in Xiongan New Area in 2010 and 2020. (a,b) represent the spatial distribution of coupling coordination degree in 2010 and 2020, respectively, and (c) represents the trend of coupling coordination degree from 2010 to 2020.
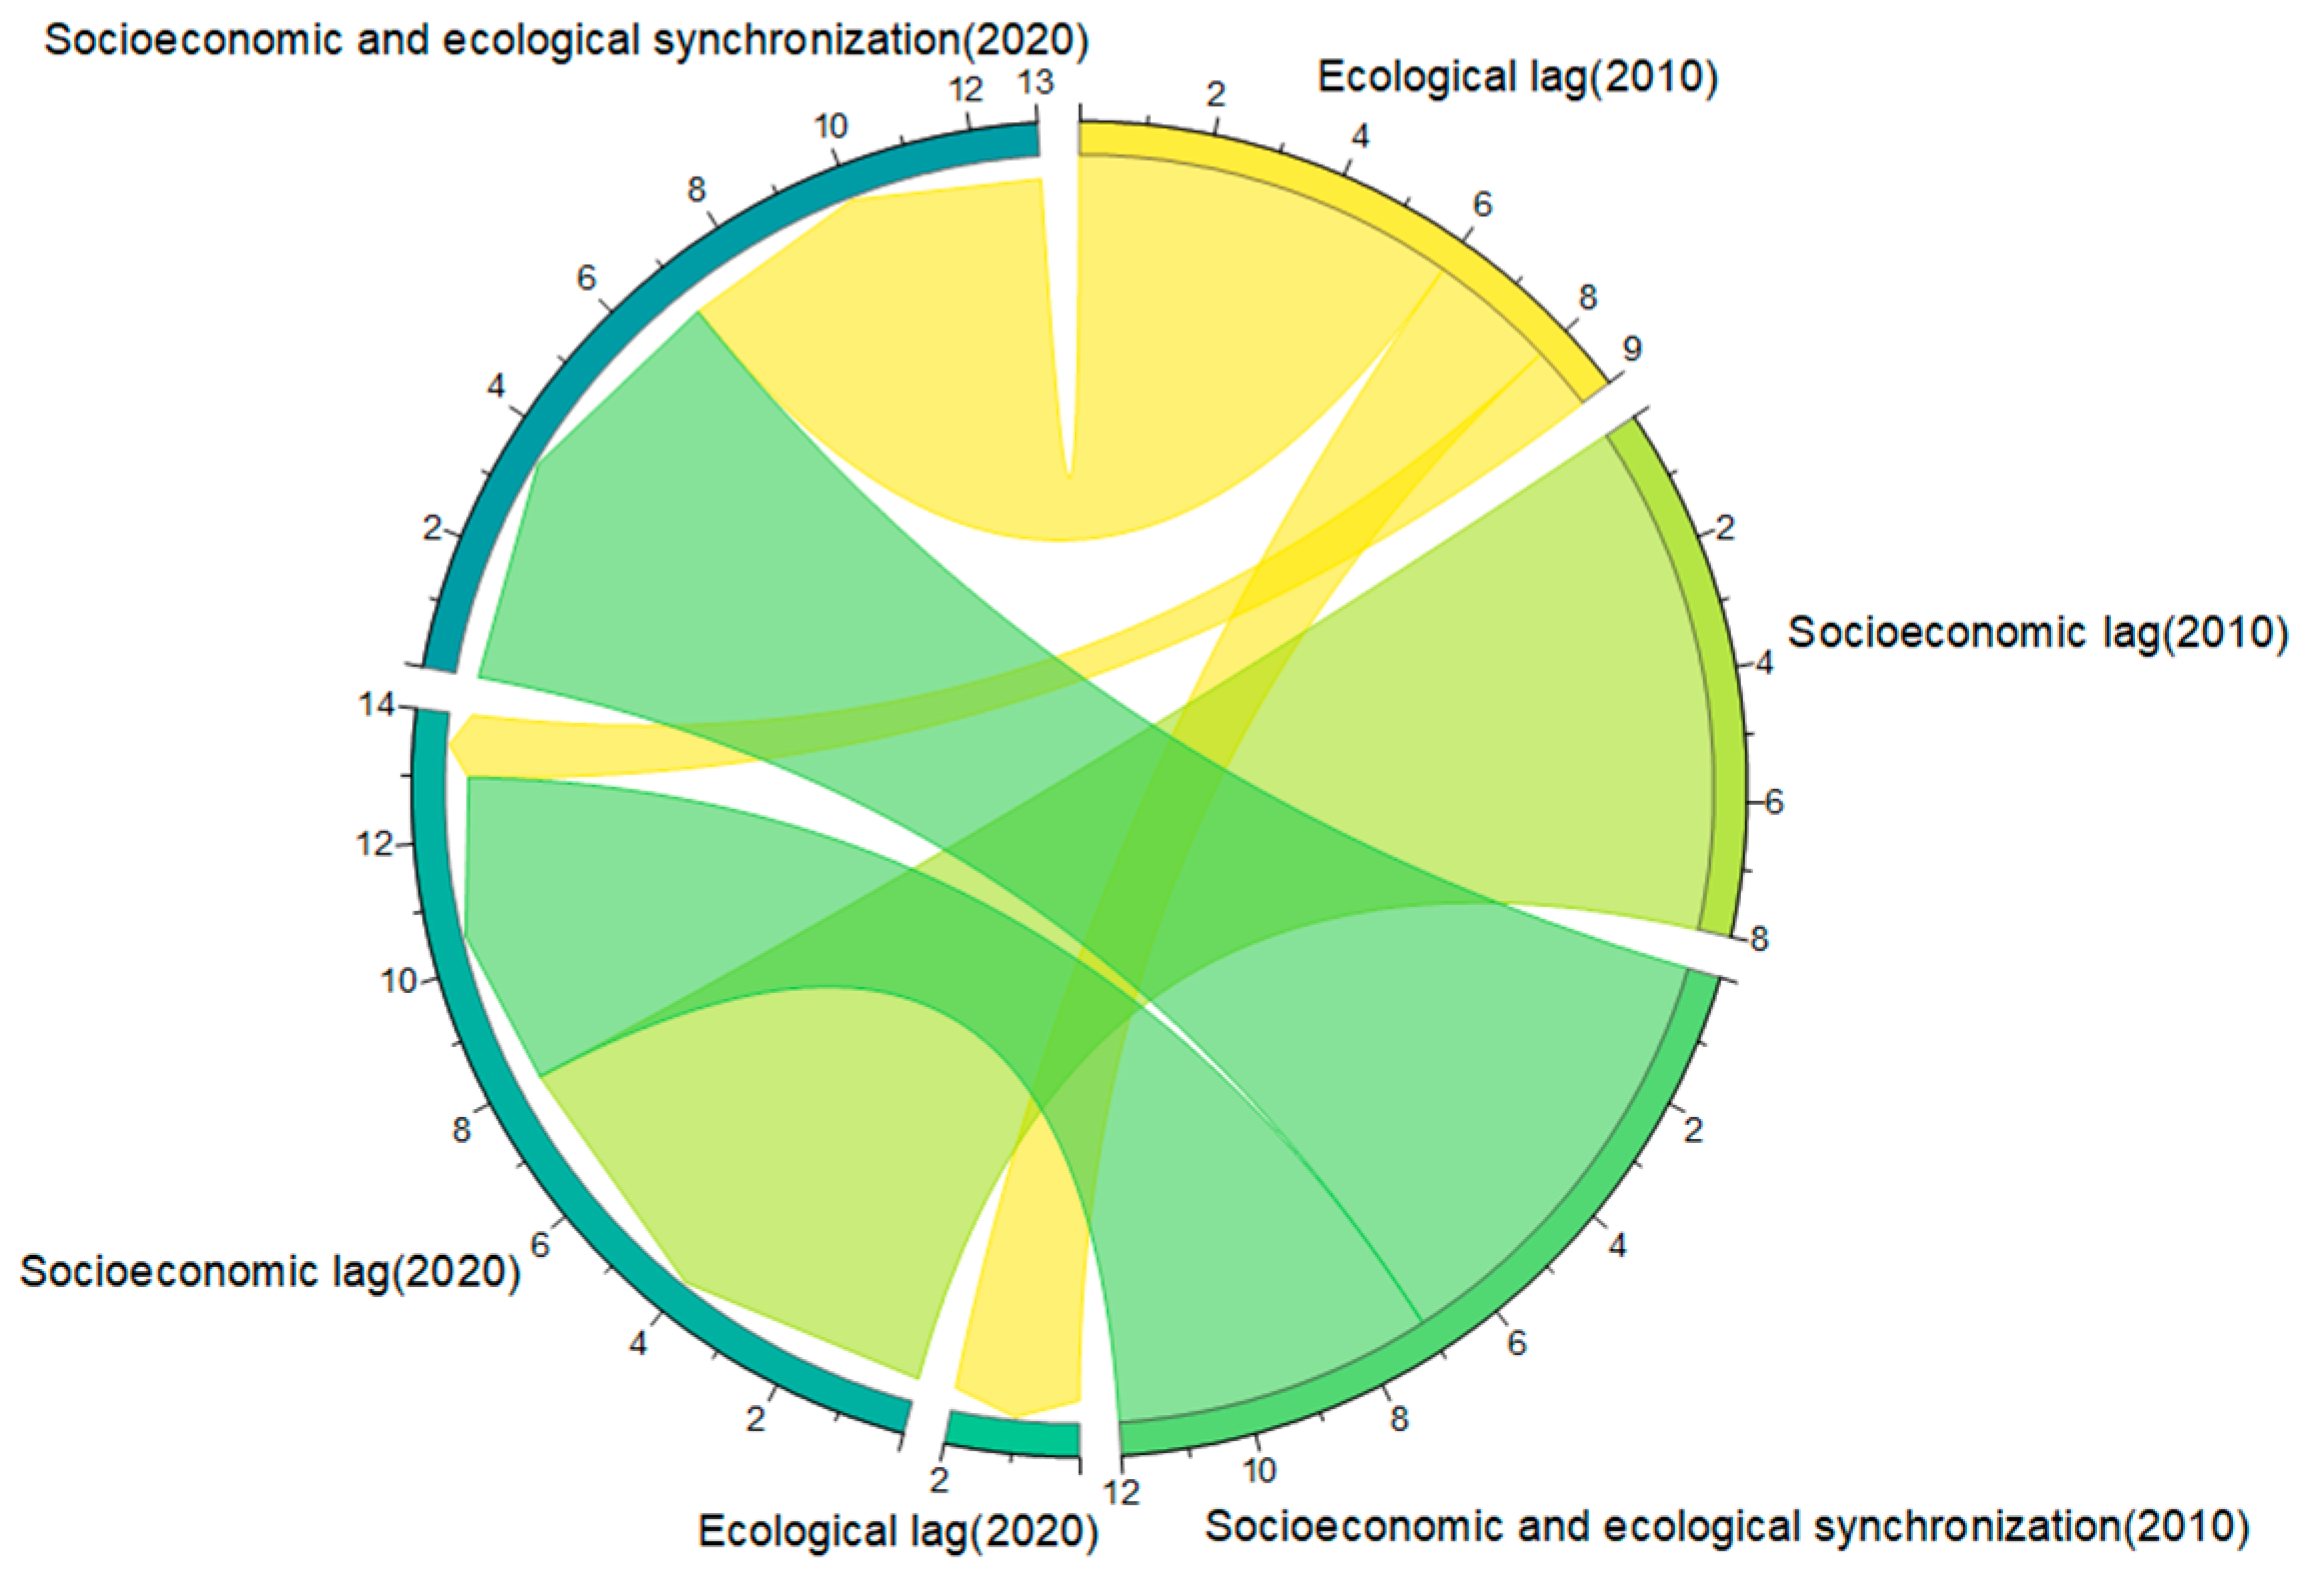
The transfer matrix model and chord diagram were used in this work to quantitatively quantify and visually express the changes during the study period from 2010 to 2020 to illustrate the type of transformation of the CCD (Table 5 and Figure 6). In 2010, there were three towns with incoordination, however by 2020, Quantou township and Anxin township in Anxin county remained incoordination, while Tongkou township in Anxin county transitioned to primary coordination. Eighteen towns were in primary coordination in 2010, and by 2020, eleven of those towns—mainly in the northeastern parts of Anxin County and northwestern parts of Xiong County—will still be in primary coordination. Seven towns mainly in the southern parts of Anxin County were in moderate coordination. In 2010, there were seven towns with moderate coordination, but by 2020, three townships in Rongcheng County and one township in Xiong County were still in moderate coordination, and three townships in Rongcheng County transitioned to higher coordination. In conclusion, the level of coordination of the sustainable land use subsystem in Xiongan New Area has improved things significantly in general, and in particular, the rate of improvement of the level of coordination in the townships in southern Anxin County has been faster.
Table 5.
Transfer Matrix of coupling coordination type of land use subsystem in Xiongan New Area from 2010 to 2020 (%).
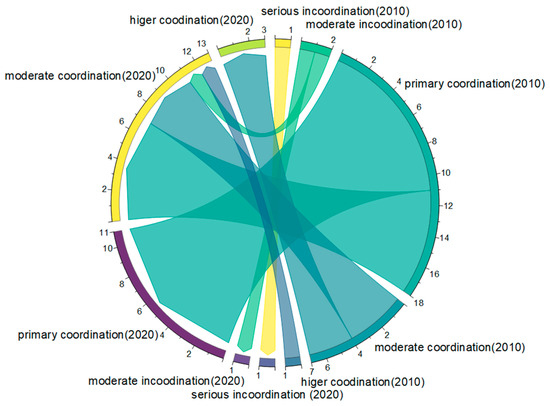
Figure 6.
Transfer map of coupling coordination type of land use subsystem in Xiongan New Area from 2010 to 2020. Clockwise rotation from the yellow arc at the top of the chord diagram, which in turn represents: serious incoordination (2010); moderate incoordination (2010); primary coordination (2010); moderate coordination (2010); higher coordination (2010); serious incoordination (2020); moderate incoordination (2020); primary coordination (2020); moderate coordination (2020) and higher coordination (2020).
4.2.2. Relative Sustainability Performance of Land Use Subsystems at the Township Level
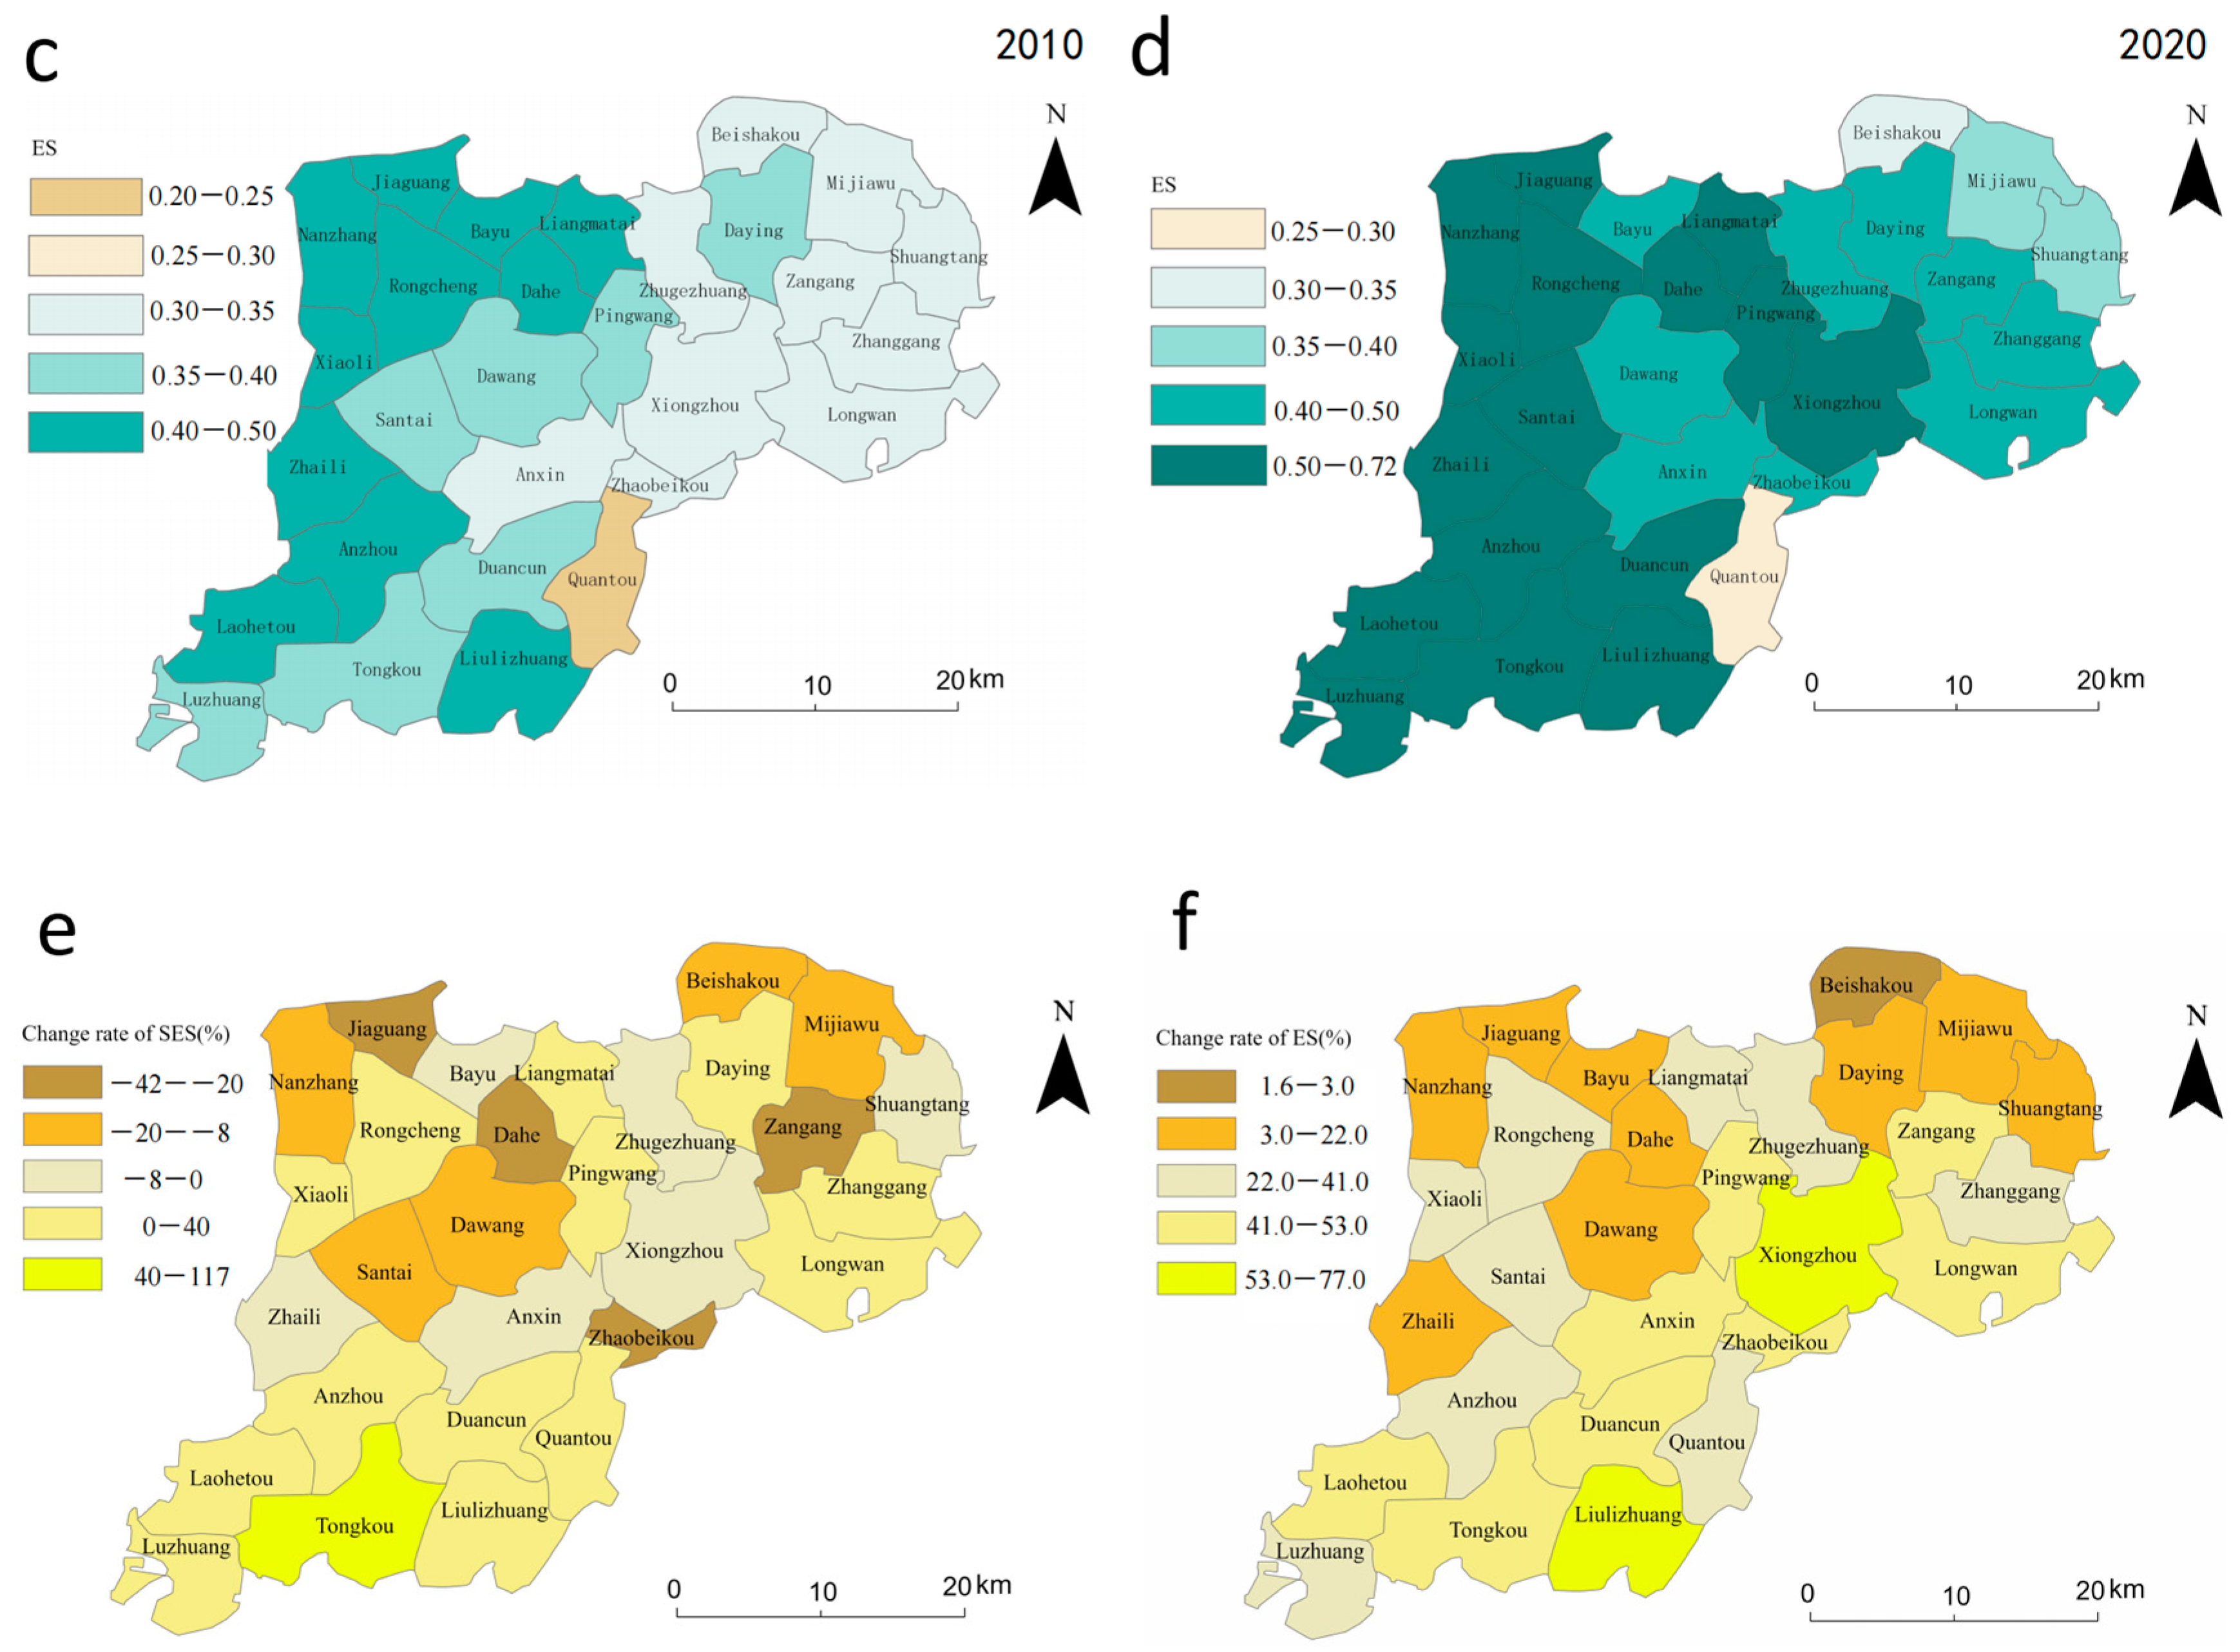
We compared and analyzed the changes in each town’s socioeconomic and ecological performance using the transfer matrix and string diagram to investigate further the relative lagging factors that impede the growth of the CCD. In this work, the transformation of lag types is examined using a transfer matrix and chord diagram (Table 6 and Figure 7). In 2010, there were nine towns with ecological lag. By 2020, Rongcheng Township and Xiaoli Township in Rongcheng County remained in ecological lag, Xiongzhou Township in Xiong County shifted to socioeconomic lag, and six townships, mainly in Rongcheng County, shifted to socioeconomic and ecological synchronization. In 2010, there were eight townships with socioeconomic lag, and by 2020, these townships were still in their original state. In 2010, there were 12 townships with socioeconomic and ecological synchronization. By 2020, seven towns remained the same type, while five towns, mostly in Anxin County, transitioned to socioeconomic lag. Xiongan New Area generally exhibits “overall coordination, ecological lag to socioeconomic lag” between 2010 and 2020. The main factor hindering the coordination of sustainable land use subsystems changed from ecological lag in 2010 to socioeconomic lag in 2020.
Table 6.
Transfer Matrix of the relative performance of land use subsystem sustainability in Xiongan New Area in 2010 and 2020.

Figure 7.
Transfer map of the relative sustainability performance of land use subsystem. Clockwise rotation from the yellow arc at the top right of the chord diagram, which in turn represents: Ecological lag (2010); Socioeconomic lag (2010); Socioeconomic and ecological synchronization (2010); Ecological lag (2020); Socioeconomic lag (2020) and Socioeconomic synchronization (2020).
4.3. Impact Factors of CCD between Sustainable Land Use Subsystems
The q-values for eight factors in 2010 and 2020 are displayed in Table 7. The significance test was passed for the following variables from 2010 to 2020: population density, average GDP per square kilometer, water yield, and NEP. In 2010 the grain output passed the significance criteria, but in 2020, it failed. In 2010, the output of AFAHF and soil conservation did not pass the significance criteria, however, it did in 2020.
Table 7.
Impact factors affecting the coupling coordination between sustainable land use subsystems.
Three indicators of socioeconomic factors all had q values that, from 2010 to 2020, more than adequately explained the coupling coordination degree. This suggests that socioeconomic factors, particularly population density, were the primary forces behind the coupling coordination of the subsystem of LUS. At the same time, the impact of ecological factors is also on the rise. Specifically, in 2010, only two indicators, water yield and NEP, had a significant influence on the coordination level, but by 2020, the impact of soil and water conservation, NEP, and water yield on the coordination level remained in the range of 0.385 to 0.562.
4.4. Development Patterns of Towns in Xiongan’s New Area
According to the coupling coordination level (i.e., the coupling level in Figure 5b) and its changing trends (i.e., the development level in Figure 5c), the towns in Xiongan New Area are classified into four categories: coupling and developed, coupling and undeveloped, tradeoff and undeveloped, and tradeoff and developed (Figure 8a). Eleven of the twenty-nine towns in Xiongan New Area are in Quadrant Ⅰ, mostly in southern Anxin County, western and eastern Rongcheng County, and southern Xiong County (Figure 8b). These regions exhibit excellent coupling and developmental performance and are in a highly coordinated stage. Three towns in Rongcheng County in the second quadrant exhibit mutual coupling and early development. Two townships are located in the third quadrant, one in the northern part of Xiong County and the other in the northeastern part of Anxin County, and these townships reflect balanced and preliminary development. Eleven townships are in the fourth quadrant, which is at the mature stage of balance and development. These townships are mainly located in the northern parts of Xiong and Anxin counties.
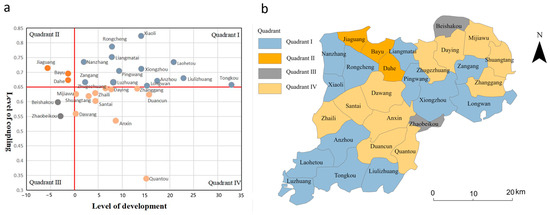
Figure 8.
Development patterns of towns in Xiongan New Area. (a) illustrates the quadrants and types of townships, with townships in Quadrant I being coupling and developed, Quadrant II being coupling and undeveloped, Quadrant III being tradeoff and undeveloped, and Quadrant IV being tradeoff and developed and (b) illustrates the spatial distribution of township types.
5. Discussion
5.1. Insight into the Sustainability Level, Coupling Coordination Degree, and Driving Mechanisms of Land Use Subsystems
Based on the sustainability level, coupling coordination level, and driving mechanisms between land use systems, we have gained further insights in the following three areas.
First, the findings reveal a less optimistic trend in the socioeconomic sustainability level, with half of the townships experiencing a decline, primarily manifested in a substantial decrease in grain production and the AFAHF. From 2010 to 2020, Xiongan New Area witnessed a reduction in arable land, leading to a certain degree of damage to agricultural production. Simultaneously, as part of the efforts towards developing a new model for inclusive cities in China, Xiongan New Area has closed thousands of high-energy-consuming and high-emission enterprises to enhance environmental quality. In the long term, these measures are anticipated to attract high-tech industries and outstanding talents, promoting the upgrade of industrial structure and the improvement of economic levels in Xiongan. However, as a millennium strategic initiative and a national priority, Xiongan New Area is currently in the early stage of construction [65] and its economic level is inevitably subject to a certain degree of impact. The ecological sustainability level in Xiongan New Area continued to improve, with all townships showing varying degrees of upward trends, consistent with findings from Xu’s research [58]. This positive development is attributed to the persistent commitment to the construction philosophy of “restoration before development” in the Xiongan New Area. This implementation of key greening projects such as the “Millennial Beautiful Forest”, suburban parks, and environmental improvement along major transportation corridors has played a crucial role. The initiation of a series of ecological safeguard projects following the establishment of the Xiongan New Area is identified as a significant factor driving the positive transformation of the ecological environment. In conclusion, the overarching objective of the construction of Xiongan New Area remains the core focus on socioeconomic development.
Second, although the socioeconomic and ecological aspects of the Xiongan New Area are moving towards harmonization in terms of temporal evolution, interactions, and their spatial transformations, they are still in general at a moderate level of coupling coordination, and there is much room for improvement [40,62]. The greatest improvement in coupling coordination was seen in southwestern Anxin County, which is mainly because the sustainability of both socioeconomic and ecological subsystems in this region was significantly optimized, rather than just improved in a single dimension. The coordinated development of LUS in the Xiongan New Area reveals greater spatial heterogeneity from 2010 to 2020. The regions with higher coupling coordination are mainly located in Rongcheng County, which could be explained by the fact that these regions usually have more favorable geographic locations, modern technology, dense human resources, and advanced socioeconomic development. The areas with low coupling coordination were mainly concentrated in the northeast of Anxin County, which may be because the rate of improvement of the natural environment was far higher than the rate of socioeconomic development. During the study period, the county attached great importance to the ecological environment protection and ecological restoration of Baiyangdian, protected the wetlands and ecological functional areas around Baiyangdian, and the ecological quality was significantly improved. However, the investment in infrastructure construction is insufficient, and the industrial structure is in urgent need of transformation. Compared with ecological protection, the degree of socioeconomic progress is relatively backward.
Thirdly, we observe that socioeconomic factors significantly impact the coordination of sustainable land use subsystems (Table 7), which aligns with Jin and Liu’s research [66]. According to Liu Jing and colleagues, economic factors are crucial in the coordination level of land use efficiency. They emphasize the significance of innovative, intensive, and environmentally friendly economic development modes for the optimizing of land use layout, as well as the need for designing industrial- and population-related policies in these economic modes.
5.2. Policy Implications for Sustainable Development
We propose the sustainable development strategy of Xiongan New Area. Firstly, all townships in the Xiongan new area are subjected to systematic cluster analysis, and focused management actions are implemented. The study’s findings indicate that there are differences in the relationships between the land use subsystems in the various regions of the Xiongan New Area. Coupling and developed townships have a higher degree of coupling coordination and level of growth, and they also offer more ecological goods or services while growing the social economy. Land use management should make further advancements or maintain the status quo. For coupling and undeveloped townships, their coupling level is above the demarcation mark for these towns at the initial coupling development stage, but there is a declining trend. The strategy of further improvement should be followed. An emphasis should be placed on increasing investment and resource allocation in underdeveloped regions, securing adequate funding sources to ensure infrastructure construction, improving the standard of living for residents, and fostering the harmonious development of land use between socioeconomic development and environmental protection. For tradeoffs and undeveloped townships, the coupling level and development level are below the cut-off threshold for these towns. To support regional economic growth, they rely on traditional manufacturing sectors like paper production, apparel, luggage, and bags. However, they also encounter significant challenges like an irrational industrial structure, antiquated machinery, and limited capacity for research and development. There is a clear conflict between economic growth and the scarcity of resources. It is essential to encourage the intense, economical, and effective use of land while upholding stringent environmental protection through macro-control and internal exploitation. To achieve the spatial optimization of land the government can, on the one hand, utilize specific administrative techniques such as spatial planning, usage control, etc. On the other hand, we should speed up the adoption of the innovation-driven development strategy, actively promote regional superior industries, set up a framework for introducing talent, stop path dependence, and achieve industrial transformation and upgrading. For tradeoff and developed townships, the gap-filling approach should be used for these towns. The current ecological space should be strictly safeguarded in these places, and a reasonable red line should be created for ecological conservation.
Secondly, it will consider the coordinated development of regional socioeconomic and ecological aspects and categorize and formulate planning and implementation measures to promote economic development, ecological security, and social equity. (1) With regard to the implementation of territorial spatial planning and construction, more precise planning and implementation measures have been formulated to improve the efficiency of planning and implementation. At present, the planning and construction of Xiongan New Area is faced with such challenges as insufficient funds for infrastructure construction, a large gap in services for taking over Beijing’s non-capital functions, imperfect industrial support, and misalignment of functions. Therefore, according to the development positioning defined in the Outline of the Plan for Xiongan New Area of Hebei, the detailed control plan for the starting area and the detailed control plan for the launching area should be followed, and the smooth landing of the plan should be ensured through the innovation of infrastructure investment and financing modes, the precise undertaking of Beijing’s non-capital functions, and the building of an industrial innovation ecosystem to continue to push forward the construction of the Xiongan New Area to a high standard and the development of high quality. (2) Regarding the implementation of socioeconomic development plans, each region should, by the outline of the Fourteenth Five-Year Plan for the National Economic and Social Development of Hebei Province and the Visionary Goals for the 2035 Period, formulate different regional development goals based on the degree of sustainable socioeconomic development. For example, in the case of Xiong County, where the level of sustainable socioeconomic development is relatively poor, the local government can strengthen the mechanism of interregional industrial interaction and stimulate the economic vitality of Xiong County through measures such as increased investment promotion and tax incentives. (3) In ecological environment management and protection planning, local governments should recognize the need for ecological construction and actively implement it. In accordance with the Xiongan New Area Ecological Environment Protection Plan, emphasis is being placed on strengthening the protection of wetland ecosystems in the Baiyangdian watershed, and on improving the coverage of forests and grasses, while at the same time strengthening the monitoring of spatial and temporal changes in different ecosystem services.
In addition, the administrative management system determines how the government manages land resources in the Xiongan New Area. The pursuit of interests by different levels of government determines whether the territorial space within Xiongan New Area can achieve coordinated development in social, economic, and ecological aspects. Specifically, at the central government level, the construction of the Xiongan New Area is a significant strategic initiative led by the central government, representing a major decision and deployment by the central leadership to advance the coordinated development of the Beijing-Tianjin-Hebei region [67]. The central government leads the New Area Management Committee, establishing a comprehensive institutional system that reflects central authority from the establishment of the New Area to planning approval and plan execution. Additionally, it oversees the Leading Group for the Coordinated Development of Beijing-Tianjin-Hebei and its office, guiding the New Area Management Committee. At the provincial government level, the Hebei provincial government has established the Hebei Xiongan New Area Management Committee, responsible for the main tasks outlined in the “Outline of the Hebei Xiongan New Area Plan.” The New Area Management Committee is characterized as an agency dispatched by the provincial government, operating under its leadership. At the level of the Xiongan New Area government, the New Area Management Committee follows the governance model of the administrative committee found in previous national-level new areas. Serving as the sole administrative body within the New Area, it adopts a “large department system, flat organization, and appointment system.” Overall, the central government plays a strategically supportive role in sustainable land use, and the ability of different departments within the New Area Management Committee to achieve collaborative governance has a decisive impact on sustainable land use.
5.3. Limitations and Prospects for Future Research
The following five areas need more attention in future research. First, we need to create a more valuable and organized indexing system. Due to the limitations of the indicators, this study should have considered some legitimate data, such as the rate of urbanization, employees in different industries, etc. To evaluate LUS in the future more thoroughly, it will be required to consider updating the indicators. Second, the optimal level for each indicator was not considered in this analysis, nor was the development positioning of various municipalities. Future indicator levels should take into account the differences in town development features. Third, additional time nodes’ anomalous changes within the study period were not taken into account, instead, only the data from the two periods were examined. Characterizing the characteristics of sustainable land use change in a more thorough manner using long-term time series data should be considered in the future. Xiongan New Area is still undergoing a period of intense construction and the upcoming period will see significant changes, which is only tracked in our study until 2020. With the rapid development of the Xiongan New Area, we will concentrate on monitoring the level of LUS and the interaction between subsystems. Finally, the motivations behind various development models should be examined to create more focused policy suggestions.
6. Conclusions
As a case study area, we used Xiongan New Area. We evaluated the level of sustainable land use subsystems and used the coupling coordination degree model and geographic detector to assess the interaction between sustainable land use subsystems and their driving mechanism. The findings revealed that from 2010 to 2020, half of the townships in the Xiongan New Area had a decreasing trend in the sustainable use of socioeconomic systems while the level of the ecosystem was increasing. This suggests that the area’s potential for sustainable land use is high, and it is imperative to enhance the socioeconomic performance of the land use system in particular. In the Xiongan New Area, primary coordination and moderate coordination were the most common form, and there was an increase in the level of coordination among the subsystems of LUS. A tendency of “ecological lag shrinking, social and economic lag expanding”, can be seen in the relative performance of subsystems of sustainable land use in the Xiongan New Area. Furthermore, socioeconomic elements, particularly population density and GDP, are essential for the sustainable use and coordinated growth of territorial space. Based on the coordination level and its trends of the sustainable land use system, the towns in Xiongan New Area are classified into four different modes: coupling and developed, coupling and underdeveloped, tradeoff and developed, and tradeoff and underdeveloped. We argue that differentiated development strategies should be proposed for different development modes, focusing on ecological civilization construction, industrial structure optimization, and infrastructure construction to achieve a more sustainable Xiongan New Area. The research findings can serve as a guide for stakeholders and decision-makers as they develop effective land use management plans and tailored protection regulations based on the social ecosystem theory and the framework of the Global Sustainable Development Goals. This study argues that to encourage effective and sustainable land use, sensible and varied land policies should be developed, with special emphasis on the coupling and coordination between social economics and ecology.
Author Contributions
All authors contributed to the study conception and design. X.W.: Conceptualization; methodology; software; validation; formal analysis; investigation; data curation; visualization; writing—original draft; writing—review and editing. H.Z.: conceptualization; validation; resources; writing—review and editing; supervision; project administration; funding acquisition. J.Q.: methodology; data curation; writing—review and editing. X.L.: data curation; writing—review and editing. C.C.: writing—review and editing. Z.F.: writing—review and editing. Y.C.: data curation. All authors have read and agreed to the published version of the manuscript.
Funding
This work was supported by the Ministry of Education of Humanities and Social Science project, China (21YJA630121), and the General Program of Beijing Social Science Foundation (18GLB043).
Data Availability Statement
The data presented in this study are available on request from the first author.
Acknowledgments
The authors sincerely thank all the students and staff who provided their input to this study. Our acknowledgments are also extended to the anonymous reviewers for their constructive reviews of the manuscript.
Conflicts of Interest
The authors declare no conflicts of interest.
References
- Liu, J.; Jin, X.; Xu, W.; Gu, Z.; Yang, X.; Ren, J.; Fan, Y.; Zhou, Y. A New Framework of Land Use Efficiency for the Coordination among Food, Economy and Ecology in Regional Development. Sci. Total Environ. 2020, 710, 135670. [Google Scholar] [CrossRef] [PubMed]
- Seto, K.C.; Golden, J.S.; Alberti, M.; Turner, B.L. Sustainability in an Urbanizing Planet. Proc. Natl. Acad. Sci. USA 2017, 114, 8935–8938. [Google Scholar] [CrossRef] [PubMed]
- van Vliet, J. Direct and Indirect Loss of Natural Area from Urban Expansion. Nat. Sustain. 2019, 2, 755–763. [Google Scholar] [CrossRef]
- Torre, A.; Melot, R.; Magsi, H.; Bossuet, L.; Cadoret, A.; Caron, A.; Darly, S.; Jeanneaux, P.; Kirat, T.; Pham, H.V.; et al. Identifying and measuring land-use and proximity conflicts: Methods and identification. SpringerPlus 2014, 3, 1–26. [Google Scholar] [CrossRef] [PubMed]
- Chen, S.S.; Kimirei, I.A.; Yu, C.; Shen, Q.; Gao, Q. Assessment of urban river water pollution with urbanization in East Africa. Environ. Sci. Pollut. Res. 2022, 29, 40812–40825. [Google Scholar] [CrossRef] [PubMed]
- Zhang, J.; Pu, L.; Peng, B.; Gao, Z. The impact of urban land expansion on soil quality in rapidly urbanizing regions in China: Kunshan as a case study. Environ. Geochem. Health 2011, 33, 125–135. [Google Scholar] [CrossRef]
- Wang, X. Managing Land Carrying Capacity: Key to Achieving Sustainable Production Systems for Food Security. Land 2022, 11, 484. [Google Scholar] [CrossRef]
- Zhang, Z.; Liu, F.; Zhao, X.; Wang, X.; Shi, L.; Xu, J.; Yu, S.; Wen, Q.; Zuo, L.; Yi, L.; et al. Urban Expansion in China Based on Remote Sensing Technology: A Review. Chin. Geogr. Sci. 2018, 28, 727–743. [Google Scholar] [CrossRef]
- Salvati, L.; Karamesouti, M.; Kosmas, K. Soil degradation in environmentally sensitive areas driven by urbanization: An example from Southeast Europe. Soil Use Manag. 2014, 30, 382–393. [Google Scholar] [CrossRef]
- Fan, Y.; Fang, C.; Zhang, Q. Coupling coordinated development between social economy and ecological environment in Chinese provincial capital cities-assessment and policy implications. J. Clean. Prod. 2019, 229, 289–298. [Google Scholar] [CrossRef]
- Yang, W. Ecological Civilization Is a New State of Civilization Featuring the Harmony between Man and Nature. Chin. J. Urban Environ. Stud. 2020, 8, 128–130. [Google Scholar] [CrossRef]
- Zhou, M. An Interval Fuzzy Chance-Constrained Programming Model for Sustainable Urban Land-Use Planning and Land Use Policy Analysis. Land Use Policy 2015, 42, 479–491. [Google Scholar] [CrossRef]
- Domingo, D.; Palka, G.; Hersperger, A.M. Effect of zoning plans on urban land-use change: A multi-scenario simulation for supporting sustainable urban growth. Sustain. Cities Soc. 2021, 69, 102833. [Google Scholar] [CrossRef]
- Koroso, N.H.; Zevenbergen, J.A.; Lengoiboni, M. Urban land use efficiency in Ethiopia: An assessment of urban land use sustainability in Addis Ababa. Land Use Policy 2020, 99, 105081. [Google Scholar] [CrossRef]
- Lu, X.-H.; Ke, S.-G. Evaluating the effectiveness of sustainable urban land use in China from the perspective of sustainable urbanization. Habitat Int. 2018, 77, 90–98. [Google Scholar] [CrossRef]
- Turner, B.L., II; Kasperson, R.E.; Matson, P.A.; McCarthy, J.J.; Corell, R.W.; Christensen, L.; Eckley, N.; Kasperson, J.X.; Luers, A.; Martello, M.L.; et al. A framework for vulnerability analysis in sustainability science. Proc. Natl. Acad. Sci. USA 2003, 100, 8074–8079. [Google Scholar] [CrossRef]
- Ostrom, E. A General Framework for Analyzing Sustainability of Social-Ecological Systems. Science 2009, 325, 419–422. [Google Scholar] [CrossRef]
- Kuhlman, T.; Farrington, J. What Is Sustainability? Sustainability 2010, 2, 3436–3448. [Google Scholar] [CrossRef]
- Moore, J.E.; Mascarenhas, A.; Bain, J.; Straus, S.E. Developing a comprehensive definition of sustainability. Implement. Sci. 2017, 12, 110. [Google Scholar] [CrossRef]
- Ramsey, J.L. On Not Defining Sustainability. J. Agric. Environ. Ethics 2015, 28, 1075–1087. [Google Scholar] [CrossRef]
- Winston, N. Sustainable community development: Integrating social and environmental sustainability for sustainable housing and communities. Sustain. Dev. 2021, 30, 191–202. [Google Scholar] [CrossRef]
- Fu, B.; Chen, L.; Ma, C. The Index System and Method of Land Sustainable Use Evaluation. J. Nat. Resour. 1997, 12, 113–118. [Google Scholar]
- Fu, J.; Bu, Z.; Jiang, D.; Lin, G.; Li, X. Sustainable land use diagnosis based on the perspective of production–living–ecological spaces in China. Land Use Policy 2022, 122, 106386. [Google Scholar] [CrossRef]
- Lu, X.; Zhang, Y.; Lin, C.; Wu, F. Analysis and comprehensive evaluation of sustainable land use in China: Based on sustainable development goals framework. J. Clean. Prod. 2021, 310, 127205. [Google Scholar] [CrossRef]
- Liang, J.; Li, Y. Resilience and Sustainable Development Goals Based Social-Ecological Indicators and Assessment of Coastal Urban Areas—A Case Study of Dapeng New District, Shenzhen, China. Watershed Ecol. Environ. 2020, 2, 6–15. [Google Scholar] [CrossRef]
- Nziguheba, G.; Adewopo, J.; Masso, C.; Nabahungu, N.L.; Six, J.; Sseguya, H.; Taulya, G.; Vanlauwe, B. Assessment of sustainable land use: Linking land management practices to sustainable land use indicators. Int. J. Agric. Sustain. 2022, 20, 265–288. [Google Scholar] [CrossRef]
- Wang, P.; Qi, M.; Liang, Y.; Ling, X.; Song, Y. Examining the Relationship between Environmentally Friendly Land Use and Rural Revitalization Using a Coupling Analysis: A Case Study of Hainan Province, China. Sustainability 2019, 11, 6266. [Google Scholar] [CrossRef]
- Giri, S.; Qiu, Z. Understanding the relationship of land uses and water quality in Twenty First Century: A review. J. Environ. Manag. 2016, 173, 41–48. [Google Scholar] [CrossRef]
- Tran, D.X.; Pla, F.; Latorre-Carmona, P.; Myint, S.W.; Caetano, M.; Kieu, H.V. Characterizing the relationship between land use land cover change and land surface temperature. ISPRS J. Photogramm. Remote Sens. 2017, 124, 119–132. [Google Scholar] [CrossRef]
- Liang, L.; Zhang, F.; Wu, F.; Chen, Y.X.; Qin, K.Y. Coupling coordination degree spatial analysis and driving factor between socio-economic and eco-environment in northern China. Ecol. Indic. 2022, 135, 108555. [Google Scholar] [CrossRef]
- Zhang, D.; Chen, Y. Evaluation on urban environmental sustainability and coupling coordination among its dimensions: A case study of Shandong Province, China. Sustain. Cities Soc. 2021, 75, 103351. [Google Scholar] [CrossRef]
- Cheng, H.; Zhu, L.; Meng, J. Fuzzy evaluation of the ecological security of land resources in mainland China based on the Pressure-State-Response framework. Sci. Total Environ. 2022, 804, 150053. [Google Scholar] [CrossRef]
- Xiao, R.; Lin, M.; Fei, X.; Li, Y.; Zhang, Z.; Meng, Q. Exploring the Interactive Coercing Relationship between Urbanization and Ecosystem Service Value in the Shanghai–Hangzhou Bay Metropolitan Region. J. Clean. Prod. 2020, 253, 119803. [Google Scholar] [CrossRef]
- Tong, D.; Sun, Y.; Tang, J.; Luo, Z.; Lu, J.; Liu, X. Modeling the interaction of internal and external systems of rural settlements: The case of Guangdong, China. Land Use Policy 2023, 132, 106830. [Google Scholar] [CrossRef]
- Li, T.; Li, D.; Liang, D.; Huang, S. Coupling Coordination Degree of Ecological-Economic and Its Influencing Factors in the Counties of Yangtze River Economic Belt. Sustainability 2022, 14, 15467. [Google Scholar] [CrossRef]
- Xie, X.; Fang, B.; Xu, H.; He, S.; Li, X. Study on the coordinated relationship between Urban Land use efficiency and ecosystem health in China. Land Use Policy 2021, 102, 105235. [Google Scholar] [CrossRef]
- Yin, G.; Liu, Y.; Wang, F. Emerging Chinese new towns: Local government-directed capital switching in inland China. Cities 2018, 79, 102–112. [Google Scholar] [CrossRef]
- Long, H.; Liu, Y.; Hou, X.; Li, T.; Li, Y. Effects of land use transitions due to rapid urbanization on ecosystem services: Implications for urban planning in the new developing area of China. Habitat Int. 2014, 44, 536–544. [Google Scholar] [CrossRef]
- Liu, L.; Jiang, K.; Hu, Z.; Feng, H. Response Characteristics of Ecosystem Services Values in Territorial Space Development of Xiong’an New Area. Acta Ecol. Sin. 2022, 42, 2098–2111. [Google Scholar]
- Liu, Z.; de Jong, M.; Li, F.; Brand, N.; Hertogh, M.; Dong, L. Towards Developing a New Model for Inclusive Cities in China—The Case of Xiong’an New Area. Sustainability 2020, 12, 6195. [Google Scholar] [CrossRef]
- Xue, C.Q.; Wang, Y.; Tsai, L. Building new towns in China—A case study of Zhengdong New District. Cities 2013, 30, 223–232. [Google Scholar] [CrossRef]
- Huo, J.; Shi, Z.; Zhu, W.; Xue, H.; Chen, X. A Multi-Scenario Simulation and Optimization of Land Use with a Markov–FLUS Coupling Model: A Case Study in Xiong’an New Area, China. Sustainability 2022, 14, 2425. [Google Scholar] [CrossRef]
- Yang, J.; Li, Y.; Hay, I.; Huang, X. Decoding national new area development in China: Toward new land development and politics. Cities 2019, 87, 114–120. [Google Scholar] [CrossRef]
- Levin, S.; Xepapadeas, T.; Crépin, A.-S.; Norberg, J.; de Zeeuw, A.; Folke, C.; Hughes, T.; Arrow, K.; Barrett, S.; Daily, G.; et al. Social-ecological systems as complex adaptive systems: Modeling and policy implications. Environ. Dev. Econ. 2013, 18, 111–132. [Google Scholar] [CrossRef]
- Liu, J.; Dietz, T.; Carpenter, S.R.; Alberti, M.; Folke, C.; Moran, E.; Pell, A.N.; Deadman, P.; Kratz, T.; Lubchenco, J.; et al. Complexity of Coupled Human and Natural Systems. Science 2007, 317, 1513–1516. [Google Scholar] [CrossRef]
- Ostrom, E. A Diagnostic Approach for Going Beyond Panaceas. Proc. Natl. Acad. Sci. USA 2007, 104, 15181–15187. [Google Scholar] [CrossRef]
- Cinner, J.E.; Barnes, M.L. Social Dimensions of Resilience in Social-Ecological Systems. One Earth 2019, 1, 51–56. [Google Scholar] [CrossRef]
- de Groot, R. Function-Analysis and Valuation as a Tool to Assess Land Use Conflicts in Planning for Sustainable, Multi-Functional Landscapes. Landsc. Urban Plan. 2006, 75, 175–186. [Google Scholar] [CrossRef]
- Han, D.; Yu, D.; Qiu, J. Assessing coupling interactions in a safe and just operating space for regional sustainability. Nat. Commun. 2023, 14, 1369. [Google Scholar] [CrossRef]
- Bryan, B.A.; Nolan, M.; McKellar, L.; Connor, J.D.; Newth, D.; Harwood, T.; King, D.; Navarro, J.; Cai, Y.; Gao, L.; et al. Land-use and sustainability under intersecting global change and domestic policy scenarios: Trajectories for Australia to 2050. Environ. Chang. 2016, 38, 130–152. [Google Scholar] [CrossRef]
- Song, Y.; Yeung, G.; Zhu, D.L.; Xu, Y.; Zhang, L.X. Efficiency of Urban Land Use in China’s Resource-Based Cities, 2000-2018. Land Use Policy 2022, 115, 106009. [Google Scholar] [CrossRef]
- Xue, D.; Yue, L.; Ahmad, F.; Draz, M.U.; Chandio, A.A.; Ahmad, M.; Amin, W. Empirical investigation of urban land use efficiency and influencing factors of the Yellow River basin Chinese cities. Land Use Policy 2022, 117, 106117. [Google Scholar] [CrossRef]
- Ruan, F. The Driving Role of Food and Cultivated Land Resource in Balancing the Complex Urban System of Socio-Economy and Environment: A Case Study of Shanghai City in China. Land 2023, 12, 905. [Google Scholar] [CrossRef]
- Li, Y.; Cao, Z.; Long, H.; Liu, Y.; Li, W. Dynamic analysis of ecological environment combined with land cover and NDVI changes and implications for sustainable urban–rural development: The case of Mu Us Sandy Land, China. J. Clean. Prod. 2017, 142, 697–715. [Google Scholar] [CrossRef]
- Sun, B.; Zhao, H.; Lu, F.; Wang, X. Spatial and Temporal Patterns of Carbon Sequestration in the Northeastern Forest Regions and Its Impact Factors Analysis. Acta Ecol. Sin. 2018, 38, 4975–4983. [Google Scholar]
- Li, M.Y.; Liang, D.; Xia, J.; Song, J.X.; Cheng, D.D.; Wu, J.T.; Cao, Y.L.; Sun, H.T.; Li, Q. Evaluation of Water Conservation Function of Danjiang River Basin in Qinling Mountains, China Based on Invest Model. J. Environ. Manag. 2021, 286, 112212. [Google Scholar] [CrossRef]
- Lü, Y.; Fu, B.; Feng, X.; Zeng, Y.; Liu, Y.; Chang, R.; Sun, G.; Wu, B. A Policy-Driven Large Scale Ecological Restoration: Quantifying Ecosystem Services Changes in the Loess Plateau of China. PLoS ONE 2012, 7, e31782. [Google Scholar] [CrossRef]
- Xu, B. China’s National New Areas in the ecological transition. Environ. Dev. Sustain. 2023, 25, 3747–3770. [Google Scholar] [CrossRef]
- Hou, C.; Han, Y.; Meng, X.; Liu, L. Effects of Land-Use Change on Ecosystem Service Values in Xiong’an New Area from 1995 to 2019. J. Environ. Eng. Technol. 2021, 11, 65–73. [Google Scholar]
- Wang, C.; Zhan, J.; Zhang, F.; Liu, W.; Twumasi-Ankrah, M.J. Analysis of urban carbon balance based on land use dynamics in the Beijing-Tianjin-Hebei region, China. J. Clean. Prod. 2021, 281, 125138. [Google Scholar] [CrossRef]
- Guo, W.; Teng, Y.; Yan, Y.; Zhao, C.; Zhang, W.; Ji, X. Simulation of Land Use and Carbon Storage Evolution in Multi-Scenario: A Case Study in Beijing-Tianjin-Hebei Urban Agglomeration, China. Sustainability 2022, 14, 13436. [Google Scholar] [CrossRef]
- Luo, X.; Tong, X.; Pan, H. Integrating Multiresolution and Multitemporal Sentinel-2 Imagery for Land-Cover Mapping in the Xiongan New Area, China. IEEE Trans. Geosci. Remote Sens. 2021, 59, 1029–1040. [Google Scholar] [CrossRef]
- Liu, J.; Tian, Y.; Huang, K.; Yi, T. Spatial-temporal differentiation of the coupling coordinated development of regional energy-economy-ecology system: A case study of the Yangtze River Economic Belt. Ecol. Indic. 2021, 124, 107394. [Google Scholar] [CrossRef]
- Wang, J.-F.; Li, X.-H.; Christakos, G.; Liao, Y.-L.; Zhang, T.; Gu, X.; Zheng, X.-Y. Geographical detectors-based health risk assessment and its application in the neural tube defects study of the Heshun region, China. Int. J. Geogr. Inf. Sci. 2010, 24, 107–127. [Google Scholar] [CrossRef]
- Liu, D.Y.; Zheng, X.Q.; Wang, H.B.; Zhang, C.X.; Li, J.Y.; Lv, Y.Q. Interoperable Scenario Simulation of Land-Use Policy for Beijing-Tianjin-Hebei Region, China. Land Use Policy 2018, 75, 155–165. [Google Scholar] [CrossRef]
- Liu, J.; Jin, X.; Li, H.; Zhang, X.; Xu, W.; Fan, Y.; Zhou, Y. Spatial-temporal changes and driving factors of the coordinated relationship among multiple land use efficiencies integrating stakeholders’ vision in eastern China. J. Clean. Prod. 2022, 336, 130406. [Google Scholar] [CrossRef]
- Han, X.L.; Zhao, X.F.; Lu, D.M. Study on the Fiscal Holistic Governance Framework of Xiongan New Area in the Context of Beijing-Tianjin-Hebei Synergistic Development. China Financ. 2019, 4. (In Chinese) [Google Scholar] [CrossRef]


Disclaimer/Publisher’s Note: The statements, opinions and data contained in all publications are solely those of the individual author(s) and contributor(s) and not of MDPI and/or the editor(s). MDPI and/or the editor(s) disclaim responsibility for any injury to people or property resulting from any ideas, methods, instructions or products referred to in the content. |
© 2024 by the authors. Licensee MDPI, Basel, Switzerland. This article is an open access article distributed under the terms and conditions of the Creative Commons Attribution (CC BY) license (https://creativecommons.org/licenses/by/4.0/).