Abstract
The management effectiveness of protected areas plays a key role in biodiversity and ecosystem services conservation. We evaluated the effectiveness of Qilian Mountain Nature Reserve (QMNR) in reducing human footprint (HF). Four dominant human activity factors, including population density, land use, road distribution, and night light, were incorporated for HF mapping. Comparisons of the HF value between inside and outside QMNR and its four functional zones were conducted. The results show that both the HF inside and outside of QMNR were increasing, but the difference between them was increasing, indicating partial management effectiveness. The north part of the central reserve has a good effect in reducing human impacts, while the effectiveness was poor at both ends of the reserve. The HF value of the most strictly managed core and buffer zones increased by 10.50 and 6.68%, respectively, for 2010–2020. The QMNR was effective in controlling population density and land use, but ineffective in reducing road construction, mining, and construction of hydropower facilities.
1. Introduction
The designation of protected areas is one of the most effective ecological measures to conserve biodiversity and maintain ecosystem services [1]. More than 200,000 protected areas have been set up worldwide, covering 15.4% of the land and 7.5% of the ocean [2]. China has designated more than 11,800 protected areas, covering 18% of land and 4.6% of territorial waters, one of the world’s largest protected area systems [3,4,5]. After designating protected areas, the managers have put a large-scale investment in their management, and people have also given up many livelihood opportunities. Therefore, it is necessary to evaluate its effectiveness in management, which has been taken seriously by the International Union for Conservation of Nature [6] and the World Commission on Protected Areas (WCPA) [7,8].
According to the essential elements in the management process of protected areas, the WCPA constructed an evaluation framework listing the essential elements [9]. A lot of evaluation work was carried out under the guidance of this framework, but gaps still exist. For example, most assessments based on this evaluation framework focused on ecological indicators, including the number of species [10,11], habitat quality [12], and ecosystem service [13]. Although these indicators may accurately reflect the changes in protected objects before and after establishing protected areas, it is not easy to rapidly evaluate the management effectiveness of large protected areas and multiple protected areas. This is due to the high cost and time-consuming data acquisition, including changes in the accurate number of threatened and endangered species over a long period. For this reason, management effectiveness assessments were only conducted across 18.29% of the area covered by protected areas and conserved lands [2]. After 2020, there is a need to better monitor the effectiveness of protected and conserved lands more generally through assessments of governance, management, and conservation outcomes (https://livereport.protectedplanet.net/) (accessed on 15 April 2020).
Protected areas protect biodiversity and ecosystem services by restricting and prohibiting human activities [13,14]. Therefore, analyzing the spatio-temporal changes of human activities in nature reserves since their establishment may be regarded as a simple and effective evaluation method for management effectiveness [15,16]. Many scholars have made explorations using this method [17]. Specifically, Jones et al. [8] analyzed changes in human activities in global protected areas such as population density, farming, road, night light, and navigable waterways. They found that human activities had increased in about 55% of more than 20,000 protected areas that were established before 1992, and their effectiveness in protecting biodiversity needs to be enhanced. Anderson and Mammides [18] and Geldmann et al. [16] also assessed the effectiveness of global protected areas in reducing human activities. Similar studies are also available at national and regional scales, including China [19], South Ecuador [20], and Tibetan Plateau [21,22,23]. These studies provided a simple and efficient way for evaluating the effectiveness of large or multiple protected areas in reducing human pressure. However, they did not consider enough human impact factors due to data availability. Most of them only considered population density and land use, and ignored other factors such as grazing and road distribution [16], or regarded them as static [24,25,26], which reduced the reliability of the assessment result to a certain extent. Fortunately, with the continuous development of remote sensing, it has gradually become possible to incorporate more human impact factors.
Qilian Mountain Nature Reserve (QMNR) is rich in biodiversity and has high ecosystem service value. Owing to its large area, obtaining accurate long-term data on ecosystem service value and rare species quantity covering the whole reserve is time-consuming and high-cost. Therefore, the existing assessments of management effectiveness for QMNR just analyzed the changes in ecosystem service value [27,28] and biodiversity [29] for small parts of QMNR, most of which are short-term evaluations. Considering that it was established as a nature reserve in 1988, these assessments are highly insufficient to comprehensively reveal the management effectiveness of the whole reserve since its establishment. However, with the increasing abundance of remote sensing data and spatial gridding population data, it gradually becomes easier to measure and compare the changes of human impacts inside and outside the reserve and in each functional zone since its establishment to reveal its management effectiveness.
The human footprint (HF) is a comprehensive measure of multiple human pressures on the environment [25,26]. In this study, our aims are (1) to measure the HF value in QMNR and its surrounding areas using the well-established global HF model [11,12,13], which was localized based on our comprehensive understanding of natural and human conditions of Qilian Mountains and data availability; (2) to compare and analyze the changes of HF value inside and outside the reserve and in each functional zone to evaluate the effectiveness of the QMNR in reducing human impacts. If the HF value inside the QMNR shows a decreasing trend after its establishment, especially if the decrease is more and faster than the outside, then we think the establishment of the native reserve is effective. Otherwise, it is ineffective.
2. Materials and Methods
2.1. Study Area
The QMNR is located on the northeastern edge of the Qinghai–Tibet plateau, known as the world’s third pole (Figure 1). The east of the QMNR meets the western edge of the Loess Plateau, and the north is connected with the southern part of the Inner Mongolia Plateau. It spans Qinghai and Gansu provinces. The main land use/cover types in QMNR include grassland (~45%), alpine desert (~25%), forestland (~18%), and cropland (~8%). QMNR is rich in biodiversity and ecosystem services, including water retention.
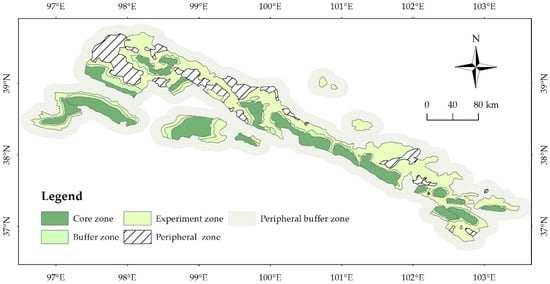
Figure 1.
Location and functional zones of the Qilian Mountain Nature Reserve.
QMNR officially became a nature reserve in 1988, with a total area of 3.46 million hm2. The government divided it into four functional zones (Figure 1), i.e., core, buffer, experiment, and peripheral zones. Their areas are 869,600, 562,500, 1,357,400, and 665,800 hm2, respectively. The degree of restriction on human activities from the core to the peripheral zone is gradually reduced. In this study, a peripheral buffer zone equal to the area of the nature reserve was made outward around the boundary of the nature reserve (Figure 1), and its HF value was measured to compare its changes inside and outside the nature reserve.
2.2. Measuring of the Human Footprint Value
Using the HF model [25,26], we first measured the HF value in QMNR and its surrounding areas. Then, we compared and analyzed the changes in HF value inside and outside the reserve and each functional zone to evaluate the effectiveness of the QMNR in reducing accumulating human impacts.
Considering the characteristics of the study area and data availability, we localized the well-established global HF model and incorporated four categories of human impact factors, including population density, land use, road distribution, and night light. Their disturbance to the ecosystem was quantified in the range of [0, 10] (0 is the minimum disturbance and 10 is the maximum. See “Section 2.4” for details) and accumulated in equal weight to measure HF value. The equation is as below [25,26]:
where HF(i,t) refers to the HF value in grid i in t year. popd(i,t), landuse(i,t), road(i,t), and nightlight(i,t) stand for the disturbance intensity by population density, land use, road distribution, and night light in grid i in t year.
2.3. Comparisons of the Human Footprint Value
The management effects of the QMNR were evaluated by comparing the changes in HF value before and after its establishment. The equation is as below:
where ∆HF(i,∆t) refers to the change in the HF value of grid i from tm year to tn year.
Although the QMNR was officially established in 1988, protection policies and measures were not carried out at once to prohibit/restrict human activities within it. Considering the delay in management and data availability, we took 1990 as the benchmark. The period 1980–1990 was regarded as “before the establishment” and the period 1990–2020 was “after the establishment”. The evaluation was carried out in two spatial dimensions. First, the changes in HF value inside and outside the nature reserve over the past 40 years were compared and analyzed. The peripheral buffer zone surrounding the peripheral zone was designated outside the nature reserve (Figure 1). Second, the changes in HF over the past 40 years in each functional zone were analyzed.
2.4. Data and Processing
The data sources and processing of the four categories of human impact factors, including population density, land use, road distribution, and night light, are introduced as follows.
2.4.1. Population Density
The greater the population density, the greater the disturbance intensity of human activities to the ecosystem. Largely following Venter et al. [26], we quantified the disturbance intensity of population density to the ecosystem. Grids with a population density greater than 1000 people per m2 are assigned a pressure score of 10, and then Equation (3) was used for the following assignment:
where Popscore refers to the disturbance intensity of population density popd to the ecosystem, with a range of (0, 10), where 0 means the minimum, and 10 represents the maximum.
The 1 km global population density dataset, WorldPop (https://www.worldpop.org) (accessed on 10 July 2020), was used in this paper. It uses a random forest algorithm to allocate China’s county-scale population census data into a 1 km grid cell. For the Tibetan Plateau, it has been updated annually since 2000 with the highest precision [30,31]. For the years 1980 and 1990 when the 1 km population density data were missing, the statistical demographic data of Gansu [32] and Qinghai [33] were allocated into grids based on the spatial pattern of population distribution in 2000. The specific equation is as below:
where popdi refers to the grid-scale population density in i year, pd, pd′ represent the statistical population of Qinghai and Gansu provinces, respectively, i = 1980 and 1990.
2.4.2. Land Use
The land cover change caused by human land use activities is the most direct disturbance of human beings on the terrestrial ecosystem [34]. Different types of land use represent the different degrees of human pressure on the ecosystem. This study uses the 1 km China’s land-use/cover dataset [35,36] for 1980–2020. Based on Landsat TM/ETM+ remote sensing images as the primary data resources, this dataset is generated by manual visual interpretation, which contains six first-level and 23 s-level land use types. The definition of each land use type is available in [35,36].
We quantified and assigned the disturbance intensity of different land use types to the ecosystem based on previous studies [37,38]. Specifically, urban construction land is essential for human production and living, and human activities have the strongest disturbance on the natural ecosystem, which could be assigned a value of 10. Other construction lands and rural residential areas come second and third place, with values of nine and eight. Land cultivation can also greatly impact the natural ecosystem, and cropland is assigned a value of seven. Subsequently, a value of two is assigned to orchards, groves, and nurseries. Additionally, one is given to reservoir, pond, and bottomland. Finally, it should be pointed out that the disturbance of grazing activities to the grassland ecosystem in the Qilian Mountains is also important, but the satellite-based grassland data cannot distinguish whether it is used for grazing [39]. In this way, the disturbance of grazing to the ecosystem would not be considered in this study.
2.4.3. Roads and Railways
The disturbance of roads and railways to their surrounding ecosystem is great [40,41], and the distance of their disturbance even reaches 5 km [41]. Although roads and railways are included in construction land, the disturbance of roads and railways to their surrounding ecosystem is not involved. Some studies on the disturbance intensity of roads and railways to the ecosystem for the Tibetan Plateau [42] show that the disturbance intensity of freeways to the ecosystem is the highest, followed successively by national, provincial, and county roads. The disturbance intensity of railways is similar to that of the national road. Based on the global HF model [26] and the Qilian Mountains and Qinghai–Tibet Plateau situation, we scored the buffer zone for the disturbance of roads and railways to their surrounding ecosystem (Table 1). The roads and railways dataset for Qilian Mountains and their surroundings are cited from Gao et al. [43,44].

Table 1.
Disturbance scores of roads and railways to the ecosystem in the Qilian Mountain Nature Reserve.
2.4.4. Night Light
As far as Qilian Mountains are concerned, human activities such as factories and mines, quarries and salt mines in remote areas cannot be ignored. The 1 km land use data adopted in this study fail to capture these human activities, while night light data can capture them well at 1 km scale due to the sensitivity of satellite sensors. Therefore, night light data are incorporated into the HF model to map human impacts like the global dataset [24,25,26]. The larger the DN value of night light data, the stronger the disturbance of human activities to the ecosystem.
DMSP/OLS began to produce night light space products in 1992, and VIIRS provided a new generation of global night data after the DMSP/OLS stopped updating in 2014. Therefore, correction and fusion were needed for these two datasets before they could be used simultaneously. Li et al. [45] transformed and fused them and produced a 1 km night light dataset for 1992–2019, which was used in this study. For simplicity, the data for the years 1980 and 1990 were replaced by the data for 1992, and the data for 2020 were replaced by the data for 2019. According to the well-established classification method of night light by Wu et al. [46], we grouped night light data using DN = 4 as group distance, and assigned their disturbance scores to the ecosystem from 0 to 10.
3. Results
3.1. Changes in Human Footprint Value inside and outside the QMNR for 1980–2020
The HF value outside the QMNR have always been greater than those inside the reserve, and both of them show an increasing trend for 1980–2020 (Figure 2). Additionally, the increasing tendency of HF value inside and outside the reserve did not change around the time of its establishment in 1990. After 1990, the HF value still increased inside the reserve and even faster for 2010–2020 than in the previous period. Specifically, after the establishment of the reserve, the HF value inside the QMNR increased by 0.8687 and the value outside the QMNR increased by 1.4488 for 1990–2020. These results indicated that the establishment of the nature reserve did not effectively reduce human impacts inside of it and even showed an increasing trend, and the percentage of increase was even greater than that outside the reserve.
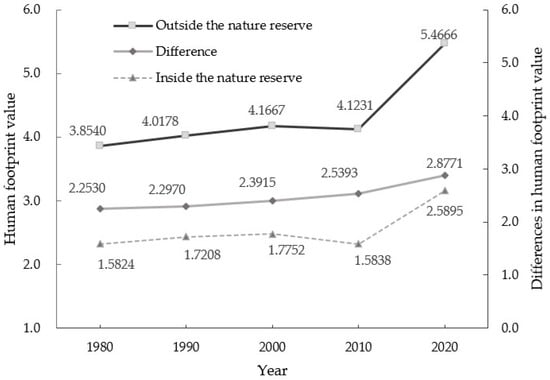
Figure 2.
Comparative analysis of human footprint value between inside and outside of the Qilian Mountain Nature Reserve.
In addition, we can also find that the differences in HF value between inside and outside the reserve were slowly expanding. Additionally, the HF value decreased both inside and outside the reserve from 2000 to 2010, and encouragingly, the decline of HF value inside the reserve was greater than that outside of it, which demonstrated that the establishment of the reserve slowed down the increase of human activities to a certain extent, but did not change the overall trend of increase.
Regarding spatial distribution (Figure 3), the HF value of the reserve and its surroundings is high in the east and low in the west, and the value outside the reserve is greater than inside the reserve for all years. It can also be seen that the HF value of urban regions is high.
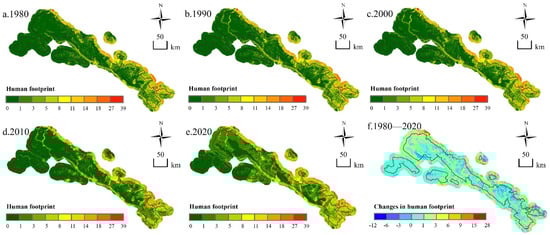
Figure 3.
Spatial distribution of human footprint inside and outside of the Qilian Mountain Nature Reserve for 1980–2020.
The changes in the spatial distribution of HF since the establishment of the reserve in 1990 were described as follows (Figure 3). Overall, the HF value increased in most areas inside and outside the reserve, and the increase was even more pronounced outside the reserve, especially from 2010 to 2020. More specifically, the HF value at both ends of the reserve showed an increasing trend, especially in the northwest from 2010 to 2020. The HF value decreased mainly in the center of the reserve, especially on the north side of the middle. The increase of HF value outside the reserve was greater than that inside the reserve, which was mainly distributed in the northwest corner and edge areas in the middle north. The comparison between internal and external shows that the establishment of the nature reserve is effective in the north part of the middle of the nature reserve, and not effective at both ends of it, especially the northwest end.
3.2. Changes in Human Footprint Value in Four Functional Zones of QMNR for 1980–2020
The HF value in each functional zone of QMNR is illustrated in Figure 4. The HF value in the experimental zone was the largest, followed by the core and the peripheral zones, and the buffer zone was the smallest.
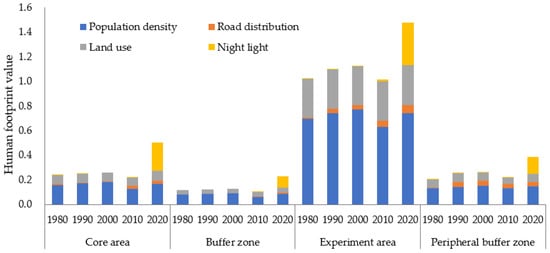
Figure 4.
Disturbance intensity to the ecosystem of each functional zone in the Qilian Mountains Nature Reserve from 1980 to 2020.
Before the establishment of the reserve, the HF values of each functional zone show an increasing trend for 1980–1990. For 1990–2000, they also increased, but the percentage is smaller than those for 1980–1990. Additionally, from 2000 to 2010, they decreased slightly. The above indicates that since the establishment of the protected area in 1990 to 2010, human activities in each functional zone have been restricted to a certain extent. However, from 2010 to 2020, the HF value of each functional zone increased substantially. In particular, the HF values of the core and buffer zones which strictly limit human activities, increased by 10.50% and 6.68%, respectively. It suggests that the human activities of each functional zone during this period have not been effectively restricted.
It can also be seen from Figure 4 that population density and land use are the most dominant human activity factors in each functional zone. The increase in population density and land use in each functional zone was slight, and even showed a downward trend from 2000 to 2010. However, the scores of roads and railways of each functional zone gradually increased, and the score of night light increased substantially from 2010 to 2020, especially in the core and experimental zones, which increased by 45.23% and 39.86%, respectively. It suggests that the current management has effectively controlled the increase of population and land use activities in each functional zone of the reserve, but road construction, mining activities, and the construction of hydropower facilities characterized by night light are still increasing.
4. Discussion
By measuring the HF value of the QMNR and its surrounding regions and comparing it between inside and outside of the QMNR as well as the four functional zones of the reserve, we found that the QMNR is partially effective in reducing human impacts. Our results are consistent with the findings of previous studies that the Qilian Mountains grassland ecosystem is generally stable, but the local deterioration has not been stopped due to human disturbance [47,48]. Next, we discussed the potential reasons for partially effective and policy implications of our findings.
4.1. Why Partially Effective
The establishment of nature reserves will limit economic development to a certain extent. The Qilian Mountains are located in Gansu and Qinghai provinces in western China, which are backward and poor, and the need for economic development is urgent. Therefore, setting up a nature reserve here will cause conflicts between protection and development. Coordinating the contradiction between development and protection challenges the local government. Specifically, from 1990 to 2000, although the governments implemented reforestation policies, the area of forest and grassland ecosystems in QMNR is still decreasing while the area of farmland and roads is still increasing. From 2000 to 2010, although immigration [49] and the implementation of the Grain for Green Program reduced the HF, the Western Development Strategy in Gansu and Qinghai resulted in the construction of the Xining-Zhangye Highway, National Highway numbered 312, Lanzhou-Xinjiang Railway, and roads through the woods in QMNR, which have resulted in locally enhanced HF. From 2010 to 2020, nighttime lighting data and field investigations show that human activities, including mining of mineral resources and construction of hydropower facilities, still exist in QMNR, and the overall HF in QMNR has increased. These human activities have led to the degradation of glaciers and the decline of water conservation capacity in the reserve [50]. The above facts suggest that the government’s focus on economic growth and insufficient attention to ecological conservation is one of the main reasons for poor conservation.
In addition, although the Qilian Mountains were established as a nature reserve as early as 1988, due to the lack of data on the spatial distribution of biodiversity and ecosystem services at that time, the extent of ecologically important areas was not accurately identified. The delimitation of the protected area was not clear until October 2014, which also brought great difficulties to the conservation and management work for 1988–2014. This may be another reason that affects the management effect. For example, more than 150 hydropower stations have been built in the Qilian Mountains, 42 of which are located in reserve, most of which were built before 2014. Thus, the HF values increased within the nature reserve.
4.2. Policy Implications
In order to achieve conservation goals, the management of nature reserves should be strengthened. The Qilian Mountains are located in the western part of China. Compared with the eastern part of China, the population here is small, and the economic development is backward. If nature reserves here are only partially effective in reducing human activity, are nature reserves in the densely populated and economically developed eastern region less effective? It can also be seen from Figure 3 that the HF value in the eastern part of the QMNR is higher than that in the western part. Zhang et al. [19] also show that nature reserves in eastern China are less effective in reducing human activity than in western China. Therefore, the policy implication of this study is that the management of nature reserves in China needs to take more measures and needs to be strengthened. Specifically, the boundary delimitation of nature reserves should be timely, the human activities in and around them should be regularly investigated and monitored, and the protection effectiveness should be regularly evaluated.
More measures should be taken to reconcile the relationship between biodiversity and ecosystem services conservation and human development. The reason why human activities in and around the Qilian Mountains Nature Reserve have continued to increase after the establishment of the nature reserve is that there is an urgent need for economic development here. It is unsustainable and unfair to set up protected areas to protect biodiversity by simply restricting the resource utilization activities of local residents without considering their livelihoods. The managers of China’s Sanjiangyuan National Park have solved this problem by hiring local residents to participate in the national park management [51]. Considering that both Sanjiangyuan National Park and QMNR are located on the Qinghai–Tibet Plateau and have similar natural conditions, perhaps this solution is worthy of reference for managers of QMNR. Additionally, good conservation planning can also coordinate the relationship between conservation and development. Due to the large area of the Qilian Mountains Reserve, the areas of particular importance for biodiversity and ecosystem services need to be further clarified through investigation and simulation, especially the important areas for ecosystem services [52]. The important areas for biodiversity and ecosystem services should be incorporated into the reserves, and areas that do not have conservation value should be removed from the reserve as soon as possible to reduce the impact on economic development [13].
4.3. Strengthens and Limitations
The area of QMNR is large, and our study period reached 40 years. It is time-consuming and high-cost to assess the effectiveness of the reserve using traditional ecological indicators, including biodiversity and ecosystem services [22]. Thus far, globally, at least 22.5 million km2 (16.64%) of land and inland water ecosystems, and 28.1 million km2 (7.74%) of coastal waters and the ocean, are within protected areas. Management effectiveness assessments were just conducted across 18.29% of the area covered by protected areas. However, the target set by Parties to the Convention on Biological Diversity is 60%. Additionally, the Protected Planet Report 2020 also said that there is a need to assess the effectiveness of protected and conserved areas more generally. A low-cost and high-efficiency method is required to carry out a conservation effectiveness assessment for such a large area of protected areas. Considering the increasing availability of long-term human activity datasets at the global and regional scales [26,53,54,55], this simple and efficient HF method can be used to evaluate the effectiveness of multiple nature reserves over large spatial scales in reducing human activity because it does not require the collection of long sequences of biodiversity and ecosystem services related data, and it is worth extending to more regions and countries, especially for a country like China with a large protected area. Furthermore, our dataset has higher accuracy than the global dataset since our human activity datasets are mostly regional scale datasets. The global dataset overestimated the distribution of cultivated land here [21].
There are also some limitations in this study. First, the human activity factor we currently consider is insufficient. For example, the Qilian Mountains are pastoral areas, and grazing is an essential human activity [56], but our HF dataset does not consider grazing activities due to the lack of regional-scale data on livestock numbers. Therefore, our HF results are a conservative estimate of the intensity of human activity for the Qilian Mountains region. In addition, there is a high correlation between population density and land use and other human activity factors, and the absolute value of HF obtained by direct equal-weight spatial accumulation may be high [53], especially for urban areas with high population density. However, this systematic error does not change the overall trend of HF, and therefore does not affect the reliability of the comparative evaluation results of the reserve. In the future, spatial accumulation using the fuzzy algebraic sum method [54] may be an alternative for more accurate spatial mapping of human activity intensity.
5. Conclusions
Using HF value as an indicator, we evaluated the management effectiveness of QMNR by comparing inside and outside the reserve and its four functional zones. We found that (I) the establishment of QMNR slowed down the increase of HF inside the reserve to a certain extent, but did not change the overall increasing trend. The north part of the center of the reserve has a good effect in reducing human impacts, while the effectiveness was poor at both ends of the reserve. (II) After the establishment of the nature reserve, human activities in each functional zone have not been effectively controlled, including the core and buffer zones that strictly restrict human activities. From 2010 to 2020, the HF value of the core and buffer zones increased by 10.50% and 6.68%, respectively. (III) The reserve has effectively controlled the increase in population density and land use activities in the core and buffer zones, but road construction, mining, and construction of hydropower facilities still show an increasing trend. Employing local residents to participate in the management of protected areas and good conservation planning may coordinate the relationship between conservation and development.
Author Contributions
Conceptualization, S.L. and X.Z.; methodology, S.L.; software, Y.L.; validation, Y.L., Q.L. and S.L.; formal analysis, S.L.; investigation, S.S.; resources, S.L.; data curation, B.P.; writing—original draft preparation, S.L., S.S., Y.L., Q.L., and X.Z.; writing—review and editing, S.L., S.S., and B.P.; visualization, Y.L.; supervision, S.L.; project administration, S.L.; funding acquisition, X.Z. All authors have read and agreed to the published version of the manuscript.
Funding
This research was funded by the National Natural Science Foundation of China, grant number 41971245, and the Fundamental Research Funds for National University, China University of Geosciences (Wuhan), grant number CUGDCJJ202223.
Institutional Review Board Statement
Not applicable.
Informed Consent Statement
Not applicable.
Data Availability Statement
The data presented in this study are available on request from the corresponding author.
Conflicts of Interest
The authors declare no conflict of interest.
References
- Landero-Torres, I.; García-Martínez, M.A.; Galindo-Tovar, M.E.; Leyva-Ovalle, O.R.; Lee-Espinosa, H.E.; Murguía-González, J.; Negrín-Ruiz, J. Alpha Diversity of the Myrmecofauna of the Natural Protected Area Metlac from Fortin, Veracruz, Mexico. Southwest. Entomol. 2014, 39, 541–553. [Google Scholar] [CrossRef]
- Maxwell, S.L.; Cazalis, V.; Dudley, N.; Hoffmann, M.; Rodrigues, A.S.L.; Stolton, S.; Visconti, P.; Woodley, S.; Kingston, N.; Lewis, E.; et al. Area-based conservation in the twenty-first century. Nature 2020, 586, 217–227. [Google Scholar] [CrossRef]
- Li, B.V.; Pimm, S.L. How China expanded its protected areas to conserve biodiversity. Curr. Biol. 2020, 30, R1334–R1340. [Google Scholar] [CrossRef]
- Gao, J.X.; Wang, Y.; Zou, C.X.; Xu, D.L.; Lin, N.F.; Wang, L.X.; Zhang, K. China’s ecological conservation redline: A solution for future nature conservation. Ambio 2020, 49, 1519–1529. [Google Scholar] [CrossRef]
- Pan, F.J.; Song, M.J.; Wan, Q.; Yuan, L.L. A conservation planning framework for China’s national key ecological function area based on ecological risk assessment. Environ. Monit. Assess. 2022, 194, 74. [Google Scholar] [CrossRef] [PubMed]
- Bingham, H.C.; Bignoli, D.J.; Lewis, E.; MacSharry, B.; Burgess, N.D.; Visconti, P.; Deguignet, M.; Misrachi, M.; Walpole, M.; Stewart, J.L.; et al. Sixty years of tracking conservation progress using the World Database on Protected Areas. Nat. Ecol. Evol. 2019, 3, 737–743. [Google Scholar] [CrossRef] [PubMed]
- Hamilton, L.S. The Mountain Theme, World Commission on Protected Areas, IUCN. Mt. Res. Dev. 2003, 23, 290. [Google Scholar] [CrossRef]
- Jones, K.R.; Venter, O.; Fuller, R.A.; Allan, J.R.; Maxwell, S.L.; Negret, P.J.; Watson, J.E.M. One-third of global protected land is under intense human pressure. Science 2018, 360, 788–791. [Google Scholar] [CrossRef] [Green Version]
- Hockings, M. Systems for assessing the effectiveness of management in protected areas. Bioscience 2003, 53, 823–832. [Google Scholar] [CrossRef] [Green Version]
- Qin, F.; Xue, T.T.; Yang, X.D.; Zhang, W.D.; Wu, J.Y.; Huang, Y.F.; Khan, G.; Yu, S.X. Conservation status of threatened land plants in China and priority sites for better conservation targets: Distribution patterns and conservation gap analysis. Biodivers. Conserv. 2022, 1–20. [Google Scholar] [CrossRef]
- Xu, W.; Vina, A.; Kong, L.; Pimm, S.L.; Zhang, J.; Yang, W.; Xiao, Y.; Zhang, L.; Chen, X.; Liu, J.; et al. Reassessing the conservation status of the giant panda using remote sensing. Nat. Ecol. Evol. 2017, 1, 1635–1638. [Google Scholar] [CrossRef]
- Watson, J.E.M.; Jones, K.R.; Fuller, R.A.; Marco, M.D.; Segan, D.B.; Butchart, S.H.M.; Allan, J.R.; McDonald-Madden, E.; Venter, O. Persistent Disparities between Recent Rates of Habitat Conversion and Protection and Implications for Future Global Conservation Targets. Conserv. Lett. 2016, 9, 413–421. [Google Scholar] [CrossRef]
- Li, S.; Zhang, H.; Zhou, X.; Yu, H.; Li, W. Enhancing protected areas for biodiversity and ecosystem services in the Qinghai–Tibet Plateau. Ecosyst. Serv. 2020, 43, 101090. [Google Scholar] [CrossRef]
- Castillo, L.S.; Correa Ayram, C.A.; Matallana Tobón, C.L.; Corzo, G.; Areiza, A.; González-M, R.; Serrano, F.; Chalán Briceño, L.; Sánchez Puertas, F.; More, A.; et al. Connectivity of Protected Areas: Effect of Human Pressure and Subnational Contributions in the Ecoregions of Tropical Andean Countries. Land 2020, 9, 239. [Google Scholar] [CrossRef]
- Geldmann, J.; Barnes, M.; Coad, L.; Craigie, I.D.; Hockings, M.; Burgess, N.D. Effectiveness of terrestrial protected areas in reducing habitat loss and population declines. Biol. Conserv. 2013, 161, 230–238. [Google Scholar] [CrossRef]
- Geldmann, J.; Manica, A.; Burgess, N.D.; Coad, L.; Balmford, A. A global-level assessment of the effectiveness of protected areas at resisting anthropogenic pressures. Proc. Natl. Acad. Sci. USA 2019, 116, 23209–23215. [Google Scholar] [CrossRef] [PubMed]
- Geldmann, J.; Joppa, L.N.; Burgess, N.D. Mapping Change in Human Pressure Globally on Land and within Protected Areas. Conserv. Biol. 2014, 28, 1604–1616. [Google Scholar] [CrossRef]
- Anderson, E.; Mammides, C. The role of protected areas in mitigating human impact in the world’s last wilderness areas. Ambio 2020, 49, 434–441. [Google Scholar] [CrossRef]
- Zhang, H.; Li, X.; Shi, H.; Liu, X. An assessment of the effectiveness of China’s nature reserves for mitigating anthropogenic pressures based on propensity score matching. Acta Geogr. Sin. 2021, 76, 680–693. [Google Scholar]
- Tapia-Armijos, M.F.; Homeier, J.; Draper Munt, D. Spatio-temporal analysis of the human footprint in South Ecuador: Influence of human pressure on ecosystems and effectiveness of protected areas. Appl. Geogr. 2017, 78, 22–32. [Google Scholar] [CrossRef]
- Li, S.; Wu, J.; Gong, J.; Li, S. Human footprint in Tibet: Assessing the spatial layout and effectiveness of nature reserves. Sci. Total Environ. 2018, 621, 18–29. [Google Scholar] [CrossRef] [PubMed]
- Tan, L.Y.; Guo, G.C.; Li, S.C. The Sanjiangyuan Nature Reserve Is Partially Effective in Mitigating Human Pressures. Land 2022, 11, 43. [Google Scholar] [CrossRef]
- Gu, C.J.; Zhao, P.; Chen, Q.; Li, S.C.; Li, L.H.; Liu, L.S.; Zhang, Y.L. Forest Cover Change and the Effectiveness of Protected Areas in the Himalaya since 1998. Sustainability 2020, 12, 24. [Google Scholar] [CrossRef]
- Williams, B.A.; Venter, O.; Allan, J.R.; Atkinson, S.C.; Rehbein, J.A.; Ward, M.; Di Marco, M.; Grantham, H.S.; Ervin, J.; Goetz, S.J.; et al. Change in Terrestrial Human Footprint Drives Continued Loss of Intact Ecosystems. One Earth 2020, 3, 371–382. [Google Scholar] [CrossRef]
- Sanderson, E.W.; Jaiteh, M.; Levy, M.A.; Redford, K.H.; Wannebo, A.V.; Woolmer, G. The human footprint and the last of the wild. Bioscience 2002, 52, 891–904. [Google Scholar] [CrossRef]
- Venter, O.; Sanderson, E.W.; Magrach, A.; Allan, J.R.; Beher, J.; Jones, K.R.; Possingham, H.P.; Laurance, W.F.; Wood, P.; Fekete, B.M.; et al. Sixteen years of change in the global terrestrial human footprint and implications for biodiversity conservation. Nat. Commun. 2016, 7, 12558. [Google Scholar] [CrossRef] [Green Version]
- Wei, X.; Li, S.; Dou, W.; Qi, B.; Wang, Q.; Li, Y. Species diversity of myxomycetes in Qilian Mountain National Nature Reserve, Gansu Province. Biodivers. Sci. 2021, 29, 65–71. [Google Scholar]
- Chen, T.; Jia, Y.; Wang, J.; Zhang, Y.; Li, P.; Liu, C. Current Situation and Function of Soil Conservation in National Nature Reserves in the Qilian Mountains Based on InVEST Model. Arid Zone Res. 2020, 37, 150–159. [Google Scholar]
- Jiao, L.; Zhao, C. The analysis and evaluation on grassland ecosystem service function value of Shandan Horse Field in Qilian Mountain National Nature Reserve. J. Arid Land Resour. Environ. 2013, 27, 47–52. [Google Scholar]
- Li, L.H.; Zhang, Y.L.; Liu, L.S.; Wang, Z.F.; Zhang, H.M.; Li, S.C.; Ding, M.J. Mapping Changing Population Distribution on the Qinghai-Tibet Plateau since 2000 with Multi-Temporal Remote Sensing and Point-of-Interest Data. Remote Sens. 2020, 12, 4059. [Google Scholar] [CrossRef]
- Bai, Z.Q.; Wang, J.L.; Wang, M.M.; Gao, M.X.; Sun, J.L. Accuracy Assessment of Multi-Source Gridded Population Distribution Datasets in China. Sustainability 2018, 10, 1363. [Google Scholar] [CrossRef] [Green Version]
- National Bureau of Statistics Survey Office in Gansu. Gansu Statistical Yearbook; China Statistics Press: Beijing, China, 2021. [Google Scholar]
- Qinghai Provincical Bureau of Statistics and National Bureau of Statistics Survey Office in Qinghai. Qinghai Statistical Yearbook; China Statistics Press: Beijing, China, 2021. [Google Scholar]
- Li, S.; Zhang, X. Land use-based human activity intensity along the Yangtze River Economic Belt, China (1970s–2015). China Sci. Data 2018, 3, 1–8. [Google Scholar] [CrossRef]
- Ning, J.; Liu, J.; Kuang, W.; Xu, X.; Zhang, S.; Yan, C.; Li, R.; Wu, S.; Hu, Y.; Du, G.; et al. Spatiotemporal patterns and characteristics of land-use change in China during 2010–2015. J. Geogr. Sci. 2018, 28, 547–562. [Google Scholar] [CrossRef] [Green Version]
- Liu, J.Y.; Kuang, W.H.; Zhang, Z.X.; Xu, X.L.; Qin, Y.W.; Ning, J.; Zhou, W.C.; Zhang, S.W.; Li, R.D.; Yan, C.Z.; et al. Spatiotemporal characteristics, patterns, and causes of land-use changes in China since the late 1980s. J. Geogr. Sci. 2014, 24, 195–210. [Google Scholar] [CrossRef]
- Zhao, G.S.; Liu, J.Y.; Kuang, W.H.; Ouyang, Z.Y.; Xie, Z.L. Disturbance impacts of land use change on biodiversity conservation priority areas across China: 1990–2010. J. Geogr. Sci. 2015, 25, 515–529. [Google Scholar] [CrossRef] [Green Version]
- Duan, Q.; Luo, L.; Zhao, W.; Zhuang, Y.; Liu, F. Mapping and Evaluating Human Pressure Changes in the Qilian Mountains. Remote Sens. 2021, 13, 2400. [Google Scholar] [CrossRef]
- Sun, Y.; Liu, S.; Shi, F.; An, Y.; Li, M.; Liu, Y. Spatio-temporal variations and coupling of human activity intensity and ecosystem services based on the four-quadrant model on the Qinghai-Tibet Plateau. Sci. Total Environ. 2020, 743, 140721. [Google Scholar] [CrossRef]
- Li, Y.; Zhou, J.; Wu, X. Effects of the construction of Qinghai-Tibet railway on the vegetation ecosystem and eco-resilience. Geogr. Res. 2017, 36, 2129–2140. [Google Scholar]
- Yan, J.; Zhang, Y.; Liu, L.; Shen, Z.; Liu, Y.; Zheng, D. Main Effect of Plateau Traffic on Land Use and Landscape Pattern Change: From Lanzhou to Golmud. Acta Geogr. Sin. 2003, 58, 34–44. [Google Scholar]
- Chen, H.; Li, S.; Zheng, D. Features of Ecosystems alongside Qinghai-Xizang Highway and Railway and the Impacts of Road Construction on Them. J. Mt. Sci. 2003, 21, 559–567. [Google Scholar]
- Gao, X.; Li, T.; Cao, X. Spatial Fairness and Changes in Transport Infrastructure in the Qinghai-Tibet Plateau Area from 1976 to 2016. Sustainability 2019, 11, 589. [Google Scholar] [CrossRef] [Green Version]
- Gao, D.; Li, S. Spatiotemporal impact of railway network in the Qinghai-Tibet Plateau on accessibility and economic linkages during 1984–2030. J. Transp. Geogr. 2022, 100, 103332. [Google Scholar] [CrossRef]
- Li, X.; Zhou, Y.; Zhao, M.; Zhao, X. A harmonized global nighttime light dataset 1992–2018. Sci. Data 2020, 7, 168. [Google Scholar] [CrossRef]
- Wu, J.; Ma, L.; Li, W.; Peng, J.; Liu, H. Dynamics of Urban Density in China: Estimations Based on DMSP/OLS Nighttime Light Data. IEEE J. Sel. Top. Appl. Earth Observ. Remote Sens. 2014, 7, 4266–4275. [Google Scholar] [CrossRef] [Green Version]
- Li, X.; Gou, X.H.; Wang, N.L.; Sheng, Y.; Jin, H.J.; Qi, Y.; Song, X.Y.; Hou, F.J.; Li, Y.; Zhao, C.M.; et al. Tightening ecological management facilitates green development in the Qilian Mountains. Chin. Sci. Bull.-Chin. 2019, 64, 2928–2937. [Google Scholar] [CrossRef] [Green Version]
- Gou, X.H.; Hou, F.J.; Li, Y.; Zhao, C.M.; Zou, S.B.; Fang, X.W. Report on Scientific Investigation of Ecosystem Change in Qilian Mountains; Science Press: Beijing, China, 2022; pp. 1–245. [Google Scholar]
- Xu, B.; Wang, Y.; Zhang, Y.; Yuan, H.; Wang, S. Demographic change in Qilian Mountain Natural Reserve and its impact on forest steppe. Pratacultural Sci. 2013, 30, 973–981. [Google Scholar]
- Wang, T.; Gao, F.; Wang, B.; Wang, P.; Wang, Q.; Song, H.; Yin, C. Status and suggestions on ecological protection and restoration of Qilian Mountains. J. Glaciol. Geocryol. 2017, 39, 229–234. [Google Scholar]
- Zhao, X.; Zhu, Z.; Lu, Z.; Xiao, L.; Mei, S.; Wang, H. An observation to the new initiative of community conservation guard posts in the pilot Three-River-Source National Park. Biodivers. Sci. 2018, 26, 210–216. [Google Scholar] [CrossRef]
- Xu, W.; Xiao, Y.; Zhang, J.J.; Yang, W.; Zhang, L.; Hull, V.; Wang, Z.; Zheng, H.; Liu, J.G.; Polasky, S.; et al. Need for a new protected area category for ecosystem services. Proc. Natl. Acad. Sci. USA 2017, 114, E4319–E4320. [Google Scholar] [CrossRef] [Green Version]
- Kennedy, C.M.; Oakleaf, J.R.; Theobald, D.M.; Baruch-Mordo, S.; Kiesecker, J. Managing the middle: A shift in conservation priorities based on the global human modification gradient. Glob. Chang. Biol. 2019, 25, 811–826. [Google Scholar] [CrossRef]
- Theobald, D.M.; Kennedy, C.; Chen, B.; Oakleaf, J.; Baruch-Mordo, S.; Kiesecker, J. Earth transformed: Detailed mapping of global human modification from 1990 to 2017. Earth Syst. Sci. Data 2020, 12, 1953–1972. [Google Scholar] [CrossRef]
- Riggio, J.; Baillie, J.E.M.; Brumby, S.; Ellis, E.; Kennedy, C.M.; Oakleaf, J.R.; Tait, A.; Tepe, T.; Theobald, D.M.; Venter, O.; et al. Global human influence maps reveal clear opportunities in conserving Earth’s remaining intact terrestrial ecosystems. Glob. Chang. Biol. 2020, 26, 4344–4356. [Google Scholar] [CrossRef] [PubMed]
- Sun, Y.; Liu, S.; Liu, Y.; Dong, Y.; Li, M.; An, Y.; Shi, F. Grazing intensity and human activity intensity data sets on the Qinghai-Tibetan Plateau during 1990–2015. Geosci. Data J. 2021, 9, 140–153. [Google Scholar] [CrossRef]
Publisher’s Note: MDPI stays neutral with regard to jurisdictional claims in published maps and institutional affiliations. |
© 2022 by the authors. Licensee MDPI, Basel, Switzerland. This article is an open access article distributed under the terms and conditions of the Creative Commons Attribution (CC BY) license (https://creativecommons.org/licenses/by/4.0/).