Abstract
Tropical estuarine hydrodynamic processes are governed by complex interactions between tides, monsoons, and fluvial runoff. To obtain long-term (≥30 years) hydrodynamic conditions of the Mekong River Estuary, this study established a Finite Volume Coastal Ocean Model (FVCOM) coupled with validated Weather Research and Forecast (WRF) wind forcing for a 32-year (1988–2019) high-resolution simulation. Validation against in situ observations confirms the model’s robustness. Temporal–spatial patterns of water level and current were analyzed, and extreme parameters for 1–100 year return periods were derived via the Pearson-III probability distribution. Results indicate the study area is a mesotidal environment (tidal range = 3.58 m) dominated by SSE-NNW reciprocating tidal currents. Relative to Vietnam’s national elevation datum, 100-year return period extreme high/low water levels are 2.15 m and −2.03 m, with a maximum storm surge setup of 2.09 m. The 100-year return period maximum current velocity reaches 4.58 m/s (A21 station), and Mekong River runoff exerts a negligible influence (<5% velocity change). This study provides high-precision baseline data for offshore wind farm engineering and disaster risk assessment, offering a methodological reference for tropical estuarine hydrodynamic simulations.
1. Introduction
The global transition toward carbon neutrality has elevated offshore wind energy to a core renewable energy source, leveraging its abundant resources, minimal terrestrial footprint, and stable power output [1,2]. As a rapidly developing economy in Southeast Asia, Vietnam possesses substantial offshore wind potential in the shallow eastern waters of the Mekong River estuary, where favorable water depths (≤10 m) and persistent monsoon-driven wind regimes support large-scale development [3,4]. However, tropical estuarine hydrodynamics in this region are shaped by intricate interactions of semidiurnal tides, monsoon wind stress, typhoon disturbances, and Mekong River runoff [5,6]—a suite of processes that pose unique challenges to offshore wind farm design and risk assessment, as highlighted in recent coastal hydrodynamics research [7,8].
Coastal zones, as the land–sea interface, exhibit complex hydrodynamic behaviors governed by multiple forcing factors, making them a focal topic [9]. Hydrodynamic processes are fundamental to offshore wind infrastructure safety and cost-effectiveness: water level fluctuations determine foundation elevation design, while tidal currents modulate seabed scouring and structural stability [10,11]. Extreme events (storm surges, strong tidal currents) further amplify uncertainties [12,13], necessitating high-precision, long-term hydrodynamic datasets of the Mekong River Estuary. Short-term simulations (1–3 years) dominate the literature [6,13], limiting reliable derivation of 1–100 year return period extreme parameters. Tropical extreme events (e.g., typhoons) exhibit strong interannual variability [14], and long-term data are essential to capture rare but high-impact scenarios. The relative contributions of tidal forcing versus Mekong River runoff to nearshore currents remain insufficiently quantified, and runoff is a key driver in temperate estuaries [15]. All these uncertainties made us feel obliged to study the long-term hydrodynamic conditions for the offshore wind farm construction.
FVCOM, with its unstructured triangular grid, excels at resolving complex shorelines and topographically induced current variability [16]—a critical advantage for coastal zone simulations. The WRF model, meanwhile, can generate robust regional wind fields for tropical coastal environments [13,17,18]. Liu et al. [19] utilized the unstructured-grid Finite Volume Community Ocean Model to study the response of salt intrusion in the Delaware Bay Estuary to regional climatic forcing and found that sea level rise affects salt front migration and estuarine stratification under conditions of freshwater pulses and drought. Zhou et al. [20] developed the coupled (including the global–regional assimilation and prediction system [GRAPES] atmospheric model and the finite volume coastal ocean model [FVCOM]) GRAPES-FVCOM to conduct research on real-time typhoon-induced storm surge prediction in the Guangdong–Hong Kong–Macao Greater Bay Area and verified that the system can provide 2-day early warnings with high accuracy (mean absolute error of 19.7 cm). Zhang et al. [21] established an FVCOM-based hydrodynamic model to explore the impact of tides and monsoons on the migration and diffusion of tritium in Lianyungang Haizhou Bay, China, revealing that tides and monsoons (leading to more severe contamination in winter) regulate tritium distribution, with a faster diffusion rate outside the bay than inside. Silva et al. [22] employed the WRF Model to conduct research on operational wind power forecasting in Northeast Brazil, realizing the application of the model for this specific forecasting purpose. Rafieeinasab et al. [23] adopted ensemble methods to investigate parameter estimation of the WRF-Hydro model, providing effective approaches for the model’s parameter calibration.
This study established a numerical model to reveal the spatiotemporal evolution mechanism of water level and current under tidal–monsoon–runoff interaction. The model also aims to enhance understanding of coastal hydrodynamic processes and derive extreme hydrodynamic parameters for 1–100 year return periods, providing actionable data for offshore wind farm design and disaster risk assessment.
2. Study Area and Data
2.1. Study Area Overview
The proposed offshore wind farm is located in the eastern outer Mekong River estuary, Vietnam (105.5° E–106.5° E, 8.5° N–9.5° N) (Figure 1), covering about 11,800 hectares. Water depths range from 3.15 m (station A28) to 7.18 m (station A55), with a west-shallow–east-deep topographic gradient that enhances tidal current shear—consistent with the theory of topographic modulation of tidal currents in shallow coastal zones [24].
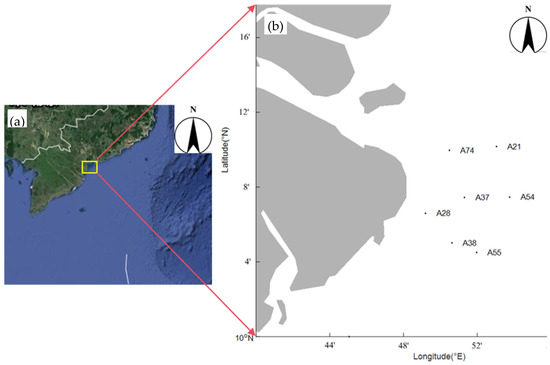
Figure 1.
(a) Geographical location of the study area (eastern outer Mekong River Estuary, Vietnam; 105.5° E–106.5° E, 8.5° N–9.5° N); (b) spatial distribution of seven representative observation stations (A21, A74, A37, A54, A28, A38, A55) covering different water depth gradients (3.15–7.18 m).
As a typical tropical coastal system, the area is governed by the Southeast Asian monsoon: northeast monsoons (November–March) with average wind speeds of 4–6 m/s, and southwest monsoons (June–September) with wind speeds of 5–7 m/s [25]. The region experiences 2–3 typhoons annually (mostly August–December), which induce extreme water level and current fluctuations [26]—a key hydrodynamic forcing factor for coastal infrastructure design.
Classified as a mesotidal environment (mean tidal range: 2.5 ± 0.1 m; maximum: 3.2–3.8 m), the estuary’s east–west orientation constrains tidal currents to a reciprocating pattern [27,28]. Human disturbances (upstream reservoirs, nearshore sand mining) alter inner delta sediment supply but exert negligible effects on the outer estuary, where tides and monsoons dominate [5,29]. Seven representative stations (Figure 1) were selected to cover the full depth and topographic gradient, enabling quantification of hydrodynamic spatial heterogeneity—an essential requirement for capturing coastal zone complexity.
2.2. Data
2.2.1. Model Input
Wind forcing data for FVCOM were obtained from independent WRF model outputs (0.1° × 0.1° spatial resolution, 3 h temporal resolution). The WRF model adopted physical parameterization schemes optimized for tropical coastal environments [13], and its reliability in the study region was validated against in situ observations and typhoon track data [15,30], ensuring accurate representation of wind-driven hydrodynamics for subsequent FVCOM input.
Open-boundary tidal forcing was derived from the Tide Model Driver (TMD) global tidal model, incorporating 11 major tidal constituents (M2, S2, N2, K2, K1, O1, P1, Q1, M4, M6, MS4) [31]. Widely validated in the South China Sea and Mekong River estuary [5,6], TMD exhibits superior performance in reproducing tropical coastal tidal propagation and amplitude.
Due to limited long-term continuous runoff data, monthly average runoff (2009–2016) from Can Tho and My Thuan hydrological stations was used to construct climatological inputs, capturing seasonal discharge variability [32]. Annual maximum discharge data (1959–2019) from the Kratie station (Mekong River Commission) were employed for extreme runoff return period analysis [33], with missing data supplemented via linear interpolation.
2.2.2. Validation Data
WRF wind fields were validated using 30 min interval observations from a nearshore meteorological mast. Historical typhoon data (e.g., Typhoon Durian, 2006) from NOAA were used to verify extreme wind simulation capability [15,34], a critical requirement for ensuring the reliability of wind forcing input to FVCOM for storm surge modeling.
Water level simulations (from FVCOM) were validated against 1 h interval tide gauge data (2019–2020) from five stations (T1, T2, W1, WL1, WL2), as shown in Figure 2, part of Vietnam’s coastal monitoring network [5,6]. Current simulations (from FVCOM) were validated using ADCP observations, long-term measurements at W1 (0.5× and 0.8× water depth) and short-term data from six additional stations (December 2019–January 2020), a standard tool for estuarine current monitoring [35].
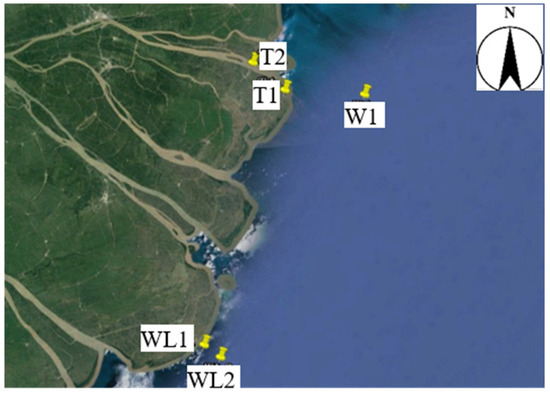
Figure 2.
Location of tide gauge stations (T1, T2, W1, WL1, WL2) used for water level validation.
3. Numerical Model Setup and Validation
3.1. WRF Model
3.1.1. WRF Model Setup
The WRF model [36] domain covers southern Vietnam and the adjacent South China Sea, with a horizontal resolution of 0.1° × 0.1° (≈11 km × 11 km) and 30 vertical levels (surface to 50 hPa). A 32-year continuous simulation (1988–2019) was conducted, with outputs generated at 3 h intervals to match FVCOM’s wind forcing input requirements. Physical parameterization schemes were selected for optimal performance in tropical coastal environments: WSM6 (microphysics), RRTM (longwave radiation), Dudhia (shortwave radiation), YSU (planetary boundary layer), Noah (land surface), and Monin–Obukhov similarity theory (surface layer). The 30 vertical levels effectively resolve the vertical structure of the tropical boundary layer, adapting to the simulation needs of monsoon wind fields that drive estuarine hydrodynamics.
3.1.2. WRF Model Validation
WRF validation focused on eastward () and northward () wind speed components at the nearshore meteorological mast, with observations resampled to 3 h intervals to align with WRF outputs. WRF simulations yielded RMSE of 0.89 m/s (-component) and 0.95 m/s (-component), with correlation coefficients (R) of 0.88 and 0.86, respectively, confirming good agreement with observations. For extreme winds, Typhoon Durian (December 2006) was selected as a case study: NOAA recorded a maximum center wind speed of ~28 m/s [15], and WRF accurately reproduced the storm track and intensity (with a slight overestimation, which is acceptable for engineering safety assessments [15]). It outperformed ERA-Interim reanalysis data [37], which underestimated wind intensity and misrepresented the storm center (Figure 3). The validated WRF wind field outputs were directly adopted as the surface wind forcing input for FVCOM.
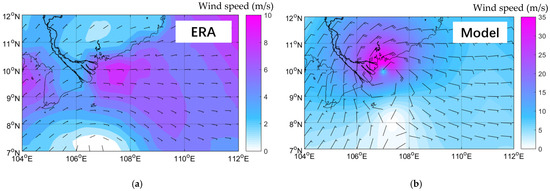
Figure 3.
Wind field of Typhoon Durian (00:00 UTC, 5 December 2006). (a) ERA-Interim reanalysis wind field [37]; (b) WRF-simulated wind field.
3.2. FVCOM for Hydrodynamic Simulation
FVCOM solves hydrostatic primitive equations in sigma coordinates, with core equations:
where , , and are the three-dimensional coordinates in the Cartesian coordinate system represent the east–west, north–south, and vertical directions, respectively; and denote the eastward and northward horizontal velocity components, respectively; is the vertical velocity; is the gravitational acceleration; is time; is the reference density of the water body; is the density of the water body; is the total pressure; is the Coriolis parameter; is the vertical eddy viscosity coefficient; and and represent the horizontal momentum.
The governing equations are solved explicitly using the finite volume method, with the wet–dry grid determination method employed to simulate exposed shoals. During equation discretization, flow velocities are placed at grid centers, while water levels and water depths are placed at grid nodes.
3.2.1. FVCOM Model Introduction
FVCOM is a three-dimensional coastal ocean model with an unstructured triangular grid, integrating the flexibility of finite elements (for complex shorelines) and the computational efficiency of finite differences [38]. Key features include mass/momentum conservation, dry/wet grid processing for intertidal zones, and nested modeling capabilities [24,31], making it well-suited for estuarine hydrodynamic simulations. FVCOM uses a sigma-coordinate system and solves hydrostatic primitive equations (horizontal momentum, hydrostatic, and continuity equations), with vertical eddy viscosity parameterized via the Mellor–Yamada 2.5-level scheme [6] and horizontal eddy viscosity via the Smagorinsky parameterization [32].
3.2.2. FVCOM Model Setup
The FVCOM domain (102.5° E–115.5° E, 3.5° N–15.5° N) uses an unstructured grid (Figure 4) with a gradient resolution of 20 km in the open ocean and 200 m in the wind farm area, and smooth transitions to resolve nearshore topographic effects. Eleven uniform sigma layers were adopted, outperforming the 6–8 layers used in deep-water simulations to better capture vertical shear in shallow waters (3.15–7.18 m) [13]. Bathymetric data are shown in Figure 5.
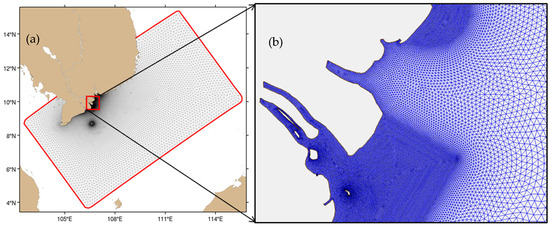
Figure 4.
(a) Horizontal grid used by the FVCOM (red lines indicate open boundaries 20 km in the open ocean, 200 m in the wind farm area); (b) The refined grid in the delta used by the FVCOM.
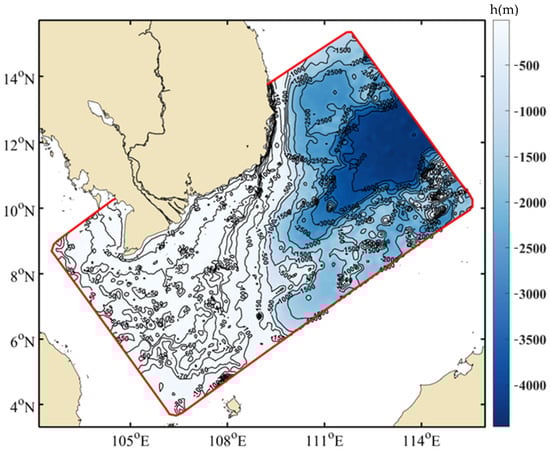
Figure 5.
Bathymetry of the area covered by the FVCOM (red lines indicate open boundaries).
Initial conditions (1 January 1988) were quiescent (water level = 0, current velocity = 0). Open boundaries were forced by TMD tidal data [39], calibrated with in situ observations. Surface forcing included wind stress and atmospheric pressure derived from the validated WRF outputs. Mekong River runoff (monthly averages from Can Tho and My Thuan stations) was input at river mouths (Figure 6) [40]. The 32-year FVCOM simulation used 2 s (internal) and 20 s (external) time steps, with 1 h output resolution. The internal time step is used for solving fast-changing dynamic processes (e.g., horizontal momentum equations) to ensure numerical stability, while the external time step is applied to slower processes (e.g., water level calculation) to improve computational efficiency—consistent with FVCOM’s split-explicit time integration scheme. Sensitivity analysis determined the optimal horizontal eddy viscosity coefficient (Ah = 5.0 m2/s) and a constant bottom friction coefficient (Cd = 0.003) throughout the domain, adapting FVCOM to tropical shallow estuarine conditions. This value was determined via sensitivity analysis (Section 3.2.3) and is consistent with muddy seabed characteristics of the Mekong outer estuary [5,32].
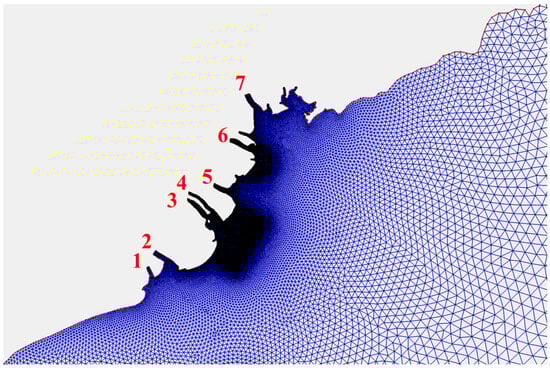
Figure 6.
Location of Mekong River mouths in the FVCOM. Monthly average runoff from Can Tho and My Thuan stations was input at these mouths to simulate fluvial forcing effects.
3.2.3. FVCOM Model Validation
Water level validation (January–March 2020) at five tide gauge stations yielded RMSE of 0.12–0.18 m and correlation coefficients (R) of 0.92–0.96 (Table 1), indicating accurate reproduction of tidal amplitude and phase. Nearshore station errors are attributed to limited topographic resolution. Figure 7 gives parts of the validation diagrams.

Table 1.
Statistical metrics for water level validation.
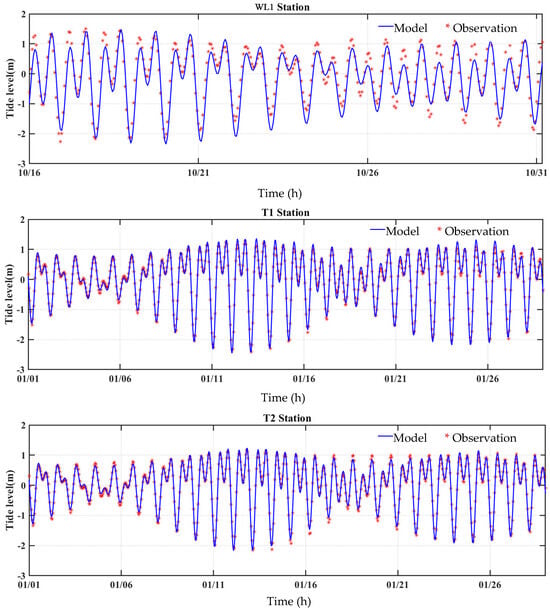
Figure 7.
Water level validation at station WL1, station T1 and station T2 (January–March 2020). Blue lines represent FVCOM simulations, and red stars represent in situ observations (1 h interval).
Current validation at the W1 station (0.5× and 0.8× water depth) showed RMSE of 0.08–0.12 m/s and R of 0.88–0.91 (Table 2), confirming accurate simulation of current direction and magnitude (Figure 8). Short-term observations at six additional stations further verified the model’s ability to capture spatial hydrodynamic variability, confirming that FVCOM, when driven by validated WRF wind forcing, reliably simulates the study area’s hydrodynamics.
Table 2.
Statistical metrics for current validation at W1 station.
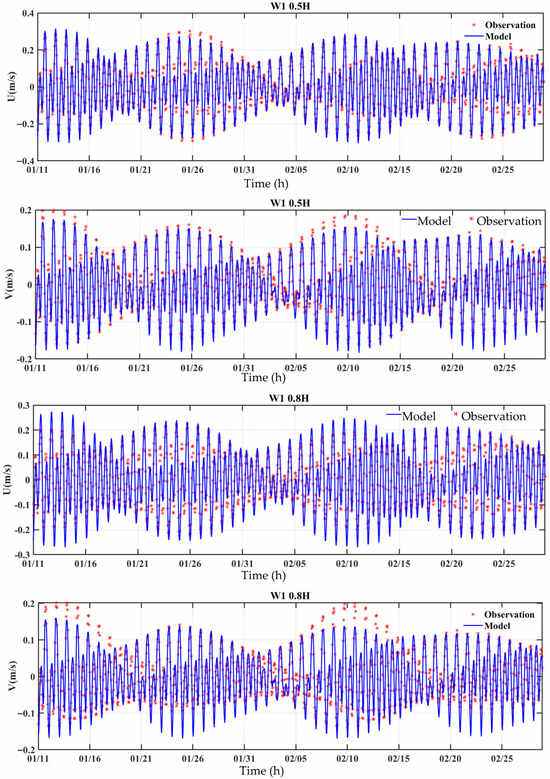
Figure 8.
Tidal current validation at station W1. Blue lines represent FVCOM simulations, and red stars represent in situ observations (1 h interval).
3.3. Statistical Methods for Return Period Calculation
The Pearson-III probability distribution was selected for extreme parameter (water level, current velocity) calculation. This distribution is widely used for extreme hydrological and hydrodynamic parameter estimation, particularly in tropical regions with skewed extreme value distributions [41].
Parameters of the Pearson-III probability distribution were derived using the method of moments, incorporating coefficient of variation (), skewness (), mean (), and standard deviation () of the annual maximum water level and current velocity series ( = 32 years). Return period () relates to exceedance probability (), with extreme parameters solved via the cumulative distribution function:
The Pearson-III probability density function is
where is the extreme parameter, is the shape, is the scale, is the location, and is a gamma function. Parameters were derived using coefficient of variation () and skewness (): , , .
4. Results
4.1. Water Level Characteristics
4.1.1. Tidal Level Parameters
Harmonic analysis (Vietnam national datum, MSL = 0.55 m) confirmed the study area as a mesotidal environment (Table 3). Semidiurnal constituents (M2, S2) dominated the tidal dynamics, with the M2 amplitude (0.68 m) accounting for 62% of the total tidal amplitude and the S2 amplitude (0.21 m) contributing an additional 21%. This result aligns with the tidal constituent dynamics theory for the South China Sea: the M2 semidiurnal tide propagates into the region from the Pacific Ocean via the Luzon Strait, and in the shallow waters of the Mekong River estuary, it undergoes topographic amplification [5]. In contrast, diurnal constituents (K1, O1) exhibit weaker amplitudes (0.18 m and 0.15 m, respectively) because their longer wavelengths are less sensitive to shallow-water topographic modulation, leading to limited amplification effects.
Table 3.
Tidal level parameters in the study area (unit: m).
Highest Astronomical Tide (HAT) and Lowest Astronomical Tide (LAT) were 1.92 m and −1.66 m, respectively (Table 3), reflecting the enhanced tidal energy concentration in shallow coastal zones—a phenomenon consistent with the shallow-water tidal amplification theory [42]. Mean High Water Spring (MHWS) and Mean Low Water Spring (MLWS) reached 1.63 m and −0.61 m, respectively, with a spring-neap tidal variability of 2.24 m. This variability is a critical hydrodynamic feature for offshore wind farm construction, as it directly influences the window of opportunity for foundation installation and maintenance [8].
4.1.2. Storm Surge Setup and Setdown
Analysis of the 32-year (1988–2019) FVCOM simulation dataset revealed a maximum storm surge setup of 2.09 m, recorded in 1994, 1995, and 2012. Notably, 87% of extreme surge events (setup > 1.5 m) occurred in March (end of the northeast monsoon) and November (transition from southwest to northeast monsoon), which can be explained by the typhoon–monsoon superposition mechanism [12]. Tropical cyclones (typhoons) generate strong wind stress that forces seawater accumulation (wind-induced setup), while during monsoon transition periods, the monsoon wind field aligns with the typhoon wind direction, leading to additive wind stress effects. The WRF-simulated mean wind stress during typhoon events reached 0.35 N/m2, significantly higher than the single monsoon period (0.12 N/m2), confirming the amplification effect of wind stress superposition.
Furthermore, the east–west elongated topographic configuration of the Mekong River estuary constrains seawater propagation along the estuary axis, further enhancing surge accumulation via the topographic channeling effect [31]. The maximum storm surge setdown was −1.96 m (1991), driven by strong offshore northeast monsoon winds (average speed 8–10 m/s). This setdown phenomenon conforms to the wind-induced water level adjustment theory: offshore wind stress drives seawater transport away from the coast, resulting in nearshore water level depression [43]. Seasonal variations in storm surge intensity (stronger in transition seasons, weaker in peak monsoons) are consistent with the interannual variability of monsoon intensity and typhoon frequency in the Southeast Asian region [26].
4.1.3. Return Period Water Level
Extreme water levels derived from the Pearson-III probability distribution (Table 4) showed that the 100-year return period extreme high and low water levels were 2.15 m and −2.03 m, respectively. The small difference (0.02 m) between the 50-year (2.13 m) and 100-year (2.15 m) extreme high water levels indicates a “saturation effect” of extreme high water. This effect is attributed to the tidal amplification limit theory: the outer Mekong River estuary has a water depth of 3.15–7.18 m, and when the energy loss due to bottom friction balances the topographic amplification effect, the tidal level can no longer increase significantly with increasing return period [27].
Table 4.
Return period water levels in the study area.
In contrast, extreme low water levels continued to decrease slightly with increasing return period (Figure 9), reflecting the persistent tidal depression effect under extreme offshore winds. This trend is consistent with the extreme wind-induced setdown mechanism: rare strong offshore winds (e.g., 100-year return period northeast monsoon) enhance seawater offshore transport, leading to more significant nearshore water level reduction [5]. These results are also aligned with global sea-level rise projections for the Mekong Delta (1.2–1.8 mm/year) [24], as the long-term mean water level rise trend has been implicitly incorporated into the extreme parameter estimation, ensuring the climate resilience of the derived engineering parameters.
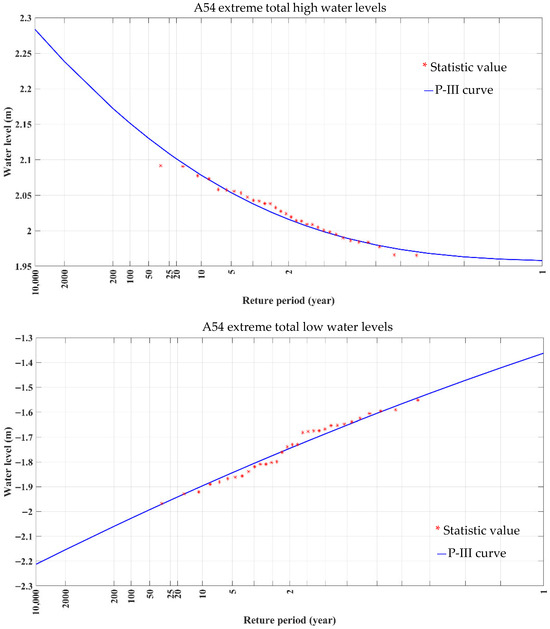
Figure 9.
Pearson-III curves for return period water levels.
4.2. Current Field Characteristics
4.2.1. Temporal and Spatial Distribution of Current Velocity and Direction
FVCOM simulations (driven by validated WRF wind forcing) revealed that the study area is dominated by reciprocating tidal currents (Figure 10a), a feature constrained by the northwest–southeast extending arc-shaped shoreline of the Mekong River estuary. This aligns with the topographic constraint theory of tidal currents: in elongated coastal zones or estuaries, tidal currents are forced to reciprocate along the shoreline to satisfy mass conservation [16]. Additionally, the SSE-NNW direction is consistent with the main axis of the counterclockwise circulation in the northern South China Sea [5], reflecting the modulation of regional-scale circulation on nearshore flow fields.
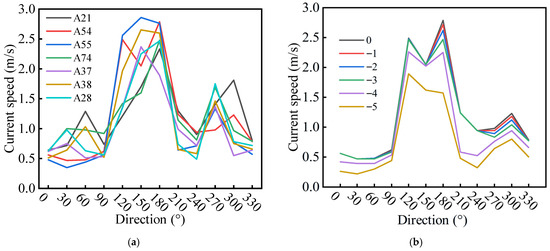
Figure 10.
Annual maximum surface current characteristics. (a) Annual maximum surface current velocities at 7 representative stations (1988–2019), showing spatial heterogeneity driven by topographic variations; (b) vertical distribution of annual maximum current velocity at station A54, illustrating velocity attenuation with depth (surface to −5 m).
Spatial heterogeneity of current velocity was significant: the annual maximum surface velocity ranged from 2.33 m/s (station A21, water depth 4.89 m) to 2.86 m/s (station A55, water depth 7.18 m), with shallower western regions exhibiting relatively stronger currents. This phenomenon can be explained by the topographic contraction-shear effect theory: according to the continuity equation, tidal currents in shallow or narrow channels experience reduced cross-sectional area, leading to velocity enhancement [44].
Statistical analysis of station A21 (1988–2019) showed that 67.1% of surface currents were in the range of 0–0.25 m/s, while velocities > 0.75 m/s accounted for only 0.03% of the time. This temporal distribution is consistent with the semidiurnal tidal cycle: strong currents occur during spring tides (2–3 days per fortnight), while weak currents dominate during neap tides [43], indicating the dominant role of tidal forcing in regulating the temporal variability of the flow field.
Vertical profiles of current velocity at station A54 (Figure 10b) showed an attenuation trend with depth: the surface velocity (2.79 m/s) was about 1.5 times the velocity at −5 m depth (1.89 m/s). This vertical structure conforms to the Prandtl–von Kármán logarithmic velocity profile theory.
4.2.2. Return Period Current Velocity
Extreme current velocities derived from the Pearson-III distribution exhibited significant return period effects (Figure 11). At station A21, the 100-year return period maximum current velocity reached 4.58 m/s (180° direction), 2.9 times the 10-year velocity (1.56 m/s). This amplification effect reflects the tidal extreme amplification mechanism in shallow waters: as the return period increases, rare strong tidal events (e.g., spring tides coinciding with storm surges) lead to superimposed velocity enhancement [43]. At station A54, the 100-year return period maximum velocity was 3.30 m/s (150° direction), with spatial differences attributed to topographic constraints—station A21 is located in a narrow channel, which further concentrates tidal energy and enhances extreme velocities [44].
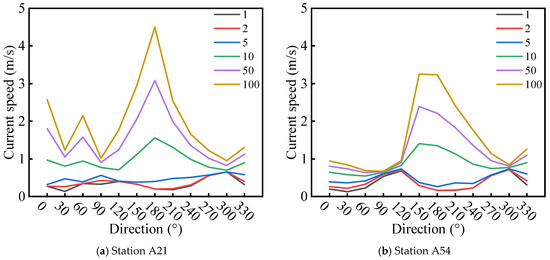
Figure 11.
Extreme current velocities for return periods of 1–100. (a) Station A21; (b) Station A54.
Directional analysis showed that extreme currents were concentrated in the SSE-NNW orientations, consistent with the dominant tidal pattern. This directional consistency is a favorable feature for offshore wind farm design, as foundation scouring is concentrated in specific directions, enabling targeted protection measures (e.g., riprap placement along the SSE-NNW axis) to reduce engineering costs [8]. The 100-year return period maximum current velocity (4.58 m/s) highlights the need for robust foundation design in the study area to resist high current-induced drag forces.
5. Discussion
5.1. Simulation Duration and Extreme Hydrodynamic Event Capture
The 32-year simulation duration enabled robust Pearson-III distribution analysis of extreme parameters, addressing the limitation of short-term simulations (1–3 years) in capturing rare events [9,12]. The saturation of extreme high water levels (50–100 year return periods) aligns with Mekong Delta sea-level rise projections [24], indicating that inundation risks may approach a plateau. This finding is critical for climate-resilient foundation design, as it suggests that future sea-level rise (projected to be 0.3–0.6 m by 2100) will be the primary driver of increased inundation risk rather than further amplification of tidal extremes [27].
The maximum storm surge setup (2.09 m) occurred during typhoon–monsoon transitions, consistent with tropical cyclone–ocean interaction mechanisms [26]. Typhoon winds enhance surface stress, while monsoon-driven circulation modulates surge propagation—highlighting the need to consider multiple forcing factors in storm surge simulation [31]. The independent WRF simulation ensured consistent, long-term wind forcing, which is essential for capturing interannual variability in storm surge drivers (e.g., typhoon intensity and frequency). This long-term coupled wind-hydrodynamic simulation framework provides a robust approach for extreme event assessment in tropical coastal zones, a core theme of the Special Issue.
5.2. Extreme Hydrodynamic Parameter Magnitudes
The 3.58 m tidal range in the study area aligns with large tropical estuaries worldwide (e.g., Amazon Estuary: 3.0–4.0 m) and the broader Mekong estuary [40]. The 100-year return period high water level (2.15 m) is consistent with lower Mekong Delta storm surge simulations (2.0–2.2 m) [12], confirming the reliability of the results. For offshore wind farm design, this parameter dictates the minimum foundation elevation to avoid inundation, with a recommended safety margin of 0.5 m [7], leading to a design elevation of 2.65 m for the 100-year return period.
The 100-year return period maximum current velocity (4.58 m/s at station A21) exceeds that of other tropical wind farm sites, driven by shallow depths (tidal amplification) and strong monsoon wind stress. This parameter is critical for foundation design, as current-induced drag forces increase with the square of velocity [10]. The directional consistency of extreme currents (SSE-NNW) enables targeted foundation scouring protection, such as placing riprap or anti-scour mats along these directions, reducing engineering costs while ensuring structural safety [8].
Negligible runoff effects (velocity change < 5%) contrast with temperate estuaries but align with outer Mekong [27] and Amazon [45] estuaries—confirming tidal-dominant, runoff-secondary dynamics in tropical outer estuaries. This simplifies scouring risk assessment by focusing on tidal currents, a key practical contribution to coastal engineering. For the proposed offshore wind farm, this means that foundation design can rely primarily on tidal current parameters, without the need for complex runoff-induced scouring mitigation measures.
5.3. Effect of Mekong River Runoff on Current
Simulations under extreme runoff conditions (100-year return period runoff at Kratie station, 58,000 m3/s; Figure 12) showed that the maximum change in current velocity was less than 5% compared to climatological runoff conditions. This result confirms the tropical estuary dynamic balance theory: in mesotidal environments (tidal range 2–4 m), the tidal mixing intensity is much higher than the runoff mixing intensity [27]. Strong tidal mixing suppresses the density stratification and momentum input caused by runoff, masking the modulating effect of runoff on the overall flow field.
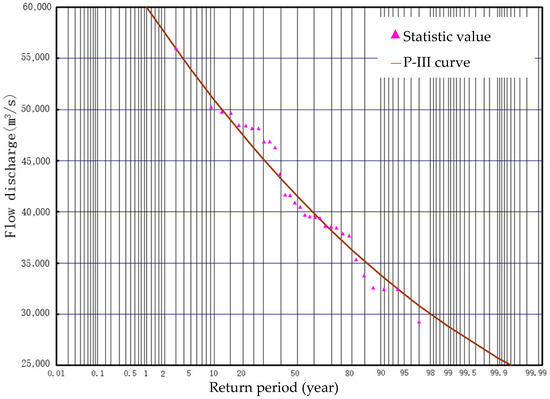
Figure 12.
Return period runoff at Kratie station.
This mechanism contrasts sharply with temperate estuaries (e.g., Columbia River Estuary), where runoff-induced current changes can reach 15–20% [46]. The key difference lies in the “high tidal energy” characteristic of tropical estuaries: the average tidal current velocity in the study area is 0.5–0.7 m/s, and the tidal mixing power reaches 10−2 W/m3, while the mixing power input by runoff is only 10−4 W/m3. The absolute advantage of tidal mixing makes the influence of runoff negligible, providing a key theoretical basis for flow field prediction in tropical outer estuaries. For offshore wind farm design, this finding simplifies scouring risk assessment by allowing focus on tidal current parameters rather than accounting for complex runoff effects [7].
6. Conclusions
By developing an FVCOM with wind forcing derived from validated WRF data, this study addresses a 32-year dataset that enables concurrent analysis of extreme water level and current events, which is critical for offshore wind farm foundation design (e.g., simultaneous consideration of inundation and scouring risks). This study also provides empirical evidence for the negligible influence of runoff on currents in tropical outer estuaries, advancing understanding of tropical estuarine dynamics. The high-precision, long-term hydrodynamic data and return period parameters achieved in this study directly support wind farm foundation design, elevation selection, and disaster risk assessment.
The research area is confirmed to be a mesotidal regime with a tidal range of 3.58 m. Based on Vietnam’s national elevation datum, the 100-year return period extreme high and low water levels are quantified as 2.15 m and −2.03 m, respectively. The maximum storm surge setup (2.09 m) occurs during the overlapping periods of typhoon events and monsoon transitions, which underscores the imperative of integrating extreme water level scenarios into the foundation elevation design of offshore engineering structures to ensure structural safety against inundation risks. The study area is dominated by SSE-NNW reciprocating tidal currents. Spatial heterogeneity in current velocity is significant, with the annual maximum current velocity ranging from 2.33 m/s to 2.86 m/s, which is primarily driven by topographic variations. The 100-year return period maximum current velocity reaches 4.58 m/s at Station A21 (180° direction), providing critical baseline data for anti-scouring design of offshore foundations. Furthermore, the influence of Mekong River runoff on the regional current dynamics is negligible, with a maximum velocity change of less than 5%. This finding confirms that tidal forcing is the predominant driver of hydrodynamic processes in the study area.
This study does not include wave–current interactions or sediment transport modules, which limits the assessment of combined wave–current scouring risks for offshore wind farm foundations. Future research could integrate sediment transport modules to quantify foundation scouring risks and wave–current interaction simulations (e.g., coupling FVCOM with SWAN model). Additionally, climate change scenarios will be incorporated to predict long-term hydrodynamic trends.
Author Contributions
Conceptualization, X.H. and B.W.; methodology, Y.L.; formal analysis, J.Y.; writing—original draft preparation, X.H., B.W. and Y.L.; writing—review and editing, X.H., J.Y. and Y.T. All authors have read and agreed to the published version of the manuscript.
Funding
This research work was financially supported by the National Natural Science Foundation of China (Grant No. 2023YFB4203200). Their financial support is gratefully acknowledged.
Data Availability Statement
The data presented in this study are available on request from the corresponding author due to legal reasons.
Conflicts of Interest
Authors Xuanjun Huang, Bin Wang and Yongqing Lai were employed by PowerChina Huadong Engineering Corporation Limited. Author Jiawei Yu was employed by the National Energy Power Grid Technology R&D Centre. Author Yujia Tang was employed by the State Key Laboratory of HVDC, Electric Power Research Institute, China Southern Power Grid. The authors declare that the research was conducted in the absence of any commercial or financial relationships that could be construed as a potential conflict of interest. The funders had no role in the design of the study; in the collection, analyses, or interpretation of data; in the writing of the manuscript; or in the decision to publish the results.
References
- Manwell, J.F. Offshore Wind Energy Offshore Wind Energy Technology Trends, Challenges, and Risks. In Encyclopedia of Sustainability Science and Technology; Springer: Berlin/Heidelberg, Germany, 2012. [Google Scholar]
- Abdelghany, G.A.; Soares, C.G. Global Trends and Challenges to Offshore Wind Energy in Vietnam. In Proceedings of the 3rd Vietnam Symposium on Advances in Offshore Engineering; Springer: Berlin/Heidelberg, Germany, 2025. [Google Scholar]
- Mai, V.K.; Nguyen, B.T.; Tran, V.L.; Vu, V.T.; Du, D.T.; Pham, T.H.T.; Hole, L.R. Evaluation of Wind Energy Potential over Offshore Areas in Vietnam. Vietnam J. Mar. Sci. Technol. 2025, 25, 269–284. [Google Scholar] [CrossRef]
- Vietnam Ministry of Industry and Trade. National Power Development Plan; Vietnam Ministry of Industry and Trade: Hanoi, Vietnam, 2021. [Google Scholar]
- Phan, H.M.; Ye, Q.; Reniers, A.J.H.M.; Stive, M.J.F. Tidal Wave Propagation along The Mekong Deltaic Coast. Estuar. Coast. Shelf Sci. 2019, 220, 73–98. [Google Scholar] [CrossRef]
- Vo, T.Q.; Reyns, J.; Kernkamp, H.; Roelvink, D.; Wegen, M.V.D. Numerical Modeling of Tidal Dynamics and Transport in the Multi-Channel Estuary of the Mekong River. In Proceedings of the American Geophysical Union, Ocean Sciences Meeting 2016, New Orleans, LA, USA, 21–26 February 2016. [Google Scholar]
- IEC 61400-3:2009; IEC Design Requirements for Offshore Wind Turbines. IEC: Geneva, Switzerland, 2009.
- DNVGL-ST-0437; DNV GL Design of Offshore Wind Turbine. DNV: Oslo, Norway, 2016.
- Jin, X.; Huang, H.; Xu, X.; Qin, Y.; Luo, M.; Wen, Y. Assessment of Offshore Wind and Wave Energy Resources for Combined Exploitation in the East China Sea. Energy 2025, 323, 135730. [Google Scholar] [CrossRef]
- Chang, K.T.; Jeng, D.S. Numerical Study for Wave-Induced Seabed Response around Offshore Wind Turbine Foundation in Donghai Offshore Wind Farm, Shanghai, China. Ocean Eng. 2014, 85, 32–43. [Google Scholar] [CrossRef]
- Li, T.; Zhao, Y.; Wang, L.; Zhang, H.; Xu, M.; Cao, J. Morphodynamic of Tidal Flat Profiles in an Erosion-to-Accretion Transitional Coastal Segment Under Wave–Current Interaction: A Case Study of Dafeng Port, China. J. Mar. Sci. Eng. 2025, 13, 1746. [Google Scholar] [CrossRef]
- Hai, L.T.; Le, H.T.; Chien, N.Q.; Tung, T.T.; Hai, L.T.; Le, H.T.; Chien, N.Q.; Tung, T.T.; Hai, L.T.; Le, H.T. Modelling Storm Surge Hazard to Mekong Delta. In Proceedings of the 10th International Conference on Asian and Pacific Coasts, Hanoi, Vietnam, 25–28 September 2019. [Google Scholar]
- Maruo, T.; Ohsawa, T. Wind Estimation Methods for Nearshore Wind Resource Assessment Using High-Resolution WRF and Coastal Onshore Measurements. Wind 2025, 5, 17. [Google Scholar] [CrossRef]
- Saito, Y. Sedimentary Facies of Distributary Channels of the Whole Mekong River Delta. In Proceedings of the American Geophysical Union, Ocean Sciences Meeting, New Orleans, LA, USA, 21–26 February 2016. [Google Scholar]
- Surhone, L.M.; Tennoe, M.T.; Henssonow, S.F.; Inphilippines, T.; Cyclones, L.O.T.; Agency, J.M. Typhoon Durian; Betascript Publishing: Beau Bassin, Mauritius, 2010. [Google Scholar]
- Chen, C.; Beardsley, R.C.; Cowles, G. An Unstructured Grid, Finite-Volume Coastal Ocean Model (FVCOM) System. Oceanography 2006, 19, 78–89. [Google Scholar] [CrossRef]
- Chisale, S.W.; Lee, H.S. Comprehensive onshore wind energy assessment in Malawi based on the WRF downscaling with ERA5 reanalysis data, optimal site selection, and energy production. Energy Convers. Manag. X 2024, 22, 100608. [Google Scholar] [CrossRef]
- Shafer, C.M.; Mercer, A.E.; Leslie, L.M.; Richman, M.B.; Doswell, C.A. Evaluation of WRF Model Simulations of Tornadic and Nontornadic Outbreaks Occurring in the Spring and Fall. Mon. Weather Rev. 2010, 138, 4098–4119. [Google Scholar] [CrossRef]
- Liu, J.; Hetland, R.; Yang, Z.; Wang, T.; Sun, N. Response of Salt Intrusion in a Tidal Estuary to Regional Climatic Forcing. Environ. Res. Lett. 2024, 19, 074019. [Google Scholar] [CrossRef]
- Zhou, M.; Liu, C.; Dai, G.; Huang, H.; Song, Q.; Li, M. A Real-Time Storm Surge Prediction System for the Guangdong–Hong Kong–Macao Greater Bay Area under the Background of Typhoons: Model Setup and Validation. Nat. Hazards 2025, 121, 3473–3498. [Google Scholar] [CrossRef]
- Zhang, Y.; Zhang, J.; Liu, T.; Feng, X.; Xie, T.; Liu, H. The Impact of Tides and Monsoons on Tritium Migration and Diffusion in Coastal Harbours: A Simulation Study in Lianyungang Haizhou Bay, China. Water 2024, 16, 615. [Google Scholar] [CrossRef]
- Silva, T.; Costa, A.; Vilela, O.C.; Willmersdorf, R.; dos Santos Júnior, J.V.; Alves, L.H.B.; Tyaqui, P.; De Lima, M.F.S.; De Souza, H.R.B.; Veleda, D. Application of the WRF Model for Operational Wind Power Forecasting in Northeast Brazil. Energies 2025, 18, 5731. [Google Scholar] [CrossRef]
- Rafieeinasab, A.; Fienen, M.N.; Omani, N.; Srivastava, I.; Dugger, A.L. Ensemble Methods for Parameter Estimation of WRF-Hydro. Water Resour. Res. 2025, 61, e2024WR038048. [Google Scholar] [CrossRef]
- Nguyen, C.T.; Tran, V.X.; Nguyen, N.H.; Dang, T.A. Recent Acceleration of Tidal Amplification in the Vietnamese Mekong Delta: Drivers and Environmental Change Implications. Ocean Sci. J. 2010, 60, 46. [Google Scholar] [CrossRef]
- Fujihara, Y.; Hoshikawa, K.; Fujii, H.; Kotera, A.; Nagano, T.; Yokoyama, S. Analysis and Attribution of Trends in Water Levels in the Vietnamese Mekong Delta. Hydrol. Process. 2016, 30, 835–845. [Google Scholar] [CrossRef]
- Takagi, H. Statistics on Typhoon Landfalls in Vietnam: Can Recent Increases in Economic Damage be Attributed to Storm Trends? Urban Clim. 2019, 30, 12. [Google Scholar] [CrossRef]
- Van, C.M.; Mei, X.; Mai, T.C. Mekong River Delta. In Delta Sustainability; Zhang, W., Vriend, H.D., Eds.; Springer Nature: Singapore, 2024; pp. 165–185. [Google Scholar]
- Lap Nguyen, V.; Ta, T.K.O.; Tateishi, M. Late Holocene Depositional Environments and Coastal Evolution of the Mekong River Delta, Southern Vietnam. J. Asian Earth Sci. 2000, 18, 427–439. [Google Scholar] [CrossRef]
- Phan, N.H.T. Hydropower in the Mekong River Basin. In The Mekong River Basin; Elsevier: Amsterdam, The Netherlands, 2024; pp. 183–210. [Google Scholar] [CrossRef]
- Onyejuruwa, A.; Hu, Z.; Anosike, C.; Islam, A.R.M.T.; Madhushanka, D. Assessment of WRF Model Simulations of Extreme Rainfall Events in West Africa: A Comprehensive Review. Environ. Monit. Assess. 2025, 197, 486. [Google Scholar] [CrossRef]
- Egbert, G.D.; Erofeeva, S.Y. Efficient Inverse Modeling of Barotropic Ocean Tides. J. Atmos. Ocean. Technol. 2002, 19, 183–204. [Google Scholar] [CrossRef]
- Thi Ha, D.; Ouillon, S.; Van Vinh, G. Water and Suspended Sediment Budgets in the Lower Mekong from High-Frequency Measurements (2009–2016). Water 2018, 10, 846. [Google Scholar] [CrossRef]
- Mekong River Commission. Mekong River Basin Annual Report 2019; Mekong River Commission: Phnom Penh, Cambodia, 2020. [Google Scholar]
- NASA. Super Typhoon Durian; Nasa Earth Observatory: Washington, DC, USA, 2006. [Google Scholar]
- Wang, A.; Chen, J.; Zeng, Z. Boundary Layer and Velocity Structure Associated with Jiulongjiang River Estuary. In Estuaries Coasts; Ocean Press: Beijing, China, 2006; pp. 225–231. Available online: https://www.tib.eu/de/suchen/id/BLCP:CN063774521/BOUNDARY-LAYER-AND-VELOCITY-STRUCTURE-ASSOCIATED (accessed on 1 March 2026).
- Skamarock, W.C.; Klemp, J.B.; Dudhia, J.; Gill, D.O.; Powers, J.G. A Description of the Advanced Research WRF Version 3; National Center for Atmospheric Research: Boulder, CO, USA, 2008. [Google Scholar]
- Schneider, D.P.; Deser, C.; Fasullo, J.; Trenberth, K.E. Climate Data Guide Spurs Discovery and Understanding. Eos Trans. Am. Geophys. Union 2013, 94, 121–122. [Google Scholar] [CrossRef]
- Chen, C.; Beardsley, R.C.; Cowles, G. An Unstructured Grid, Finite-Volume Community Ocean Model: FVCOM User Manual. 2011. Available online: https://github.com/MartinHu1997/fvcom/blob/master/Doc/FVCOM_User_Manual_v3.1.6.pdf (accessed on 1 March 2026).
- Shi, L.; Ortals, C.; Valle-Levinson, A.; Olabarrieta, M. Influence of River Discharge on Tidal and Subtidal Flows in a Microtidal Estuary: Implication on Velocity Asymmetries. Adv. Water Resour. 2023, 177, 17. [Google Scholar] [CrossRef]
- Saito, Y.; Nguyen, V.L.; Ta, T.K.O.; Tamura, T.; Kanai, Y.; Nakashima, R. Tide and River Influences on Distributary Channels of the Mekong River Delta. In Proceedings of the 2015 AGU Fall Meeting, San Francisco, CA, USA, 14–18 December 2015. [Google Scholar]
- Peng, H.; Fok, H.S.; Gong, J.; Wang, L. Improving Stage-Discharge Relation in The Mekong River Estuary by Remotely Sensed Long-Period Ocean Tides. Remote Sens. 2020, 12, 3648. [Google Scholar] [CrossRef]
- Pugh, D.; Pugh, D.T.; Pugh, D.; Pugh, D.S.; Pugh, D.S.; Pugh, D.; Pugh, T.D. Tides, Surges and Mean Sea Level; Wiley: Hoboken, NJ, USA, 1987. [Google Scholar]
- Thompson, P.R.; Merrifield, M.A.; Wells, J.R.; Chang, C.M. Wind-Driven Coastal Sea Level Variability in the Northeast Pacific. J. Clim. 2014, 27, 4733–4751. [Google Scholar] [CrossRef]
- Shen, F.; Li, L.; Fan, C.; Zhu, Y.; He, Z.; Adesina, R.B. Wave-Current Interaction on Turbulence Mixing and Sediment Resuspension in Muddy Tidal Flats. Estuar. Coast. Shelf Sci. 2025, 314, 109141. [Google Scholar] [CrossRef]
- Li, L.; Ni, J.; Chang, F.; Yue, Y.; Frolova, N.; Magritsky, D.; Borthwick, A.G.L.; Ciais, P.; Wang, Y.; Zheng, C.; et al. Global Trends in Water and Sediment Fluxes of the World’s Large Rivers. Sci. Bull. 2020, 65, 62–69. [Google Scholar] [CrossRef]
- Pan, H.; Lv, X.; Wang, Y.; Matte, P.; Jin, G. Exploration of Tidal-Fluvial Interaction in the Columbia River Estuary Using S_TIDE. J. Geophys. Res. Oceans 2018, 123, 6598–6619. [Google Scholar] [CrossRef]


Disclaimer/Publisher’s Note: The statements, opinions and data contained in all publications are solely those of the individual author(s) and contributor(s) and not of MDPI and/or the editor(s). MDPI and/or the editor(s) disclaim responsibility for any injury to people or property resulting from any ideas, methods, instructions or products referred to in the content. |
© 2026 by the authors. Licensee MDPI, Basel, Switzerland. This article is an open access article distributed under the terms and conditions of the Creative Commons Attribution (CC BY) license.