Abstract
The upper Xin’an River basin serves as a critical ecological barrier and water-conservation area for the Yangtze River Delta. However, with rapid economic development, nitrogen pollution in the surface waters of this region has become increasingly pronounced. This study analyzed river water samples collected on four occasions from the upper Xin’an River basin for ammonium (NH4+–N), nitrate-nitrogen (NO3−–N), total nitrogen (TN), and nitrate isotopic (δ15N–NO3− and δ18O–NO3−). The sources of nitrate (NO3−) were apportioned using the MixSIAR stable-isotope mixing model, and the spatial distribution of these sources across the basin was characterized. Across the four sampling rounds, the mean TN concentration exceeded 1.3 mg/L, with NO3−–N accounting for over 45% of TN, indicating that nitrate was the dominant inorganic nitrogen species. The δ15N–NO3− values ranged from 2.17‰ to 13.0‰, with mean values following the order summer > winter > autumn > spring. The δ18O–NO3− values varied from −5.20‰ to −3.48‰, and the average value showed a completely opposite seasonal variation pattern to that of δ15N–NO3−. Process-based analysis of nitrogen transformations revealed that nitrification predominates during nitrate transport and transformation, whereas denitrification is comparatively weak. MixSIAR-based estimates indicate marked seasonal differences in the source composition of nitrate pollution in the upper Xin’an River basin; NO3− derives primarily from soil nitrogen (SN) and livestock/sewage manure nitrogen (LSN). LSN was the dominant contributor in spring and summer (49.2% and 59.9%, respectively). SN dominated in autumn (49.2%) and winter (54.1%). Fertilizer nitrogen (FN) contributed more during summer and autumn, when fertilization is concentrated and rainfall is higher. Atmospheric deposition (AN) contributed approximately 1% across all seasons and was thus considered negligible. These findings provide a scientific basis for source control of nitrogen pollution and water-quality management in the upper Xin’an River.
1. Introduction
Surface water is essential for human survival and underpins both societal activities and ecosystem functioning [1]. Rivers and lakes, which are major sources of surface freshwater, serve as the lifelines of human society and central nodes within the natural hydrologic cycle [2]. As industrialization, urbanization, and intensive agriculture expand, industrial effluents, domestic wastewater, livestock manure, and excessive fertilizer application continuously load nitrate into these waters, driving sustained increases in nitrate concentrations in surface waters worldwide [3,4]. Across China, nitrate concentrations in surface waters remain elevated, and the dominant pollution sources vary markedly among regions [5]. Therefore, accurately apportioning nitrogen pollution sources and elucidating nitrate transport and transformation mechanisms in aquatic environments are prerequisites for tailoring region-specific remediation strategies and safeguarding aquatic ecosystem health and the sustainable use of water resources [6,7].
Surface-water ecosystems (e.g., rivers and lakes) receive NO3−–N inputs from diverse anthropogenic and natural sources, including atmospheric deposition, soil nitrogen, fertilizer nitrogen, and municipal wastewater and fecal waste [8]. Accurate source apportionment of NO3−–N is critical to implementing targeted water-quality remediation strategies [9]. Traditional source-identification approaches rely on hydrochemical tracers (e.g., the Cl−/Na+ ratio) combined with land-use regression models but are constrained by substantial parameter uncertainties; consequently, they struggle to quantify the fractional contributions of different nitrate sources in natural waters accurately and cannot capture the full suite of nitrate transport and transformation processes [8,10]. Because nitrate from different sources exhibits distinct nitrogen and oxygen-isotope signatures, integrating these signatures with mixing models enables quantitative apportionment of nitrate sources in surface waters [11,12]. Distinct nitrate isotopic compositions (δ15N–NO3− and δ18O–NO3−) serve as intrinsic tracers for discriminating between anthropogenic and natural nitrate sources [13,14]. Furthermore, biogeochemical transformations within the nitrogen cycle—including mineralization, assimilation, ammonification, nitrification, and denitrification—produce characteristic isotopic fractionation; denitrification enriches δ15N in the residual nitrate, often by approximately 20‰ or more [15,16]. Consequently, measuring the stable-isotope composition of aqueous nitrate (δ15N–NO3− and δ18O–NO3−) enables more accurate identification of sources (e.g., fecal/sewage effluent, agricultural fertilizer, soil nitrogen, atmospheric deposition) and key transformation processes, most notably denitrification [17,18]. For quantitative nitrate source apportionment, isotopic mixing frameworks include simple mass-balance models and Bayesian approaches such as SIAR (Stable Isotope Analysis in R), MixSIAR (Mixing Model Analysis using Stable Isotopes in R), and simmr (Stable Isotope Mixing Model in R) [19].
In recent years, the dual nitrate isotopic techniques (δ15N–NO3− and δ18O–NO3−), combined with the MixSIAR model, have been widely applied to source tracing of nitrate in surface waters and to quantifying source contributions [20]. MixSIAR is a Bayesian hierarchical mixing framework that integrates MixSIR’s treatment of source uncertainty with SIAR’s continuous mixing-space analysis and extends the model to include covariate effects [21]. Its key advantages include accommodating fixed and random effects as covariates to explain variation in mixture proportions and allowing the inclusion of fractionation factors, thereby reducing uncertainty associated with isotopic fractionation [22,23]. In the Nanjing river–network transition zone of the Yangtze River Delta, Chen et al. combined hydrochemical analyses with dual nitrate isotopes and the MixSIAR model; the tracing results indicate that livestock/sewage manure nitrogen (42.6 ± 4.1%) and fertilizers nitrogen (28.3 ± 3.5%) are the primary sources of groundwater NO3− [24]. In a karst–agriculture transition basin in northern Yantai, Yang et al. found that surface-water NO3− concentrations were significantly higher in the wet season than in the dry season and were closely linked to tea-/orchard-expansion intensity and seasonal precipitation–runoff patterns. MixSIAR source-apportionment results further identified the dominant sources of surface-water NO3−: livestock/sewage manure nitrogen as the primary contributor (51.1%), followed by soil nitrogen (23.9%) [25].
The upper Xin’an River basin serves as a critical ecological barrier and water-conservation area in the Yangtze River Delta and provides essential water supplies for industry, agriculture, and domestic use [26]. In recent years, concentrations of TN and NO3−–N have exhibited a pronounced spatial gradient—low in headwaters, high in human-impacted reaches, and lower again in reservoir zones; during storm events, instantaneous NO3−–N peaks account for 78% of storm-runoff total nitrogen, with marked variation across seasons and land-use types [27]. The basin is dominated by agricultural production, with relatively sparse industrial development, and agricultural land is concentrated along the Lian River in She County and the middle and lower reaches of the Xin’an River [28]. Residual chemical fertilizers and pesticides from croplands, livestock and poultry manure, crop residues, and inputs from aquaculture accumulate in soils and are transported by runoff during rainfall events, delivering substantial nitrogen and phosphorus loads to surface waters. Moreover, rural domestic wastewater collection and treatment infrastructure is inadequate in the riparian valley areas, and a portion of wastewater and solid waste is discharged directly into the river, jointly constituting the main sources of nitrogen and phosphorus pollution in the basin [28,29]. Isotopic analyses further reveal that as agricultural and urban land use expands, the nitrogen isotope composition (δ15N) exhibits an increasing trend [30]. High population density amplifies the additive impacts of municipal wastewater, fecal discharges, and wastewater treatment plant (WWTP) overflows on receiving waters, producing complex, spatiotemporally dynamic nitrate sources in the upper Xin’an River basin. However, the quantitative contributions of agricultural non-point sources, domestic wastewater, and fecal discharges—as well as their transport and transformation pathways—remain poorly constrained, highlighting the need for multidimensional source-tracing approaches to elucidate the drivers of nitrogen-cycle imbalance. Therefore, this paper takes the upper reaches of Xin’an River Basin as the research object and conducts a quantitative analysis of the sources of nitrate based on water quality monitoring data and the MixSIAR model. The main research objectives include: (1) Identifying the main components and seasonal differences in total nitrogen in the study area; (2) clarifying the main sources of nitrate nitrogen pollution based on the monitoring values of nitrogen and oxygen isotopes; (3) quantitatively analyzing the main pollution sources of nitrate at different sections in different seasons to provide a scientific basis for precise control of nitrogen pollution in the study area.
2. Materials and Methods
2.1. Study Site
The upper Xin’an River basin (29°49′–30°15′ N, 117°39′–118°26′ E) is located within Huangshan and Xuancheng cities in Anhui Province, with a drainage area of 5760 km2 and a main-stem length of approximately 242 km, and includes multiple tributaries [31]. The basin extends across Qimen, Yixian, Xiuning, and Tunxi District and also serves as a strategic backup water source for Qiandao Lake, the designated strategic water supply for the Yangtze River Delta [26,32]. The basin is characterized by a subtropical monsoon climate, with a mean annual temperature of 17 °C [33]. The mean annual precipitation is approximately 1700 mm, with a high proportion of rainfall occurring in summer; precipitation from June to September accounts for about 42% of the annual total [34]. According to the 2023 Huangshan Statistical Yearbook, the urban population is approximately 0.577 million, whereas the rural population is approximately 0.897 million. The total amount of chemical fertilizers applied in the basin reaches 31.14 × 10⁴ t, of which nitrogen fertilizer accounts for approximately 65% [29,31,35]. The basin is a typical mountainous and hilly region in southern Anhui with complex geomorphology, and its drainage network consists of perennial rivers that exhibit distinct wet and dry seasons but do not cease to flow throughout the year [36,37]. Land cover is dominated by dense forest, with a forest coverage rate of 77.4%, mainly distributed in the middle- and high-elevation zones [31]. Arable land is mainly embedded within the valley plains surrounding towns and is managed under a rice–rapeseed rotation system: rice is generally transplanted in May–June and harvested in September–October, whereas rapeseed is sown in October–November and harvested in April–May of the following year. The timing of agricultural production activities thus strongly overlaps with the rainy season in the basin, thereby increasing the risk of agricultural non-point source pollution export [29,38,39]. Tea plantations, as the second most important ecosystem after forests, are widely distributed in the hilly and mountainous areas, and their spatial distribution is strongly correlated with nitrogen and phosphorus loads [40]. At the same time, this land-use pattern results in a landscape characterized by high overall vegetation cover and marginally distributed cropland, which significantly influences the pathways of diffuse nitrogen transport within the basin [26,34]. The bedrock lithology is dominated by acidic rocks such as granite, sandstone, and shale; granite is widely distributed in the middle- to low-altitude areas of northern Xiuning–She County, whereas sandstone and shale are mainly exposed in the southern parts of Qimen–Yixian. These rock formations are strongly weathered, producing sandy-textured soils with low nutrient-retention capacity, particularly in tea-plantation areas with steep slopes and sparse vegetation cover, where nitrogen and phosphorus losses are more readily triggered by hydraulic erosion [41]. River channels in the basin are generally wide and shallow, with steep longitudinal slopes, and the hydraulic regime is characterized by high velocities and strong scouring [26]. The Jiekou section functions as the principal conduit delivering sediment and runoff to the Xin’an Reservoir, draining > 60% of the basin area; its hydro logic dynamics exert a decisive influence on nitrogen loads to Qiandao Lake [42].
2.2. Sample Collection and Method
In 2023, a field investigation and water sampling campaign was conducted in the upper Xin’an River basin. Water samples were collected at 11 cross sections in February (winter), April (spring), June (summer), and October (autumn), and the spatial distribution of the sampling sites is shown in Figure 1. The samples were primarily collected for the determination of NO3−–N, NH4+–N, TN, δ15N–NO3− and δ18O–NO3−. During each sampling campaign, the geographic coordinates of the sampling sites were recorded in situ using a handheld GPS device. Before sampling, new 500 mL polyvinyl chloride (PVC) bottles were rinsed three times with river water. Water samples were then collected from 0.5 m below the water surface at each monitoring site using a water sampler. Two independent samples (primary and replicate) were collected simultaneously at each site following the same procedure, combined in the field, and transferred into new 500 mL polyethylene (PE) bottles that had been pre-rinsed with river water. The bottles were filled completely, sealed with Parafilm, and transported to the laboratory in cooled containers. In the laboratory, the water samples were pretreated by first filtering the mixed samples through GF/F glass microfiber filters (diameter: 47 mm), followed by filtration through 0.22 μm polyethersulfone (PES) syringe filters. The filtered river water was then aliquoted according to the analytical requirements of different parameters and stored at −20 °C for subsequent analyses.
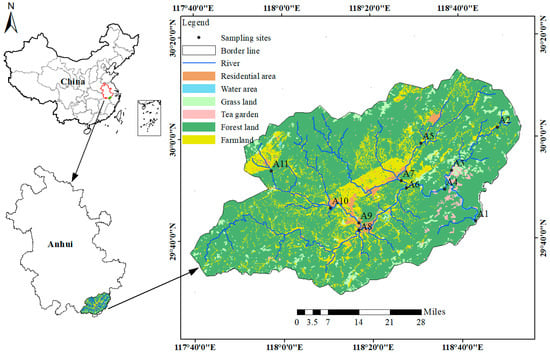
Figure 1.
Regional distribution with schematic of sampling sites.
TN were determined by alkaline potassium persulfate digestion coupled with UV spectrophotometry, following the Chinese standard method HJ636-2012 “Water quality—Determination of total nitrogen—Alkaline potassium persulfate digestion UV spectrophotometric method”; the analytical range was 0.05–4.0 mg/L, with a relative error of 1.5% ± 3.2% [8,9,25]. NH4+–N were determined using the Nessler’s reagent spectrophotometric method (HJ535-2009 “Water quality—Determination of ammonia nitrogen—Nessler’s reagent spectrophotometric method”), with an analytical range of 0.025–2.0 mg/L and an error range of ±2%. NO3−–N were determined by the phenol disulfonic acid spectrophotometric method in accordance with HJ/T 346-2007 “Water quality—Determination of nitrate nitrogen—Phenol disulfonic acid spectrophotometric method”; the analytical range was 0.02–2.0 mg/L, and the relative error was 5%.
For the isotope analyses, the nitrogen and oxygen isotopic composition of NO3− was pretreated using the bacterial denitrification method, in which all NO3− in solution is quantitatively converted to N2O [43]. The pretreated samples were sent to the Institute of Earth Environment, Chinese Academy of Sciences, where N2O gas was extracted and purified and the δ15N–NO3− and δ18O–NO3− values were determined by isotope ratio mass spectrometry (IRMS; Delta V Advantage coupled with Precon and GasBench, Thermo Fisher Scientific). Isotope ratios are expressed in δ notation as follows:
In this equation, Rsample and Rstandard denote the 15N/14N or 18O/16O ratios of the sample and the standard, respectively. δ15N–NO3− values are referenced to atmospheric N2, whereas δ18O–NO3− values are referenced to Vienna Standard Mean Ocean Water (VSMOW). Measurements were calibrated against international reference materials; analytical precision for δ15N–NO3− and δ18O–NO3−, assessed using USGS32 and USGS34, was ±0.3‰ [44].
2.3. MixSIAR Model
The MixSIAR model (version 3.1) is a commonly applied tool for source apportionment in environmental studies [22,45] and has been successfully used to quantify the contributions of NO3− derived from atmospheric deposition, soil nitrogen, fertilizers, and livestock/sewage manure. Among these sources, soil nitrogen is primarily associated with nitrogen derived from the decomposition of organic matter, microbial metabolic products, humic-bound nitrogen, organic nitrogen in fertilizers, and nitrogen inputs within forest ecosystems [46,47,48,49]. The isotopic end-member values of δ15N–NO3− and δ18O–NO3− for the four nitrate sources were adopted from published data for the downstream Qiandao Lake reservoir in the Xin’an River basin [8,11,50,51,52,53,54], and are summarized in Table 1.

Table 1.
Isotopic characteristics (δ15N and δ18O, ‰) of different nitrate sources.
Relative contributions of potential NO3− sources to riverine nitrate in the study area were estimated using the MixSIAR Bayesian mixing model implemented in R (R language software version 4.2.2) [43].
The model is expressed as:
In this equation, xij denotes the observed value of isotope j in mixture I (with i = 1, 2, 3, ……, n; j = 1, 2, 3, ……, j); pk represents the proportion contributed by source k to the mixture. Sjk denotes the isotope-j signature of source k, with mean μjk and standard deviation ωjk. Cjk is the fractionation factor for isotope j in source k, assumed normally distributed with mean λjk and variance λjk. εjk denotes the residual error for mixture i and isotope j (mean 0, standard deviation σj).
3. Results
3.1. Seasonal Variation in Nitrate Concentrations
The means and standard deviations of TN, NO3−–N and NH4+–N concentrations at the 11 monitoring sites in different seasons are shown in Figure 2. Significant seasonal differences (p < 0.05) were observed in surface water concentrations of TN, NO3−–N and NH4+–N. Across the basin, TN concentrations ranged from 0.72 to 4.08 mg/L (mean ± SD = 2.30 ± 0.48 mg/L) and exhibited the pattern spring > winter > summer > autumn. NH4+–N concentrations varied within a relatively narrow range of 0.01–0.85 mg/L (mean ± SD = 0.25 ± 0.16 mg/L). Concentrations were relatively higher and more variable in spring, whereas lower concentrations with smaller ranges were observed in summer, autumn and winter, overall following the pattern spring > winter > summer > autumn. NO3−–N concentrations ranged from 0.20 to 3.30 mg/L (mean ± SD = 1.50 ± 0.42 mg/L). NO3−–N showed limited variability in spring, summer and autumn, but a much wider concentration range in winter, and the mean concentrations followed the order winter > spring > summer > autumn. Seasonally, NH4+–N consistently accounted for only a small fraction of TN, ranging from 6.4% to 14.3%. In contrast, the proportion of NO3−–N in TN was highest in summer, reaching 76.1%, and lowest in spring at 48.9%, while the proportions in the other seasons all exceeded 72%, indicating that NO3−–N was the dominant inorganic nitrogen species throughout the year. Overall, riverine TN in the upper Xin’an River basin was therefore dominated by NO3−–N. Although total nitrogen is not explicitly considered in routine surface water quality assessments, TN levels in the upstream reaches directly affect water quality in the downstream Qiandao Lake reservoir. Therefore, the sources of nitrate need to be resolved to effectively control TN inputs to the reservoir.
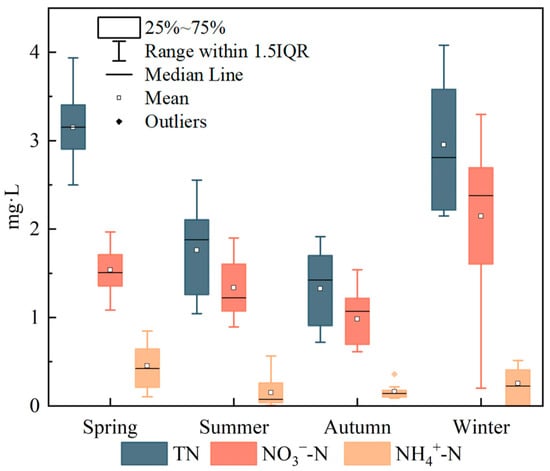
Figure 2.
Seasonal distribution characteristics of average concentrations of TN, NO3−–N, and NH4+–N.
3.2. Seasonal Variability in Nitrate Isotope Signatures in the Upper Xin’an River Basin
To further elucidate the sources of nitrate nitrogen, seasonal variations in δ15N–NO3− and δ18O–NO3− in the upper Xin’an River basin were analyzed, and the results are presented in Figure 3. The δ15N–NO3− values ranged from 1.60‰ to 13.0‰, with mean values of 6.80‰, 7.98‰, 7.07‰ and 5.87‰ in spring, summer, autumn and winter, respectively. Among the four seasons, the largest range occurred in summer (1.60‰–11.68‰), but the seasonal differences in δ15N–NO3− were not statistically significant (p > 0.05). The δ18O–NO3− values ranged from −5.20‰ to −3.48‰. The mean δ18O–NO3− values in spring, summer, autumn and winter were −4.72‰, −3.65‰, −4.71‰ and −4.25‰, respectively, and the seasonal differences were statistically significant (p < 0.05). In summer, δ18O–NO3− exhibited the smallest range (−4.10‰ to −3.48‰), and the mean δ18O–NO3− value was higher than in the other seasons. The ranges of δ18O–NO3− in autumn and spring were relatively similar, with overall values between −5.20‰ and −4.44‰. In winter, δ18O–NO3− showed the largest seasonal range, from −4.76‰ to −3.94‰.
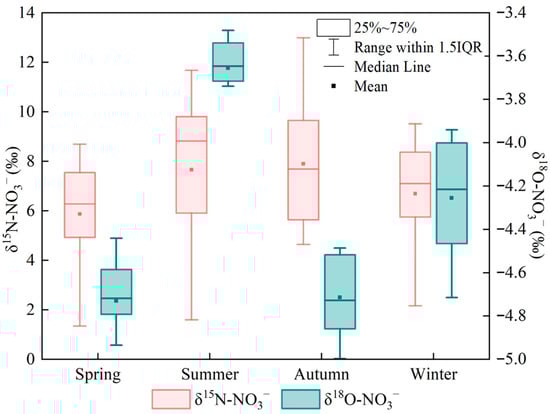
Figure 3.
Distribution characteristics of δ15N–NO3− and δ18O–NO3− values in different seasons.
3.3. Nitrate Source Apportionment
The isotopic pairs δ15N–NO3− and δ18O–NO3− serve as intrinsic tracers to differentiate potential nitrate sources in aquatic systems because source-specific isotopic signatures often diverge [4]. Typical δ15N–NO3− values for nitrate from atmospheric deposition, fertilizers nitrogen, soil nitrogen, and livestock/sewage manure nitrogen are reported as −5–+15‰, −10–+5‰, 0–+8‰, and +6–+25‰, respectively [11,12,55,56]. However, δ15N alone often lacks discriminatory power because source ranges can overlap and biogeochemical fractionation can alter initial signatures [11,12]. Incorporating nitrate δ18O helps resolve these sources [9]. δ18O–NO3− in precipitation is influenced by complex atmospheric processes and can vary widely, typically from +25‰ to +75‰ [11,12]. Under the influence of nitrification, δ18O–NO3− values from fertilizer, soil nitrogen, and livestock/sewage manure typically range from −15‰ to +15‰ [9]. Combining δ15N–NO3− with δ18O–NO3− enables finer discrimination among nitrate sources. Figure 4a shows that δ15N–NO3− and δ18O–NO3− values in the upper Xin’an River basin plot primarily within the overlap among fertilizers, soil nitrogen, and livestock/sewage manure. A seasonal, enlarged view of the δ15N–NO3− versus δ18O–NO3− dual-isotope plot in Figure 4a is shown in Figure 4a,b, and the distribution of sampling sites for each season is illustrated. In spring, aside from site A4 in the SN–FN overlap, most sites plot within the LSN domain or the LSN–SN overlap. In summer, aside from sites A4 and A11 in the SN–LSN overlap, most sites plot within the LSN polygon. In autumn, except for site A11 within the SN–FN overlap, most sites lie within either the SN or the LSN domains. In winter, apart from sites A4 and A10 within the FN–SN overlap, the remaining sites cluster primarily within the LSN polygon or within the SN–LSN overlap.
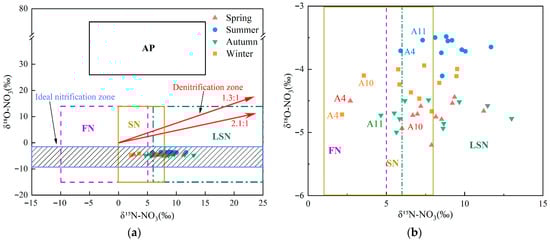
Figure 4.
(a) Scatterplot of δ15N–NO3− and δ18O–NO3− values in the Xin’an River. (b) An enlarged section of (a), highlighting the detailed isotopic sources (δ15N and δ18O) across different seasons. (AP: atmospheric deposition; FN: fertilizers nitrogen; SN: soil nitrogen; LSN: livestock/sewage manure nitrogen).
3.4. Nitrate Transport and Transformation Processes
NO3− pollution in the upper Xin’an River basin primarily originates from soil nitrogen, fertilizers, and livestock/sewage manure. Prior to entering receiving surface waters, nitrogen species (including nitrate and its precursors) undergo a suite of biogeochemical processes, including nitrification, denitrification, diffusion, mineralization, assimilation, and nitrogen fixation [57,58]. Nitrification is the microbially mediated oxidation of NH4+ to NO2− and then NO3−, a common pathway in the nitrogen cycle and an important mechanism replenishing NO3−–N in natural waters [52,59]. Studies indicate that approximately one-third of the oxygen atoms in newly formed NO3− derive from atmospheric O2, whereas two-thirds originate from H2O [11,12]. The δ18O of atmospheric O2 (AIR reference) is +23.5‰. Accounting for sampling time and rainfall, δ18O-H2O in the upper Xin’an River basin ranged from −9.5‰ to +1.5‰ based on isotope monitoring. As shown in Figure 4a, δ18O–NO3− values at all monitoring sites in all seasons fall within the theoretical nitrification range, indicating that nitrification of NO3−–N is occurring within the basin. Moreover, previous studies have shown that when nitrification proceeds to completion, isotopic fractionation effects can be neglected [60]. However, other concurrent transport and transformation processes acting on NO3−–N in the aquatic environment, such as assimilation and denitrification, can induce isotopic fractionation of NO3−–N and result in elevated δ18O–NO3− values in some samples [61].
Addition, isotope fractionation induced by microbial denitrification is generally more pronounced. When denitrification occurs, both δ15N–NO3− and δ18O–NO3− become enriched, and the relative enrichment slope (δ15N: δ18O) typically between 1.3 and 2.1 [62]. During denitrification, both δ15N–NO3− and δ18O–NO3− become enriched; the relative enrichment slope (δ15N: δ18O) typically ranges from 1.3 to 2.1 [62]. As shown in Figure 4a, most samples from the upper Xin’an River plotted outside the 1.3–2.1 δ15N–NO3−/δ18O–NO3− slope domain. However, subsets of sites fell within the denitrification slope in spring (A1, A2, A3, A5, A8), autumn (A4, A5, A8, A10), and winter (A1, A2, A3, A8, A9). By contrast, summer ratios were generally outside this range, suggesting limited or absent denitrification in summer and varying degrees of denitrification in spring, autumn, and winter.
As shown in Figure 5a,b, δ15N–NO3− and δ18O–NO3− were positively and linearly correlated with ln(NO3−–N) in spring, and both isotope values decreased as concentration declined, indicating no pronounced denitrification [63]. In summer and autumn, δ15N–NO3− showed a significant negative correlation with ln(NO3−–N), whereas δ18O–NO3− exhibited a positive linear correlation; the opposing fractionation trends of δ15N and δ18O argue against denitrification as the dominant process. In winter, δ15N–NO3− was weakly positively correlated with ln(NO3−–N) (with slight δ15N depletion as concentration decreased), suggesting incomplete fractionation during denitrification. By contrast, δ18O–NO3− was weakly negatively correlated with ln(NO3−–N) (lower NO3−–N accompanied by higher δ18O), consistent with isotopic enrichment expected from denitrification. Given that denitrification was weakly expressed only in winter and isotopic fractionation was not significant, the isotopic fractionation factor (ε) in MixSIAR was set to 0, indicating that nitrogen transport was modeled as fractionation-free (i.e., conservative).
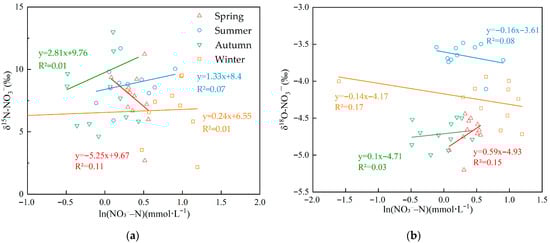
Figure 5.
(a) Linear relationship between δ15N–NO3− and ln(NO3−–N) across seasons (b) Linear relationship between δ18O–NO3− and ln(NO3−–N) across seasons.
3.5. Quantifying Nitrate Source Contributions with the MixSIAR Model
Combining nitrate nitrogen–oxygen isotope data with the MixSIAR model enables quantitative apportionment of source contributions to nitrate pollution in surface waters. Based on MixSIAR outputs (Figure 6), the seasonal contributions of the four nitrate sources in the upper Xin’an River basin differed overall.
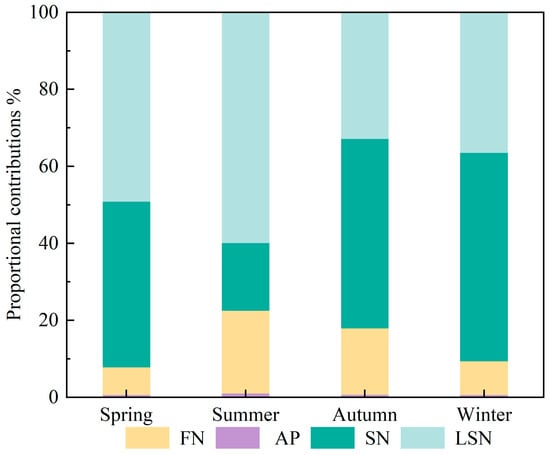
Figure 6.
Contribution rates of NO3− sources in different seasons. (AP: atmospheric deposition; FN: fertilizers nitrogen; SN: soil nitrogen; LSN: livestock/sewage manure nitrogen).
The contribution of AN was less than 1% in all seasons and had a negligible effect on the nitrate load. The contribution of LSN was higher in summer and spring, at 59.9% and 49.2%, respectively, whereas its contributions in winter (36.5%) and autumn (32.9%) were relatively lower. Summer and spring generally correspond to peak periods of livestock and poultry breeding and transhumance, during which sewage and manure discharges increase substantially and are readily transported into the river network by rainfall–runoff [27,64]. At the same time, high temperatures enhance microbial activity, accelerating the transformation of organic nitrogen and the production and transport of nitrate [58,60,65]. In addition, human activities such as tourism and agricultural irrigation further increase wastewater volumes, thereby enhancing inputs from LSN sources. The contribution of soil nitrogen (SN) showed a clear seasonal pattern, following the order winter (54.1%) > autumn (49.2%) > spring (43.0%) > summer (17.6%). After crop harvest in autumn, intensified soil erosion and enhanced mineralization of organic nitrogen lead to a marked increase in the contribution from SN [58,60,65,66]. In winter, soil freezing and reduced microbial activity slow the release of residual nitrogen from soils, so that SN remains the dominant nitrate source [66]. During the summer flood season, rainfall–runoff exerts a dilution effect on nitrate, resulting in a substantial decrease in the contribution of SN [27,64]. The contribution of FN was relatively low in all seasons, with higher contributions in summer and autumn (21.5% and 17.3%, respectively) and lower contributions in winter and spring (8.8% and 7.2%, respectively). The relatively high FN contributions in summer and autumn are closely related to the seasonal application of nitrogen fertilizers in agricultural activities within the basin. In particular, during the summer flood season, precipitation-driven runoff intensifies the mobilization and transformation of FN-derived nitrate [7,27,34,64].
In summary, the structure of nitrate pollution sources in the upper Xin’an River basin exhibits pronounced seasonal differences: LSN is the dominant contributor in spring and summer, SN predominates in autumn and winter, while FN contributes more in summer and autumn with concentrated fertilization and more precipitation.
Based on the MixSIAR model, the contributions of different nitrate pollution sources at all monitoring sites during the four sampling seasons were quantitatively apportioned. As shown in Figure 7, the contribution of AN was consistently very low at all monitoring sites in all seasons, indicating that AN made only a limited contribution to nitrate in the surface waters and could be considered negligible.
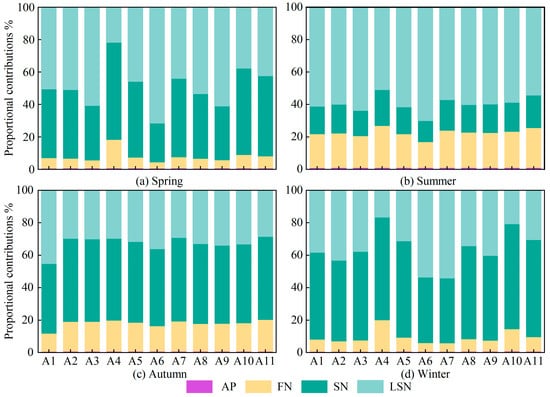
Figure 7.
Seasonal source contributions of NO3− across all sites. (AP: atmospheric deposition; FN: fertilizers nitrogen; SN: soil nitrogen; LSN: livestock/sewage manure nitrogen).
In spring, LSN contributions ranged from 21.8% to 71.7%, with marked differences among monitoring sites. At sites A3 (60.8%), A6 (71.7%) and A9 (61.2%), contributions were particularly high, as these sites are located near livestock farms or residential areas and are therefore strongly influenced by domestic wastewater and livestock and poultry effluent. In contrast, at site A4 (21.8%), where surrounding forest land and natural vegetation enhance the retention and transformation of pollutants, the LSN contribution was the lowest observed throughout the year. In summer, LSN contributions increased at most sites, ranging from 51.1% to 70.2% and showing a relatively uniform spatial distribution. At site A6 (70.2%), the contribution was especially high, likely due to the combined effects of elevated temperatures promoting organic matter decomposition, agricultural irrigation and rainfall–runoff, which together enhance nitrogen inputs and thereby intensify non-point source pollution in the basin [7,27,54,64]. Following the flushing and dilution associated with the summer flood season, LSN contributions generally declined in autumn, ranging from 29.4% to 45.4% with only minor variability among sites. However, contributions at sites A1 (45.4%) and A6 (36.2%) remained relatively high because these sites, located in the middle and lower reaches of the basin, continue to receive pollutant loads transported from upstream [55,61]. In winter, LSN contributions ranged from 16.7% to 54.3%, with high values at sites A6 (53.7%), A7 (54.3%) and A9 (40.4%). During the winter low-flow period, the dilution capacity of runoff is minimal, whereas point-source discharges from urban domestic and industrial activities remain relatively stable, leading to a pronounced increase in the relative contribution of LSN [7,27,54].
The contribution of SN to nitrate in winter and spring exhibited a wide range of variation, with values ranging from 24% to 60% and from 40% to 64.8%, respectively. In winter, contributions at sites A4 (63.4%), A10 (64.8%) and A11 (59.9%) were markedly higher than those at the other sites, and in spring the contributions at these sites were also elevated, reaching 60.0%, 53.3% and 49.5%, respectively. As shown in Figure 1, sites A4, A10 and A11 are located in areas with intensive agriculture or adjacent to high-density cropland, where soil nitrogen stocks are high. In winter and spring, vegetation cover is low and, under irrigation, nitrate in the soil is readily leached, which leads to a pronounced increase in the contribution from SN [31,49,53,64]. In summer, SN contributions ranged from 15.9% to 22.2%, remaining at a generally low level with only minor spatial differences among monitoring sites. During summer, higher air temperatures and vigorous crop growth enhance plant uptake of nitrogen, substantially reducing the pool of leachable nitrogen in the soil [49,55]. At the same time, increased runoff during the summer flood season accelerates water renewal and dilution, further lowering nitrate concentrations in the water column and resulting in substantially lower SN contributions in summer than in the other seasons [7,27,64]. In autumn, with the exception of site A1 (42.9%), contributions at the other sites were mostly around 50%, with little spatial variability among sites. These temperature conditions during this period remain favorable for soil mineralization, while reduced denitrification enhances the accumulation of nitrate to some extent [16,52,60].
The contribution of FN to nitrate in spring and winter exhibited a wide range of variations, with values ranging from 3.8% to 17.6% and from 5.2% to 19.4%, respectively. In spring, contributions at site A4 (17.6%) were relatively high, whereas in winter contributions at sites A4 (19.4%) and A10 (13.7%) were markedly higher than those at the other monitoring sites. In winter, lower air temperatures and reduced microbial activity, together with decreased fertilizer application, mean that residual nitrogen in agricultural soils is released only slowly and transported under rainfall-driven leaching, so that nitrogen inputs remain at a substantial level during this period [7,16,55,67]. In summer, FN contributions at all monitoring sites were substantially higher than in the other seasons and showed limited spatial variability, with values ranging from 19.5% to 25.8%. This pattern reflects the strong influence of nitrogen fertilizer inputs in this season, when abundant rainfall and concentrated fertilizer application lead to a more homogeneous spatial distribution of FN contributions [7,34,55]. In autumn, FN contributions to nitrate showed relatively small variability, ranging from 11.2% to 24.5%, with higher contributions at sites A10 (22.2%) and A11 (24.5%). After crop harvest in autumn, reduced soil cover and agricultural practices such as fertilizer application and irrigation management accelerate nitrogen leaching, while diminished runoff reduces the dilution and transport of other pollution sources, together leading to a relative increase in the contribution of FN [7,27,64].
In summary, analysis of the site-specific patterns across seasons revealed that the contributions of LSN, SN and FN to nitrate in the basin exhibit pronounced spatiotemporal heterogeneity. This heterogeneous distribution reflects the combined effects of multiple factors, including fluctuations in environmental temperature, changes in land-use characteristics, the evolution of hydrological processes and the intensity of human activities. The contributions of LSN, SN and FN display distinct seasonal distribution patterns. In summer and autumn, the contributions of LSN, SN and FN are relatively uniform among monitoring sites, whereas in spring and winter they vary much more widely between sites. Specifically, LSN contributions at sites A3, A6 and A9, where residential and livestock-breeding activities are particularly intensive, are clearly higher than at the other monitoring sites. For SN, contributions at sites A4, A10 and A11 are markedly higher than elsewhere because these sites are located in areas with concentrated agricultural activity. For FN, the highest contribution is observed at site A4, which lies in a zone of particularly intensive agricultural activity.
4. Discussion
4.1. Uncertainties and Limitations
This study found that the source apportionment results and hydrochemical analyses corroborated each other, indicating that the MixSIAR model is highly applicable in the study area. However, the model outputs are subject to certain uncertainties and limitations, which mainly arise from three aspects. First, the key isotopic characteristic values used in the model were primarily derived from published literature rather than from local measurements. Second, only single-day samples were collected in each season, which may not fully capture the pronounced spatiotemporal variability inherent in nitrate isotopes. Thirdly, the focus was on establishing isotope methods, neglecting the systematic monitoring and collection of other ion data. The isotopic composition of nitrate itself exhibits substantial spatiotemporal heterogeneity, and the δ15N–NO3− and δ18O–NO3− values associated with different pollution sources (e.g., livestock/sewage manure nitrogen) typically display large standard deviations. These factors jointly increase the variance of the prior distributions specified in the model and are ultimately manifested in the posterior distributions.
In summary, future research should include more comprehensive analysis of hydrochemical indicators, increasing the number of monitoring points and sampling multiple times in different seasons, as well as detection of different land use types. Meanwhile, although MixSIAR shows considerable potential for multi-source apportionment, further refinements are required regarding the accuracy of end-member data, the plausibility of distributional assumptions, and the treatment of uncertainty. Such improvements would enhance the explanatory power and reliability of the model in complex environmental systems and provide a more robust scientific basis for environmental management and decision-making.
4.2. Comparison with Other Studies
This study shows that NO3−-N is the dominant form of nitrogen in surface waters of the study area, primarily derived from FN, SN, and LSN. LSN is the major source of nitrate in spring and summer, whereas SN contributes more substantially in autumn and winter, which is broadly consistent with previous findings. Zhang et al. applied the SIAR model based on dual nitrate isotopes (δ15N–NO3− and δ18O–NO3−) to quantify NO3−-N sources in typical mountainous inflow rivers of Qiandao Lake, located downstream of the present study area. Their results indicated that NO3−-N is the predominant inorganic nitrogen species in all sub-catchments, with fertilizers and soil nitrogen contributing more in spring and summer, while domestic sewage becomes the dominant source in autumn and winter [8]. Zhao et al. used the SIAR model in combination with hydrochemical and isotopic data to investigate the river–reservoir system of the upper Xin’an River and Qiandao Lake, and demonstrated that nitrate sources and transformation processes are jointly controlled by land-use patterns and hydrological conditions. Under baseflow conditions, nitrate is mainly derived from domestic sewage and soil nitrogen, whereas during extreme flood events, rapid flushing of residual fertilizers and soil nitrogen on the land surface leads to a short-term but pronounced increase in fertilizer-derived nitrate [26].
In this study, nitrate sources were quantitatively apportioned primarily using the MixSIAR model. Beyond MixSIAR, however, a range of statistical techniques has also been applied for nitrate source apportionment [68]. For example, multivariate statistical methods such as cluster analysis (CA), positive matrix factorization (PMF), and principal component analysis (PCA) have been widely used [69,70,71]. These approaches are particularly effective for identifying which source categories and processes are dominant and how they vary spatially, but they do not directly provide quantitative contribution rates for individual pollution sources.
5. Conclusions
In 2023, four rounds of water-quality monitoring were conducted in the upper Xin’an River basin, during which TN, NO3−-N, NH4+-N, δ15N–NO3− and δ18O–NO3− were analyzed. The MixSIAR model was then applied to quantitatively estimate the seasonal contributions of SN, FN and LSN, and to identify temporal variations in dominant pollution sources at different monitoring sections, thereby providing a scientific basis for the precise control of regional nitrogen emissions. The main conclusions can be summarized as follows:
- (1)
- The concentrations of TN, NO3−-N and NH4+-N all exhibited significant seasonal differences (p < 0.05). In the upper Xin’an River basin, TN concentrations ranged from 0.72 to 4.08 mg/L (mean ± SD = 2.30 ± 0.48 mg/L). NO3−-N was the predominant form of inorganic nitrogen in the basin’s surface waters. Except in spring, when NO3−-N accounted for 48.9% of TN, NO3−-N contributed more than 72% of TN in the other three seasons.
- (2)
- In the upper Xin’an River basin, the mean δ15N–NO3− values among seasons followed the order summer > autumn > winter > spring. δ18O–NO3− exhibited significant seasonal differences (p < 0.05), with mean values following the order summer > winter > autumn > spring. Nitrate in the study area mainly originated from fertilizers, soil nitrogen, and livestock/sewage manure inputs, and its transformation processes within the basin were dominated by nitrification.
- (3)
- The MixSIAR results showed that LSN was the main nitrate source in spring and summer, with contributions of 49.2% and 59.9%, respectively; SN dominated in autumn (49.2%) and winter (54.1%); and FN made relatively high contributions in summer (21.5%) and autumn (17.3%). The contribution of AN was negligible in all seasons.
- (4)
- In summer and autumn, the contributions of LSN, SN and FN showed only minor variability among monitoring sites, whereas in spring and winter they differed markedly between sites. At monitoring sites located in areas with intensive human activities and livestock farming, LSN made the largest contribution, whereas in areas with intensive agricultural activity, SN and FN were the primary sources.
Author Contributions
Conceptualization, B.L. and A.W.; data curation, B.L., Z.H. and X.L.; methodology, A.W., M.Z. and B.L.; funding acquisition, A.W.; software, B.L. and M.Z.; validation, Z.H. and X.L.; writing—original draft, B.L., A.W., Z.H. and X.L.; writing—review and editing, B.L. and A.W. All authors have read and agreed to the published version of the manuscript.
Funding
This research was supported by The Youth Science and Technology Talent Development Fund Project of Tianjin Agricultural University, “Simulation and Analysis of Water-Sediment, Nitrogen and Phosphorus in River Basins under Future Change Scenarios” (Project No. 2025QNKJ16); the National Natural Science Foundation of China, “Simulation of nonpoint source pollution and identification in the water source basin” (Project No. 52109062); and by Ms. Ai Wang.
Data Availability Statement
The raw data supporting the conclusions of this article will be made available by the authors on request.
Acknowledgments
We are thankful to all those who contributed to this study.
Conflicts of Interest
The authors declare no conflicts of interest.
References
- Shi, W.M.; Zhang, Y.; Zhang, C.Q.; Zhang, W.R. Sources and health risks of nitrate pollution in surface water in the Weihe River watershed, China. J. Mt. Sci. 2022, 19, 2226–2240. [Google Scholar] [CrossRef]
- Lu, S.; Wang, N.; Guo, Y.X. Research Hotspots and Trends of Lake Ecosystem Services Based on Bibliometric Analysis. Environ. Sci. Res. 2024, 37, 1253–1266. [Google Scholar] [CrossRef]
- Xue, D.M.; De Baets, B.; Van Cleemput, O.; Hennessy, C.; Berglund, M.; Boeckx, P. Use of a Bayesian isotope mixing model to estimate proportional contributions of multiple nitrate sources in surface water. Environ. Pollut. 2012, 161, 43–49. [Google Scholar] [CrossRef]
- Nestler, A.; Berglund, M.; Accoe, F. Isotopes for improved management of nitrate pollution in aqueous resources: Review of surface water field studies. Environ. Sci. Pollut. Res. 2011, 18, 519–533. [Google Scholar] [CrossRef]
- Zhang, X.; Zhang, Y.; Bi, Z.L.; Shan, Z.X.; Ren, L.J.; Li, Q. Distribution and Sources of Nitrate in Surface Water of China. Environ. Sci. 2020, 41, 1594–1606. [Google Scholar] [CrossRef]
- Ding, J.T.; Xi, B.D.; Xu, Q.G.; Gao, R.T.; Lu, Y.; Huang, J.; Liu, H.L. Application of stable isotope techniques in the study of nitrate pollution in surface water. J. Lake Sci. 2013, 25, 617–627. [Google Scholar] [CrossRef]
- Kang, X.Q.; Niu, Y.; Yu, H.; Gou, P.; Hou, Q.Y.; Lu, X.F.; Wu, Y.L. Effect of rainfall-runoff process on sources and transformations of nitrate using a combined approach of dual isotopes, hydrochemical and Bayesian model in the Dagang River basin. Sci. Total Environ. 2022, 837, 155674. [Google Scholar] [CrossRef]
- Zhang, Z.N.; Xu, H.; Jiang, W.; Zhan, X.; Zhu, G.W.; Sun, H.W.; Zhang, Y.L. Source apportionment of nitrate in typical mountainous rivers of the Qiandao Lake watershed based on nitrogen and oxygen isotope techniques. Environ. Sci. 2025, 46, 2232–2241. Available online: https://www.hjkx.ac.cn/hjkx/ch/html/20250426.htm (accessed on 10 September 2025).
- Zhang, J.; Cao, M.D.; Jin, M.G.; Huang, X.; Zhang, Z.X.; Kang, F.X. Identifying the source and transformation of riverine nitrates in a karst watershed, North China: Comprehensive use of major ions, multiple isotopes and a Bayesian model. J. Contam Hydrol. 2022, 246, 103957. [Google Scholar] [CrossRef] [PubMed]
- Yu, F.; Li, Y.L.; Chen, Y.M.; Li, X.; Ren, S.H. Analysis of spatiotemporal distribution and sources of nitrogen in the lower Qinhe River using nitrogen and oxygen isotope techniques. Acta Sci. Circumstantiae 2025, 45, 178–189. [Google Scholar] [CrossRef]
- Xue, D.M.; Botter, J.; De Baets, B.; Accoe, F.; Nestler, A.; Taylor, P.; Boeckx, P. Present limitations and future prospects of stable isotope methods for nitrate source identification in surface- and groundwater. Water Res. 2009, 43, 1159–1170. [Google Scholar] [CrossRef]
- Kendall, C.; Elliott, E.M.; Wankel, S.D. Tracing Anthropogenic Inputs of Nitrogen to Ecosystems. In Stable Isotopes in Ecology and Environmental Science, 2nd ed.; Michener, R., Lajtha, K., Eds.; Blackwell Publishing: Malden, MA, USA, 2007; pp. 231–254. [Google Scholar] [CrossRef]
- Wang, G.; Gao, H.B.; Long, B.; Wu, J.F. Research progress in tracing nitrate pollution in groundwater by coupling nitrate isotopes with multiple tracers. Chin. J. Appl. Ecol. 2024, 35, 970–984. [Google Scholar] [CrossRef]
- Zhang, L.Y.; Ma, Y.Y.; Li, G.W.; Tang, W.Z.; Du, C.L. Research progress in the application of stable isotope techniques to the analysis of nitrate pollution sources in water bodies. J. Environ. Eng. Technol. 2023, 13, 1373–1383. [Google Scholar] [CrossRef]
- Lehmann, M.F.; Reichert, P.; Bernasconi, S.M.; Barbieri, A.; McKenzie, J.A. Modelling nitrogen and oxygen isotope fractionation during denitrification in a lacustrine redox-transition zone. Geochim. Cosmochim. Acta 2003, 67, 2529–2542. [Google Scholar] [CrossRef]
- Granger, J.; Wankel, S.D. Isotopic overprinting of nitrification on denitrification as a ubiquitous and unifying feature of environmental nitrogen cycling. Proc. Natl. Acad. Sci. USA 2016, 113, E6391–E6400. [Google Scholar] [CrossRef] [PubMed]
- Kohl, D.H.; Shearer, G.B.; Commoner, B. Fertilizer Nitrogen: Contribution to Nitrate in Surface Water in a Corn Belt Watershed. Science 1971, 174, 1331–1334. [Google Scholar] [CrossRef]
- Hu, M.; Liu, Y.; Zhang, Y.; Dahlgren, R.A.; Chen, D. Coupling stable isotopes and water chemistry to assess the role of hydrological and biogeochemical processes on riverine nitrogen sources. Water Res. 2019, 150, 418–430. [Google Scholar] [CrossRef]
- Deng, T.; Li, Z.; Lu, L.H.; Wang, L.W.; He, W.F.; Zhang, Y.Y. Research progress and prospects of stable isotope mixing models. Earth Environ. 2025, 1–13. [Google Scholar] [CrossRef]
- Saka, D.; Antwi, E.O.; Skrzypek, G.; Adu-Gyamfi, J.; Heng, L.; Attiogbe, F. Tracing sulfate sources in a tropical agricultural catchment with a stable isotope Bayesian mixing model. Sci. Total Environ. 2024, 951, 175502. [Google Scholar] [CrossRef]
- Moore, J.W.; Semmens, B.X. Incorporating uncertainty and prior information into stable isotope mixing models. Ecol. Lett. 2008, 11, 470–480. [Google Scholar] [CrossRef]
- Stock, B.C.; Jackson, A.L.; Ward, E.J.; Parnell, A.C.; Phillips, D.L.; Semmens, B.X. Analyzing mixing systems using a new generation of Bayesian tracer mixing models. PeerJ 2018, 6, e5096. [Google Scholar] [CrossRef] [PubMed]
- Zhao, W.N.; Cui, J.J.; Bai, L.Y.; Yu, X.J.; Dai, J.L. Research progress on methods for nitrate source apportionment in watershed water environment. Environ. Eng. 2023, 41, 286–294. [Google Scholar] [CrossRef]
- Chen, R.; Hu, Q.; Shen, W.; Guo, J.; Yang, L.; Yuan, Q.; Lu, X.; Wang, L. Identification of nitrate sources of groundwater and rivers in complex urban environments based on isotopic and hydro-chemical evidence. Sci. Total Environ. 2023, 871, 162026. [Google Scholar] [CrossRef] [PubMed]
- Yang, K.L.; Liu, S.L.; Wan, H.Y.; Yan, K.; Tao, Y.J.; Wang, H.S. Analysis of nitrate sources in surface water of northern Yantai based on nitrogen and oxygen isotopes and MixSIAR model. China Geol. 2024, 51, 2066–2076. [Google Scholar] [CrossRef]
- Zhao, X.C.; Xu, H.; Yu, J.; Liu, M.L.; Shan, L.; Cheng, X.L.; Kang, L.J. Impact of urban distribution on nutrient concentrations in the Xin’an River system and Qiandao Lake. Res. Environ. Sci. 2022, 35, 864–876. [Google Scholar] [CrossRef]
- Wang, A.; Wang, J.Y.; Luan, B.J.; Wang, S.R.; Huo, Z.G. Source tracing analysis of nitrogen in the upper reach of Xin’an River Basin based on SWAT model. Ecol. Indic. 2025, 175, 113554. [Google Scholar] [CrossRef]
- Cao, Z.Q. Analysis of nitrogen and phosphorus pollution and countermeasures in the Xin’an River Basin of Huangshan City. J. Green Sci. Technol. 2022, 24, 88–91. [Google Scholar] [CrossRef]
- Wu, Y.F.; Hu, R.H.; Fang, M. Ecological hidden dangers and prevention of water resources in the Xin’an River Basin. Anhui Agric. Sci. Bull. 2014, 20, 101–102. [Google Scholar] [CrossRef]
- Zhao, X.C.; Xu, H.; Kang, L.J.; Zhu, G.; Paerl, H.W.; Li, H.; Liu, M.; Zhu, M.; Zou, W.; Qin, B.; et al. Nitrate sources and transformations in a river-reservoir system: Response to extreme flooding and various land use. J. Hydrol. 2024, 638, 131491. [Google Scholar] [CrossRef]
- He, F.; Wu, N.; Fang, J.L.; Gao, J.X.; Zhou, X.T.; Feng, C.Y. Ecosystem services and their value for reducing phosphorus non-point source pollution in the upper Xin’an River. Chin. J. Appl. Ecol. 2015, 26, 1253–1262. [Google Scholar] [CrossRef]
- Zhang, L.; Cai, J.; Yuan, H.W.; Xu, L.H.; Wei, Z.Z.; Chen, X.Y. Spatio-temporal evolution and multi-scenario prediction of habitat quality in the Xin’an River Basin. J. Yunnan Agric. Univ. (Soc. Sci.) 2022, 16, 133–142. [Google Scholar] [CrossRef]
- Min, J.; Liu, X.H.; Xiao, Y.X.; Luo, R.L.; Pang, J.Y.; Cheng, H.X. Analysis and prediction of spatiotemporal changes of ecosystem carbon storage in the Xin’an River Basin based on PLUS and InVEST models. Geoscience 2024, 38, 574–588. [Google Scholar] [CrossRef]
- Wang, Y.R.; Zeng, Q.M.; Chen, L.G.; Sun, B.; Zhu, Q. Spatiotemporal variation of net anthropogenic nitrogen input and its response to ecological compensation in the Xin’an River Basin. J. Ecol. Rural. Environ. 2021, 37, 465–473. [Google Scholar] [CrossRef]
- Hong, J.; Ye, C.L. Current situation and control measures of agricultural non-point source pollution in the Xin’an River Basin of Huangshan City. Anhui Agric. Sci. Bull. 2013, 19, 101+107. [Google Scholar] [CrossRef]
- Zhong, W.B. Analysis of hydrological elements in the upper Xin’an River Basin. Water Resour. Dev. Manag. 2023, 9, 13–19. [Google Scholar] [CrossRef]
- Huang, R.; Zhang, J.M.; Lin, Y.X.; Li, Z.W.; Xiao, W.H. Runoff variation characteristics and attribution analysis in the upper reaches of the Xin’an River Basin. J. Nat. Resour. 2019, 34, 1771–1781. [Google Scholar] [CrossRef]
- Tang, L. Current situation and countermeasures of rice industry development in Huangshan City. Anhui Agric. Sci. Bull. 2023, 29, 172–175. [Google Scholar] [CrossRef]
- Liu, L. Present situation and countermeasures of rapeseed production in Anhui Province. Anhui Agric. Sci. Bull. 2016, 22, 61–62+64. [Google Scholar] [CrossRef]
- Xu, J.H. Study on agricultural non-point source pollution from tea plantations in the Xin’an River Basin. Anhui Agric. Sci. Bull. 2014, 20, 107–108. [Google Scholar] [CrossRef]
- Cai, L.; Su, J.W.; Li, Z.; Wang, W.; Wang, Z.Y.; Chen, J. Hydrochemical characteristics and hydrogeochemical processes of groundwater in the upper reaches of Xin’an River Basin. East China Geol. 2023, 44, 262–272. [Google Scholar] [CrossRef]
- Li, H.Y.; Yang, C.G.; Qu, B.Q.; Li, Y.; Jin, J.; Luo, L.; Wu, Z.; Shi, K.; Zhu, G. Modeling the effects of climate change and land use/land cover change on sediment yield in a large reservoir basin in the East Asian Monsoonal Region. Water 2022, 14, 2346. [Google Scholar] [CrossRef]
- Parnell, A.C.; Inger, R.; Bearhop, S.; Jackson, A.L. Source partitioning using stable isotopes: Coping with too much variation. PLoS ONE 2010, 5, e9672. [Google Scholar] [CrossRef]
- Sigman, D.M.; Casciotti, K.L.; Andreani, M.; Barford, C.; Galanter, M.; Böhlke, J.K. Measurement of the oxygen isotopic composition of nitrate in sea-water and freshwater using the denitrifier method. Anal. Chem. 2002, 74, 4905–4912. [Google Scholar] [CrossRef]
- Qin, S.J.; Fu, X.F. Application progress of stable isotope ratio mass spectrometry in tracing the source of environmental pollutants. Exp. Anal. 2025, 3, 21–27. [Google Scholar] [CrossRef]
- Cotrufo, M.F.; Wallenstein, M.D.; Boot, C.M.; Denef, K.; Paul, E. The Microbial Efficiency-Matrix Stabilization (MEMS) framework integrates plant litter decomposition with soil organic matter stabilization: Do labile plant inputs form stable soil organic matter? Glob. Change Biol. 2013, 19, 988–995. [Google Scholar] [CrossRef]
- Tahir, N. Study on the effects of long-term fertilization and climatic factors on soil nutrient changes and production sustainability based on the APSIM model. Chin. Acad. Agric. Sci. 2021, 4. [Google Scholar] [CrossRef]
- Kleber, M.; Johnson, M.G. Advances in understanding the molecular structure of soil organic matter. Adv. Agron. 2010, 106, 77–142. [Google Scholar] [CrossRef]
- Xia, J.Y.; Wan, S.Q. Global response patterns of terrestrial plant species to nitrogen addition. New Phytol. 2008, 179, 428–439. [Google Scholar] [CrossRef]
- Reinhardt, M.; Müller, B.; Gächter, R.; Wehrli, B. Nitrogen removal in a small constructed wetland: An isotope mass balance approach. Environ. Sci. Technol. 2006, 40, 3313–3319. [Google Scholar] [CrossRef]
- Meng, X.; Liu, W.G.; Wang, Z.F.; Hu, J. Relationship of nitrate isotopic character to population density in the Loess Plateau of Northwest China. Appl. Geochem. 2013, 35, 110–119. [Google Scholar] [CrossRef]
- Blake, W.H.; Boeckx, P.; Stock, B.C.; Smith, H.G.; Bodé, S.; Upadhayay, H.R.; Semmens, B.X. A deconvolutional Bayesian mixing model approach for river basin sediment source apportionment. Sci. Rep. 2018, 8, 13073. [Google Scholar] [CrossRef]
- Zhang, Y.; Shi, P.; Li, F.D.; Wei, A.Z.; Li, S.Q.; Ma, H.M. Quantification of nitrate sources and fates in rivers in an irrigated agricultural area using environmental isotopes and a Bayesian isotope mixing model. Chemosphere 2018, 208, 493–501. [Google Scholar] [CrossRef]
- Yue, F.J.; Li, S.L.; Liu, C.Q.; Zhao, Z.Q.; Ding, H. Tracing nitrate sources with dual isotopes and long term monitoring of nitrogen species in the Yellow River, China. Sci. Rep. 2017, 7, 8537. [Google Scholar] [CrossRef] [PubMed]
- Kaushal, S.S.; Groffman, P.M.; Band, L.E.; Elliott, E.M.; Shields, C.A.; Kendall, C. Tracking nonpoint source nitrogen pollution in human-impacted watersheds. Environ. Sci. Technol. 2011, 45, 8225–8232. [Google Scholar] [CrossRef]
- Jin, Z.F.; Qin, X.; Chen, L.X.; Jin, M.T.; Li, F.L. Using dual isotopes to evaluate sources and transformations of nitrate in the West Lake watershed, eastern China. J. Contam. Hydrol. 2015, 177–178, 64–75. [Google Scholar] [CrossRef]
- Jin, Z.F.; Hu, J.; Wu, A.J.; Li, G.Y.; Zhang, W.L.; Li, F.L. Source apportionment of nitrate in different land use areas based on multi-isotopes. Environ. Sci. 2021, 42, 1696–1705. Available online: https://www.hjkx.ac.cn/hjkx/ch/html/20210412.htm (accessed on 15 September 2025).
- Wu, Y.Q.; Ge, Y.X.; Zhang, Q.; Hu, G. Advances in soil organic nitrogen depolymerization and its regulation. J. Soil Water Conserv. 2025, 1–12. [Google Scholar] [CrossRef]
- Xu, S.G.; Kang, P.P.; Sun, Y. A stable isotope approach and its application for identifying nitrate source and transformation process in water. Environ. Sci. Pollut. Res. 2016, 23, 1133–1148. [Google Scholar] [CrossRef] [PubMed]
- Sun, L.F.; Xia, Z.; Sang, C.; Li, J.; Wang, J.; Li, D.; Liu, X.; Feng, J.; Han, X.; Liu, L.; et al. Soil resource status affects the responses of nitrogen processes to changes in temperature and moisture. Biol. Fertil. Soils 2019, 55, 629–641. [Google Scholar] [CrossRef]
- Jin, Z.; Zheng, Q.; Zhu, C.; Wang, Y.; Li, F. Contribution of nitrate sources in surface water in multiple land use areas by combining isotopes and a Bayesian isotope mixing model. Appl. Geochem. 2018, 93, 10–19. [Google Scholar] [CrossRef]
- Liu, C.Q.; Li, S.L.; Lang, Y.C.; Xiao, H.Y. Using δ15N- and δ18O-values to identify nitrate sources in karst ground water, Guiyang, southwest China. Environ. Sci. Technol. 2006, 40, 6928–6933. [Google Scholar] [CrossRef]
- Widory, D.; Petelet-Giraud, E.; Négrel, P.; Ladouche, B. Tracking the sources of nitrate in groundwater using coupled nitrogen and boron isotopes: A synthesis. Environ. Sci. Technol. 2005, 39, 539–548. [Google Scholar] [CrossRef]
- Zheng, W.; Wang, S.; Sun, H.; Li, T.; Tan, Q. Rainfall driven nitrate transport in runoff of hilly area by combining time-series monitoring of hydrochemistry and stable isotopes. J. Hydrol. 2025, 654, 132830. [Google Scholar] [CrossRef]
- Nishizawa, M.; Shibata, S.; Klinkhammer, U.; Takai, K.; Le Bris, N. Nitrogen and oxygen isotope effects of ammonia oxidation by thermophilic Thaumarchaeota from a geothermal water stream. Appl. Environ. Microbiol. 2016, 82, 4492–4504. [Google Scholar] [CrossRef]
- An, C.Y.; Wang, R.D.; Zhou, H.T.; Li, J.Y.; Zhang, Y.; Wang, X.Y. Effects of autumn no-tillage on farmland wind erosion and soil physicochemical properties in Bashang region. J. Desert Res. 2022, 42, 95–103. [Google Scholar] [CrossRef]
- Yang, Y.F.; Wang, C.X.; He, X.L.; Li, Y.N.; Wang, J.H.; Li, R. Study on the effects of winter irrigation during seasonal freezing–thawing period on soil microbial ecological properties. Sci. Rep. 2025, 15, 23586. [Google Scholar] [CrossRef]
- Shrestha, S.; Kazama, F. Assessment of surface water quality using multivariate statistical techniques: A case study of the Fuji river basin, Japan. Environ. Model. Softw. 2007, 22, 464–475. [Google Scholar] [CrossRef]
- Li, F.; Zhang, J.K.; Wang, S.Q.; Zhang, Q.R.; Zhang, Y.H.; He, J.H.; Cao, Y.S. Multivariate statistical analysis of chemical and stable isotopic data as indicative of groundwater evolution with reduced exploitation. Geosci. Front. 2023, 14, 101476. [Google Scholar] [CrossRef]
- Zheng, L.Y.; Yu, H.B.; Wang, Q.S. Application of multivariate statistical techniques in assessment of surface water quality in Second Songhua River basin, China. J. Cent. South Univ. 2016, 23, 1040–1051. [Google Scholar] [CrossRef]
- Liu, H.Y.; Yang, G.L.; Xie, Y.C.; Qu, X.K.; Li, T.T.; Shan, B.Q. Sources of nitrate and key transformation mechanisms in surface water of a piedmont agricultural area. Environ. Sci. 2025, 1–14. [Google Scholar] [CrossRef]


Disclaimer/Publisher’s Note: The statements, opinions and data contained in all publications are solely those of the individual author(s) and contributor(s) and not of MDPI and/or the editor(s). MDPI and/or the editor(s) disclaim responsibility for any injury to people or property resulting from any ideas, methods, instructions or products referred to in the content. |
© 2025 by the authors. Licensee MDPI, Basel, Switzerland. This article is an open access article distributed under the terms and conditions of the Creative Commons Attribution (CC BY) license (https://creativecommons.org/licenses/by/4.0/).