Abstract
The rehabilitation of critical water-conveyance infrastructure plays a fundamental role in the water–energy nexus and constitutes a key strategy for extending the operational lifetime of hydropower facilities. These interventions are aligned to the United Nations’ 2030 Agenda, which declare that ensuring access to affordable, reliable, sustainable, and modern energy systems is essential for long-term energy security. This paper presents a field-validated, non-thermal repair methodology developed for the Chivor II hydropower penstock, a critical water conduction tunnel used for energy production in Colombia, that has been affected by a circumferential fatigue crack. Due to the geometric confinement of the penstock within the rock mass, conventional thermal or stress-relief treatments were unfeasible. Therefore, the proposed methodology uses controlled material removal with a welding sequence designed to release stored elastic energy and induce compressive stresses through the Poisson effect. Its main contribution is demonstrated through pilot-scale validation and full-scale implementation under real operating conditions, achieving 50% reduction in tensile stresses and left 99% of the examined surface under compression, which represents effective residual-stress stabilization, structural recovery, and hydraulic reliability. The methodology ensures reliable water conveyance for hydropower generation and can be applied to other pressurized conduits and pipelines where accessibility and heat treatment are constrained, strengthening SDGs 7 and 9 on clean energy, water sustainability, and resilient infrastructure.
1. Introduction
The global population is steadily increasing, according to the United Nations report [1], at a rate exceeding 1% annually. This growth drives a rising demand for resources, including energy. The International Energy Agency [2] reports that energy consumption has increased by more than 2.6% over the last decade in developing countries and emerging markets. Meeting this growing demand requires strategies that enable generation systems free of fossil fuels and a substantial share of renewable sources [3], in line with the 2030 Sustainable Development Agenda proposed by the United Nations [4], which defines Sustainable Development Goal (SDG) 7: “Affordable and Clean Energy.” Achieving this goal involves not only installing new generation facilities but also upgrading and adapting existing ones, depending on the available strategy and resources. In the case of hydropower generation, Su et al. [5] reported that many hydropower projects are reaching the end of their service life and proposed a methodology to evaluate and predict both resource and facility longevity. Stoll et al. [6] emphasized that hydropower projects are critical assets for the power sector, underscoring the need to determine their role in a historical moment marked by the growing integration of renewables into the energy mix.
According to the World Bank [7], hydropower generation is expected to expand, especially in developing countries. In this context, Ioannou et al. [8] presented a comprehensive literature review of methods for modeling risks and uncertainties in sustainable energy planning. More recently, Yaseen et al. [9] conducted an extensive study on the sustainable operation of hydropower projects and identified promising directions for research and development, including the use of operational data for infrastructure design and maintenance. Similarly, Shaktawat and Vadhera [10] provided an in-depth review of risk management in hydropower projects with a focus on sustainable development, while Celebioglu et al. [11] proposed a rehabilitation methodology based on condition assessment, performance testing, and evaluation of rehabilitation potential. In Colombia, del Río et al. [12] documented the life-extension project for the Chivor hydropower plant, extending its lifespan by 50 years through the design of a new intake system to mitigate sedimentation. Fry et al. [13] considered hydropower as the center of the energy transition in Europe, thanks to its capacities to support production flexibility, among other characteristics.
Most published studies have been conducted in China, Norway, Switzerland, the Himalayas, and Slovenia, among others, highlighting the global relevance of hydropower research. However, large-scale studies of this type have not been reported in the Latin American context for major hydropower facilities, such as AES Chivor. Regional contributions have focused more on ecosystem and policy issues than on technological development, as proposed in this project. For instance, Diaz-Arellano et al. [14] analyzed lacustrine ecosystem changes in Chile using diachronic satellite imagery, Angarita et al. [15] assessed wetland impacts from hydropower projects in Colombia’s Monpós region, and Anderson et al. [16] documented the rapid growth of new hydropower projects in the Amazon basin. Díaz et al. [17] concluded that the fragmentation of Andean rivers for new hydropower developments will impact connectivity and ecological functions. Atkins [18] reported mixed stakeholder views on the sustainability of three hydropower projects in Brazil.
At the Third World Water Forum held in Kyoto, Japan [19], several critical challenges were identified to ensure sustainable energy for the future. Numerous studies have addressed issues related to penstocks, including technological advances and research efforts that have led to infrastructure modifications and refurbishments [20]. For instance, Schleiss and Manso [21] developed procedures for the design and arrangement of relief valves to reduce buckling risk during penstock drainage for maintenance. Tun and Singal [22] explored constructive solutions to minimize buckling and collapse risks, while Panthi and Basnet [23] analyzed key factors influencing penstock design through major case failures and proposed design criteria for refurbishments and new projects in Scandinavia. Kawamura et al. [24] analyzed penstock materials in a plant operating for nearly 50 years, highlighting the importance of life extension projects for existing infrastructure. Additional examples include the refurbishment of high-pressure penstocks at the 390 MW Kaunertal plant in Austria [25,26], stability and lining studies for the Jinping II hydropower project [27], steel-lining assessments in the Hua’an hydropower plant [28], and proposals for innovative lining materials, such as Steel Fiber-Reinforced Shotcrete (SFRS) [29]. Recent works include failure mechanism studies and finite element modeling of steel-lining strain-hardening [30], as well as the design of a self-supporting lining system for penstock refurbishment at the Chivor hydropower plant in Colombia [31].
Since the mid-1990s, penstock design and construction practices have evolved significantly, incorporating steel lining monitoring requirements [32], buckling studies [33], and, more recently, intelligent algorithms for structural optimization [34]. In the 2000s, Jian-Guo et al. [35] compared international design standards for hydropower penstocks, while Bobet and Nam [36] provided analytical solutions for soil–lining–pore interaction problems. Studies have also examined the stability of thin-walled steel cylinders [37], flow–structure interactions [38], and three-dimensional finite-element models of steel-lining stability [39]. Other contributions include nonlinear analysis of reinforced-concrete tunnels [40], new qualification methods for tunnel-lining materials [41], FEM-based stress evaluations [42,43], and analytical solutions for deep steel-lined tunnels considering rock anisotropy [44]. Major contributions also include risk-control technologies for deep tunnels in Jinping II [27,45], experiences with unlined tunnels in Norway [46], optimization of high-pressure nozzles with reinforcement rings [47], and proposals for prestressed concrete linings [48]. Hu et al. [49] demonstrated the importance of flow regulation in extremely long penstocks to ensure safe hydropower plant operation.
Beyond refurbishment and design strategies, several studies have focused on operation evaluation and structural health monitoring. Bulloch and Callagy [50] reported that most penstock failures occur either in new plants or those operating for 40–50 years. Fatigue analyses of welded elements using dynamic time-domain simulations have been performed [51], along with methodologies for predicting tunnel deformations [52]. Real-time monitoring systems, such as Hydro-Clone [26,53,54,55], have been applied to replicate hydraulic transients and assess fatigue conditions. Further research has addressed rock deformation control [56], load transfer analysis [26], and practical safety evaluation methods for aging infrastructure [57]. Innovations include microseismic techniques for rockburst detection [58] and nonlinear transient response models for operational risk mitigation [59]. Case studies such as Kulekhani III in Nepal [60] illustrate the consequences of penstock failures and the need for preventive strategies.
Repair strategies vary with the type of penstock lining. For unlined tunnels, stochastic models have been proposed to characterize mechanical degradation under severe hydrothermal conditions, where corrosion and structural damage progress rapidly [61]. For concrete-lined tunnels, quantum-particle-based crack-detection techniques enable highly accurate localization and characterization of internal cracks, supporting localized, non-destructive repair approaches [62]. For metallic linings, researchers emphasize integrating fatigue analysis with advanced monitoring, as failure mechanisms are closely linked to dynamic loads and hydraulic transients [63].
Traditional residual stress–relaxation/reduction techniques such as thermal stress relief, vibratory stress reduction, and ultrasonic impact treatment, have been widely studied and applied in controlled environments to mitigate welding-induced residual stresses [64,65,66,67,68]. These methods consist of applying heat input or dynamic energy to accelerate dislocation movement and microstructural recovery, which effectively reduces residual stress magnitudes in metallic structures. However, their implementation is not practical or feasible in large water conduction systems, such as embedded hydropower penstocks, where accessibility is limited, and where thermal treatments could compromise both structural integrity and surrounding rock stability. This work presents a field-validated, non-thermal repair methodology developed for the Chivor II hydropower penstock, a critical water conduction tunnel that supports renewable energy production in Colombia. The proposed methodology comprises controlled material removal with a mechanically compensated welding sequence designed to release stored elastic energy and induce compressive stresses through the Poisson effect. Its main contribution is demonstrated with a pilot-scale validation and full-scale implementation under real operating conditions of the AES Chivor hydropower project, demonstrating effective residual-stress stabilization, structural recovery, and hydraulic reliability. This mechanical stress-relief process guarantees structural reliability and safe water transport under high-pressure operation. The approach represents a replicable solution for extending the service life of critical infrastructure, such as pressurized conduits and pipelines where conventional rehabilitation is unfeasible, reinforcing water–energy sustainability in line with Sustainable Development Goals 7 and 9.
The organization of the paper is as follows: In Section 2, the hydropower plant and the failure situation are described; additionally, the characterization and repair design/implementation processes for the penstock are reported. Section 3 shows the results obtained with the innovative repair process for three phases and locations within the analyzed joint. Section 4 contains the discussion, which highlights the purely mechanical process that produced a residual stress reconfiguration, and finally, conclusions are presented in Section 5.
2. Materials and Methods
The AES Chivor Hydropower Plant (Santa María, Boyacá), situated approximately 160 km northeast of Bogotá, has operated since 1977 as one of Colombia’s most significant hydroelectric facilities (Figure 1). The plant has a total installed capacity of 1000 MW, served by eight Pelton turbines rated at 125 MW each. Such a plant was initially designed to operate for 50 years and is now undergoing a long-term modernization program to ensure continued operation beyond 2025, as described in [12]. The facility’s hydraulic system includes two headrace tunnels, Chivor I (7.985 km) and Chivor II (8.009 km), which, together, bring roughly 160 m3/s of water from the reservoir to the powerhouse [31]. The lower tunnel, corresponding to Chivor II, incorporates a 2.07 km steel-lined section with an internal diameter of 3.9 m, externally reinforced by prestressed steel bands to withstand internal pressure and hydraulic transients (Figure 2). Historical records describe critical deformation events, which occurred during construction and subsequent operation.
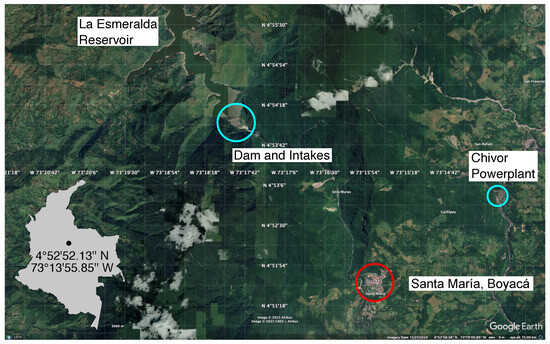
Figure 1.
AES Chivor Hydropower project location. Adapted from Google Earth™ mapping service.
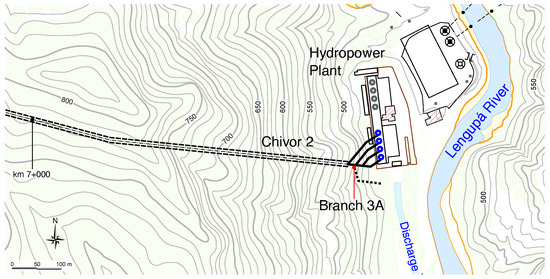
Figure 2.
Hydropower Plant and Chivor II tunnel and location of Branch 3A.
2.1. Situation
During the last decade, AES has conducted the assessment of the Chivor II penstock’s wall thickness due to evidence of internal pitting corrosion. Studies have revealed severe reductions in wall thickness across several regions, prompting a large-scale rehabilitation project. One proposed solution is to install a secondary tube within the existing penstock and fill the annular gap between the two. However, a structural anomaly was discovered at a section known as Branch 3A (Figure 3), where an outlet was initially built for potential future units that were never installed. The Y-shaped branch has a plugged section that caused localized hydraulic stress concentration. A circumferential crack extending approximately 180° of the pipe’s perimeter was detected at the joint between shells 604 and 605 (joint 604/605) of the Y-shaped connection. This finding initiated the detailed structural and mechanical diagnostics described in this work.
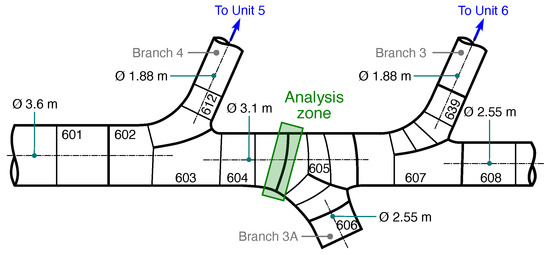
Figure 3.
Analysis zone in section of Branch 3A. Joint between shells 604 and 605 in Chivor II penstock.
2.2. Diagnostics
After the detection of the circumferential crack in the Chivor II penstock, a comprehensive diagnostic process was conducted to determine the crack’s origin, the propagation mechanism, and the overall impact on the structural integrity of the conduction tunnel. This diagnostic process combined morphological and mechanical characterization techniques to determine the microstructural condition and the residual stress state. Then, the morphological evaluation consisted of a metallographic analysis to examine the microstructure, magnetic particle inspection to detect surface fissures along the entire perimeter of the affected section, and ultrasonic testing to identify subsurface discontinuities. Then, the mechanical characterization focused on hardness, resilience, elongation, ductility, and residual stresses, providing a quantitative basis for understanding the material’s degradation and guiding the subsequent design of the repair strategy.
2.3. Morphological Analysis
The morphological analysis was carried out to detect possible morphological changes in the penstock or the presence of brittle phases (sigma, delta, alpha ferrite, etc.) that could cause embrittlement (Figure 4). This diagnostics part was performed with four different methods: macroscale (visual), mesoscale (magnetic particle), subsurface mesoscale (ultrasound), and microscale (metallography).
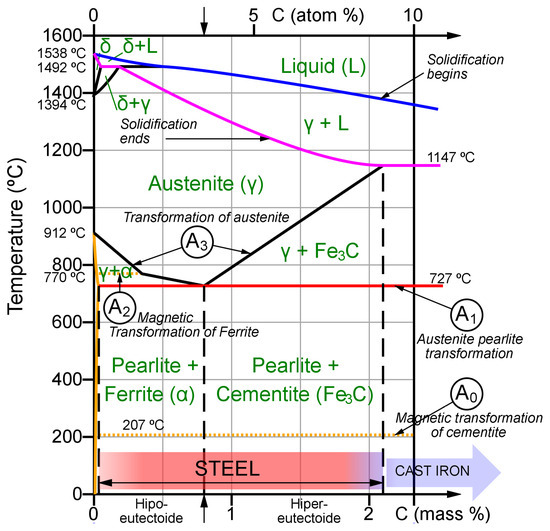
Figure 4.
Iron–carbon phase diagram with microstructures of hypoeutectoid kinetics [69].
2.3.1. Macroscale Morphological Characterization: Visual Inspection
Visual inspection (VI) is a fundamental non-destructive testing technique used to evaluate repaired joints, as it enables rapid, effective detection of surface anomalies that could compromise the structural integrity or long-term performance of the weld. In field repair operations (particularly in geographically complex environments such as mountainous regions), this inspection serves as the first level of quality control. It verifies the geometric conformity of the weld bead, the absence of visible defects (including cracks, lack of fusion, or surface porosity), and the proper transition between the base material and the deposited metal. The systematic application of visual inspection to repaired joints not only complies with international standards (API 1104 [70], ASME B31.8 [71]) but also provides a key indicator of the quality of the welding process and the adequacy of surface preparation. Furthermore, it establishes a baseline for interpreting the results of complementary inspection techniques and subsequent mechanical analyses.
Equipment and Calibration
- Vernier gauge.
- Measuring tape.
- Flashlight.
Standards
- ASME Section VIII—Rules for Construction of Pressure Vessels Division 1 [72].
2.3.2. Mesoscale Morphological Characterization: Magnetic Particle Inspection
Magnetic particle inspection (MPI) [73] was carried out across 100% of the repaired phases. This non-destructive test is used to detect both surface and near-surface discontinuities (e.g., cracks, lack of fusion, or tearing) and to estimate their dimensions. Longitudinal and transverse magnetizations were applied to each inspected area, using both alternating and direct current to enhance detection sensitivity. Because the penstock’s external surface was painted, a slight reduction in inspection sensitivity was anticipated.
Equipment and Calibration
- Magnetization method: Indirect.
- Current type: Alternating current (AC).
- Magnetic particles: Wet type/Magnaflux 7HF.
- Contrast medium: Magnaflux WCP-2.
- Field-verification device: Pie Gauge (for magnetic field orientation and intensity).
2.3.3. Subsurface Morphological Characterization: Conventional Ultrasonic Testing
The conventional pulse-echo ultrasonic test (UT) is a non-destructive technique recognized by Section VIII of the ASME Code for evaluating the internal integrity of pressure-bearing metallic components, including welded joints in piping systems [72]. The method relies on the emission of high-frequency ultrasonic pulses that propagate through the material [74]; when these waves encounter an internal discontinuity (such as a crack, inclusion, lack of fusion, or porosity), a portion of the acoustic energy is reflected back to the transducer [75]. The resulting echoes, characterized by their return time and amplitude, enable the determination of the location, depth, and relative severity of any detected defect. Conducted in accordance with ASME Section VIII, Division 1 [72], the test provides reliability and repeatability consistent with safety requirements for critical equipment. In field repair scenarios, the pulse-echo ultrasonic method is essential for confirming the absence of volumetric imperfections that cannot be detected by surface techniques, thereby ensuring that the weld meets the acceptance criteria for safe operation under service conditions.
Equipment and Calibration
- Ultrasonic unit: DOPPLER ANYSCAN–30.
- Transducer: AFN2.25-2020-70L.
- Calibration block: IIW V1.
Calibration Parameters
- Wave velocity in solid: Shear waves—3214 m/s; Longitudinal waves—5220 m/s.
- Frequency: 2.25 MHz.
- Step: 769.
- Aperture: 20 × 20 mm.
- Number of elements: 1.
- Shoe: 02505572R.
- Scan type: Parallel to weld axis.
- Angular range: 70°.
- Reference gain level: 74.2 dB.
- Exploration gain: +6 dB.
- Reference level: 50%.
- Couplant: Methyl cellulose.
2.3.4. Microscale Morphological Characterization: Metallography
Metallography (MET) is one of the most practical tools for identifying the phases and constituents of a material at the microscopic level [76]. It provides insight into metallurgical phenomena, such as hardening, hardness reduction, aging, embrittlement, and microcracking—processes that can only be revealed at the microstructural scale.
The microstructures observed in the analyzed steels were consistent with those of hypoeutectoid carbon steels, characterized by a biphasic structure composed of ferrite (a soft and ductile phase) and pearlite (a harder and stronger phase). The coexistence of lamellar alpha ferrite and cementite governs the distribution and grain size of pearlite. The transformation of austenite into pearlite below 723 °C produced the expected proportions when observed at 500× magnification. Fine and uniformly distributed pearlite contributes to higher strength, while ferrite forms a continuous matrix surrounding pearlite colonies, providing ductility and toughness.
Procedure
- Coarse polishing: Surface polished using a 3-inch portable grinder-polisher at 1400 rpm, with sequential abrasive papers (320–2000 grit), each for about five minutes.
- Fine polishing: Surface refined to a mirror finish using a soft pad and alumina paste (0.5 μm then 0.3 μm).
- Surface verification: Examined with a portable microscope at 100× magnification to confirm quality and absence of inclusions or defects.
- Chemical etching: Etched using a Nital reagent (0.5 mL HNO3 in 10 mL ethanol) prepared according ASTM E407-99 [77] and applied for 4–5 min, then cleaned with ethyl alcohol.
- Observation and documentation: Examined at 100× and 400× magnifications using a portable metallographic microscope and photo-documented.
Standards
- ASTM E3—Standard Practice for Preparation of Metallographic Specimens [78].
- ASTM E112–2010—Standard Test Methods for Determining Average Grain Size [79].
- ASTM E407–99—Standard Practice for Microetching Metals and Alloys [77].
2.4. Geometric Analysis
At the joint between two cylindrical shells, it was observed that the pipes were not perfectly concentric, likely because of the original assembly of the Y-branch. A cross-sectional thickness reduction was identified—from 140 mm upstream to 120 mm downstream—creating a structural discontinuity that, combined with weld misalignment, generated stress concentration zones.
2.5. Mechanical Characterization: X-Ray Diffraction (XRD)
The X-ray diffraction technique enables detailed analysis of the material’s crystalline structure [80], providing information about residual stress, grain size, phase composition, and qualitative chemical composition. Residual stresses are determined from the angular displacement of crystalline planes using Bragg’s law and the method, which quantifies stress through the variation of interplanar spacing as a function of the tilt angle.
The residual stress of the base material [81], due to its biphasic microstructure, is expected to be close to a neutral value. In rolling–forming processes, the residual stress can reach magnitudes up to −350 MPa in plastically deformed segments. Consequently, the effective range for applied stresses can increase by almost 40% compared to its natural range if an ideal, fully stress-relieved material starting from zero is considered (i.e., the residual stress plus the entire elastic range of the material, corresponding to the net stress). However, as the component remains in service, the magnitude of compressive residual stresses gradually decreases, approaching the neutral (zero) value. This phenomenon reduces the initially available range provided by the original manufacturing process. After prolonged service, the material tends to align its residual stress with the operationally induced stress.
The 60/45 steel, subjected to a stress-relief heat treatment, typically exhibits an ultimate tensile strength between 570 and 700 MPa. According to the morphological findings, this value may decrease in field welds by approximately 15%, since the ferritic phase offers high ductility but lower mechanical strength, and the partial absence of cementite in the lamellar pearlite phase reduces overall strength.
Given the strong correlation between residual stress and mechanical behavior, residual stress measurements were performed on each inspected joint. The 60/45 steel, after heat treatment as indicated in the design drawings, presents an ultimate tensile strength between 570 and 700 MPa and a yield strength (Re) of approximately 400 MPa.
Equipment and Calibration
- Measurement technique: X-Ray Diffraction (XRD).
- Equipment: GNR SpiderX X-ray diffractometer.
- Detector: Chromium, suitable for ferrous and aluminum alloys.
- Operational range: −1000 to +1000 MPa.
- Goniometer positions: −45°, 0°, +45°.
- Resolution: 1 MPa.
- Self-assessment system providing reliability percentage of each measurement.
Standards
- ASTM E915—Standard Test Method for Verifying the Alignment of X-Ray Diffraction Instrumentation for Residual Stress. Measurement [82].
- UNI EN 15305—Non-destructive Testing: Test Method for Residual Stress by X-ray Diffraction [83].
2.6. Mechanical Characterization: Hardness
Hardness measurements were performed using the Ultrasonic Contact Impedance (UCI) method, in accordance with the ASTM A1038 standard [84], which uses ultrasonic resonance as the measurement principle. This approach provides high repeatability and minimal result variation, provided the material is reasonably homogeneous. The UCI is designed to measure hardness in thin sections [85], components with complex surface geometries, and hardened surface layers, conditions that match the characteristics of the present analysis.
Equipment and Calibration
- Model: TK459 Hardness Tester.
- Calibration verification: Performed on-site using a certified reference steel block (60 HRC) to ensure proper equipment condition and calibration accuracy.
Hardness testing was conducted using a UCI-type device with the following technical characteristics:
- Measurement range (by scale):
- -
- Brinell: 90–450 HB.
- -
- Rockwell C: 20–70 HRC.
- -
- Vickers: 240–940 HV.
- Absolute measurement precision (by scale):
- -
- Rockwell C: ±2 HRC.
Standards
- ASTM E10—Standard Test Method for Brinell Hardness of Metallic Materials [86].
- ASTM E18–15—Standard Test Methods for Rockwell Hardness of Metallic Materials [87].
- ASTM E140—Standard Hardness Conversion Tables for Metals [88].
2.7. Repair Design
The use of thermal processes, mechanical expansion, or vibration-based methods for the intervention of the penstock is not feasible due to the impossibility of effectively isolating the structure from its surroundings. The dimensions of the pipe and its location within the rock mass mean that direct contact with the surrounding rock would rapidly dissipate any thermal input, preventing the attainment of the desired treatment temperature. Similarly, the interaction with the rock mass would affect the propagation and effectiveness of the vibration waves required for mechanical intervention methods.
The rehabilitation design addressed three key objectives:
- Release of stored elastic energy by removing fatigued material.
- Redistribution of stresses through a mechanically compensated welding strategy.
- Avoidance of thermal treatment is impossible due to the location of the pipe within the rock mass.
Because of the given conditions, a purely mechanical method was required to achieve residual stress reduction [81,89]. The design was based on the principles of the mechanics of materials: using the Poisson effect to induce compression perpendicular to tension and redistributing stresses by alternating longitudinal and transverse weld beads. This configuration was conceived as a woven stress network, similar to a textile’s warp and weft, allowing for multidirectional stress compensation. The approach considers introducing controlled compressive stresses in the critical region through the weld geometry, using the shielded metal arc welding (SMAW) technique.
For the location and referencing of the analyzed areas, the distribution of the different repair stages through a segmented, phased sequence along the affected perimeter, shown in Figure 5. This segmentation enabled residual stress measurements to be spatially correlated with the repaired zones, ensuring representative coverage of the pilot regions and the three major intervention phases. This approach aimed primarily to prevent the concentration of residual stresses and control thermal distortion by isolating and locally managing the heat input and the contractions associated with each weld segment.
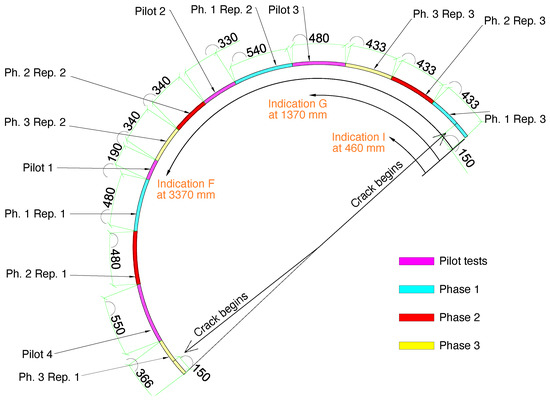
Figure 5.
Schematic representation of the circumferential segmentation of the repaired section at Branch 3A—Chivor II penstock, showing pilot test zones and the three repair phases. The diagram indicates the angular distribution of each repair and its corresponding length in millimeters.
Figure 6 summarizes the crack repair welding process. The procedure was based on a principle of mechanical compensation. First, controlled removal of the cracked material was performed, specifically eliminating the crack tips to stop its propagation. Then, a balanced welding strategy was implemented, depositing weld metal in alternating segments and orthogonal orientations. This sequence was designed to counteract contraction stresses in one direction with those generated in the perpendicular direction, taking advantage of the Poisson effect to favorably reconfigure the residual stress field without the need for thermal stress-relief treatments.
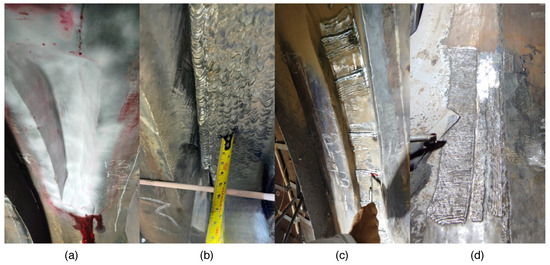
Figure 6.
Crack repair welding process: (a) crack removal and surface preparation, (b) transverse weld beads, (c) longitudinal weld beads, and (d) finished filling before surface polishing.
The proposed methodology (Figure 7) integrates diagnosis, design, and implementation to restore penstock integrity under confined conditions. It combines detailed morphological and mechanical inspections, mechanical stress analysis, and a novel cross-weld repair strategy that induces compression through geometric sequencing. This fully mechanical approach eliminates the need for heat treatment, achieving residual stress reduction and preventing crack reactivation after commissioning.
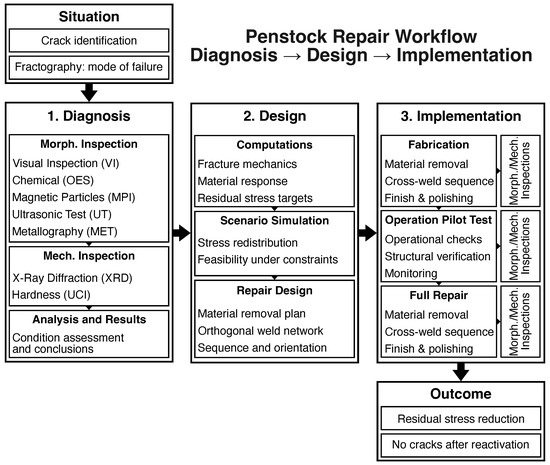
Figure 7.
Penstock repair methodology workflow.
3. Results
3.1. Implementation
The implementation began with the controlled removal of the cracked and fatigued material on both sides of the pipe (140 mm and 120 mm thickness). Ultrasonic and magnetic-particle tests guided the excavation, ensuring that only affected areas were removed while preserving structural continuity. Subsequently, residual stress measurements were repeated to confirm partial stress release. A traditional circumferential weld was ruled out, as it would have added contraction in the same direction as the pre-existing tensile stresses. Instead, a cross-weld strategy was applied: The first weld layers were circumferential. Successive layers were applied orthogonally (transversely). This generated opposite contraction effects, creating compression where tensile stresses had been measured, effectively compensating the residual field. Post-weld stress measurements confirmed a 50% reduction in shear and normal stresses in the repaired section, validating the mechanical compensation approach.
3.2. Tests and Verification
Following the welding process, all zones were re-inspected using ultrasonic testing, magnetic particle inspection, and liquid penetrant testing, confirming the absence of discontinuities. To validate performance under service conditions, three pilot repairs were implemented at different sections of the penstock (small, medium, and large). The plant was subsequently pressurized, and after 2–3 months of continuous operation, the system was re-evaluated. Residual stress mapping by X–Y ray diffraction revealed a significant reduction of tensile stresses and the establishment of compressive regions. The pilot patches, representing only 15–20% of the circumference, successfully sustained the full operational pressure of the penstock. Based on these results, the complete repair was executed in three phases covering the entire crack length. Post-repair measurements indicated that approximately 99% of the surface remained under compression, with isolated low-tensile transitions (200 MPa) surrounded by compressive fields.
3.3. Morphological Characterization—Visual Inspection
The inspection covered the entire area between the end of the Phase 01 and Repair 03 section (Figure 5), performing inspection strips of approximately 941.6 mm until the full repaired length was completed.
Visual Inspection Results Analysis
The visual inspection of the repaired joint confirmed a satisfactory surface condition and immediate structural integrity. The repair, which extends over approximately 5650 mm (equivalent to 66% of the circumference of the shell section), covers a significant thickness transition from 120 mm upstream to 140 mm downstream. The weld spans a wide circumferential arc, from the 10 o’clock to the 5 o’clock positions (roughly 300° to 150°). The flush-polished weld bead has a variable width of 150–220 mm, consistent with the geometric requirements imposed by the thickness transition and the repair’s overall length. Moreover, no surface discontinuities, such as cracks, depressions, or a visible lack of fusion, were detected, indicating effective control of both the welding process and the finishing operations. These observations, later corroborated by complementary non-destructive testing methods, support the conclusion that the weld surface is free of open defects that could act as failure initiators under normal service conditions.
3.4. Morphological Characterization—Magnetic Particle Inspection
The inspection was performed on the repaired region of joint 604/605, characterized by an approximate depth of 140 mm and fabricated from carbon steel 60/45, with the repair executed using the SMAW welding process (Figure 8). The examined section extended from the end of Phase 01–Repair 03 (West) to the beginning of Phase 03–Repair 01 (East) (Figure 5), thus encompassing the entire repaired length.
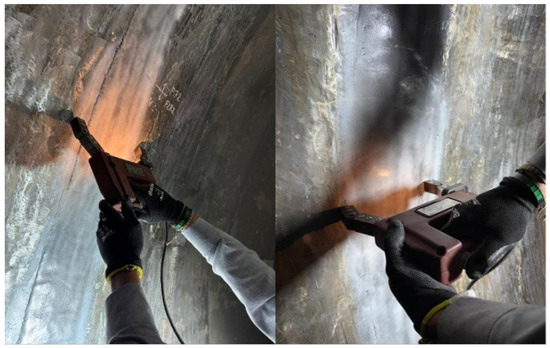
Figure 8.
Magnetic particle test performed in the repaired section of joint 604/605.
3.4.1. Magnetic Particle Inspection Results Analysis
The wet magnetic particle inspection performed on the weld surface of the shell at Branch 3A—Chivor II revealed no relevant indications. This result confirms that within the method’s sensitivity range and under the specific technical conditions of magnetization, illumination, and suspension application used during the inspection, no critical discontinuities (such as cracks, undercuts, lack of fusion, or aligned porosity) were detected in the evaluated area.
3.4.2. Morphological Characterization—Ultrasonic Testing
The inspection covered the repaired area between the end of Phase 01–Repair 03 (West) and the start of Phase 03–Repair 01 (East) (Figure 5), encompassing the entire length of the repaired section.
3.4.3. Ultrasonic Testing Results Analysis
The ultrasonic inspection identified three linear indications with planar or elongated morphologies along the repaired weld joint (Figure 9). The first indication (I) was located approximately 460 mm from the reference point, the second (G) at 1370 mm, and the third (F) at 3370 mm, taking as reference the end of Phase 01–Repair 03 (Figure 5).
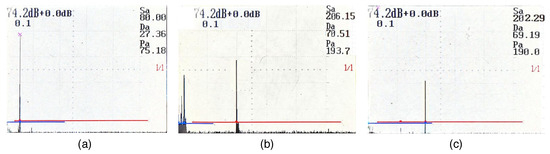
Figure 9.
Ultrasound test results: (a) Indication I, (b) Indication G, and (c) Indication F.
The repair itself extends over approximately 5650 mm (around 66% of the shell circumference) and exhibits a variable weld-bead width of 150–220 mm, suggesting possible fluctuations in welding parameters or technique. These variations are likely influenced by field conditions and the inherent complexity of executing a repair across such a pronounced thickness transition.
In accordance with ASME Section VIII, all indications were recorded and characterized. However, their final acceptance or rejection must follow the quality criteria established by the company responsible for the welding execution, which serve as the contractual technical framework for this project. In the absence of a definitive acceptance evaluation, and consistent with best practices in integrity management, it is recommended to implement a continuous monitoring program for these three indications. This program should include periodic ultrasonic inspections, with precise traceability of location, amplitude, length, and depth, along with the systematic recording of inspection data. Such an approach ensures verification of dimensional stability over time, prevents unnoticed propagation, and confirms that the repaired joint retains its capacity to withstand operational loads without compromising safety or reliability.
3.4.4. Morphological Characterization—Metallography
For the joint corresponding to branch 3A, metallographic tests were carried out on the prepared mirror-finished surface. After achieving the desired surface condition, a direct chemical etch was applied to expose the microstructure for detailed microscopic evaluation.
3.4.5. Metallography Results Analysis
Three metallographic examinations were conducted on distinct regions adjacent to the repaired weld. The first analysis, performed near the right-hand side of the weld bead (viewed from upstream), revealed a favorable microstructure characterized by uniform grain size and a high proportion of pearlite (Figure 10). Grain boundaries appeared well defined, without evidence of thickening, segregation, or heat-affected degradation.
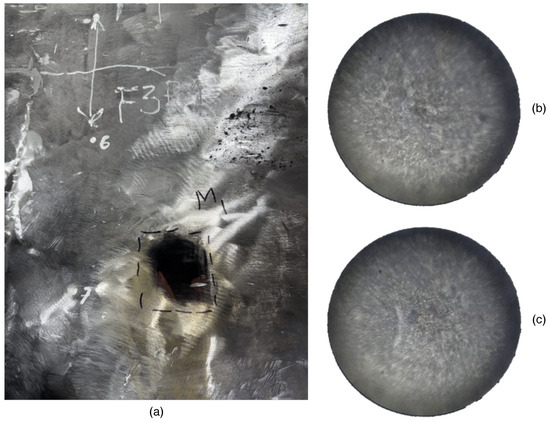
Figure 10.
Metallography results: (a) Example of sampling zone; (b) image at 500×, exhibiting pearlitic microstructure; and (c) image at 500×, exhibiting ferritic microstructure.
The second region showed a pearlitic microstructure with well-formed colonies and fine grain size, including localized cementite segregation along colony edges. The ferrite matrix surrounding these colonies contributes to ductility and crack-resistance. The third area exhibited similar features, confirming structural homogeneity across the repaired section. The microstructure consisted mainly of fine pearlite with minimal cementite inclusions and no delta ferrite (-ferrite).
Overall, the observed microstructures correspond to those expected for hypoeutectoid carbon steel (Grade 60/45) (Figure 4). Isolated micropores were detected but remained within acceptable limits. The uniform distribution of ferrite within pearlitic colonies and the absence of delta ferrite confirm a stable, mechanically reliable microstructure suitable for service conditions.
3.5. Mechanical Characterization—X-Ray Diffraction
The distribution of measurement points across the repair phases was determined by the longitudinal extent of each section, ensuring complete coverage of the repaired area. The point density was adjusted proportionally to the length of each phase to achieve statistically representative residual stress values for field conditions (Table 1). Figure 11 shows the XRD equipment in one of the measurement points.

Table 1.
Measurement matrix distribution.
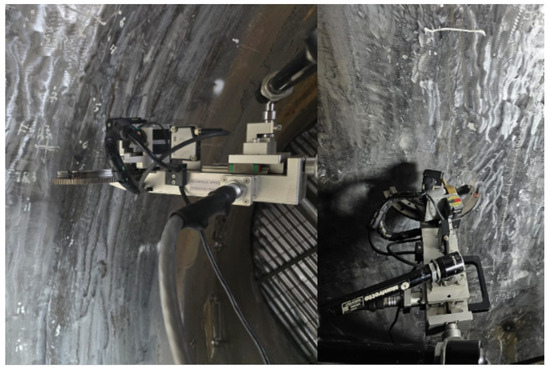
Figure 11.
X-ray diffraction equipment in place.
The following sections present the results for the three repair phases and their corresponding sub-repairs, including analyses of normal and shear residual stresses.
3.5.1. X-Ray Diffraction Repair Phase 1
Repair Phase 1 exhibits a heterogeneous distribution of normal residual stresses () (Figure 12), with marked spatial variability that depends on the sub-repair and its position relative to the weld area.
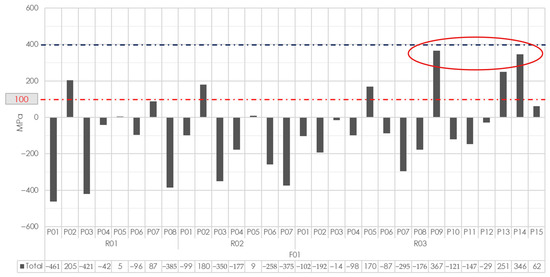
Figure 12.
Normal stress: Phase 1. Highest values are indicated with the red ellipse.
In Repair 1, the upstream points (P01–P03 in Rep. 1) show predominantly compressive behavior (average ≈−292 MPa), whereas the zone over the weld (P07–P08) shows a sharp contrast: strong compression at P08 (−385 MPa) and moderate tension at P07 (+87 MPa), suggesting an abrupt stress transition across the weld bead. Downstream (P04–P06), stresses are low and near neutral (average ≈−44 MPa), indicating partial stress relaxation.
In Repair 2, the upstream region (P01–P03) remains compressive (average ≈−183 MPa), and the weld area (P07) shows strong compression (≈−375 MPa), with no tension counterpart. Downstream stresses are moderate (average ≈−144 MPa).
Repair 3 is the most complex, exhibiting the highest residual tensile stresses (≈+220 MPa) over the weld (P13–P15) (possibly due to its greater extension). The high tensile stresses over the weld may be due to the greater extent of this sub-repair, which could hinder adequate cooling and stress redistribution. Nevertheless, the compressive base material upstream and downstream suggests an overall favorable condition.
The residual shear stresses (), shown in Figure 13, are generally moderate, with Repair 1 being low and compressive, and Repair 2 being a uniformly positive (≈13 to 28 MPa), though non-ideal, residual field. Nevertheless, Repair 3 shows a shear inversion across the weld (≈+37 to ≈ MPa), creating a very low gradient that does not increase susceptibility to fatigue failure or microstructural slippage.
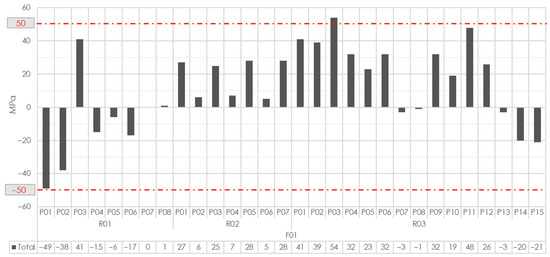
Figure 13.
Shear stress: Phase 1.
3.5.2. X-Ray Diffraction Repair Phase 2
The Repair Phase 2 exhibits a heterogeneous residual state (Figure 14), with variability in the normal residual stresses (). Specifically, Repair 2 locally presents a residual tensile stress of +235 MPa directly over the weld and a net downstream stress of +72 MPa, generating a controlled stress state that, in the long term, should be validated due to the potential evolutionary trend of residual stress that could increase its magnitude. In contrast, Repair 1 shows fully compressive stresses in all zones (between −92 and −270 MPa), while Repair 3 exhibits compression over the weld (−226 MPa) but with localized tensile peaks.
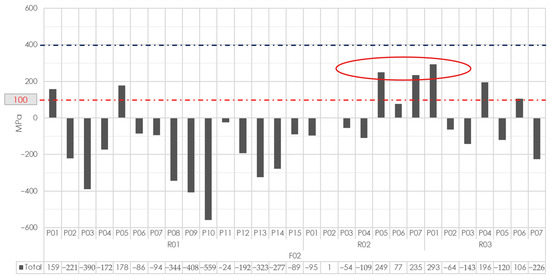
Figure 14.
Normal stress: Phase 2. Highest values are indicated with the red ellipse.
Regarding the residual shear stresses (), Phase 2 presents predominantly positive values of moderate and consistent magnitude across the three sub-repairs (Figure 15). Repair 1 shows constant and moderate shear (between +8 and +26 MPa), with a local concentration of +74 MPa upstream; Repair 2 maintains a stable positive field; and Repair 3 is mostly positive, with isolated negative readings.
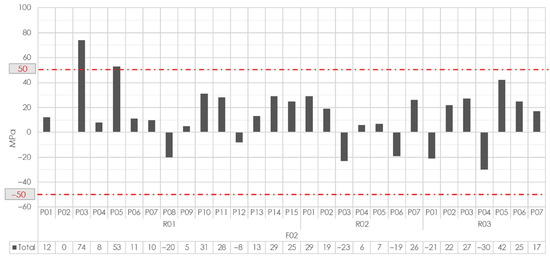
Figure 15.
Shear stress: Phase 2.
3.5.3. X-Ray Diffraction Repair Phase 3
Phase 3 exhibits a differentiated behavior in the normal residual stresses () (Figure 16), with Repair 1 being predominantly compressive, suggesting a favorable repair practice (with an exception of +114 MPa). Repair 2, however, is the least favorable, especially over and downstream of the weld, indicating a residual risk in that subregion. In contrast, Repair 3 remains largely near neutrality (between −47 and +95 MPa), with only two high-tension outliers.
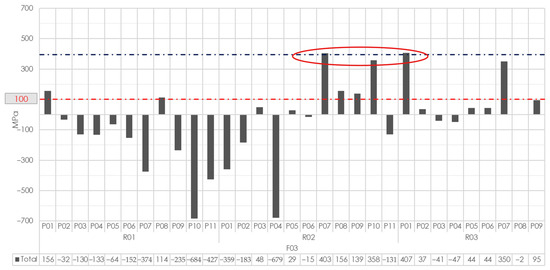
Figure 16.
Normal stress: Phase 3. Highest values are indicated with the red ellipse.
Regarding the residual shear stresses () (Figure 17), these are generally within acceptable limits. Repair 1 shows moderate shear (between +14 and +39 MPa), Repair 2 is positive and stable, and Repair 3 remains close to neutrality, with no sub-repair showing critical shear values. The integrated analysis suggests an overall acceptable stress state for operation, with most of the base material under compression or mild tension (<+100 MPa), consistent with good repair practice for confined systems. However, localized areas (Ph1–Rep3, Ph2–Rep2, and Ph3–Rep2) were identified where stresses exceed +150 MPa and approach the caution threshold, which should be included in routine monitoring programs to ensure long-term integrity.
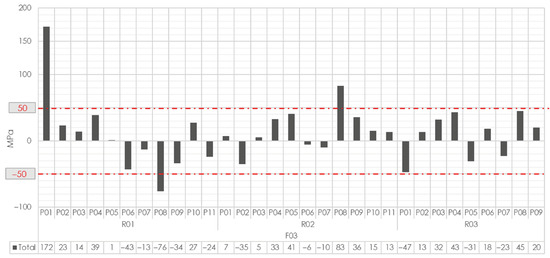
Figure 17.
Shear stress: Phase 3.
The integrated analysis of normal and shear residual stresses indicates an overall acceptable stress state for operation, with localized areas requiring monitoring. Most base material regions operate under compression or mild tension (<+100 MPa), consistent with good repair practice for constrained buried systems. Zones exceeding +150 MPa are limited and localized: Ph1–Rep3 (high tensile stress on the weld but favorable surrounding compression), Ph2–Rep2 (moderate base tension and high weld tension), and Ph3–Rep2 (tension near the caution threshold in the base material). These areas do not require corrective action but should be included in routine monitoring programs to ensure long-term integrity under service conditions.
3.6. Mechanical Characterization—Hardness
Hardness testing at the Ramal 3A joint was conducted using a 29-point matrix, distributed across three previously defined regions corresponding to the repair phases. The sampling covered the upper half of the pipe (right and left sectors), providing a representative assessment of the material’s mechanical condition after the repair. Figure 18 shows an example of a grid of hardness measurement points, corresponding to Phase 3 Rep. 2.
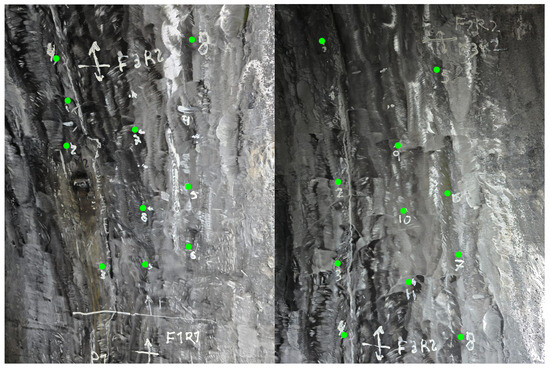
Figure 18.
Hardness measurement points (green dots): Phase 3 Rep. 2.
3.6.1. Hardness Repair Phase 1
The results from Region 1 reveal a generally desirable behavior consistent with 60/45 carbon steel specifications, with only five exceptions slightly exceeding the reference range (Figure 19). These deviations are attributed to external welding repairs and do not compromise material integrity.
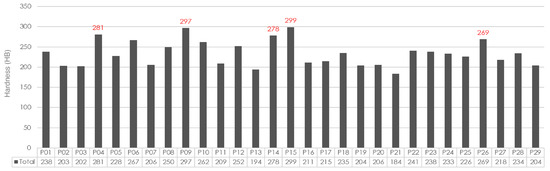
Figure 19.
Hardness values in Region 1 of Branch 3A. Repair Phase 1.
3.6.2. Hardness Repair Phase 2
Region 2 exhibits a more favorable behavior, with only two isolated readings (274 HB and 275 HB) exceeding the standard range, yet remaining within acceptable limits. The mechanical behavior of the material is not affected (Figure 20).
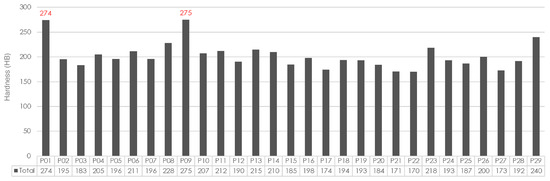
Figure 20.
Hardness values in Region 1 of Branch 3A. Repair Phase 2.
3.6.3. Hardness Repair Phase 3
Region 3 demonstrates hardness behavior similar to that of Region 2. Two values (281 HB and 295 HB) slightly exceed the limit, but these minor deviations do not compromise the material’s mechanical integrity (Figure 21).
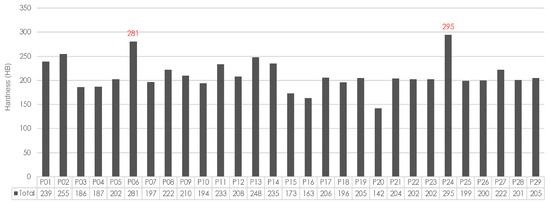
Figure 21.
Hardness values in Region 2 of Branch 3A. Repair Phase 3.
3.6.4. Hardness Results Analysis
The Brinell hardness analysis confirms that the mechanical behavior of the material is satisfactory and, in general terms, meets the technical specifications required for carbon steel 60/45. Although some measurements marginally exceeded the normative limits in the three inspection regions—five outliers in Region 1, two in Region 2 (≈274–275 HB), and two in Region 3 (≈281–295 HB)—these are considered isolated events that do not compromise the overall mechanical integrity. It is important to note that the outliers observed in Region 1 are associated with external welding repairs rather than intrinsic defects in the base metal. Meanwhile, Regions 2 and 3 exhibited a more uniform and compliant hardness behavior, supporting the conclusion that the executed repair process effectively preserved the mechanical integrity of the penstock material.
3.7. General Analysis
Finally, the considerable reduction in the magnitudes of the residual stresses (which, at several stages before and during the repair, approached the yield limit of the material, and in areas close to the crack showed clear indications of energy release) demonstrates that the weld design, including its orientation and special considerations regarding depth, thickness, and bead size, was highly effective in mitigating the adverse conditions present prior to the intervention. The impossibility of performing thermal stress-relief or vibration-based treatments required unconventional technical decisions and innovative design strategies to ensure that, even without such processes, the resulting stress magnitudes remained within safe ranges for a component of such critical importance. Consequently, the residual life of the penstock is expected to be extended based on the final residual stress results, including the predicted evolution and relaxation effects induced by future draining cycles and the natural fluctuation of operational loads.
4. Discussion
The repair process developed for Chivor II’s penstock represents a contribution to the field of hydropower rehabilitation, in particular, regarding metallic linings under access constraints. Some traditional stress-relief techniques (e.g., thermal treatment, vibratory methods, and ultrasonic impact processes) are effective in laboratory and industrial environments where temperature and geometry can be controlled. However, these methods are not practical in embedded hydropower penstocks due to the inability to disassemble, limited accessibility, and the risk of inducing rock-mass instability. The results from the experimental development conducted in Chivor II demonstrate that residual stress reconfiguration can be achieved through a purely mechanical mechanism that leverages the benefits of post-weld heat treatment without heat input. This expands the state of the art by introducing a field-adapted methodology for stress control in confined, high-pressure conduits found in aging infrastructure.
The proposed methodology applies the principles of elasticity, exploiting the Poisson effect, since the welding process induces compressive stresses perpendicular to pre-existing tensile fields. The sequence of alternating longitudinal and transverse weld beads behaves analogously to a woven structure, redistributing stresses in multiple directions to compensate for local imbalances. The repair process developed for the penstock demonstrates that a mechanics-based welding strategy can intentionally generate favorable compressive fields within a previously tensile-dominated region, offering a new framework for managing fatigue-prone components in inaccessible structures.
After three months of operation under full load conditions, no new cracks were detected, and residual stress magnitudes stabilized within non-critical ranges. Microstructural analysis revealed the absence of delta ferrite or coarse carbides, confirming that the process maintained metallurgical stability. Hardness and morphological results showed a uniformity consistent with the base metal, and the redistribution of residual stress achieved compressive dominance in the vicinity of the repaired zone. These outcomes validate that mechanical stress relief, which has been achieved through geometric and elastic manipulation, can effectively restore the integrity of a fatigued component.
The repair procedure effectively reoriented the residual stress state in the intervention zone toward a predominantly compressive regime. This redistribution not only enhances structural integrity by increasing the effective resistance of the material under service loads but also significantly extends the residual life of the component under cyclic loading. By maintaining an initial compressive stress state, the available margin for evolution toward tensile stresses during operation is expanded; therefore, a greater number of loading cycles is required before residual stresses reach critical values. Consequently, safe operational time is increased, and the susceptibility to fatigue crack initiation and propagation is markedly reduced.
The reproducibility and adaptability of the methodology are essential for its potential application to hydropower asset management. It also establishes a structured approach to life-extension interventions in embedded penstocks, involving analytical design, controlled material removal, and mechanically compensated welding. This procedure can also be standardized for other high-pressure conduits, especially in cases where heat- and/or vibration-based methods are impractical or unattainable. The Chivor II case serves as a demonstration for the hydropower sector on rehabilitation strategies.
Lastly, this process contributes to Colombia’s strategy for sustainable energy transition on a national level (which is aligned with SDG7 7 “Affordable and Clean Energy”), which not only involves developing other energy sources but also includes the modernization of hydropower installations to continue using renewable energy and also providing energy by these alternative sources. As Arango-Aramburo et al. [90] reported, nearly 70% of the country’s energy matrix relies on hydropower, and the uninterrupted operation of plants, like AES Chivor, is crucial for national energy resilience.
Despite the promising results we obtained for Chivor II, the repair process has limitations. The work required extensive testing and on-site instrumentation, which demanded a temporary stop in hydropower generation and the coordination of multidisciplinary teams under confined working conditions. These logistical constraints limited test replicability and prolonged the intervention period. Furthermore, specific geological and hydraulic conditions on-site and in these sites (such as restricted access through the rock mass and continuous water infiltration) presented other operational limitations not representative of all penstock installations.
Although not patent processes or certifications (other than the hydropower plant functioning correctly) started by this implementation, the intervention constitutes one of the few large-scale repairs ever performed in an operating hydropower facility under such restrictive conditions, making it a non-standard yet highly relevant case for reporting in the scientific/technical literature. Its documentation contributes to understanding the water–energy connection in real infrastructure, where mechanical innovation and field adaptation become essential for maintaining renewable energy generation and water conveyance reliability.
5. Conclusions
This work addressed the rehabilitation of the Chivor II penstock, which exhibited a circumferential fatigue crack. This condition posed a threat to the integrity of the hydropower project, requiring an unconventional solution compatible with the structure’s confined geometry and operational constraints. The intervention demanded a comprehensive understanding of the mechanics of materials and precise large-scale field execution to restore the functionality and safety of components that would otherwise require complete replacement.
The proposed repair methodology employed a mechanically induced compression mechanism using the Poisson effect and alternating longitudinal and transverse welding sequences to achieve multidirectional stress redistribution analogous to a woven structure. This approach replaced the need for a traditional thermal process with a purely mechanical one, enabling stress relaxation through controlled elastic deformation.
Quantitative results confirmed the effectiveness of the proposed process, with residual stresses reduced by up to 50% and 99% of the examined area left under compression. Tests performed on the structure showed no new cracking or metallurgical degradation, confirming long-term stability and ensuring the life extension of the AES Chivor hydropower project.
The methodology provides a replicable framework for large, embedded steel structures where conventional (thermal or vibration-based) stress-relief methods are unfeasible. This case represents a successful shift in hydropower rehabilitation from thermal stress relief to mechanical stress control through strategic welding design, strengthening the reliability and sustainability of water–energy infrastructure.
Author Contributions
Conceptualization, D.A.d.R., J.A.C., J.T.M., L.R., G.G.-R., A.M.-O., W.S.-L., C.N.-L. and R.E.V.; methodology, D.A.d.R., J.A.C., A.M.-O., A.F.D., D.H., C.S.-Y., S.A.-C. and J.T.M.; validation, D.A.d.R., J.A.C., J.T.M., L.R., G.G.-R., W.S.-L., C.N.-L. and R.E.V.; formal analysis, W.S.-L., C.N.-L. and R.E.V.; investigation, D.A.d.R., J.A.C., J.T.M., L.R., G.G.-R., N.C.P.-R., L.M.-C., A.M.-O., A.F.D., D.H., C.S.-Y., S.A.-C., W.S.-L., C.N.-L. and R.E.V.; writing—original draft preparation, W.S.-L., A.M.-O., C.N.-L. and R.E.V.; writing—review and editing, W.S.-L., C.N.-L. and R.E.V.; supervision, N.C.P.-R., W.S.-L., C.N.-L. and R.E.V. All authors have read and agreed to the published version of the manuscript.
Funding
This work was developed with the funding of AES Colombia and is partially registered in the Colombian Ministry of Science, Technology, and Innovation (Minciencias) as a technological development project “Desarrollo Experimental y Validación Piloto de un Proceso Avanzado de Reparación de Tuberías de Conducción para Extender Vida Útil y Confiabilidad de la Central Hidroeléctrica AES Chivor”, as allowed by the National Tax Benefits Council, Project 117172.
Data Availability Statement
The original contributions presented in this study are included in the article. Further inquiries can be directed to the corresponding author.
Conflicts of Interest
Authors David A. del Río, Johann A. Caballero, Jessica T. Muñoz, Leonardo Rojas, Gerardo Galvis-Romero, Nhora Cecilia Parra-Rodriguez, and Laidi Morales-Cruz were employed by the company AES Corporation and AES Colombia. Authors Alejandro Morales-Ortiz, Andrés F. Duque, Daniel Hincapié, Camilo Seifert-Yepes, and Sebastián Acuña-Carmona were employed by the company Consulta Inteligente. The remaining authors declare that the research was conducted in the absence of any commercial or financial relationships that could be construed as a potential conflict of interest.
Abbreviations
The following abbreviations are used in this manuscript:
| API | American Petroleum Institute |
| ASME | American Society of Mechanical Engineers |
| ASTM | ASTM International, formerly known as American Society for Testing and Materials |
| IEA | International Energy Agency |
| MET | Metallography |
| MPI | Magnetic Particle Inspection |
| OES | Optical Emission Spectrometry |
| SDG | Sustainable Development Goal |
| SMAW | Shielded Metal Arc Welding |
| UCI | Ultrasonic Contact Impedance |
| UT | Ultrasonic Test |
| VI | Visual Inspection |
| XRD | X-Ray Diffraction |
References
- United Nations. World Population Prospects 2024: Summary of Results; Techreport desa/pop/2024/tr/no. 9; United Nations Population Fund: New York, NY, USA, 2024. [Google Scholar]
- IEA. World Energy Outlook 2024; Technical Report WEO-2024; International Energy Agency: Paris, France, 2024. [Google Scholar]
- IEA and the World Bank. Sustainable Energy for All 2017—Progress Toward Sustainable Energy (Summary); Technical Report; World Bank: Washington, DC, USA, 2017. [Google Scholar]
- United Nations. The Sustainable Development Goals Report 2024; Department of Economic and Social Affairs: New York, NY, USA, 2024; Available online: https://unstats.un.org/sdgs/report/2024/ (accessed on 14 December 2024).
- Su, H.; Hu, J.; Yang, M.; Wen, Z. Assessment and prediction for service life of water resources and hydropower engineering. Nat. Hazards 2015, 75, 3005–3019. [Google Scholar] [CrossRef]
- Stoll, B.; Andrade, J.; Cohen, S.; Brinkman, G.; Martinez-Anido, C.B. Hydropower Modeling Challenges; Technical Report NREL/TP-5D00-68231; National Renewable Energy Laboratory: Golden, CO, USA, 2017. [Google Scholar]
- Malovic, D.; Engelmann-Pilger, H.; Arsenijevic, N.; Gassner, K.B.; Merle-Beral, E.; Monti, G.; Pooley, J.; Inouye, L.K.; Levin, J.; Kellenberg, J. Hydroelectric Power: A Guide for Developers and Investors; Technical Report 99392; World Bank Group: Washington, DC, USA, 2015. [Google Scholar]
- Ioannou, A.; Angus, A.; Brennan, F. Risk-based methods for sustainable energy system planning: A review. Renew. Sustain. Energy Rev. 2017, 74, 602–615. [Google Scholar] [CrossRef]
- Yaseen, Z.M.; Ameen, A.M.S.; Aldlemy, M.S.; Ali, M.; Afan, H.A.; Zhu, S.; Al-Janabi, A.M.S.; Al-Ansari, N.; Tiyasha, T.; Tao, H. State-of-the art-powerhouse, dam structure, and turbine operation and vibrations. Sustainability 2020, 12, 1676. [Google Scholar] [CrossRef]
- Shaktawat, A.; Vadhera, S. Risk management of hydropower projects for sustainable development: A review. Environ. Dev. Sustain. 2020, 23, 45–76. [Google Scholar] [CrossRef]
- Celebioglu, K.; Ayli, E.; Ulucak, O.; Aradag, S.; Westerman, J. Critical decision making for rehabilitation of hydroelectric power plants. Energy Sources Part A Recover. Util. Environ. Eff. 2023, 45, 10073–10106. [Google Scholar] [CrossRef]
- del Río, D.A.; Moffett, H.; Nieto-Londoño, C.; Vásquez, R.E.; Escudero-Atehortúa, A. Chivor’s Life Extension Project (CLEP): From Sediment Management to Development of a New Intake System. Water 2020, 12, 2743. [Google Scholar] [CrossRef]
- Fry, J.J.; Morris, M.; Schleiss, A. Hydropower, a catalyst for energy transition in Europe. LHB Hydrosci. J. 2022, 108, 2058829. [Google Scholar] [CrossRef]
- Diaz-Arellano, P.; Jaque-Castillo, E.; Ojeda, C.G. Presión Hídrica en Ambientes Lacustres de Alta Montaña: Entre el Cambio Climático y el Desarrollo Energético. Laguna del Laja, Chile. Diálogo Andino 2018, 55, 143–158. [Google Scholar] [CrossRef]
- Angarita, H.; Wickel, A.J.; Sieber, J.; Chavarro, J.; Maldonado-Ocampo, J.A.; Herrera-R, G.A.; Delgado, J.; Purkey, D. Basin-scale impacts of hydropower development on the Mompós Depression wetlands, Colombia. Hydrol. Earth Syst. Sci. 2018, 22, 2839–2865. [Google Scholar] [CrossRef]
- Anderson, E.P.; Jenkins, C.N.; Heilpern, S.; Maldonado-Ocampo, J.A.; Carvajal-Vallejos, F.M.; Encalada, A.C.; Rivadeneira, J.F.; Hidalgo, M.; Cañas, C.M.; Ortega, H.; et al. Fragmentation of Andes-to-Amazon connectivity by hydropower dams. Sci. Adv. 2018, 4, eaao1642. [Google Scholar] [CrossRef]
- Díaz, G.; Arriagada, P.; Górski, K.; Link, O.; Karelovic, B.; Gonzalez, J.; Habit, E. Fragmentation of Chilean Andean rivers: Expected effects of hydropower development. Rev. Chil. Hist. Nat. 2019, 92, 1. [Google Scholar] [CrossRef]
- Atkins, E. Contesting the ‘greening’ of hydropower in the Brazilian Amazon. Political Geogr. 2020, 80, 102179. [Google Scholar] [CrossRef]
- World Water Council. Analysis of the 3rd World Water Forum; Technical report; World Water Council: Marseille, France, 2003. [Google Scholar]
- Kougias, I.; Aggidis, G.; Avellan, F.; Deniz, S.; Lundin, U.; Moro, A.; Muntean, S.; Novara, D.; Pérez-Díaz, J.I.; Quaranta, E.; et al. Analysis of emerging technologies in the hydropower sector. Renew. Sustain. Energy Rev. 2019, 113, 109257. [Google Scholar] [CrossRef]
- Schleiss, A.J.; Manso, P.A. Design of pressure relief valves for protection of steel-lined pressure shafts and tunnels against buckling during emptying. Rock Mech. Rock Eng. 2012, 45, 11–20. [Google Scholar] [CrossRef]
- Tun, S.W.; Singal, S.K. Management of Hydropower Tunnels to Prevent Collapse and Remedial Measures. Hydro Nepal J. Water Energy Environ. 2016, 19, 31–37. [Google Scholar] [CrossRef]
- Panthi, K.K.; Basnet, C.B. Review on the Major Failure Cases of Unlined Pressure Shafts/Tunnels of Norwegian Hydropower Projects. Hydro Nepal J. Water Energy Environ. 2016, 18, 6–15. [Google Scholar] [CrossRef][Green Version]
- Kawamura, F.; Miura, M.; Ebara, R.; Yanase, K. Material strength of long-term used penstock of a hydroelectric power plant. Case Stud. Struct. Eng. 2016, 6, 103–114. [Google Scholar] [CrossRef][Green Version]
- Bonapace, P.; Hammer, A.; Maldet, R.; Schüller, O. The renewal of the pressure shaft for the Kaunertal high-head hydropower plant in Austria. Steel Constr. 2016, 6, 257–264. [Google Scholar] [CrossRef]
- Bonapace, P.; Hammer, A. Strain measurements at the transition from a rock supported to an unsupported steel lined pressure tunnel at the Kaunertal hydropower station. Geomech. Tunn. 2017, 10, 602–610. [Google Scholar] [CrossRef]
- Yang, F.; Zhang, C.; Zhou, H.; Liu, N.; Zhang, Y.; Azhar, M.U.; Dai, F. The long-term safety of a deeply buried soft rock tunnel lining under inside-to-outside seepage conditions. Tunn. Undergr. Space Technol. 2017, 67, 132–146. [Google Scholar] [CrossRef]
- Xiao, M.; Zhao, C. Stability Analysis of Steel Lining at Pressure Diversion Tunnel Collapse Zone during Operating Period. Math. Probl. Eng. 2017, 2017, 3280414. [Google Scholar] [CrossRef]
- Sheikh, K.A.; Saif, A. Steel Fibre-Reinforced Shotcrete as an alternative to conventional concrete tunnel lining: A case study of Gulpur Hydropower Project. Geomech. Geoengin. 2020, 15, 252–262. [Google Scholar] [CrossRef]
- Liu, T.J.; Chen, S.W.; Lin, P.Q.; Liu, H.Y. Failure mechanism and strengthening effect of shield tunnel lining reinforced by steel plates with corbels. Eur. J. Environ. Civ. Eng. 2022, 26, 1603–1621. [Google Scholar] [CrossRef]
- del Río, D.A.; Caballero, J.A.; Muñoz, J.T.; Parra-Rodriguez, N.C.; Nieto-Londoño, C.; Vásquez, R.E.; Escudero-Atehortua, A. Design of a Self-Supporting Liner for the Renovation of a Headrace Tunnel at Chivor Hydropower Project. Water 2023, 15, 409. [Google Scholar] [CrossRef]
- U.S. Department of the Interior, Bureau of Reclamation. Facilities Instructions, Standards, and Techniques (FIST)—Volume 2-8: Inspection of Steel Penstocks and Pressure Conduits; Technical Report FIST 021; Power Resources Office, Technical Service Center: Denver, CO, USA, 2022.
- Omara, A.M.; Guice, L.K.; Straughan, W.T.; Akl, F.A. Buckling models of thin circular pipes encased in rigid cavity. J. Eng. Mech. 1997, 123, 1294–1301. [Google Scholar] [CrossRef]
- Haddouch, M.; Hajjout, I.; Boudi, E.M. Sizing optimization of exposed steel penstocks supported by ring girders using the combined ANN-GA technique. Structures 2020, 24, 705–716. [Google Scholar] [CrossRef]
- Hou, J.-G.; An, X.-W.; He, Y.-M. Comments on design methods of penstocks. J. Press. Vessel Technol. Trans. ASME 2004, 126, 391–398. [Google Scholar] [CrossRef]
- Bobet, A.; Nam, S. Stresses around pressure tunnels with semi-permeable liners. Rock Mech. Rock Eng. 2007, 40, 287–315. [Google Scholar] [CrossRef]
- Vasilikis, D.; Karamanos, S.A. Stability of confined thin-walled steel cylinders under external pressure. Int. J. Mech. Sci. 2009, 51, 21–32. [Google Scholar] [CrossRef]
- Hachem, F.; Schleiss, A.J. The design of steel-lined pressure tunnels and shafts. Int. J. Hydropower Dams 2009, 16, 2009. [Google Scholar]
- Valdeolivas, J.L.; Mosquera, J.C. A full 3D finite element model for buckling analysis of stiffened steel liners in hydroelectric pressure tunnels. J. Press. Vessel Technol. Trans. ASME 2013, 135, 061205. [Google Scholar] [CrossRef]
- Lin, P.; Zhou, Y.; Liu, H.; Wang, C. Reinforcement design and stability analysis for large-span tailrace bifurcated tunnels with irregular geometry. Tunn. Undergr. Space Technol. 2013, 38, 189–204. [Google Scholar] [CrossRef]
- Cerjak, H.; Enzinger, N.; Pudar, M. Development, experiences and qualification of steel grades for hydropower conduits. Steel Constr. 2013, 6, 265–270. [Google Scholar] [CrossRef]
- Simanjuntak, T.D.; Marence, M.; Mynett, A.E.; Schleiss, A.J. Pressure tunnels in non-uniform in situ stress conditions. Tunn. Undergr. Space Technol. 2014, 42, 227–236. [Google Scholar] [CrossRef]
- Pachoud, A.J.; Schleiss, A.J. Stresses and displacements in steel-lined pressure tunnels and shafts in anisotropic rock under quasi-static internal water pressure. Rock Mech. Rock Eng. 2016, 49, 1263–1287. [Google Scholar] [CrossRef]
- Bobet, A.; Yu, H. Full stress and displacement fields for steel-lined deep pressure tunnels in transversely anisotropic rock. Tunn. Undergr. Space Technol. 2016, 56, 125–135. [Google Scholar] [CrossRef]
- Zhang, C.; Liu, N.; Chu, W. Key technologies and risk management of deep tunnel construction at Jinping II hydropower station. J. Rock Mech. Geotech. Eng. 2016, 8, 499–512. [Google Scholar] [CrossRef]
- Palmström, A. The design of unlined hydropower tunnels and shafts: 100 years of Norwegian experience. Publ. Hydropower Dams Issue Three 2017, 24, 72–79. [Google Scholar]
- Kravanja, S. Optimization of a Steel Penstock With Stiffener Rings. Elektronički Časopis Građevinskog Fakulteta Osijek 2018, 9, 64–73. [Google Scholar] [CrossRef]
- Wang, Y.; Cao, R.; Pi, J.; Jiang, L.; Zhao, Y. Mechanical properties and analytic solutions of prestressed linings with un-bonded annular anchors under internal water loading. Tunn. Undergr. Space Technol. 2020, 97, 103244. [Google Scholar] [CrossRef]
- Hu, J.; Yang, J.; He, X.; Zhao, Z.; Yang, J. Transient analysis of a hydropower plant with a super-long headrace tunnel during load acceptance: Instability mechanism and measurement verification. Energy 2023, 263, 125671. [Google Scholar] [CrossRef]
- Bulloch, J.; Callagy, A. An detailed integrity assessment of a 25 MW hydro-electric power station penstock. Eng. Fail. Anal. 2010, 17, 387–393. [Google Scholar] [CrossRef]
- Nicolet, C.; Berthod, R.; Ruchonnet, N.; Avellan, F. Evaluation of possible penstock fatigue resulting from secondary control for the grid. In Proceedings of the HYDRO 2010, Lisbon, Portugal, 27–29 September 2010. [Google Scholar]
- Dwivedi, R.; Singh, M.; Viladkar, M.; Goel, R. Prediction of tunnel deformation in squeezing grounds. Eng. Geol. 2013, 161, 55–64. [Google Scholar] [CrossRef]
- Nicolet, C.; Bollaert, E. Hydroelectric Power Plant Real-Time Monitoring System and Method. Patent EP2801879B1, 27 September 2017. [Google Scholar]
- Nicolet, C.; Dreyer, M.; Béguin, A.; Bollaert, E. Hydraulic Transient Survey at Cleuson-Dixence with Real-Time Hydro-Clone Monitoring System. In Proceedings of the HYDRO 2018, Gdansk, Poland, 15–17 October 2018. [Google Scholar]
- Dreyer, M.; Nicolet, C.; Gaspoz, A.; Biner, D.; Rey-Mermet, S.; Saillen, C.; Boulicaut, B. Digital clone for penstock fatigue monitoring. IOP Conf. Ser. Earth Environ. Sci. 2019, 405, 012013. [Google Scholar] [CrossRef]
- Song, S.; Feng, X.; Liao, C.; Cai, D.; Liu, Z.; Yang, Y. Measures for controlling large deformations of underground caverns under high in-situ stress condition—A case study of Jinping I hydropower station. J. Rock Mech. Geotech. Eng. 2016, 8, 605–618. [Google Scholar] [CrossRef]
- Pachoud, A.J.; Berthod, R.; Manso, P.; Schleiss, A. Advanced models for stress evaluation and safety assessment in steel-lined pressure tunnels. Hydropower Dams 2018, 25, 77–82. Available online: http://infoscience.epfl.ch/record/258073 (accessed on 15 October 2025).
- Liu, F.; Ma, T.; Tang, C.; Chen, F. Prediction of rockburst in tunnels at the Jinping II hydropower station using microseismic monitoring technique. Tunn. Undergr. Space Technol. 2018, 81, 480–493. [Google Scholar] [CrossRef]
- Li, H.; Xu, B.; Riasi, A.; Szulc, P.; Chen, D.; M’zoughi, F.; Skjelbred, H.I.; Kong, J.; Tazraei, P. Performance evaluation in enabling safety for a hydropower generation system. Renew. Energy 2019, 143, 1628–1642. [Google Scholar] [CrossRef]
- Chhushyabaga, B.; Karki, S.; Khadka, S. Fault induced problems in hydropower tunnels in Nepal: A case study. Lowl. Technol. Int. 2020, 21, 255–267. [Google Scholar]
- Ning, Y.; Yan, Z.; Zeng, Y.; Zhang, C.; Dong, Y. Deterioration mechanism and stochastic damage modeling of tunnel lining concrete in hydrothermal corrosive environments. Sci. Rep. 2025, 15, 24445. [Google Scholar] [CrossRef]
- Ma, Y.; Fu, J.; Zhang, Q.; Liu, X.; Chen, B.; Yan, G.; Shi, H. Research on Concrete Crack Detection in Hydropower Station Burial Engineering Based on Quantum Particle Technology. Sensors 2025, 25, 683. [Google Scholar] [CrossRef]
- Ma, Z.; Zhang, Y.; He, J.; Huang, S.; Wu, H.; Shi, C. Analytical model for concrete crack width of steel lined reinforced concrete penstock. Structures 2024, 66, 106803. [Google Scholar] [CrossRef]
- Xu, K.; Qiao, G.y.; Shi, X.b.; Xiao, F.r. Effect of stress-relief annealing on the fatigue properties of X80 welded pipes. Mater. Sci. Eng. A 2021, 807, 140854. [Google Scholar] [CrossRef]
- Rani, K.U.; Kumar, R.; Mahapatra, M.M.; Mulik, R.S.; Świerczyńska, A.; Fydrych, D.; Pandey, C. Wire Arc Additive Manufactured Mild Steel and Austenitic Stainless Steel Components: Microstructure, Mechanical Properties and Residual Stresses. Materials 2022, 15, 7094. [Google Scholar] [CrossRef] [PubMed]
- Wang, L.; Qian, X. Welding residual stresses and their relaxation under cyclic loading in welded S550 steel plates. Int. J. Fatigue 2022, 162, 106992. [Google Scholar] [CrossRef]
- Huang, G.; Liu, R.; Hu, S. Investigation of the mechanism for reduction of residual stress through magnetic-vibration stress relief treatment. J. Magn. Magn. Mater. 2023, 582, 171041. [Google Scholar] [CrossRef]
- Xu, W.; Zhang, J.; Zhong, R.; Yang, J.; Han, D.; Ji, P.; Lian, Y.; Zhang, B.; Liu, B. Residual Stress Relaxation and Microstructure Evolution in Cold Radial Forged High-Strength Steel Tube Using Thermal-Vibratory Stress Relief Technique. J. Mater. Eng. Perform. 2023, 33, 2064–2076. [Google Scholar] [CrossRef]
- Cioroagă, B.D.; Socalici, A.V.; Cioată, V.G.; Linul, E.; Hulka, I.; Anghel, I.M. Influence of Submerged Arc Welding Current Intensity on the Mechanical Properties and Microstructure of Pressure Vessel P355N Steel. Materials 2024, 17, 3520. [Google Scholar] [CrossRef]
- API Standard 1104; Welding of Pipelines and Related Facilities. American Petroleum Institute (API): Washington, DC, USA, 2021.
- ASME B31.8; Gas Transmission and Distribution Piping Systems. American Society of Mechanical Engineers (ASME): New York, NY, USA, 2022.
- American Society of Mechanical Engineers (ASME). ASME Boiler and Pressure Vessel Code, Section VIII, Division 1: Rules for Construction of Pressure Vessels; ASME: New York, NY, USA, 2025. [Google Scholar]
- Wu, Q.; Dong, K.; Qin, X.; Hu, Z.; Xiong, X. Magnetic particle inspection: Status, advances, and challenges—Demands for automatic non-destructive testing. NDT E Int. 2024, 143, 103030. [Google Scholar] [CrossRef]
- Yan, X.; Wang, H.; Fan, X. Research Progress in Nonlinear Ultrasonic Testing for Early Damage in Metal Materials. Materials 2023, 16, 2161. [Google Scholar] [CrossRef]
- Alqurashi, I.; Alver, N.; Bagci, U.; Catbas, F.N. A Review of Ultrasonic Testing and Evaluation Methods with Applications in Civil NDT/E. J. Nondestruct. Eval. 2025, 44, 53. [Google Scholar] [CrossRef]
- Pashangeh, S.; Ghasemi Banadkouki, S.S.; Besharati, F.; Mehrabi, F.; Somani, M.; Kömi, J. Color Light Metallography Versus Electron Microscopy for Detecting and Estimating Various Phases in a High-Strength Multiphase Steel. Metals 2021, 11, 855. [Google Scholar] [CrossRef]
- ASTM E407–07(2015); Standard Practice for Microetching Metals and Alloys. ASTM International: West Conshohocken, PA, USA, 2015. [CrossRef]
- ASTM E3–11; Standard Guide for Preparation of Metallographic Specimens. ASTM International: West Conshohocken, PA, USA, 2011. [CrossRef]
- ASTM E112–10; Standard Test Methods for Determining Average Grain Size. ASTM International: West Conshohocken, PA, USA, 2010. [CrossRef]
- Lodh, A.; Thool, K.; Samajdar, I. X-ray Diffraction for the Determination of Residual Stress of Crystalline Material: An Overview. Trans. Indian Inst. Met. 2022, 75, 983–995. [Google Scholar] [CrossRef]
- Tabatabaeian, A.; Ghasemi, A.R.; Shokrieh, M.M.; Marzbanrad, B.; Baraheni, M.; Fotouhi, M. Residual Stress in Engineering Materials: A Review. Adv. Eng. Mater. 2021, 24, 2100786. [Google Scholar] [CrossRef]
- ASTM E915–19; Standard Test Method for Verifying the Alignment of X-Ray Diffraction Instrumentation for Residual Stress Measurement. ASTM International: West Conshohocken, PA, USA, 2019. [CrossRef]
- UNI EN 15305; Non-Destructive Testing—Test Method for Residual Stress Analysis by X-Ray Diffraction. UNI Ente Nazionale Italiano di Unificazione: Milano, Italy, 2008.
- ASTM A1038–19; Standard Test Method for Ultrasonic Contact Impedance (UCI) Hardness Testing of Metallic Materials. ASTM International: West Conshohocken, PA, USA, 2019. [CrossRef]
- Richardson, J. Hardness Testers: Know the Options for Best Results. AM&P Tech. Artic. 2025, 183, 31–34. [Google Scholar] [CrossRef]
- ASTM E10–18; Standard Test Method for Brinell Hardness of Metallic Materials. ASTM International: West Conshohocken, PA, USA, 2018. [CrossRef]
- ASTM E18–15; Standard Test Methods for Rockwell Hardness of Metallic Materials. ASTM International: West Conshohocken, PA, USA, 2015. [CrossRef]
- ASTM E140–12B(2019)e1; Standard Hardness Conversion Tables for Metals Relationship Among Brinell Hardness, Vickers Hardness, Rockwell Hardness, Superficial Hardness, Knoop Hardness, and Scleroscope Hardness. ASTM International: West Conshohocken, PA, USA, 2019. [CrossRef]
- Li, X.; Liu, J.; Wu, H.; Miao, K.; Wu, H.; Li, R.; Liu, C.; Fang, W.; Fan, G. Research progress of residual stress measurement methods. Heliyon 2024, 10, e28348. [Google Scholar] [CrossRef]
- Arango-Aramburo, S.; Turner, S.W.D.; Daenzer, K.; Ríos-Ocampo, J.P.; Hejazi, M.I.; Kober, T.; Álvarez Espinosa, A.C.; Romero-Otalora, G.D.; van der Zwaan, B. Climate impacts on hydropower in Colombia: A multi-model assessment of power sector adaptation pathways. Energy Policy 2019, 128, 179–188. [Google Scholar] [CrossRef]
Disclaimer/Publisher’s Note: The statements, opinions and data contained in all publications are solely those of the individual author(s) and contributor(s) and not of MDPI and/or the editor(s). MDPI and/or the editor(s) disclaim responsibility for any injury to people or property resulting from any ideas, methods, instructions or products referred to in the content. |
© 2025 by the authors. Licensee MDPI, Basel, Switzerland. This article is an open access article distributed under the terms and conditions of the Creative Commons Attribution (CC BY) license (https://creativecommons.org/licenses/by/4.0/).