Abstract
Water-sediment regulation Scheme (WSRS) is a crucial artificial control method for water and sediment in the lower reaches of the Yellow River (YR). During this period, the impact of high flow discharge and high sediment concentration on the distribution and transport of heavy metals in the Yellow River warrants particular attention. This study analyzes heavy metals in water and suspended sediments across different phases of the WSRS. During the WSRS, the lower Yellow River showed decreased levels of dissolved heavy metals. Evaluations of the ecological risk posed by Cd, Cu, Ni, Pb, Zn, and Cr in suspended sediments suggested an absence of risk or minimal risk levels. A greater percentage of Cd and Pb was found in bioavailable forms. And RAC analysis further revealed that Cd poses a relatively higher migration risk. Compared to the water regulation stage (WRS), the sediment regulation stage (SRS) was characterized by lower dissolved heavy metal concentrations but higher particulate heavy metal contents. Over 85% of heavy metals were transported by SPM in WSRS. During the sediment regulation phase, the mean particulate transport proportion for heavy metals surpassed 96%. This phase accounted for more than 50% of the total heavy metal flux delivered to the sea throughout the entire regulation period. These findings offer valuable insights into controlling and managing heavy metal risks during WSRS in the YR.
1. Introduction
Both bedload and suspended sediment transport are fundamental modes of sediment movement in river systems. However, in plain regions, suspended sediment constitutes the dominant form of transport, while bedload transport is often negligible []. Suspended sediment can be carried over long distances by flow and can significantly influence the migration and transformation of aquatic pollutants—such as organic pollutants, nutrients, and heavy metals—through adsorption and desorption processes [,,,]. Additionally, suspended sediment reduces light penetration, thereby limiting phytoplankton abundance and biomass [], and exhibits buffering capacity for nutrients like nitrogen and phosphorus []. Studies further highlight that SPM acts as a major carrier for heavy metals in the fluvial ecosystem []. The redistribution of heavy metals among the water, suspended particles, and sediments poses considerable risks to aquatic ecosystems and public health [,,]. These multifaceted impacts underscore the importance of SPM in aquatic environmental assessment and management, making it a key focus of contemporary research.
Heavy metals (e.g., Pb, Hg, Cd) are known for their toxicity, potential for bioaccumulation, and resistance to biodegradation in aquatic environments. They readily bioaccumulate through trophic transfer, posing considerable risks to aquatic ecosystems and human health [,]. Within aquatic systems, heavy metals partition between particulate and dissolved phases [,]. Their distribution coefficients (Kd) and mobility are governed by multiple environmental factors, including pH, salinity, dissolved organic matter, temperature, grain size of SPM, flow velocity, and others [,,]. Although the dissolved fraction of heavy metals in natural waters is generally low, it tends to exhibit higher bioavailability and toxicity to aquatic organisms and humans [] (Nannan Zhang, 2014). In contrast, the bioavailability of heavy metals associated with SPM is more closely related to their chemical speciation []. Studies indicate that under high SPM conditions, heavy metals migrate predominantly in the particulate phase []. Furthermore, anthropogenic activities such as regulated flow and sediment pulses—for instance, high-discharge reservoir releases and sediment flushing operations—can amplify this process, markedly altering spatial and temporal patterns of heavy metals in rivers [].
The YR is one of the world’s most sediment-laden rivers. Its lower reach traverses the North China Plain, a region of low-gradient topography that serves as the primary zone of sediment deposition. In recent decades, due to soil and water conservation measures on the Loess Plateau, the operation of water control structures, and shifts in precipitation patterns, both the mean annual concentration of suspended sediment and total sediment load in the lower YR have significantly decreased [,,]. Notably, since the initiation of the WSRS in 2002, managed flood peaks (discharges exceeding 2600 m3/s) have been generated through coordinated releases from major reservoirs such as Sanmenxia, Wanjiazhai, and XLD, aimed at altering the water-sediment regime in the downstream channel. The intra-annual variations in runoff and sediment concentration within the lower YR have become increasingly marked [,]. According to the Yellow River Sediment Bulletin (2023), the flood season at HYK Station contributes 35.3% of the annual runoff and 61.7% of the annual sediment discharge. The maximum recorded sediment concentration reached 63.1 kg/m3, significantly higher than the annual average of 4.01 kg/m3. Studies have shown that anthropogenic modifications to sediment transport, particularly through reservoir regulation, considerably affect the concentrations, speciation, and fluxes of heavy metals in large river systems, as evidenced by studies of the Lancang River [], Danube [], Yangtze [], and Yellow River []. However, the influence of high-concentration suspended sediments during the WSRS on the speciation and transport of trace heavy metals along the middle and lower YR (XLD to YRE) has received limited attention.
This study investigated the river reach from XLD to YRE, monitoring the dissolved and particulate concentrations of six heavy metals (Cd, Cr, Ni, Pb, Zn, and Cu) during the WRS, SRS, and After-WSRS. It aimed to elucidate the impacts of high runoff and high-concentration suspended sediments on the partition coefficients and mobility of heavy metals between the dissolved and particulate phases across spatial and temporal dimensions. Furthermore, the study assessed the bioavailability and ecological risk of heavy metals during the Water-Sediment Regulation Period. The findings enhance our understanding of the role of suspended sediments in heavy metal transport and inform strategies for controlling and managing heavy metal risks during the Yellow River’s WSRS.
2. Materials and Methods
2.1. Study Area
The YR rises in the Bayan Har Mountains of Qinghai Province and has a total length of 5464 km. Its main channel flows through nine autonomous regions and provinces of China before discharging into the Bohai Sea [,]. This study focuses on the reach from the XLD Reservoir to the YR estuary, extending approximately from 112.55° E to 119.16° E and from 34.87° N to 37.76° N, covering a river distance of about 878.5 km and a drainage area of 81,400 km2 [] (Figure 1). Taohuayu (in Henan Province) is conventionally regarded as the boundary between the middle and lower reaches of the Yellow River []. Owing to the low-gradient topography of the lower basin, the river channel becomes wider and shallower, leading to substantial deposition of SPM and a gradual elevation of the riverbed. This landform has resulted in the world-famous “perched river” phenomenon [].
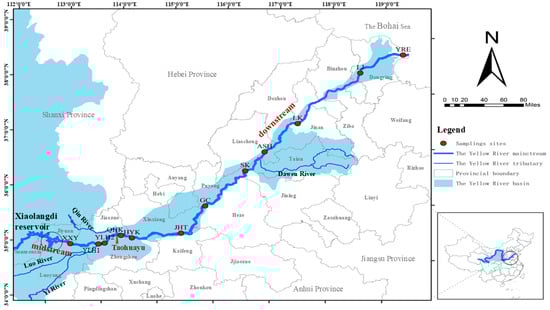
Figure 1.
Study area and sampling point locations. Note: Sampling site names and abbreviations: Xixiayuan (XXY), Upper Yiluo River (YLH1), Lower Yiluo River (YLH2), Qinhekou (QHK), Huayuankou (HYK), Jiahetan (JHT), Gaocun (GC), Sunkou (SK), Aishan (ASH), Luokou (LK), Lijin (LJ), Yellow River Estuary (YRE).
2.2. Sampling Collection
Annually, between June and July, water and sediment regulation operations are carried out on the Yellow River, depending on the storage conditions of Sanmenxia, Xiaolangdi, and other major reservoirs, as well as the annual water inflow and sediment load. The process is typically divided into two distinct phases: the WRS and the SRS, together lasting approximately 26 days. The 2023 Yellow River Water-Sediment Regulation Scheme took place over 26 days, from 21 June to 16 July. The WRS was implemented from 21 June to 4 July, inducing sustained high-discharge flows through controlled gate openings to scour the downstream channel. This was followed by the SRS from 5 July to 16 July, which involved drawing down reservoir water levels to induce density currents, thereby helping to modify sedimentation patterns and flush accumulated sediments from the reservoirs.
This study established 12 sampling points along the lower reach of the YR to align with the distribution of hydrological stations (Figure 1). Specific coordinates are provided in Table S1. Sampling was conducted during three phases of the 2023 WSRS: the WRS (28–30 June), the SRS (7–13 July), and the After-WSRS period (22–24 August). At each sampling point, one sample was collected per phase, resulting in a total of 36 samples. Water samples were collected at a depth of approximately 0.5 m using a water sampler (2L Plexiglass Water Sampler, Xinchangyuan, Xinxiang, China) and transferred into sampling bottles. The collected samples were transported to the laboratory under dark conditions at 0–4 °C. Six environmental parameters—pH, total dissolved solids (TDS), temperature (T), dissolved oxygen (DO), among others—in situ measurements were conducted with a portable multiparameter water quality meter (YSI ProQuatro, Yellow Springs, OH, USA). The results are summarized in Table S2.
2.3. Sampling Analysis
Water samples were filtered through a 0.45 μm membrane filter. The filtrate was acidified with two drops of concentrated nitric acid to a pH < 2 to suppress metal adsorption and precipitation. Dissolved metal concentrations in the acidified filtrate were determined using inductively coupled plasma mass spectrometry (ICP-MS, Agilent 7800, Santa Clara, CA, USA). The method detection limits were as follows: Cu 0.08 μg/L, Ni 0.06 μg/L, Pb 0.09 μg/L, Cr 0.11 μg/L, Zn 0.67 μg/L, and Cd 0.05 μg/L. The suspended sediment retained on the filter was digested in a graphite digestion furnace (Hanon, SH220F, Jinan, China) using a mixture of concentrated acids (9 mL HNO3 + 5 mL HF + 1 mL HClO4) for total metal content analysis. Heavy metal speciation in the suspended sediment during the sediment discharge period was analyzed using a modified BCR sequential extraction procedure []. Detailed steps of the BCR method are provided in Table S3. Concentrations of Cu, Ni, Pb, Cr, and Zn in the suspended sediment were measured by inductively coupled plasma optical emission spectrometry (ICP-OES, Agilent 5110, USA). The method detection limits were 0.1, 0.04, 0.08, 0.5, and 0.07 mg/kg for Cu, Ni, Pb, Cr, and Zn, respectively. The Cd content in the suspended sediment was determined using a Graphite Furnace Atomic Absorption Spectrophotometer (Model: TAS-990 SUPER AFG, Beijing, China), with a method detection limit of 0.01 mg/kg. Analytical quality assurance was performed using certified reference materials for lake sediment (GBW 07436). All extractions and measurements were conducted in triplicate, and the relative standard deviation (RSD) of replicate analyses was consistently below 5%.
Additionally, the median particle size D50 of SPM was measured using an online wet-method laser particle size analyzer (Bate, BT-Onlinel2, Dandong, China), while the specific surface area SSA of SPM was determined using a specific surface area analyzer (Bestar, BSD-PS2-1574, Beijing, China).
During the water diversion and sediment flushing period, flow and sediment concentration data at each sampling point were obtained from real-time monitoring records at hydrological stations.
2.4. Assessment Methods
The geo-accumulation index (Igeo) [] and the potential ecological risk index (RI) [] were employed to evaluate the total heavy metal risk in suspended sediments. Ratio of Secondary Phase and Primary Phase (RSP) [,] and the Risk Assessment Code (RAC) to evaluate the ecological risk of suspended sediment heavy metal speciation. Relevant calculation formulas are provided in Text S1, and parameter classifications are detailed in Table S13. The heavy metal content in alluvial soils of the lower Yellow River was selected as the background value [].
2.5. Data Processing and Analysis
Microsoft Excel 2024 and Origin 2024 were used for data processing. ArcGIS® (10.2) was employed to generate point distribution maps and spatial distribution maps of heavy metal evaluation indicators.
3. Results
3.1. Hydrological and SPM Characteristics
The Xiaolangdi Reservoir plays a pivotal role in the YR’s water and sediment regulation, controlling 100% of the sediment load delivered to the middle and lower reaches []. As illustrated in Figure 2, the average daily discharge during the 2023 WRS at Xiaolangdi was 3870 m3/s, with flows sustained above 4000 m3/s for eight consecutive days to facilitate scouring of the downstream channel. During the subsequent sediment regulation stage, the average daily discharge decreased to 1290 m3/s. Following the water and sediment regulation operations, the discharge dropped markedly. From 22 to 24 August, the average flow in the lower YR measured 512 m3/s, representing an 80.82% reduction compared to the regulation period. The sediment regulation stage was characterized by high sediment concentrations, with a daily average of 38.37 kg/m3 at Xiaolangdi Station and a peak concentration of 442 kg/m3 recorded at 10:48 on 7 July. Influenced by the regulated releases from XLD Reservoir, both flow and sediment concentrations in the downstream sections exhibited clear phased variations (Figure 3). Due to gravitational settling, sediment concentrations gradually decreased along the course of the river.
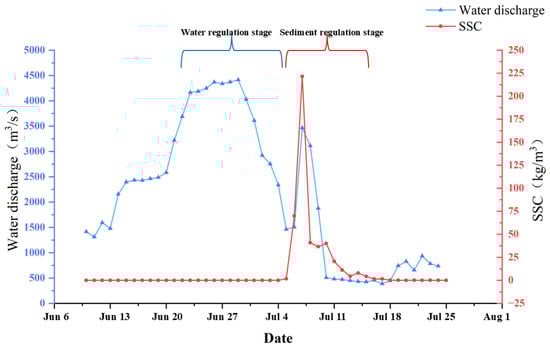
Figure 2.
The flow and sediment concentration at Xiaolangdi during the WSRS in the YR.
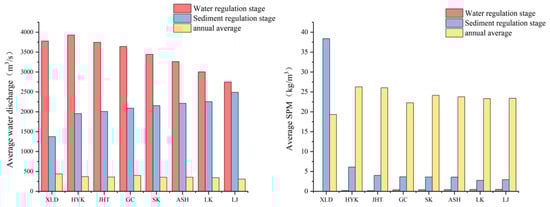
Figure 3.
Flow and sediment content along the lower reaches of the YR in 2023.
During all stages of the WSRS, the median particle size of SPM gradually decreased along the flow direction (Figure 4). The median particle size during the WRS (0.023 mm) was significantly larger than that during the SRS (0.011 mm). During the After-WSRS, the median particle size remained relatively high upstream of HUK but decreased markedly further downstream. Particle size analysis of suspended sediments (Table S4) indicated that both the water and sediment regulation stages were dominated by fine particles. As shown in Figure 4, the average specific surface area (SSA) of suspended sediments ranked in the following order: SRS (21.997 m2/g) > WRS (13.421 m2/g) > After-WSRS (0.293 m2/g). Variability in SSA was relatively low during the water regulation stage and After-WSRS, whereas the sediment regulation stage exhibited greater fluctuation. The mean coefficients of variation were as follows: After-WSRS (50.07%) > SRS (43.85%) > WRS (21.95%).
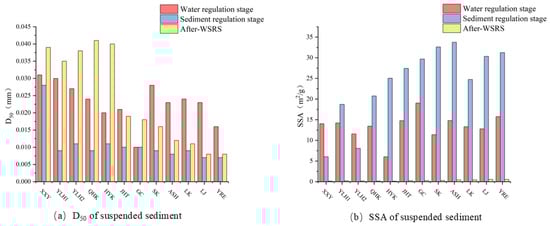
Figure 4.
D50 and SSA of suspended sediment.
3.2. Spatial and Temporal Distribution Characteristics of Heavy Metals
3.2.1. Dissolved Heavy Metals in WSRS
Dissolved heavy metal concentrations are summarized in Table S5. The results indicate that: (1) All measured concentrations of dissolved heavy metals in the lower YR were below the Class II standard for surface water in China. (Cd < 0.005 mg/L; Ni < 0.02 mg/L; Pb < 0.01 mg/L; Cr < 0.05 mg/L; Zn < 1.0 mg/L; Cu < 1.0 mg/L). (2) During the WSRS, the longitudinal variations in dissolved heavy metal concentrations (Cu, Ni, Pb, Cr, Zn, and Cd) are shown in Figure 5a. Except for Cd, the concentrations of other heavy metals exhibited significant fluctuations along the course during the water regulation stage. Particularly, the concentrations were relatively higher in the reach from QH to SK and at the LJ station. (3) The concentrations of Cu, Pb, Zn, and Cd followed the order: WRS > SRS > After-WSRS, while Ni and Cr showed the order: WRS > After-WSRS > SRS. The average concentrations of heavy metals along the course during the WRS were significantly higher than those in other periods, with Pb concentrations reaching 60 times and Ni 18 times those during the SRS. In the After-WSRS, Cu, Pb, Zn, and Cd decreased by 58–80% compared to the sediment-flushing period, while Ni and Cr showed a slight rebound. During both the SRS and the After-WSRS, dissolved heavy metal levels exhibited minimal variation along the river and remained consistently low.
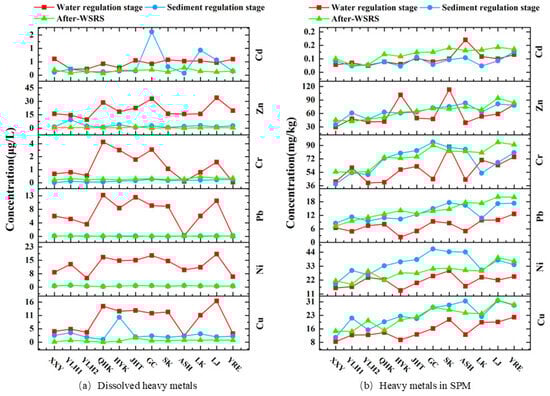
Figure 5.
Dissolved heavy metals (a) and heavy metals in suspended sediment (b) at all points of the lower Yellow River concentration change.
3.2.2. Heavy Metals in SPM
Significant differences in heavy metal concentrations within suspended sediments were observed between the sediment regulation and water regulation stages (Table S5). With the exception of Cd, which remained relatively stable, the concentrations of Zn, Pb, Ni, Cr, and Cu were 1.2 to 1.5 times higher during the WRS than during the SRS. Following the regulation period, however, Cd levels increased significantly by 70%, reaching 0.102 mg/kg, while the other elements remained at or slightly below the concentrations recorded during the sediment regulation stage. During the WSRS, an increasing trend of heavy metals in the suspended sediment was observed along the river course. This trend was more pronounced during the SRSe and After-WSRS (Figure 5b). During the SRS, the concentrations of Ni, Cr, Pb, Cd, Zn, and Cu in suspended sediments at the Yellow River Estuary (YRE) station were 1.8, 2.1, 2.0, 1.8, 2.2, and 2.7 times higher, respectively, than those at the XXY Station.
3.3. Ecological Risk Assessment of Suspended Sediment and Heavy Metals
The geo-accumulation index (Igeo) results (Table S6) indicate that 9.72% of the heavy metals in the suspended sediments from the middle and lower YR were at a moderately polluted level across the different periods, while the remainder showed no pollution. As shown in Figure 6, moderate pollution was primarily associated with Ni and Cr and was concentrated in the river reach from JHT to the YRE during the SRS and After-WSRS. The results of the potential ecological risk index (RI) (Figure 7, Table S7) revealed the following order of heavy metal risk across different periods: After-WSRS (53.298) > sediment regulation stage (40.467) > water regulation stage (37.744). All periods exhibited a low ecological risk level. The contribution of individual heavy metals to the total ecological risk, determined by their potential ecological risk factor, consistently followed the order: Cd > Ni > Cu > Pb > Cr > Zn, with Cd being the predominant risk factor.
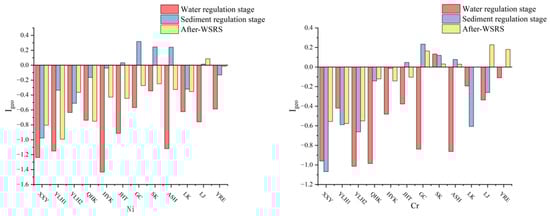
Figure 6.
Ni and Cr of Igeo in the study area.
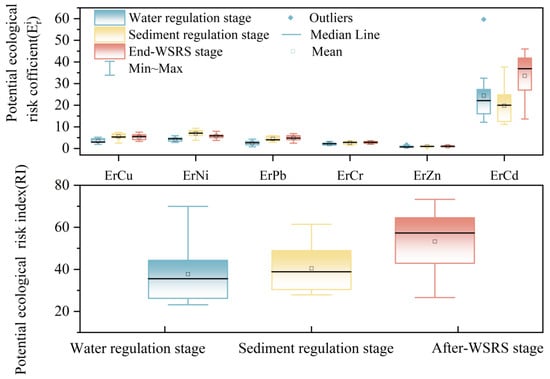
Figure 7.
RI values of Cd in the study area.
3.4. Suspended Sediment Heavy Metal Occurrence Forms During the Sediment Regulation Stage
The speciation of heavy metals in suspended sediment during the SRS is presented in Table S8. Results indicate that, except for Pb, which predominantly exists in a reducible form, the other five heavy metals primarily occur in a residual form. The average proportion of biologically available forms along the flow path for the six heavy metals was: Pb (60.7%) > Cd (41.5%) > Cu (26%) > Ni (27.3%) > Zn (20.4%) > Cr (10.0%), as shown in Figure 8.
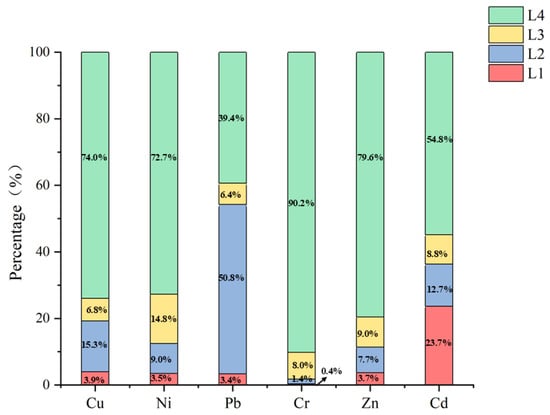
Figure 8.
Average value of heavy metal forms in the river section.
The results of RSP are presented in Table S9. The mean RSP values for each heavy metal along the river course were ranked in the following order: Pb (1.60) > Cd (0.86) > Ni (0.39) > Cu (0.38) > Zn (0.28) > Cr (0.11). Lead was associated with a mild ecological risk, which was particularly pronounced at the Lijin and estuary sections (Figure 9). The results of the RAC are shown in Table S10. The average mobility risks along the river were ranked as: Cd (25.82%) > Cu (4.28%) > Zn (4.26%) > Ni (3.80%) > Pb (3.33%) > Cr (0.38%). Further RAC analysis indicated a higher migration risk for Cd, with moderate to high risk values primarily occurring in the reaches from XXY to QHK and from LK to YRE (Figure 9).
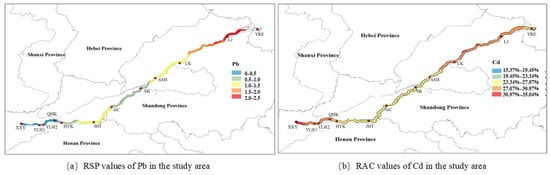
Figure 9.
Analysis of heavy metal speciation.
4. Discussion
4.1. Impact of SPM on Dissolved Heavy Metals Concentration
During the 2023 WSRS, dissolved heavy metal concentrations complied with the Yellow River’s water environmental control standards. However, compared to other major rivers, certain heavy metal levels were elevated relative to those reported for the Huai River [], the Yangtze River [], and Thailand’s Chao Phraya River []. The lower Yellow River forms an elevated channel situated above the surrounding floodplain, with no significant contributions from external surface runoff or industrial wastewater. As a result, flow velocity and sediment load become the primary factors governing dissolved heavy metal concentrations during the regulation period. The sustained high discharge (approx. 4000 m3/s) during the WRS intensified hydrodynamic forces, resulting in substantial scouring of the downstream channel [] and resuspension of coarse bed sediments []. This process prompted the desorption of heavy metals from sediment particles, leading to a notable increase in dissolved metal concentrations []. In contrast, during the SRS, the release of fine-grained sediments from Xiaolangdi Reservoir [] caused a sharp increase in the downstream sediment load—nearly six times that observed during the water regulation stage. Concurrently, reduced flow rates minimized bed sediment resuspension, shifting the composition of suspended sediments toward fine-grained silt []. These finer particles possess a larger specific surface area, which promotes the adsorption of heavy metal ions []. Although some particulate-bound metals were still released into the water due to hydrodynamic disturbances during this stage, desorption was considerably weaker compared to the water regulation stage. Therefore, the dissolved heavy metal concentrations were markedly lower during the SRS.
4.2. Interactions Between the Water Phase and the Particulate Phase
Heavy metal concentrations in the water of the lower Yellow River remain at relatively low levels. However, elements such as Cd and Pb exhibit significant toxicity even at trace concentrations []. Consequently, the solid–liquid partitioning process of heavy metals in water is a critical issue, as it determines their mobility and toxicity in estuaries and coastal marine environments []. The transport ratio R and distribution coefficient Kd are the most commonly used methods to characterize the solid–liquid speciation of heavy metals in water []. The calculation formulas are as follows. The results are presented in Table S11.
R = (SSC × C_si)/(C_wi + SSC × C_si)
K_d = C_si/C_wi
In the equation, SSC, Csi, and Cwi represent suspended sediment content (kg/m3), heavy metal i concentration in suspended sediment (mg/kg), and dissolved concentration of heavy metal i in water (μg/L), respectively.
R describes the proportion of heavy metals transported in particulate form. As shown in Figure 10a, the average transport ratios R for Cu, Ni, Pb, Cr, Zn, and Cd during the water regulation stage were 64.6%, 65.9%, 55.5%, 96.1%, 73.5%, and 18.7%, respectively. During the SRS, these ratios were 99.7%, 99.9%, 100%, 100%, 99.9%, and 81.4%. During the WSRS, the proportion of particulate heavy metals transported in the lower reaches of the YR was higher than that in Thailand’s Mong River and China’s Pearl River [,]. This indicates that under the influence of WSRS, heavy metals in the lower reaches of the Yellow River are more likely to be transported in the form of particulate matter.
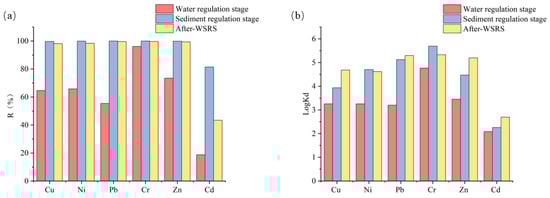
Figure 10.
(a) Heavy Metal Transport Ratio and (b) LogKd.
Distribution coefficients are typically denoted as logKd. As shown in Figure 10b, lgKd values during the water regulation stage were Cr (4.76) > Zn (3.45) > Cu (3.26) > Ni (3.25) > Pb (3.20) > Cd (2.09), while during the sediment regulation stage they were Cr (5.69) > Pb (5.12) > Ni (4.70) > Zn (4.47) > Cu (3.93) > Cd (2.26). The logKd values for Cr, Zn, Cu, Ni, and Pb all exceed 3, indicating strong adsorption capacity by SPM []. In contrast, Cd exhibits a relatively low logKd value, suggesting a greater tendency for Cd to exist in dissolved form in water, endowing it with strong mobility. Liu’s study [] confirmed that Cd primarily binds to SPM is dominated by mineral precipitation and oxygen-containing functional groups. This fixation method, achieved through carbonate and hydroxide precipitates, is unstable and prone to releasing Cd during abrupt changes in hydrological conditions. This also explains the high dissolved Cd concentrations and smaller R and Kd values observed.
Numerous factors influence the Kd value, including temperature, pH, Eh, sediment concentration, sediment specific surface area, and mineral content [,]. During the water and sediment regulation period, the lower reaches of the YR exhibit weakly alkaline water bodies and an oxidizing environment. Water quality parameters such as temperature, pH, and Eh remain relatively stable. Therefore, it can be inferred that the concentration and characteristics of suspended sediment are the most critical factors influencing the Kd value. The higher sediment concentration, larger sediment specific surface area, and greater proportion of clay in suspended sediment during the sediment regulation stage result in higher heavy metal LgKd values compared to the water regulation stage, indicating stronger heavy metal capture capacity of suspended sediment.
4.3. Impact of SPM on Heavy Metals Flux
The LJ Hydrological Station, located 104 km from the YR estuary, is the final hydrological station along the main stem of the YR. Therefore, based on the station’s flow, sediment load monitoring data, and heavy metal measurements, the heavy metal discharge flux into the sea during the WSRS was estimated. This methodology is justified given the relatively scarce availability of monitoring data []. The calculation formula is as follows []:
F_di = k × C_di × Q × T
F_si = k × C_si × SSC × Q × T
F_i = F_di + F_si
In the equation, F_i denotes the total flux of heavy metal i (t), F_(di)(t) represents the dissolved heavy metal flux, F_(si)(t) indicates the particulate heavy metal flux, Q (m3/s) is the flow rate, T (d) is time, k is the unit conversion coefficient (10−9), and the meanings of C_di, C_si, and SSC are defined in Section 4.2.
The heavy metal flux to the sea is governed by changes in both flow discharge and heavy metal concentrations in the water-sediment system, with the former being driven by runoff, tributary contributions, and rainfall patterns. In contrast, concentration variations are largely determined by the adsorption and natural settlement characteristics of suspended sediments, the input of heavy metals from runoff, and non-point source pollution in the floodplain areas of the Lower Yellow River.
In 2023, WSRS operated for 26 days, accounting for 7.1% of the year, including 14 days during the WRS and 12 days during the sand discharge period. Table S13 shows that during WSRS periods, the total fluxes of Cu, Ni, Pb, Cr, Zn, and Cd reached 335.91 t, 386.16 t, 181.71 t, 624.83 t, 833.51 t, and 4.50 t, respectively. During the sand discharge period, these fluxes accounted for 73.3%, 74.2%, 70.4%, 81.2%, 74.1%, and 54.2% of the total fluxes, respectively. These results are consistent with those reported by Xuekai Dou et al. []. During the WSRS, heavy metal fluxes entering the sea were significantly influenced by suspended sediment, with particulate-form heavy metal pollutants predominating in the Bohai Sea. Particulate-phase heavy metal fluxes for Cu, Ni, Pb, Cr, Zn, and Cd accounted for 81.85%, 83.71%, 79.55%, 98.88%, 85.94%, and 13.56% of total fluxes, respectively, representing relatively high levels compared to the Pearl River, Yalu River [], and Loire River in France []. As shown in Figure 11, the daily fluxes of all six heavy metals during the discharge period positively correlated with both discharge volume and sediment load (daily flux-discharge: R2 > 0.95; daily flux-sediment load: R2 > 0.68). This indicates that daily fluxes in this phase were influenced by both discharge volume and sediment load, with discharge volume exerting a more significant effect. Conversely, during the sediment discharge period, daily heavy metal fluxes were primarily controlled by sediment load.
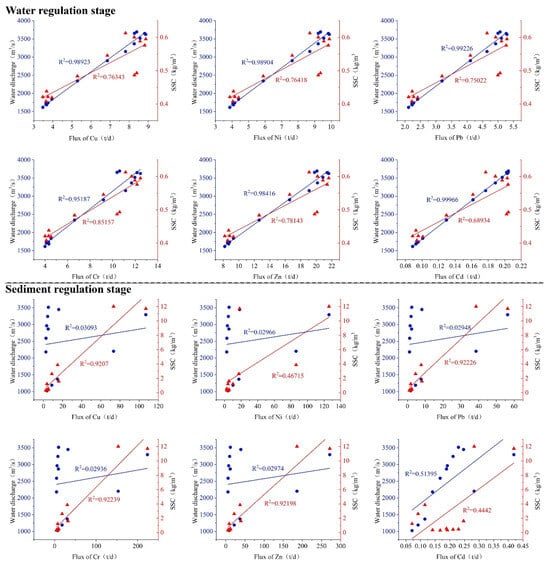
Figure 11.
Relationship Between Heavy Metal Discharge Flux into the Sea and Flow Rate and Sediment Concentration in Lijin During WSRS.
During WSRS, heavy metal fluxes entering the sea constitute a significant proportion of annual fluxes [], with substantial quantities entering the Bohai Sea in particulate form. Due to their non-degradability, bioaccumulation potential, and toxicity, these metals pose heightened environmental risks []. As sediments accumulate in estuaries, heavy metal hazards shift from the water to sediments, impacting the ecological environment at river mouths [].
4.4. Comparative Assessment of Heavy Metal Form Risk and Total Risk During the Sediment Regulation Stage
Assessments of the Igeo and the RI are based on total heavy metal concentrations []. The Igeo assessment indicates that 41.67% of sampling points exhibit mild contamination with Ni and Cr, while the RI assessment identifies Cd as the primary risk factor. RSP and RAC are risk assessments based on the speciation of heavy metals [,]. Both assessments indicate relatively high ecological risks for Pb and Cd. The results of the total pollution assessment do not fully align with those of the ecological risk assessment based on speciation. The primary reason is that during the sediment regulation stage, the suspended sediment’s Pb and Cd heavy metals are predominantly composed of bioavailable forms (exchangeable form F1, reducible form F2, oxidizable form F3), accounting for 60.7% and 41.5% of the average distribution along the course, respectively. These forms are readily absorbed and utilized by plants and animals []. Consequently, the ecological and environmental risks of these two elements are dominated by their bioavailable forms, which exhibit greater mobility and biological availability [].
Although Ni and Cr were assessed as mildly polluting in the Igeo evaluation, this method only considers pollution caused by total heavy metal content while neglecting environmental toxicity and bioavailability, thus failing to accurately reflect the true ecological hazard []. While the RI assessment identified risks from Cd [], its limitations in not accounting for bioavailability led to an underestimation of Pb’s ecological risk. Generally, only a fraction of heavy metals in sediments can be absorbed and utilized by plants and animals due to migration and availability. Therefore, integrating speciation forms into heavy metal ecological risk assessments yields more accurate and comprehensive results.
5. Conclusions
During the 2023 WSRS, heavy metal concentrations in the lower reaches of the YR met China’s water environmental management requirements. Compared to the water regulation stage, dissolved heavy metals were lower during the sediment regulation stage, but particulate heavy metals were higher. Ecological risk assessments indicate that suspended sediment heavy metals overall posed no risk or low risk, with Cd exhibiting the highest ecological risk and mobility. During the SRS, 99% of heavy metals existed in particulate form. The average transport ratio exceeded 96%, with the SRS contributing over 50% of the total flux entering the sea during the WSRS. Sediments are transported in particulate form and rapidly deposited into the Bohai Sea, where they accumulate in the estuary. This process can elevate the ecological risks of heavy metals in the estuarine region. Therefore, greater attention should be paid to the potential risks of heavy metal pollution associated with suspended sediment transport in the water-sediment management regime of the lower Yellow River. On one hand, it is essential to strengthen the monitoring of key ecological risk factors, such as Cd, during the WSRS. On the other hand, given that the particulate form represents the dominant carrier of heavy metals during this phase, it is imperative to incorporate monitoring of particulate heavy metals into the ecological management plan for water-sediment regulation.
Supplementary Materials
The following supporting information can be downloaded at: https://www.mdpi.com/article/10.3390/w17223272/s1, Table S1. Location information of sampling sites in the lower Yellow River. Table S2. Description statistics of physical and chemical properties of water and suspended sediment during the water regulation stage, sediment regulation stage and after-WSRS stage in 2023. Table S3. Procedure and reagents for BCR sequential extraction. Table S4. Composition of suspended sediment particles during water regulation stage and sediment regulation stage (%). Table S5. Descriptive Statistics of Heavy Metals in Water Bodies and Suspended Sediment in the Lower Reaches of the Yellow River. Table S6. Descriptive statistics of geoaccumulation indexes (Igeo) of heavy metals in suspended sediment during water regulation stage, sediment regulation stage and after-WSRS stage. Table S7. Descriptive statistics of potential ecological risk index RI of heavy metals in suspended sediment. Table S8. Description and statistics of heavy metal occurrence forms in suspended sediment during the Sediment regulation stage. Table S9. Descriptive statistics of ratio of secondary phase and primary phase (RSP) of heavy metals in suspended sediment during sediment regulation stage. Table S10. Descriptive statistics of RAC of heavy metals in suspended sediment during sediment regulation stage. Table S11. The water-sediment transport ratio and LogKd during water and sediment adjustment. Table S12. Average fluxes of various heavy metals into the sea at the Lijin Hydrological Station during water and sediment regulation periods. Table S13. Classification of metal contamination for each assessment method.
Author Contributions
Conceptualization, Y.Y. and X.C.; methodology, Y.Y.; software, X.C.; validation, Y.Y., X.C. and R.H.; formal analysis, B.H.; investigation, Y.Z.; resources, Y.Y.; data curation, X.W.; writing—original draft preparation, X.C.; writing—review and editing, Y.Y.; visualization, J.H.; supervision, M.S.; project administration, Y.B.; funding acquisition, Y.Y. All authors have read and agreed to the published version of the manuscript.
Funding
This research was funded by the Open Project Fund of Henan Key Laboratory of Ecological Environment Protection and Restoration of Yellow River Basin (Grant No. LYBEPR202403), the Special Fund of the State Key Joint Laboratory of Environment Simulation and Pollution Control (Grant No. 20L03ESPC), the Key Scientific Research Project of Colleges and Universities of the Henan Education Department (Grant No. 17A570001).
Data Availability Statement
The original contributions presented in this study are included in the article/Supplementary Material. Further inquiries can be directed to the corresponding author.
Acknowledgments
Gratitude is extended to all contributors for their assistance in both fieldwork and documentation.
Conflicts of Interest
The authors declare no conflicts of interest.
References
- Zhang, G.; Zhou, S.; Wang, Y.; Liu, Y. Research Progress and Outlook on Sediment Transport Problems. J. Water Resour. Arch. Eng. 2019, 17, 8–15. [Google Scholar]
- Wilkinson, J.L.; Hooda, P.S.; Swinden, J.; Barker, J.; Barton, S. Spatial distribution of organic contaminants in three rivers of Southern England bound to suspended particulate material and dissolved in water. Sci. Total Environ. 2017, 593–594, 487–497. [Google Scholar] [CrossRef] [PubMed]
- Rügner, H.; Schwientek, M.; Milačič, R.; Zuliani, T.; Vidmar, J.; Paunović, M.; Laschou, S.; Kalogianni, E.; Skoulikidis, N.T.; Diamantini, E.; et al. Particle bound pollutants in rivers: Results from suspended sediment sampling in Globaqua River Basins. Sci. Total Environ. 2019, 647, 645–652. [Google Scholar] [CrossRef] [PubMed]
- Shi, Z.L.; Wang, Y.Y.; Wen, A.B.; Yan, D.C.; Chen, J.C. Tempo-spatial variations of sediment-associated nutrients and contaminants in the Ruxi tributary of the Three Gorges Reservoir, China. J. Mt. Sci. 2018, 15, 319–326. [Google Scholar] [CrossRef]
- Zhao, K.; Wang, Q.; Qian, S.; Li, F. Spatial and temporal distribution characteristics of antibiotics and heavy metals in the Yitong River basin and ecological risk assessment. Sci. Rep. 2023, 13, 4202. [Google Scholar] [CrossRef]
- Bharathi, M.D.; Sarma, V.V.S.S. Impact of monsoon-induced discharge on phytoplankton community structure in the tropical Indian estuaries. Reg. Stud. Mar. Sci. 2019, 31, 100795. [Google Scholar] [CrossRef]
- Jin, X.; Zhang, W.; Li, S. Complex responses of suspended particulate matter in eutrophic river and its indicative function in river recovery process. Ecol. Indic. 2020, 115, 106397. [Google Scholar] [CrossRef]
- Zou, X.; Li, Y.; Wang, L.; Ahmed, M.K.; Chen, K.; Wu, J.; Xu, Y.; Lin, Y.; Xiao, X.; Chen, B. Distribution and assessment of heavy metals in suspended particles in the Sundarban mangrove river, Bangladesh. Mar. Pollut. Bull. 2022, 181, 113856. [Google Scholar] [CrossRef]
- Li, W.; Qian, H.; Xu, P.; Zhang, Q.; Chen, J.; Hou, K.; Ren, W.; Qu, W.; Chen, Y. Distribution characteristics, source identification and risk assessment of heavy metals in surface sediments of the Yellow River, China. Catena 2022, 216, 106376. [Google Scholar] [CrossRef]
- Feng, C.; Guo, X.; Yin, S.; Tian, C.; Li, Y.; Shen, Z. Heavy metal partitioning of suspended particulate matter–water and sediment–water in the Yangtze Estuary. Chemosphere 2017, 185, 717–725. [Google Scholar] [CrossRef]
- Dhiman, A.; Ramanthan, A.L.; Macklin, M.; Yadav, S.; Kushwaha, S.; Mudbhatkal, A.; Senapathi, V. Heavy metal distribution in various environmental matrices and their risk assessment in Ganga River Basin, India. Hum. Ecol. Risk Assess. 2023, 29, 621–650. [Google Scholar] [CrossRef]
- Niampradit, S.; Kiangkoo, N.; Mingkhwan, R.; Kliengchuay, W.; Worakhunpiset, S.; Limpananont, Y.; Hongsibsong, S.; Inthorn, D.; Tantrakarnapa, K. Occurrence, distribution, and ecological risk assessment of heavy metals in Chao Phraya River, Thailand. Sci. Rep. 2024, 14, 8366. [Google Scholar] [CrossRef]
- Khan, K.; Younas, M.; Sharif, H.M.A.; Wang, C.; Yaseen, M.; Cao, X.; Zhou, Y.; Ibrahim, S.M.; Yvette, B.; Lu, Y. Heavy metals contamination, potential pathways and risks along the Indus Drainage System of Pakistan. Sci. Total Environ. 2022, 809, 151994. [Google Scholar] [CrossRef]
- Liu, H.; Ding, C.; Zhang, G.; Guo, Y.; Song, Y.; Thangaraj, S.; Zhang, X.; Sun, J. Dissolved and particulate heavy metal pollution status in seawater and sedimentary heavy metals of the Bohai Bay. Mar. Environ. Res. 2023, 191, 106158. [Google Scholar] [CrossRef] [PubMed]
- Mwanuzi, F.; De Smedt, F. Heavy metal distribution model under estuarine mixing. Hydrol. Process. 1999, 13, 789–804. [Google Scholar] [CrossRef]
- Zhang, L.; Wu, Y.; Yang, J.; Li, P.; Ni, Z.; Huang, X. Hydrodynamics and dissolved organic matter regulate partitioning behaviour of heavy metals in seawater in a human-impacted subtropical estuary. Environ. Pollut. 2025, 383, 126854. [Google Scholar] [CrossRef] [PubMed]
- Jia, Z.; Li, S.; Liu, Q.; Jiang, F.; Hu, J. Distribution and partitioning of heavy metals in water and sediments of a typical estuary (Modaomen, South China): The effect of water density stratification associated with salinity. Environ. Pollut. 2021, 287, 117277. [Google Scholar] [CrossRef]
- Zhang, N.; Zang, S.; Sun, Q. Health risk assessment of heavy metals in the water environment of Zhalong Wetland, China. Ecotoxicology 2014, 23, 518–526. [Google Scholar] [CrossRef]
- Dong, J.; Xia, X.; Liu, Z.; Zhang, X.; Chen, Q. Variations in concentrations and bioavailability of heavy metals in rivers during sediment suspension-deposition event induced by dams: Insights from sediment regulation of the Xiaolangdi Reservoir in the Yellow River. J. Soils Sediments 2018, 19, 403–414. [Google Scholar] [CrossRef]
- Liu, X.; Sheng, Y.; Liu, Q.; Li, Z. Suspended particulate matter affects the distribution and migration of heavy metals in the Yellow River. Sci. Total Environ. 2024, 912, 169537. [Google Scholar] [CrossRef]
- Zhao, Q.; Ding, S.; Lu, X.; Liang, G.; Hong, Z.; Lu, M.; Jing, Y. Water-sediment regulation scheme of the Xiaolangdi Dam influences redistribution and accumulation of heavy metals in sediments in the middle and lower reaches of the Yellow River. Catena 2022, 210, 105880. [Google Scholar] [CrossRef]
- Wang, H.; Sun, F. Variability of annual sediment load and runoff in the Yellow River for the last 100 years (1919–2018). Sci. Total Environ. 2021, 758, 143715. [Google Scholar] [CrossRef] [PubMed]
- Li, C.; Yu, Q.; Gong, X.; Yang, L.; Cao, Y. Remote Sensing Monitoring of Sediment Content Variation in Lower Reach of Yellow River since 1980s. Environ. Sci. Manag. 2020, 45, 165–170. [Google Scholar]
- Qiu, Z.; Liu, D.; Duan, M.; Chen, P.; Yang, C.; Li, K.; Duan, H. Four-decades of sediment transport variations in the Yellow River on the Loess Plateau using Landsat imagery. Remote Sens. Environ. 2024, 306, 114147. [Google Scholar] [CrossRef]
- Li, G.; Sheng, L. Model of water-sediment regulation in Yellow River and its effect. Sci. China Technol. Sci. 2011, 54, 924–930. [Google Scholar] [CrossRef]
- Han, S.; Sun, S.; Liu, B.; Dou, Y.; Zhao, L. Study on the Annual and Interannual Fluctuation Characteristics of Recent Water and Sediment Discharge in the Lower Reaches of the Yellow River_Han Shasha. Yellow River 2024, 46, 28–32, 37. [Google Scholar]
- Li, J.; Zhao, A.; Xuan, H.; You, X. Speciation Distribution Characteristic and Ecological Risk of Heavy Metals in Surface Sediments of Cascading Hydropower Dams in Lancang River. Water 2022, 14, 3248. [Google Scholar] [CrossRef]
- Vukovic, D.; Vukovic, Z.; Stankovic, S. The impact of the Danube Iron Gate Dam on heavy metal storage and sediment flux within the reservoir. Catena 2014, 113, 18–23. [Google Scholar] [CrossRef]
- Zeng, Y.; Wang, H.; Liang, D.; Yuan, W.; Yan, Y.; Shen, Z. Three gorges dam shifts estuarine heavy metal risk through suspended sediment gradation. J. Environ. Manag. 2023, 338, 117784. [Google Scholar] [CrossRef]
- Dong, J.; Xia, X.; Zhang, Y.; Liu, Z.; Zhang, X.; Li, H. Variations in concentrations and bioavailability of heavy metals in rivers caused by water conservancy projects: InsigZhts from water regulation of the Xiaolangdi Reservoir in the Yellow River. J. Environ. Sci. 2018, 74, 79–87. [Google Scholar] [CrossRef]
- Song, F. Spatial-Temporal Evolution and Driving Factors of Air Quality Index over the Yellow River Basin; Shandong Normal University: Zhengzhou, China, 2023. [Google Scholar]
- Han, S. Research on the Ecological Environment Status and Influencing Factors in the Yellow River Basin; Northwest A&F University: Xianyang, China, 2023. [Google Scholar]
- Xue, B. Ecological Environment Status of the Yellow River Basin and Its Influencing Factors Xue Bowen. Analysis and Simulation Study on the Formation Mechanism of Abnormal Meanders in the Meandering Reaches of the Lower Yellow River; North China University of Water Resources and Electric Power: Zhengzhou, China, 2023. [Google Scholar]
- Lu, M.; Zhao, Q.; Ding, S.; Wang, S.; Hong, Z.; Jing, Y.; Wang, A. Hydro-geomorphological characteristics in response to the water-sediment regulation scheme of the Xiaolangdi Dam in the lower Yellow River. J. Clean. Prod. 2022, 335, 130324. [Google Scholar] [CrossRef]
- Fang, H.; Lai, R.; Lin, B.; Xu, X.; Zhang, F.; Zhang, Y. Variational-Based Data Assimilation to Simulate Sediment Concentration in the Lower Yellow River, China. J. Hydrol. Eng. 2016, 21, 04016010. [Google Scholar] [CrossRef]
- Wang, P.; Yu, F.; Lv, H.; Wu, L.; Zhou, H. Potential risk of heavy metals release in sediments and soils of the Yellow River Basin (Henan section): A perspective on bioavailability and bioaccessibility. Ecotoxicol. Environ. Saf. 2025, 291, 117799. [Google Scholar] [CrossRef] [PubMed]
- Ao, L.; Chang, R.; Tang, Y.; Zhang, S. Ecological risk assessment and source tracing of heavy metals in surface sediments of a hilly riverine reservoir in Chongqing, China. Environ. Sci. Eur. 2024, 36, 69. [Google Scholar] [CrossRef]
- Han, G.; Hu, M.; Wang, Y.; Liu, J.; Zhang, S.; Wang, D.; Zeng, J. Geochemistry of Dissolved Heavy Metals in Upper Reaches of the Three Gorges Reservoir of Yangtze River Watershed during the Flood Season. Water 2021, 13, 2078. [Google Scholar] [CrossRef]
- Hao, M.; Zuo, Q.; Li, J.; Shi, S.; Li, B.; Zhao, X. A comprehensive exploration on distribution, risk assessment, and source quantification of heavy metals in the multi-media environment from Shaying River Basin, China. Ecotoxicol. Environ. Saf. 2022, 231, 113190. [Google Scholar] [CrossRef]
- Choudhury, T.R.; Acter, T.; Alam, M.A.; Sowrav, S.F.F.; Rahman, M.S.; Chowdhury, A.S.; Quraishi, S.B. Appraisal of heavy metal contamination and their source apportionment identification in five river water systems of the coastal areas in Bangladesh. Reg. Stud. Mar. Sci. 2024, 70, 103378. [Google Scholar] [CrossRef]
- Shao, F.; Zhou, H. Soil Environmental Background Values of Major Elements in Henan Province. Henan Agric. 1998, 10, 28. [Google Scholar]
- Chen, C.; Zhao, D.; Wang, Z.; Bi, N.; Yang, Z.; Xu, C. Sediment Flushing Patterns and Control Indicators of Xiaolangdi Reservoir. Yellow River 2025, 47, 36–41. [Google Scholar]
- Cao, D.; Li, H.; Chen, X.; Zhang, Y.; Yang, H.; Da, C. Pollution and Environmental Risk Assessment of Heavy Metals in the Water Body of the Huaihe River (Anhui Section). J. Zhejiang Wanli Univ. 2025, 38, 81–87. [Google Scholar]
- Chen, X.; Fu, X.; Li, G.; Zhang, J.; Li, H.; Xie, F. Source-specific probabilistic health risk assessment of heavy metals in surface water of the Yangtze River Basin. Sci. Total Environ. 2024, 926, 171923. [Google Scholar] [CrossRef]
- Wu, X.; Fan, Y.; Wang, H.; Bi, N.; Yang, Z.; Xu, C. Sedimentary Response of the Lower Yellow River and Estuary to the Suspension of Water and Sediment Transfer from 2015 to 2017_Wu Xiao. Chin. Sci. Bull. 2021, 66, 3059–3070. [Google Scholar] [CrossRef]
- Zhang, Y.; Zhang, K.; Wang, P.; Zhang, W. Variations in sediment particle diameter in the Lower Yellow River since the operation of the Xiaolangdi Reservoir. Adv. Water Sci. 2025, 36, 680–692. [Google Scholar] [CrossRef]
- Jiang, Z.; Cheng, H.; Chen, J.; Zhou, T. Effect of Resuspension of Bottom Sediments in the South Channel of the Yangtze River Estuary on Heavy Metal Adsorption. J. Saf. Environ. 2003, 3, 36–40. [Google Scholar]
- Xue, B.; Zhang, X.; Xu, L.; Li, J.; Mao, H. Response Law of Sediment Diameter Change in the Lower Yellow River to Water and Sediment Regulation in Xiaolangdi Reservoir. J. North China Univ. Water Resour. Electr. Power Nat. Sci. Ed. 2020, 41, 55–62. [Google Scholar]
- Bai, H.; Ma, A.; Hu, Y.; Hu, Y.; Cao, M. Spatiotemporal Distribution Characteristics of Sediment in the Shandong Section of the Lower Yellow River After the Completion of Xiaolangdi Reservoir. China Water Transp. 2025, 6, 102–105. [Google Scholar]
- Hu, X.; Cheng, K.; Zhou, X. Numerical Simulation Study on Sediment Adsorption of Heavy Metal Pollutants. Yellow River 2020, 42, 97–102, 107. [Google Scholar]
- Nicolau, R.; Galera-Cunha, A.; Lucas, Y. Transfer of nutrients and labile metals from the continent to the sea by a small Mediterranean river. Chemosphere 2006, 63, 469–476. [Google Scholar] [CrossRef] [PubMed]
- Hamad, S.H.; Schauer, J.J.; Shafer, M.M.; Al-Raheem, E.A.; Satar, H. The Distribution between the Dissolved and the Particulate Forms of 49 Metals across the Tigris River, Baghdad, Iraq. Sci. World J. 2012, 2012, 246059. [Google Scholar] [CrossRef] [PubMed]
- Zeng, J.; Han, G.; Wu, Q.; Tang, Y. Heavy Metals in Suspended Particulate Matter of the Zhujiang River, Southwest China: Contents, Sources, and Health Risks. Int. J. Environ. Res. Public Health 2019, 16, 1843. [Google Scholar] [CrossRef]
- Zeng, J.; Han, G.; Yang, K. Assessment and sources of heavy metals in suspended particulate matter in a tropical catchment, northeast Thailand. J. Clean. Prod. 2020, 265, 121898. [Google Scholar] [CrossRef]
- Zhang, J.; Zhou, F.; Chen, C.; Sun, X.; Shi, Y.; Zhao, H.; Chen, F. Spatial distribution and correlation characteristics of heavy metals in the seawater, suspended particulate matter and sediments in Zhanjiang Bay, China. PLoS ONE 2018, 13, e0201414. [Google Scholar] [CrossRef]
- Liao, J.; Qian, X.; Liu, F.; Deng, S.; Lin, H.; Liu, X.; Wei, C. Multiphase distribution and migration characteristics of heavy metals in typical sandy intertidal zones: Insights from solid-liquid partitioning. Ecotoxicol. Environ. Saf. 2021, 208, 111674. [Google Scholar] [CrossRef]
- Wu, W. Spatiotemporal Variations of Nutrients and Trace Elements in the Yangtze River, Their Fluxes into the Sea, and Responses to Human Activities; First Institute of Oceanography, Ministry of Natural Resources: Qingdao, China, 2020. [Google Scholar]
- Qu, M.; Zhou, W.; Hu, C. Discussion on the flux of heavy meatals from the waters of Poyang Lake River. Gdaas 2012, 39, 114–117. [Google Scholar]
- Dou, X.; Liu, Q.; Fan, Q.; Guo, J.; Qi, W. Comprehensive analysis of common heavy metals in the Yellow River over 20 Years: Spatiotemporal distribution, migration characteristics, traceability, and potential risk evaluation. Environ. Res. 2025, 281, 121931. [Google Scholar] [CrossRef]
- Geng, J.; Wang, Y.; Luo, H. Distribution, sources, and fluxes of heavy metals in the Pearl River Delta, South China. Mar. Pollut. Bull. 2015, 101, 914–921. [Google Scholar] [CrossRef]
- Briant, N.; Chiffoleau, J.-F.; Knoery, J.; Araújo, D.F.; Ponzevera, E.; Crochet, S.; Thomas, B.; Brach-Papa, C. Seasonal trace metal distribution, partition and fluxes in the temperate macrotidal Loire Estuary (France). Estuar. Coast. Shelf Sci. 2021, 262, 107616. [Google Scholar] [CrossRef]
- Chen, J.; Liu, M.; Bi, N.; Yang, Y.; Wu, X.; Fan, D.; Wang, H. Variability of heavy metal transport during the water–sediment regulation period of the Yellow River in 2018. Sci. Total Environ. 2021, 798, 149061. [Google Scholar] [CrossRef]
- Dange, S.; Arumugam, K.; Vijayaraghavalu, S.S. Geochemical Insights into Heavy Metal Contamination and Health Hazards in Palar River Basin: A Pathway to Sustainable Solutions. Ecol. Indic. 2024, 166, 112568. [Google Scholar] [CrossRef]
- Xue, S.; Jian, H.; Yang, F.; Liu, Q.; Yao, Q. Impact of water-sediment regulation on the concentration and transport of dissolved heavy metals in the middle and lower reaches of the Yellow River. Sci. Total Environ. 2022, 806, 150535. [Google Scholar] [CrossRef]
- Li, D.; Zhang, B.; Li, H.; Wu, E.; Zhao, J.; Chen, Q.; Bai, X.; Li, Y.-F.; Li, B.; Wu, G.; et al. Heavy metals pollution and the associated ecological risks along the Luanhe River basin in North China. J. Environ. Manag. 2025, 376, 124452. [Google Scholar] [CrossRef]
- He, L.; Liu, D.; Lin, J.; Yu, Z.; Yang, X.; Fu, C.; Liu, Z.; Zhao, Q. Total nitrogen and pH-controlled chemical speciation, bioavailability and ecological risk from Cd, Cr, Cu, Pb and Zn in the water level-fluctuating zone sediments of the Three Gorges Reservoir. Chem. Speciat. Bioavailab. 2017, 29, 89–96. [Google Scholar] [CrossRef]
- Zhao, S.; Su, Q.; Huang, L.; Wen, C.; Zhu, Z.; Zheng, J.; Lu, J.; Li, N. Heavy Metal Speciation and Potential Ecological Risks in Surface Sediments of Typical Bays in Guangxi. Mar. Environ. Res. 2025, 44, 35–46. [Google Scholar]
- Chen, X.; Wu, P.; Liu, H.; Li, X. Source apportionment of heavy metal(loid)s in sediments of a typical karst mountain drinking-water reservoir and the associated risk assessment based on chemical speciations. Environ. Geochem. Health 2023, 45, 7585–7601. [Google Scholar] [CrossRef]
- Zhang, T.; Zheng, B.; Wang, M.; He, J.; Xia, S. Spatial distribution, occurrence form, availability and ecological risk assessment of arsenic in soils of riparian zones on the Tibetan Plateau. Gondwana Res. 2024, 130, 131–139. [Google Scholar] [CrossRef]
- Wang, F.; Bao, K.; Chen, Z.; Huang, C.; Zhang, C.; Zhao, X.; Liu, X. Bioavailability and Ecological Risk Assessment of Cadmium in the Sea-Land Interaction Sediments of the Pearl River Delta. Environ. Sci. 2021, 42, 653–662. [Google Scholar]
Disclaimer/Publisher’s Note: The statements, opinions and data contained in all publications are solely those of the individual author(s) and contributor(s) and not of MDPI and/or the editor(s). MDPI and/or the editor(s) disclaim responsibility for any injury to people or property resulting from any ideas, methods, instructions or products referred to in the content. |
© 2025 by the authors. Licensee MDPI, Basel, Switzerland. This article is an open access article distributed under the terms and conditions of the Creative Commons Attribution (CC BY) license (https://creativecommons.org/licenses/by/4.0/).