Abstract
Climate change and intensive urbanisation contribute to an increase in groundwater temperatures, leading to the development of the subsurface urban heat island (SubUHI) and Groundwater Urban Heat Island (GUHI) phenomenon. This article presents the results of comparative studies conducted in Wrocław (Poland) in two measurement campaigns in 2004–2005 and 2022–2024. The study aimed to assess long-term thermal changes in groundwater in relation to air temperature using statistical and spatial analyses. The data were processed using descriptive methods, interpolation (ordinary kriging), map algebra, and correlation analysis (Pearson). The results indicate a clear warming of groundwater, especially in the winter season, where the average temperature increase ranged from 2 to 4 °C compared to the first measurement period. The most substantial changes were observed in shallow Quaternary aquifers, showing a strong correlation with air temperature (r ≈ 0.8). Spatial analyses revealed the major groundwater temperature (GWT) increases in the city centre and densely built-up districts, confirming the intensification of the GUHI effect. In addition, a decrease in the seasonal amplitude of GWT and a local lowering of the water table were observed.
1. Introduction
Urbanisation has significantly altered natural subsurface thermal regimes, with groundwater temperatures emerging as a sensitive and persistent indicator of urban development and climate change. Understanding the subsurface thermal regime is essential for assessing the impacts of urban development on groundwater systems and for sustainable water management. Despite many studies described below, recognition of long-term variations of GWT in urban areas, especially in, but not limited to, central Europe, is still insufficient. The knowledge of spatial and temporal trends in GWT and their drivers is necessary for improving the resilience of cities and their inhabitants to the observed changes in climate, as set out in SDG 11 to make cities and human settlements inclusive, safe, resilient, and sustainable.
Urban areas exhibit higher groundwater temperatures due to the urban heat island (UHI) effect, anthropogenic influences, and land use and land cover (LULC) changes [1,2]. The subsurface urban heat island (SubUHI) phenomenon, which refers to elevated ground and/or groundwater temperatures, has been documented in many cities worldwide. Numerous studies have documented changes in groundwater temperature, mainly in Europe [3,4,5,6,7,8,9], Asia [10,11,12,13], and North America [14,15]. For example, for Paris, the temperature increase was determined by 0.9 °C over the last century [6]. For Nuremberg, the GWT increases on average by 0.9 °C per year. This value was determined based on data from 2015 and 2020 [16]. In this region, groundwater temperatures typically varied from 8.5 to 17 °C, with the warmest values recorded in the urban centre and the coolest in surrounding rural and forested zones. In Milan, differences of up to 3 °C were revealed between the city centre and suburban areas in the measurement period 2016–2020 [3]. In Istanbul, the difference between the mean annual temperatures in the years 1950–1970 and 1971–2003 in urban and rural areas is 0.9 °C, while the difference between the measured groundwater temperatures is 3.5 °C [17]. On this basis, the authors conclude that the groundwater temperature in the study area has increased by about 2.5 °C. Basel recorded a subsurface temperature increase of 3.0 ± 0.7 °C between 1993 and 2016 [2], while Cologne recorded a warming of 0.52 K per decade between 1973 and 2020 [18]. In studies conducted in Bavaria, based on profile data from wells over a period of 27 years (1992–1994 and 2019), an increase in water temperature of up to 1.5 K was recorded [19]. SubUHI studies also indicate that shallow groundwater in urban areas tends to have higher temperatures compared to suburban areas [20,21]. Relationships between surface and subsurface temperatures have also been confirmed. Groundwater responds to changes in air temperature with a time lag, but its magnitude is not precisely defined [22]. Air temperature in urban areas is affected by changes in land cover, which in turn affects the thermal regime of groundwater. In particular, impermeable surfaces and reduced vegetation increase GWT [23]. Urban green areas have been identified as a factor mitigating urban heat [24].
Studies on GWT changes are conducted using datasets with different temporal ranges; however, comprehensive temporal analyses that illustrate the changes over elongated periods are still lacking. GWT results from Canada show that an eight-year period was insufficient to determine the impact of climate change on GWT [22], emphasising the need for longer datasets. Similarly, linear regressions indicate some variability in GWT, but short-term GWT data do not provide sufficient information on temperature trends [25]. Cities such as Cologne, Amsterdam, and Tokyo have seen steady increases in GWT due to urbanisation [4,26,27], and subsurface temperatures are influenced by local climate conditions, groundwater flow dynamics, and land use changes [15].
There are a few studies describing the thermal regime of groundwater in the area of Poland. In studies based on data from measurements for the entire country, special attention was paid to the fact that as many as 82% of water samples are characterised by a temperature in the range of 9.0–12.0 °C [28]. More local studies focus mainly on the area of the city of Wrocław [29,30,31,32,33], and southern Poland [28,34]. Additionally, ref. [31] defines elevated groundwater temperature as Groundwater Urban Heat Island (GUHI).
According to the conducted studies, GWT for Wrocław was determined for the years 2004–2005, 2011–2012, and 2022–2024. The first two were limited to analyses of the GWT and air relations only, without considering analyses of spatial distribution or spatial statistics [29,31]. Seasonal variations were observed in shallower layers, while deeper geological formations showed greater thermal stability [33].
To fill the gap in long-term studies on changes in groundwater temperature, this research investigates recent GWT pattern in comparison to measurements taken 20 years ago, using the medium-sized city of Wrocław as a case study. The study critically examines the relationship between GWT and ambient air temperature changes by applying spatial and descriptive statistical analyses. The findings aim to offer practical insights and guidelines for sustainable groundwater management and climate change adaptation strategies in urban environments.
2. Study Area
Wrocław, the capital city of the Lower Silesian Voivodeship and one of Poland’s largest cities, is located in the southwestern part of the country. The city lies in the Silesian Lowlands, in the Odra River Valley, which forms its central hydrological axis. The Odra flows through Wrocław from southeast to northwest for approximately 26 km. In addition to the main river, four tributaries—Bystrzyca, Oława, Ślęza, and Widawa rivers—contribute to a complex network of watercourses with a total length of over 280 km within the city limits [35]. Covering an area of almost 293 km2, Wrocław is the fourth most populous city in Poland, with approximately 670,000 inhabitants [36]. The city is situated in a transitional temperate climate zone, influenced by both oceanic and continental air masses. Regional landforms, such as the Sudetes Foothills in the south and the Trzebnickie Hills in the north, influence local thermal conditions, favouring the warming of air masses on the leeward side of the Sudetes. Wrocław is situated at the boundary of two tectonic units: the Fore-Sudetic Monocline and the Fore-Sudetic Block, which are separated by fault systems collectively known as the Middle Odra Fault Zone [37]. The geological basement is composed mainly of crystalline and sedimentary rocks (including shales, gneisses, and sandstones), overlain by Cenozoic sediments—both Neogene and Quaternary in age (Figure 1). From a hydrogeological perspective, the city displays significant spatial variation. The Odra Valley is dominated by permeable alluvial deposits—mainly sands and gravels—with thicknesses up to 50 m [35,38]. Here, the first aquifer is continuous, unconfined, and relatively shallow, typically less than 5 m below the surface (Figure 2). In contrast, the southern upland areas are composed of glacial and fluvioglacial formations, including discontinuous clay layers where the water table often lies deeper (up to 8 m) and may be semi-confined. There are four key aquifer systems in the region: the youngest Quaternary, then locally permeable Paleogene-Neogene sediments (formerly Tertiary), deeper fractured Triassic rocks, and the least explored Permian formations [39].
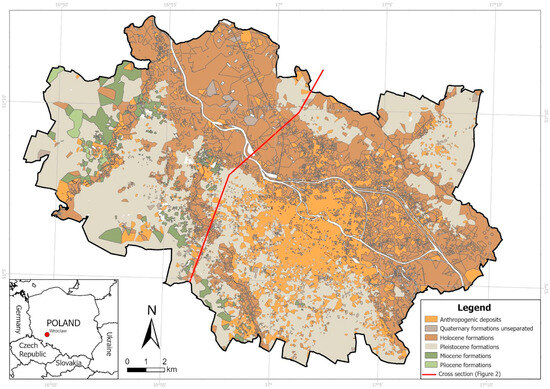
Figure 1.
Study area—geological structure of Wrocław at a depth of 1 m below the ground surface (compiled using data from baza.pgi.gov.pl [accessed on 21 September 2025]).
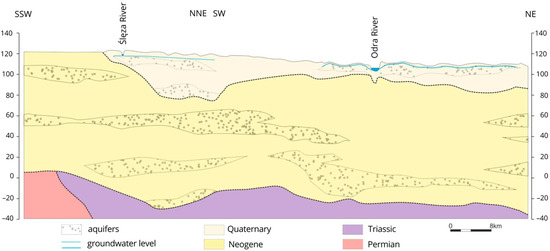
Figure 2.
Conceptual geological cross-section through the city of Wrocław [31].
Wrocław experiences mild winters and warm, humid summers. The average annual air temperature has increased in recent decades—from about 8.2 °C in the mid-20th century to over 10 °C in recent years [40,41]. The average annual rainfall from 1901 to 2000 is 583 mm [40]. January is the coldest month (average −0.1 °C), and July is the warmest (18.8–20.2 °C) [40,42]. The city is affected by the urban heat island phenomenon (UHI), particularly at night and in densely built-up central districts. The highest UHI intensity occurs in summer and spring and is closely related to land use and surface sealing [43,44,45].
Changes in land use, especially urban expansion and impervious area, have significantly altered local hydrological and climatic conditions. Currently, around 34% of the city’s area is covered by green spaces, 25% is agricultural land, and approximately 23% consists of built-up areas [46], which are mainly concentrated in the central, southern, and northwestern parts of the city. High degrees of surface impermeability in these zones intensify surface runoff, reduce infiltration to groundwater, and exacerbate urban climate effects, such as the urban heat island. Groundwater temperature studies in Wrocław conducted in 2004–2005 showed that groundwater temperature in urban areas is significantly influenced by land use patterns, with significant temperature fluctuations in different zones [31]. In the period 2004–2005, the lowest monthly average GWT of 8.64 °C was recorded in March 2005, and the highest of 16.92 °C in August 2004. In the years 2011–2012, the average water temperature in the studied points was 11.7 °C. The lowest temperature of 6.5 °C was recorded in the points located in the north-eastern part of the city, while the highest of 17.1 °C was recorded in the city centre [29]. These studies confirm that elevated groundwater temperatures are observed in the centre of Wrocław [31,32].
3. Data and Methods
The spatiotemporal analysis of GWT changes in the city of Wroclaw was based on two measurement campaigns carried out two decades apart. To study spatial and temporal patterns, the data were processed and analysed using spatial interpolation, map algebra operations, descriptive statistical methods, and correlation analysis. The location of measurement points is shown in Figure 3.
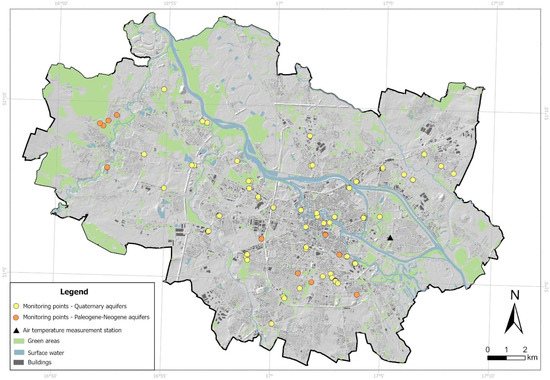
Figure 3.
Location of groundwater temperature observation points in the study area.
In the first measurement period, conducted from April 2004 to October 2005, cable temperature probes with a resolution of 0.01 °C were used, along with manual groundwater level measurements with a hydrogeological sounder (accuracy of 10 mm). Measurements were taken manually at 99 locations once a week, of which 66 were analysed further (64 in Quaternary aquifers and 2 in Paleogene-Neogene formations). Groundwater temperature was measured 1 m below the water table. Details of the measurements and data have been described in [31]. In the second campaign, the groundwater parameters (temperature and conductivity) in the shallow aquifer layer in Wrocław were monitored from June 2022 to June 2024 in 19 wells. Out of these, eight wells were set in Paleogene-Neogene formations and 11 were in Quaternary deposits. Groundwater table depth, temperature, and conductivity were measured twice a month. Temperature and conductivity readings were recorded at 1 m intervals below the groundwater table. For the measurements, the Solinst Model 107 electronic probe, attached to a PVDF tape, was used. This device has a temperature range of −15 °C to +50 °C with an accuracy of ±0.2 °C, and it can measure conductivity from 0 to 80,000 µS/cm with 5% accuracy.
Four common points were measured during both the first and second campaigns, along with two points located very closely together. Air temperature data were obtained from measurements conducted at the Observatory of the Department of Climatology and Atmospheric Protection, University of Wrocław [47].
To describe the changes in groundwater temperature (GWT) between the two measurement periods, temperature differences were analysed across two scales: (i) the entire dataset and (ii) points located in Quaternary aquifers only. The analysed time ranges were defined as follows:
- Summer (May–October)—difference between mean summer 2023 and summer 2005.
- Winter (November–April)—difference between mean winter 2022/2023 and winter 2004/2005.
- HY (hydrological year) (November–October)—difference between mean hydrological year 2022/2023 and 2004/2005.
The initial stage involved calculating descriptive statistics to characterise the measured data and assess their temporal variability across the two study periods and three seasons. The statistics included mean, standard deviation, variance, minimum and maximum, and range values.
To analyse the spatial distribution of the data from 2004 to 2005 and 2022 to 2024, spatial interpolation using the ordinary kriging method was used. This approach was chosen for its ability to account not only for the spatial proximity of measurement points but also for the spatial structure of the variable, which is vital in environmental and hydrogeological analyses [48]. The ordinary kriging (OK) method assumes a constant but unknown mean for the interpolated variable over the study area. It relies on spatial autocorrelation between measured values to estimate temperatures at unsampled locations [48]. Details of the OK interpolation method and its applications in environmental studies, including temperature estimation, can be found in [45,48,49,50,51]. The GWT maps were prepared using the ordinary kriging function of the geostatistical analyst extension in ArcGIS Pro software (version 3.2.2) licenced to Wroclaw University of Science and Technology (Poland). To verify interpolation performance, cross-validation was performed directly within ArcGIS. This method involves systematically removing each data point from the dataset, interpolating using the remaining points, and then comparing the predicted value with the actual measured value. Differences were recorded and summarised using statistical metrics such as the root mean square error (RMSE), which allowed for an assessment of the model’s accuracy [48].
Based on the GWT maps interpolated for the hydrological year, summer, and winter season from the 2004–2005 and 2022–2024 campaigns, differential GWT surfaces were calculated. This was done using the map algebra subtract function for each of the three analysed periods on a pixel-by-pixel basis. The maps of GWT differences were used to identify and analyse temperature changes over time.
For the three common locations in both measurement periods, a point-by-point comparison of groundwater temperature and level changes was performed in the three analysed seasons, allowing for the assessment of long-term changes.
To determine the relationship between air temperature and groundwater temperature, correlation analysis was conducted using Pearson’s correlation coefficient. The correlation was calculated based on the mean daily values of air temperature and groundwater temperature recorded on individual measurement days in the analysed season for all observations points. Calculations were performed for the entire dataset and Quaternary points to determine the influence of water table depth on the strength of the relationship between ambient air temperature and groundwater thermal regime. The methodological workflow is presented in Figure 4.
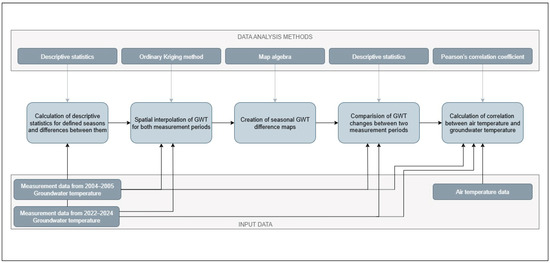
Figure 4.
Methodology of the research.
4. Results
This chapter presents the results of research based on groundwater temperature measurements over two periods. The analysis focuses on identifying temporal and spatial pattern and assessing their relationship with atmospheric conditions. Key conclusions are presented in the following subsections.
4.1. Comparative Analysis of Groundwater Temperature Changes
The results of statistical analysis of GWT data for the two observation periods (2004–2005 and 2022–2024) spanning the full HY and the summer and winter seasons are presented in Table 1. It should be noted that the whole dataset includes measurement points located at various depths, up to 17 m. During the summer season in 2004 and 2005, the mean GWT was 15.1 °C and 15.2 °C, respectively, while in 2022 and 2023 it was 13.6 °C and 13.2 °C, respectively. These values suggest a decline, and it should be noted that the latest dataset includes deeper observation points where seasonal temperature variations are less visible. At the same time, mean summer air temperatures have increased significantly from 14.7 °C and 15.5 °C (2004–2005) to 16.4 °C and 17.1 °C (2022–2023), reflecting a warming tendency. The variability of groundwater temperature during the summer season, as measured by the standard deviation, increased from around 2.3–2.4 °C to 3.6–3.7 °C, indicating increasing local variation in thermal conditions. The changes are even more pronounced in the winter season. The mean GWT in the winter of 2004/2005 was 10.6 °C, increasing to 12.7 °C and 12.6 °C in the winters of 2022/2023 and 2023/2024. During the same period, the mean winter air temperature increased from 3.4 °C to 4.5 °C and 6.1 °C, respectively. Variability of GWT also increased, with the standard deviation rising from 2.5 °C to over 3.5 °C, suggesting increasing thermal contrasts due to differences in depth of measurements and urban infrastructure influences. Hydrological year (HY) data further confirm the warming of groundwater. The mean groundwater temperature in 2004/2005 was 13.1 °C and remained at the same level in 2022/2023, despite an increase in mean air temperature from 9.5 °C to 10.7 °C. Variability also increased, with the standard deviation rising from 3.3 °C to 3.6 °C and the range remaining wide (19.0 °C in HY 2004/2005 and 15.6 °C in HY 2022/2023), reflecting wider local thermal variability.

Table 1.
Descriptive statistics of groundwater temperature for defined periods.
To assess the potential effect of surface conditions, a subset of measurement points (11) located in Quaternary sediments was analysed separately. For these points, the differences between periods are more pronounced. In summer, the mean GWT was 16.8 °C in 2022 and 15.4 °C in 2023, compared to 15.1–15.2 °C in 2004–2005. In winter, the mean GWT increased from 10.6 °C (2004/2005) to 14.3 °C (2022/2023) and 13.9 °C (2023/2024), respectively. The annual mean GWT for points in Quaternary formations reached 15.2 °C in 2022/2023—an increase of 2.1 °C compared to 2004/2005. This rise suggests that the shallow groundwater levels show greater sensitivity to surface thermal conditions and the influence of the urban heat island phenomenon.
In the case of the whole dataset, including Quaternary and Paleogene-Neogene aquifers, cooling was observed when comparing the summer periods of 2004 and 2005 to 2022 and 2023. The average difference for summer was −2.0 °C. However, for the period of winter, the average change was +2.1 °C. On an annual basis, no differences were detected for the whole hydrological year, while the maximum and minimum values varied from +0.9 °C to +4.3 °C (Figure 5). The apparent decrease in temperature between the compared summer seasons is due to the presence of temperature readings taken in Paleogene -Neogene aquifers in the 2022/2024 data. It is important to note that even with these data, there is a substantial increase in mean GWT in the compared winter seasons. It confirms the strong seasonality of changes and the sensitivity of the shallowest groundwater table to the effects of surface temperature.
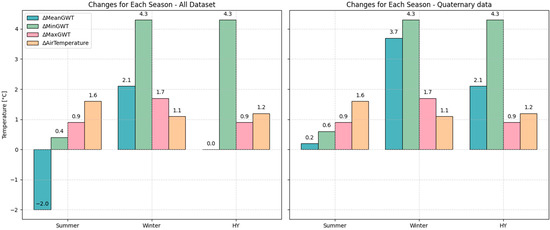
Figure 5.
Differences in mean groundwater temperatures between seasons for both measurement periods.
This is supported by the results of an analysis of data collected in Quaternary aquifers, which show a clear warming of groundwater for monitoring points across all analysed periods. In Summer, the mean groundwater temperature change was +0.2 °C. In the Winter period, the changes were much higher with a mean groundwater temperature difference of +3.7 °C. Considering the full hydrological year, warming is observed, with an average temperature increase of +2.1 °C, and corresponding increases in maximum and minimum values of +0.9 °C and +4.3 °C, respectively (Figure 5).
These results suggest the long-term impact of climate warming on the Quaternary groundwater system as the ambient air temperature increased between the compared periods by +1.1 °C to +1.6 °C. This aligns with observed trends of atmospheric warming in Wroclaw [42,52]. However, the magnitude of water temperature changes in Quaternary formations—especially in winter—exceeds the rate of air temperature increase, which may indicate additional influencing factors such as the impact of infrastructure.
4.2. Spatial Patterns of GWT Difference
The GWT differential maps show significant changes in the thermal distribution of shallow groundwater in the Wrocław area in the last two decades (Figure 6). The map showing changes between the hydrological years 2004/2005 and 2022/2023 reveals a clear pattern of increasing GWT in the central and southwestern parts of the city, which are spatially congruent with highly urbanised areas. This suggests the persistence and intensification of the groundwater urban heat island (GUHI) phenomenon.
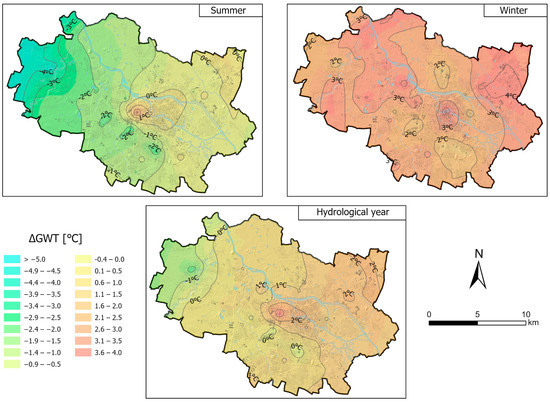
Figure 6.
Spatial differences in mean groundwater temperatures between seasons.
The difference map for winter periods of 2004/2005 and 2022/2023 indicates an even more concentrated warming in the city centre, with relative stability or no changes on the outskirts (Figure 6). This means that in winter, heat accumulation in the urban aquifer system is more pronounced, which may have a lasting impact on its energy balance. In comparison, the map for the summer seasons (2004 and 2023) shows a more dispersed pattern of changes with both local increases and decreases in GWT, suggesting the influence of surface variables such as land cover, solar radiation, and local hydrogeological conditions.
The analysis for 2022–2024 also includes measurements at points in Paleogene-Neogene aquifers. This means that some of the data concerns deeper aquifers, which respond more slowly to changes in near-surface conditions, which affects the presented maps of groundwater temperature differences. Nevertheless, they provide a general picture of spatial groundwater temperature changes in the Wrocław area.
Analysis of the spatial distribution of groundwater temperature differences indicates a marked contrast between the central part of the city and its outskirts. The largest temperature increases were recorded in the central and central-southern parts of the city, in areas with dense development, a high proportion of sealed surfaces, and limited vegetation. In turn, the highest negative ΔGWT values, corresponding to temperature drops, occur primarily in the western and northern outskirts of the city. These areas primarily include green areas and may also be influenced by the presence of points from the Paleogene-Neogene aquifers. The distribution of hot and cold spots remains similar across the analysed periods.
4.3. Comparison of GWT in Coincident Measurement Points
To interpret the groundwater temperature measurement results more precisely, a detailed analysis of three points coincident for both campaigns (2004/2005, 2022/2024) is necessary. Descriptive statistics allowing for direct comparison of GWT between the campaigns for the full hydrological year, and summer and winter seasons are presented in Table 2. The location of the analysed points, together with the recorded seasonal changes, is presented in Figure 7.
Table 2.
Statistics of groundwater temperature and groundwater level (GWL) at common measurement points P1–P3 in defined seasons.
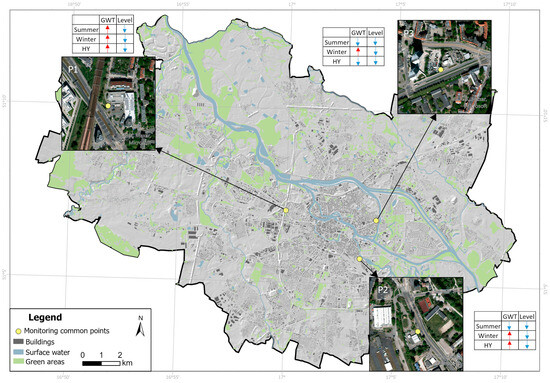
Figure 7.
Map of the location of common measurement points with changes in GWT and groundwater level (GWL).
At point P1, a clear increase in groundwater temperature was observed in both the summer and winter seasons, suggesting a warming pattern between the two compared periods. The average summer season temperature increased from 22.4 °C in 2004 to 23.4 °C in 2023, while in winter, it increased from 19.7 °C in 2004/2005 to 22.4 °C in the 2023/2024 season. The winter groundwater temperature increased by as much as 2.7 °C. This point is strongly influenced by the district heating network and therefore has higher GWT values and milder annual amplitudes. A similar phenomenon, although less pronounced, was observed at points P2 and P3. In P2, winter groundwater temperatures increased from 9.3 °C to 11.2 °C, and in P3 they increased from 14.7 °C to 14.8 °C, respectively. It is worth noting that P3 is characterised by most stable temperature among the analysed locations, which may be related to the deeper groundwater table, resulting in less interaction with the surface.
Analysis of groundwater levels revealed varying patterns at individual points. In P1, the groundwater level (GWL) ranged from 4.12 to 4.54 m below ground level (b.g.l). In P2, a decrease in the GWL was observed—from 1.38 m (hydrological year 2004/2005) to 1.71 m (HY 2022/2023). In P3, the water table depth decreased from 4.71 m to 5.66 m.
The decline in the groundwater level in the three analysed points may indicate a deepening water deficit or changes in the local water balance, resulting from, for example, increased runoff, decreased precipitation, or increased groundwater extraction.
Changes in the seasonal amplitude of groundwater temperature are particularly significant. At P1, the difference between summer and winter decreased from 2.7 °C in 2004/2005 to just 1.0 °C in 2023/2024 due to the increase in GWT in the cold season (Table 2). A similar decrease in amplitude occurred at P2 (from 6.2 °C to 3.4 °C), suggesting that the impact of surface factors such as elevated air and surface temperatures due to climate change is leading not only to temperature increases but also to greater uniformity throughout the year. The presented data indicate a clear impact of an increase in ambient air temperatures on the thermal and hydrodynamic regime of groundwater. The most visible effects are: increased temperatures, particularly in winter, reduced seasonal temperature variability, and spatial differences in water level changes depending on location. These results emphasise the need for continued monitoring of groundwater and its response to climatic and anthropogenic factors, which is crucial both for water resource management planning and for the protection of groundwater-dependent ecosystems.
Analysing the average monthly changes over a defined hydrogeological year (difference between mean HY 2022/2023 and 2004/2005) at individual measurement points reveals additional, more detailed patterns (Figure 8). At point P1 (Figure 8a), monthly groundwater temperature differences ranged from 0.4 °C to 3.5 °C, and water level changes varied from −0.49 m to +0.25 m. At point P2 (Figure 8b), temperature changes ranged from −0.8 °C to 2.5 °C, and GWL changes varied from −0.73 m to +0.21 m. At point P3 (Figure 8c), greater variability was observed in both temperature (from −0.7 °C to 1.1 °C) and water levels (from −1.29 m to −0.07 m). These data indicate that in many months, rising groundwater temperatures accompanied falling water table levels, which may be due to seasonal factors such as higher air temperatures or reduced precipitation.
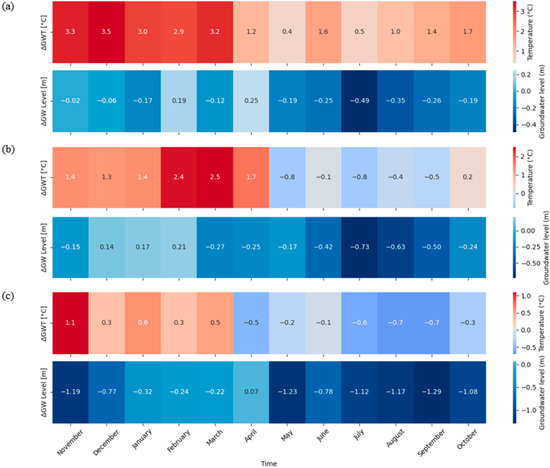
Figure 8.
Mean monthly changes in groundwater temperature (ΔGWT) and groundwater level (ΔGWL) at measurement points P1 (a), P2 (b), and P3 (c) during the defined hydrogeological year (difference between mean HY 2022/2023 and 2004/2005). Positive values indicate an increase and negative values indicate a decrease.
4.4. Correlations
The correlation coefficient, calculated for all monitoring points, reached a value of r = 0.76, while for points located in Quaternary aquifers, a slightly higher correlation of r = 0.79 was observed (Figure 9). These high correlation values confirm a strong relationship between air temperature and the temperature of shallow groundwater. The correlation is particularly evident at sites situated in Quaternary formations, where the shallow depth of the water table and high permeability of the sediments enhance the influence of air temperature. It should be emphasised that in the studied area, groundwater temperature is shaped not only by natural atmospheric conditions but also by anthropogenic factors, such as surface sealing and underground infrastructure. In shallow aquifers, these local human-induced impacts may significantly amplify or obscure the influence of seasonal air temperature fluctuations. At the same time, the observed correlation may suggest that both local land use and ongoing climate change influence the thermal regime of shallow groundwater.
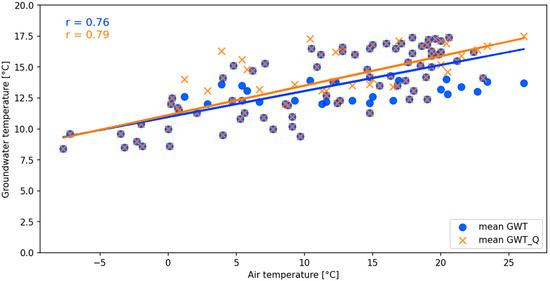
Figure 9.
Scatter plot of air temperature and groundwater temperature with trend lines and correlation coefficients.
5. Discussion
Analysis of data from the 2004/2005 and 2022/2024 periods indicates an increase in groundwater temperature in Wrocław over 20 years. These changes correlate with increases in average air temperatures in the region, confirming the influence of urban climate on subsurface thermal conditions. The observed increase in GWT also demonstrates a seasonal nature, suggesting that periodic fluctuations in air temperature, precipitation, and groundwater recharge are significant in the short term. The temperature increase is evident in shallow aquifers and primarily in winter, with the most considerable changes observed during this season, which may be attributed to milder winters. Between the analysed measurement periods (HY 2024/2025 and HY 2022/2023), the mean GWT in Wrocław in Quaternary aquifers increased by approximately 2.1 °C, indicating a clear long-term warming pattern. On a continental scale for example [1] reported a rise of +0.7 ± 0.8 K in Austria between 1994 and 2013, while [53] documented a 0.9 K per decade increase in Vienna’s urban aquifers.
It should be indicated that conclusions regarding the long-term pattern are limited due to the availability of only two measurement periods. A comprehensive analysis of climatic and hydrogeological trends requires data spanning multiple years and regular observations, which would allow for a more accurate distinction between climate-related changes and natural seasonal variability and local factors. Similar limitations were noted in previous studies that also relied on a restricted number of observations [5,54,55,56]. On the other hand, some studies that benefited from cyclically collected, long-term datasets were able to provide more robust insights into climatic and hydrogeological trends [57,58]; however, such studies are still relatively scarce.
Due to the limited number of measurement points in deeper aquifers during the 2004–2005 campaign, a complete temporal comparison of temperature dynamics in these aquifers was not feasible. Consequently, this study (for period 2004/2005) focuses on shallow Quaternary aquifers, where sufficient data were available.
Besides the influence of air temperature, GWT in cities is influenced by many local and anthropogenic factors [3,5,56,59]. The most important factors reported in the literature include: the geological structure of the subsurface, the permeability of aquifers, the intensity of groundwater recharge through precipitation and infiltration, the degree of urbanisation, the presence of water surfaces, and water abstraction by urban farms and industry [1,3,15,26,60,61,62]. For example, in areas with dense development and limited biologically active areas, local groundwater heating can occur, resulting in the urban heat island effect [2,3,59]. Green areas and parks, in turn, can act as cooling zones, reducing the amplitude of groundwater temperature changes [31]. Therefore, analyses should be expanded to include these factors. Analysis of these relationships for the study area is the subject of ongoing research.
The differences between the same measurement points for both measurement periods observed in this study highlight the diversity of land use. Analysis of local hydrogeological conditions and anthropogenic determinants is therefore essential for the correct interpretation of changes in groundwater temperature and for planning adaptation measures in the context of climate change. The results of this study constitute the first analysis of groundwater temperature changes over such a long period (two decades) for the city of Wrocław and the only study of this kind in Poland. The observed increase in groundwater temperature is consistent with patterns observed in other urban areas.
6. Conclusions
A comparison of data from two measurement periods (2004/2005 and 2022/2024) revealed that groundwater temperature in Wrocław has increased over the past 20 years, consistent with observed global warming (with the air temperature increasing by above 1.5 °C over the last 120 years [63]). These changes exhibit seasonal patterns and spatial variation, highlighting the role of local environmental factors such as urban development and stormwater infiltration. In particular, shallow groundwater in Quaternary aquifers exhibit significant temperature increases in winter, while in summer, especially in deeper layers, slight decreases in average values are observed, which is related to the lower susceptibility of deeper layers to seasonal temperature fluctuations. The increase in groundwater temperature is most pronounced in the central and southwestern parts of Wrocław, in areas with a high degree of development and large impermeable surfaces, indicating the occurrence and intensification of the GUHI. Groundwater in Quaternary sediments is more sensitive to changes in air temperature than the deeper Paleogene-Neogene layers, with the average temperature increase at these measurement points reaching up to +2.1 °C over 20 years, exceeding the rate of air temperature increase over the same period. A decrease in the seasonal amplitude of groundwater temperature is also observed, indicating greater thermal uniformity throughout the year. At the same time, a decline in groundwater levels has been noted in some locations. The high correlation between air temperature and groundwater temperature (r = 0.76–0.79) confirms the significant influence of atmospheric conditions on shallow groundwater, with local anthropogenic factors such as development and underground infrastructure potentially further amplifying the observed thermal changes. However, it should be noted that this study focuses on Wrocław in Poland, and the observed patterns of groundwater warming and GUHI effects may not be directly applicable to cities with different climatic, geological or urbanisation characteristics.
Our analysis points to the need for systematic, long-term GWT measurements in cities, which will not only enable climate change monitoring but will also enable better water resource management and the development of adaptation strategies in cities. The results can serve as a basis for Wrocław city authorities to work on guidelines for sustainable groundwater management and the adaptation of urban infrastructure to a warming climate, in line with the SDG 11 goals regarding urban safety and resilience. This is essential, particularly with regard to the sponge city concept, where water and energy storage can be planned in a sustainable way.
In this study, the analysis focused primarily on the relationship between groundwater temperature and air temperature. However, it is recognised that additional factors—such as groundwater extraction, land use changes, aquifer depth, and subsurface geological heterogeneity—also influence the spatial and temporal variability of GWT and the intensity of the GUHI effect. These aspects are addressed in the authors’ ongoing research, which aims to quantify the relative contribution of these factors using integrated hydrogeological, thermal, spatial and remote sensing analyses. The results of the extended study will be presented in a separate publication.
Author Contributions
Conceptualization, M.H. and J.B.; methodology, M.H. and J.B.; software, M.H.; validation, M.H.; formal analysis, M.H.; investigation, M.H. and M.W.-K.; resources, M.H.; data curation, M.H.; writing—original draft preparation, M.H. and J.B.; writing—review and editing, M.H., J.B. and M.W.-K.; visualisation, M.H.; supervision, J.B.; project administration, M.H. All authors have read and agreed to the published version of the manuscript.
Funding
This research received no external funding.
Data Availability Statement
The original contributions presented in this study are included in the article. Further inquiries can be directed to the corresponding author.
Conflicts of Interest
The authors declare no conflicts of interest.
Abbreviations
The following abbreviations are used in this manuscript:
| GUHI | Groundwater Urban Heat Island |
| GWL | Groundwater level |
| GWT | Groundwater temperature |
| LULC | Land Use and Land Cover |
| UHI | Urban Heat Island |
| SubUHI | Subsurface Urban Heat Island |
References
- Benz, S.A.; Bayer, P.; Blum, P. Global Patterns of Shallow Groundwater Temperatures. Environ. Res. Lett. 2017, 12, 34005. [Google Scholar] [CrossRef]
- Epting, J.; Scheidler, S.; Affolter, A.; Borer, P.; Mueller, M.H.; Egli, L.; García-Gil, A.; Huggenberger, P. The Thermal Impact of Subsurface Building Structures on Urban Groundwater Resources—A Paradigmatic Example. Sci. Total Environ. 2017, 596–597, 87–96. [Google Scholar] [CrossRef]
- Previati, A.; Crosta, G.B. Characterization of the Subsurface Urban Heat Island and Its Sources in the Milan City Area, Italy. Hydrogeol. J. 2021, 29, 2487–2500. [Google Scholar] [CrossRef]
- Zhu, K.; Bayer, P.; Grathwohl, P.; Blum, P. Groundwater Temperature Evolution in the Subsurface Urban Heat Island of Cologne, Germany. Hydrol. Process. 2015, 29, 965–978. [Google Scholar] [CrossRef]
- Menberg, K.; Bayer, P.; Zosseder, K.; Rumohr, S.; Blum, P. Subsurface Urban Heat Islands in German Cities. Sci. Total Environ. 2013, 442, 123–133. [Google Scholar] [CrossRef]
- Perrier, F.; Le Mouël, J.-L.; Poirier, J.-P.; Shnirman, M.G. Long-Term Climate Change and Surface versus Underground Temperature Measurements in Paris. Int. J. Climatol. 2005, 25, 1619–1631. [Google Scholar] [CrossRef]
- Visser, P.W.; Kooi, H.; Bense, V.; Boerma, E. Impacts of Progressive Urban Expansion on Subsurface Temperatures in the City of Amsterdam (The Netherlands). Hydrogeol. J. 2020, 28, 1755–1772. [Google Scholar] [CrossRef]
- Čermák, V.; Bodri, L.; Šafanda, J.; Krešl, M.; Dědeček, P. Ground-Air Temperature Tracking and Multi-Year Cycles in the Subsurface Temperature Time Series at Geothermal Climate-Change Observatory. Stud. Geophys. Geod. 2014, 58, 403–424. [Google Scholar] [CrossRef]
- Lasagna, M.; Egidio, E.; De Luca, D.A. Groundwater Temperature Stripes: A Simple Method to Communicate Groundwater Temperature Variations Due to Climate Change. Water 2024, 16, 717. [Google Scholar] [CrossRef]
- Taniguchi, M.; Uemura, T.; Jago-on, K. Combined Effects of Urbanization and Global Warming on Subsurface Temperature in Four Asian Cities. Vadose Zone J. 2007, 6, 591–596. [Google Scholar] [CrossRef]
- Huang, S.; Taniguchi, M.; Yamano, M.; Wang, C. Detecting Urbanization Effects on Surface and Subsurface Thermal Environment—A Case Study of Osaka. Sci. Total Environ. 2009, 407, 3142–3152. [Google Scholar] [CrossRef]
- Benz, S.A.; Bayer, P.; Blum, P.; Hamamoto, H.; Arimoto, H.; Taniguchi, M. Comparing Anthropogenic Heat Input and Heat Accumulation in the Subsurface of Osaka, Japan. Sci. Total Environ. 2018, 643, 1127–1136. [Google Scholar] [CrossRef]
- Uchida, Y.; Sakura, Y.; Taniguchi, M. Shallow Subsurface Thermal Regimes in Major Plains in Japan with Reference to Recent Surface Warming. Phys. Chem. Earth Parts A/B/C 2003, 28, 457–466. [Google Scholar] [CrossRef]
- Rotta Loria, A.F.; Thota, A.; Thomas, A.M.; Friedle, N.; Lautenberg, J.M.; Song, E.C. Subsurface Heat Island across the Chicago Loop District: Analysis of Localized Drivers. Urban Clim. 2022, 44, 101211. [Google Scholar] [CrossRef]
- Ferguson, G.; Woodbury, A.D. Urban Heat Island in the Subsurface: Subsurface urban heat island. Geophys. Res. Lett. 2007, 34, L23713. [Google Scholar] [CrossRef]
- Schweighofer, J.A.V.; Wehrl, M.; Baumgärtel, S.; Rohn, J. Detecting Groundwater Temperature Shifts of a Subsurface Urban Heat Island in SE Germany. Water 2021, 13, 1417. [Google Scholar] [CrossRef]
- Yalcin, T.; Yetemen, O. Local Warming of Groundwaters Caused by the Urban Heat Island Effect in Istanbul, Turkey. Hydrogeol. J. 2009, 17, 1247–1255. [Google Scholar] [CrossRef]
- Hemmerle, H.; Ferguson, G.; Blum, P.; Bayer, P. The Evolution of the Geothermal Potential of a Subsurface Urban Heat Island. Environ. Res. Lett. 2022, 17, 84018. [Google Scholar] [CrossRef]
- Hemmerle, H.; Bayer, P. Climate Change Yields Groundwater Warming in Bavaria, Germany. Front. Earth Sci. 2020, 8, 575894. [Google Scholar] [CrossRef]
- Tissen, C.; Benz, S.A.; Menberg, K.; Bayer, P.; Blum, P. Groundwater Temperature Anomalies in Central Europe. Environ. Res. Lett. 2019, 14, 104012. [Google Scholar] [CrossRef]
- Gunawardhana, L.N.; Kazama, S.; Kawagoe, S. Impact of Urbanization and Climate Change on Aquifer Thermal Regimes. Water Resour. Manag. 2011, 25, 3247–3276. [Google Scholar] [CrossRef]
- Kurylyk, B.L.; MacQuarrie, K.T.B.; Caissie, D.; McKenzie, J.M. Shallow Groundwater Thermal Sensitivity to Climate Change and Land Cover Disturbances: Derivation of Analytical Expressions and Implications for Stream Temperature Modeling. Hydrol. Earth Syst. Sci. 2015, 19, 2469–2489. [Google Scholar] [CrossRef]
- Zhao, L.; Oppenheimer, M.; Zhu, Q.; Baldwin, J.W.; Ebi, K.L.; Bou-Zeid, E.; Guan, K.; Liu, X. Interactions between Urban Heat Islands and Heat Waves. Environ. Res. Lett. 2018, 13, 34003. [Google Scholar] [CrossRef]
- Lin, H.; Li, X. The Role of Urban Green Spaces in Mitigating the Urban Heat Island Effect: A Systematic Review from the Perspective of Types and Mechanisms. Sustainability 2025, 17, 6132. [Google Scholar] [CrossRef]
- Smith, K.A.; O’Sullivan, A.M.; Kennedy, G.; Benz, S.A.; Somers, L.D.; Kurylyk, B.L. Shallow Groundwater Temperature Patterns Revealed through a Regional Monitoring Well Network. Hydrol. Process. 2023, 37, e14975. [Google Scholar] [CrossRef]
- Epting, J.; Huggenberger, P. Unraveling the Heat Island Effect Observed in Urban Groundwater Bodies—Definition of a Potential Natural State. J. Hydrol. 2013, 501, 193–204. [Google Scholar] [CrossRef]
- Abe, H.; Tang, C.; Kondoh, A. Effect of Urban Aquifer Exploitation on Subsurface Temperature and Water Quality. Groundwater 2014, 52, 186–194. [Google Scholar] [CrossRef] [PubMed]
- Uliasz-Misiak, B.; Winid, B. Perspectives of Using the Quaternary Groundwaters in the Low-Temperature Geothermal Systems in Poland. Geothermics 2020, 87, 101842. [Google Scholar] [CrossRef]
- Buczyński, S.; Staśko, S. Temperatura Płytkich Wód Podziemnych Na Terenie Wrocławia. Biul. Państwowego Inst. Geol. 2013, 456, 51–55. (In Polish) [Google Scholar]
- Staśko, S.; Buczyński, S.; Błachowicz, M. Temperatura Wód Podziemnych i Jej Znaczenie w Badaniach Hydrogeologicznych. Przegląd Geol. 2021, 69, 224–233. (In Polish) [Google Scholar] [CrossRef]
- Worsa-Kozak, M.; Arsen, A. Groundwater Urban Heat Island in Wrocław, Poland. Land 2023, 12, 658. [Google Scholar] [CrossRef]
- Hajnrych, M.; Blachowski, J.; Worsa-Kozak, M. Study of Groundwater Temperature Spatio-Temporal Variation in the City of Wroclaw. Prelim. Results IOP Conf. Ser. Earth Environ. Sci. 2023, 1189, 12028. [Google Scholar] [CrossRef]
- Hajnrych, M.; Blachowski, J.; Worsa-Kozak, M. Analysis of Groundwater Temperature in Urban Conditions—The Case of Wrocław, Poland. Civ. Environ. Eng. Rep. 2025, 35, 213–229. [Google Scholar] [CrossRef]
- Mazurkiewicz, J.; Kmiecik, E.; Tomaszewska, B. Analiza możliwości wykorzystania wód podziemnych z utworów czwartorzędowych w systemach geotermii niskotemperaturowej na obszarze Małopolski. Część I. Przegląd Geol. 2015, 63, 926–930. (In Polish) [Google Scholar]
- Szponar, A.; Szponar, A.M. Geology and Paleogeography of Wrocław (Geologia i Paleogeografia Wrocławia); KGHM CUPRUM Centrum Badawczo-Rozwojowe: Wrocław, Poland, 2008. [Google Scholar]
- Statistical Office in Wroclaw. Statistics Poland. Available online: https://demografia.stat.gov.pl/bazademografia/tables.aspx (accessed on 20 August 2025). (In Polish)
- Gmochowska, W.; Pietranik, A.; Tyszka, R.; Ettler, V.; Mihaljevič, M.; Długosz, M.; Walenczak, K. Sources of Pollution and Distribution of Pb, Cd and Hg in Wrocław Soils: Insight from Chemical and Pb Isotope Composition. Geochemistry 2019, 79, 434–445. [Google Scholar] [CrossRef]
- Worsa-Kozak, M. Wahania Zwierciadła Wód Podziemnych Na Terenach Zurbanizowanych (Miasto Wrocław)/Groundwater Table Fluctuations in Urban Areas (City of Wrocław). Ph.D. Thesis, University of Wrocław, Wrocław, Poland, 2007. (In Polish). [Google Scholar] [CrossRef]
- Malinowski, J. Budowa Geologiczna Polski. T. 7 Hydrogeologia; Wydawnictwa Geologiczne: Warszawa, Poland, 1991. (In Polish) [Google Scholar]
- Dubicki, A.; Dubicka, M.; Szymanowski, M. Klimat Wrocławia. 2002. Available online: http://eko.org.pl/wroclaw/pdf/klimat.pdf (accessed on 21 September 2025). (In Polish).
- Sikora, S. Bioclimate of Wroclaw. 2008. Available online: https://repozytorium.uni.wroc.pl/Content/137487/PDF/Bioklimat_Wroclawia.pdf (accessed on 21 September 2025). (In Polish).
- Dąbek, P.B.; Jurasz, J. GIS Estimated Potential of Rooftop PVs in Urban Areas—Case Study Wrocław (Poland). E3S Web Conf. 2018, 45, 14. [Google Scholar] [CrossRef]
- Szymanowski, M. Interactions between Thermal Advection in Frontal Zones and the Urban Heat Island of Wrocław, Poland. Theor. Appl. Climatol. 2005, 82, 207–224. [Google Scholar] [CrossRef]
- Szymanowski, M. Miejska Wyspa Ciepła We Wrocławiu; Wyd. Uniwersytetu Wrocławskiego: Wrocław, Poland, 2004. (In Polish) [Google Scholar]
- Szymanowski, M.; Kryza, M. GIS-Based Techniques for Urban Heat Island Spatialization. Clim. Res. 2009, 38, 171–187. [Google Scholar] [CrossRef]
- Wroclaw City Council. Study of the Conditions and Directions of Spatial Development in Wrocław; Wroclaw City Council: Wroclaw, Poland, 2018; Available online: https://geoportal.wroclaw.pl/planowanie_przestrzenne/studium/ (accessed on 21 September 2025). (In Polish)
- Observatory of the Department of Climatology and Atmospheric Protection, University of Wrocław. Available online: https://www.meteo.uni.wroc.pl (accessed on 21 September 2025). (In Polish).
- Hofierka, J.; Cebecauer, T.; Šúri, M. Optimisation of Interpolation Parameters Using Cross-Validation. In Digital Terrain Modelling; Peckham, R.J., Jordan, G., Eds.; Lecture Notes in Geoinformation and Cartography; Springer: Berlin/Heidelberg, Germany, 2007; pp. 67–82. ISBN 978-3-540-36730-7. [Google Scholar]
- Elumalai, V.; Brindha, K.; Sithole, B.; Lakshmanan, E. Spatial Interpolation Methods and Geostatistics for Mapping Groundwater Contamination in a Coastal Area. Environ. Sci. Pollut. Res. 2017, 24, 11601–11617. [Google Scholar] [CrossRef]
- Belkhiri, L.; Tiri, A.; Mouni, L. Spatial Distribution of the Groundwater Quality Using Kriging and Co-Kriging Interpolations. Groundw. Sustain. Dev. 2020, 11, 100473. [Google Scholar] [CrossRef]
- Hassani, A.; Santos, G.S.; Schneider, P.; Castell, N. Interpolation, Satellite-Based Machine Learning, or Meteorological Simulation? A Comparison Analysis for Spatio-Temporal Mapping of Mesoscale Urban Air Temperature. Environ. Model. Assess. 2024, 29, 291–306. [Google Scholar] [CrossRef]
- Miszuk, B. Warunki termiczne i biotermiczne na Dolnym Śląsku w 2019 roku. Przegląd Geofiz. 2021, 66, 43–64. [Google Scholar] [CrossRef]
- Kaminsky, E.; Laaha, G.; Steiner, C.; Buga-Nyéki, E.; Englisch, C.; Griebler, C.; Stumpp, C. Increasing Trends of Shallow Groundwater Warming in Vienna’s Urban Aquifers. Hydrol. Process. 2025, 39, e70076. [Google Scholar] [CrossRef]
- Colombani, N.; Giambastiani, B.M.S.; Mastrocicco, M. Use of Shallow Groundwater Temperature Profiles to Infer Climate and Land Use Change: Interpretation and Measurement Challenges. Hydrol. Process. 2016, 30, 2512–2524. [Google Scholar] [CrossRef]
- Hemmerle, H.; Hale, S.; Dressel, I.; Benz, S.A.; Attard, G.; Blum, P.; Bayer, P. Estimation of Groundwater Temperatures in Paris, France. Geofluids 2019, 2019, 5246307. [Google Scholar] [CrossRef]
- Benz, S.A.; Bayer, P.; Menberg, K.; Jung, S.; Blum, P. Spatial Resolution of Anthropogenic Heat Fluxes into Urban Aquifers. Sci. Total Environ. 2015, 524–525, 427–439. [Google Scholar] [CrossRef] [PubMed]
- Benz, S.A.; Bayer, P.; Winkler, G.; Blum, P. Recent Trends of Groundwater Temperatures in Austria. Hydrol. Earth Syst. Sci. 2018, 22, 3143–3154. [Google Scholar] [CrossRef]
- Figura, S.; Livingstone, D.M.; Kipfer, R. Forecasting Groundwater Temperature with Linear Regression Models Using Historical Data. Groundwater 2015, 53, 943–954. [Google Scholar] [CrossRef]
- Benz, S.A.; Bayer, P.; Goettsche, F.M.; Olesen, F.S.; Blum, P. Linking Surface Urban Heat Islands with Groundwater Temperatures. Environ. Sci. Technol. 2016, 50, 70–78. [Google Scholar] [CrossRef]
- Previati, A.; Epting, J.; Crosta, G.B. The Subsurface Urban Heat Island in Milan (Italy)—A Modeling Approach Covering Present and Future Thermal Effects on Groundwater Regimes. Sci. Total Environ. 2022, 810, 152119. [Google Scholar] [CrossRef]
- Taylor, C.A.; Stefan, H.G. Shallow Groundwater Temperature Response to Climate Change and Urbanization. J. Hydrol. 2009, 375, 601–612. [Google Scholar] [CrossRef]
- Menberg, K.; Blum, P.; Schaffitel, A.; Bayer, P. Long-Term Evolution of Anthropogenic Heat Fluxes into a Subsurface Urban Heat Island. Environ. Sci. Technol. 2013, 47, 9747–9755. [Google Scholar] [CrossRef] [PubMed]
- World Meteorological Organization. World Meteorological Organization State of the Global Climate 2024. 2025. Available online: https://library.wmo.int/records/item/69455-state-of-the-global-climate-2024 (accessed on 21 September 2025).


Disclaimer/Publisher’s Note: The statements, opinions and data contained in all publications are solely those of the individual author(s) and contributor(s) and not of MDPI and/or the editor(s). MDPI and/or the editor(s) disclaim responsibility for any injury to people or property resulting from any ideas, methods, instructions or products referred to in the content. |
© 2025 by the authors. Licensee MDPI, Basel, Switzerland. This article is an open access article distributed under the terms and conditions of the Creative Commons Attribution (CC BY) license (https://creativecommons.org/licenses/by/4.0/).