Article

Nonstationary Streamflow Variability and Climate Drivers in the Amur and Yangtze River Basins: A Comparative Perspective Under Climate Change

1
College of Civil Engineering, Tongji University, Shanghai 200092, China
2
Changjiang River Estuary Bureau of Hydrology and Water Resources Survey, Bureau of Hydrology, Changjiang Water Resources Commission, Shanghai 200136, China
3
Key Laboratory of Cities’ Mitigation and Adaptation to Climate Change in Shanghai, China Meteorological Administration, Shanghai 200092, China
4
Shanghai Key Laboratory of Urban Regeneration and Spatial Optimization Technology, Shanghai 200092, China
5
Institute of Water and Ecology Problems FEB RAS, Far Eastern Branch of the Russian Academy of Sciences, 680000 Khabarovsk, Russia
*
Author to whom correspondence should be addressed.
Water 2025, 17(15), 2339; https://doi.org/10.3390/w17152339 (registering DOI)
Submission received: 29 June 2025 / Revised: 3 August 2025 / Accepted: 5 August 2025 / Published: 6 August 2025
(This article belongs to the Special Issue Risks of Hydrometeorological Extremes)

Abstract

Climate-driven hydrological extremes and anthropogenic interventions are increasingly altering streamflow regimes worldwide. While prior studies have explored climate or regulation effects separately, few have integrated multiple teleconnection indices and reservoir chronologies within a cross-basin comparative framework. This study addresses this gap by assessing long-term streamflow nonstationarity and its drivers at two key stations—Khabarovsk on the Amur River and Datong on the Yangtze River—representing distinct hydroclimatic settings. We utilized monthly discharge records, meteorological data, and large-scale climate indices to apply trend analysis, wavelet transform, percentile-based extreme diagnostics, lagged random forest regression, and slope-based attribution. The results show that Khabarovsk experienced an increase in winter baseflow from 513 to 1335 m3/s and a notable reduction in seasonal discharge contrast, primarily driven by temperature and cold-region reservoir regulation. In contrast, Datong displayed increased discharge extremes, with flood discharges increasing by +71.9 m3/s/year, equivalent to approximately 0.12% of the mean flood discharge annually, and low discharges by +24.2 m3/s/year in recent decades, shaped by both climate variability and large-scale hydropower infrastructure. Random forest models identified temperature and precipitation as short-term drivers, with ENSO-related indices showing lagged impacts on streamflow variability. Attribution analysis indicated that Khabarovsk is primarily shaped by cold-region reservoir operations in conjunction with temperature-driven snowmelt dynamics, while Datong reflects a combined influence of both climate variability and regulation. These insights may provide guidance for climate-responsive reservoir scheduling and basin-specific regulation strategies, supporting the development of integrated frameworks for adaptive water management under climate change.

1. Introduction

Against the backdrop of ongoing global warming and rapid urban expansion, urban disasters caused by floods and droughts have occurred with increasing frequency, posing severe threats to human life and socioeconomic development [1]. IPCC AR6 (Intergovernmental Panel on Climate Change Sixth Assessment Report) projects continued warming and hydrological intensification across East Asia, including increased winter runoff in high-latitude basins and enhanced monsoon-driven extremes in subtropical regions [2]. Such changes are particularly evident in monsoon and cold-region basins, where the interplay between warming, snowmelt, and extreme precipitation is reshaping streamflow variability. As a result, understanding how climate change alters runoff has become a central challenge for sustainable basin-scale water management. River runoff is one of the hydrological variables most directly affected by climate change [3]. Rising global temperatures have significantly altered the spatiotemporal distribution of precipitation, further amplifying its heterogeneity [4], which in turn increases the seasonality and extremes of river discharge, manifesting as both severe floods and prolonged drought periods.
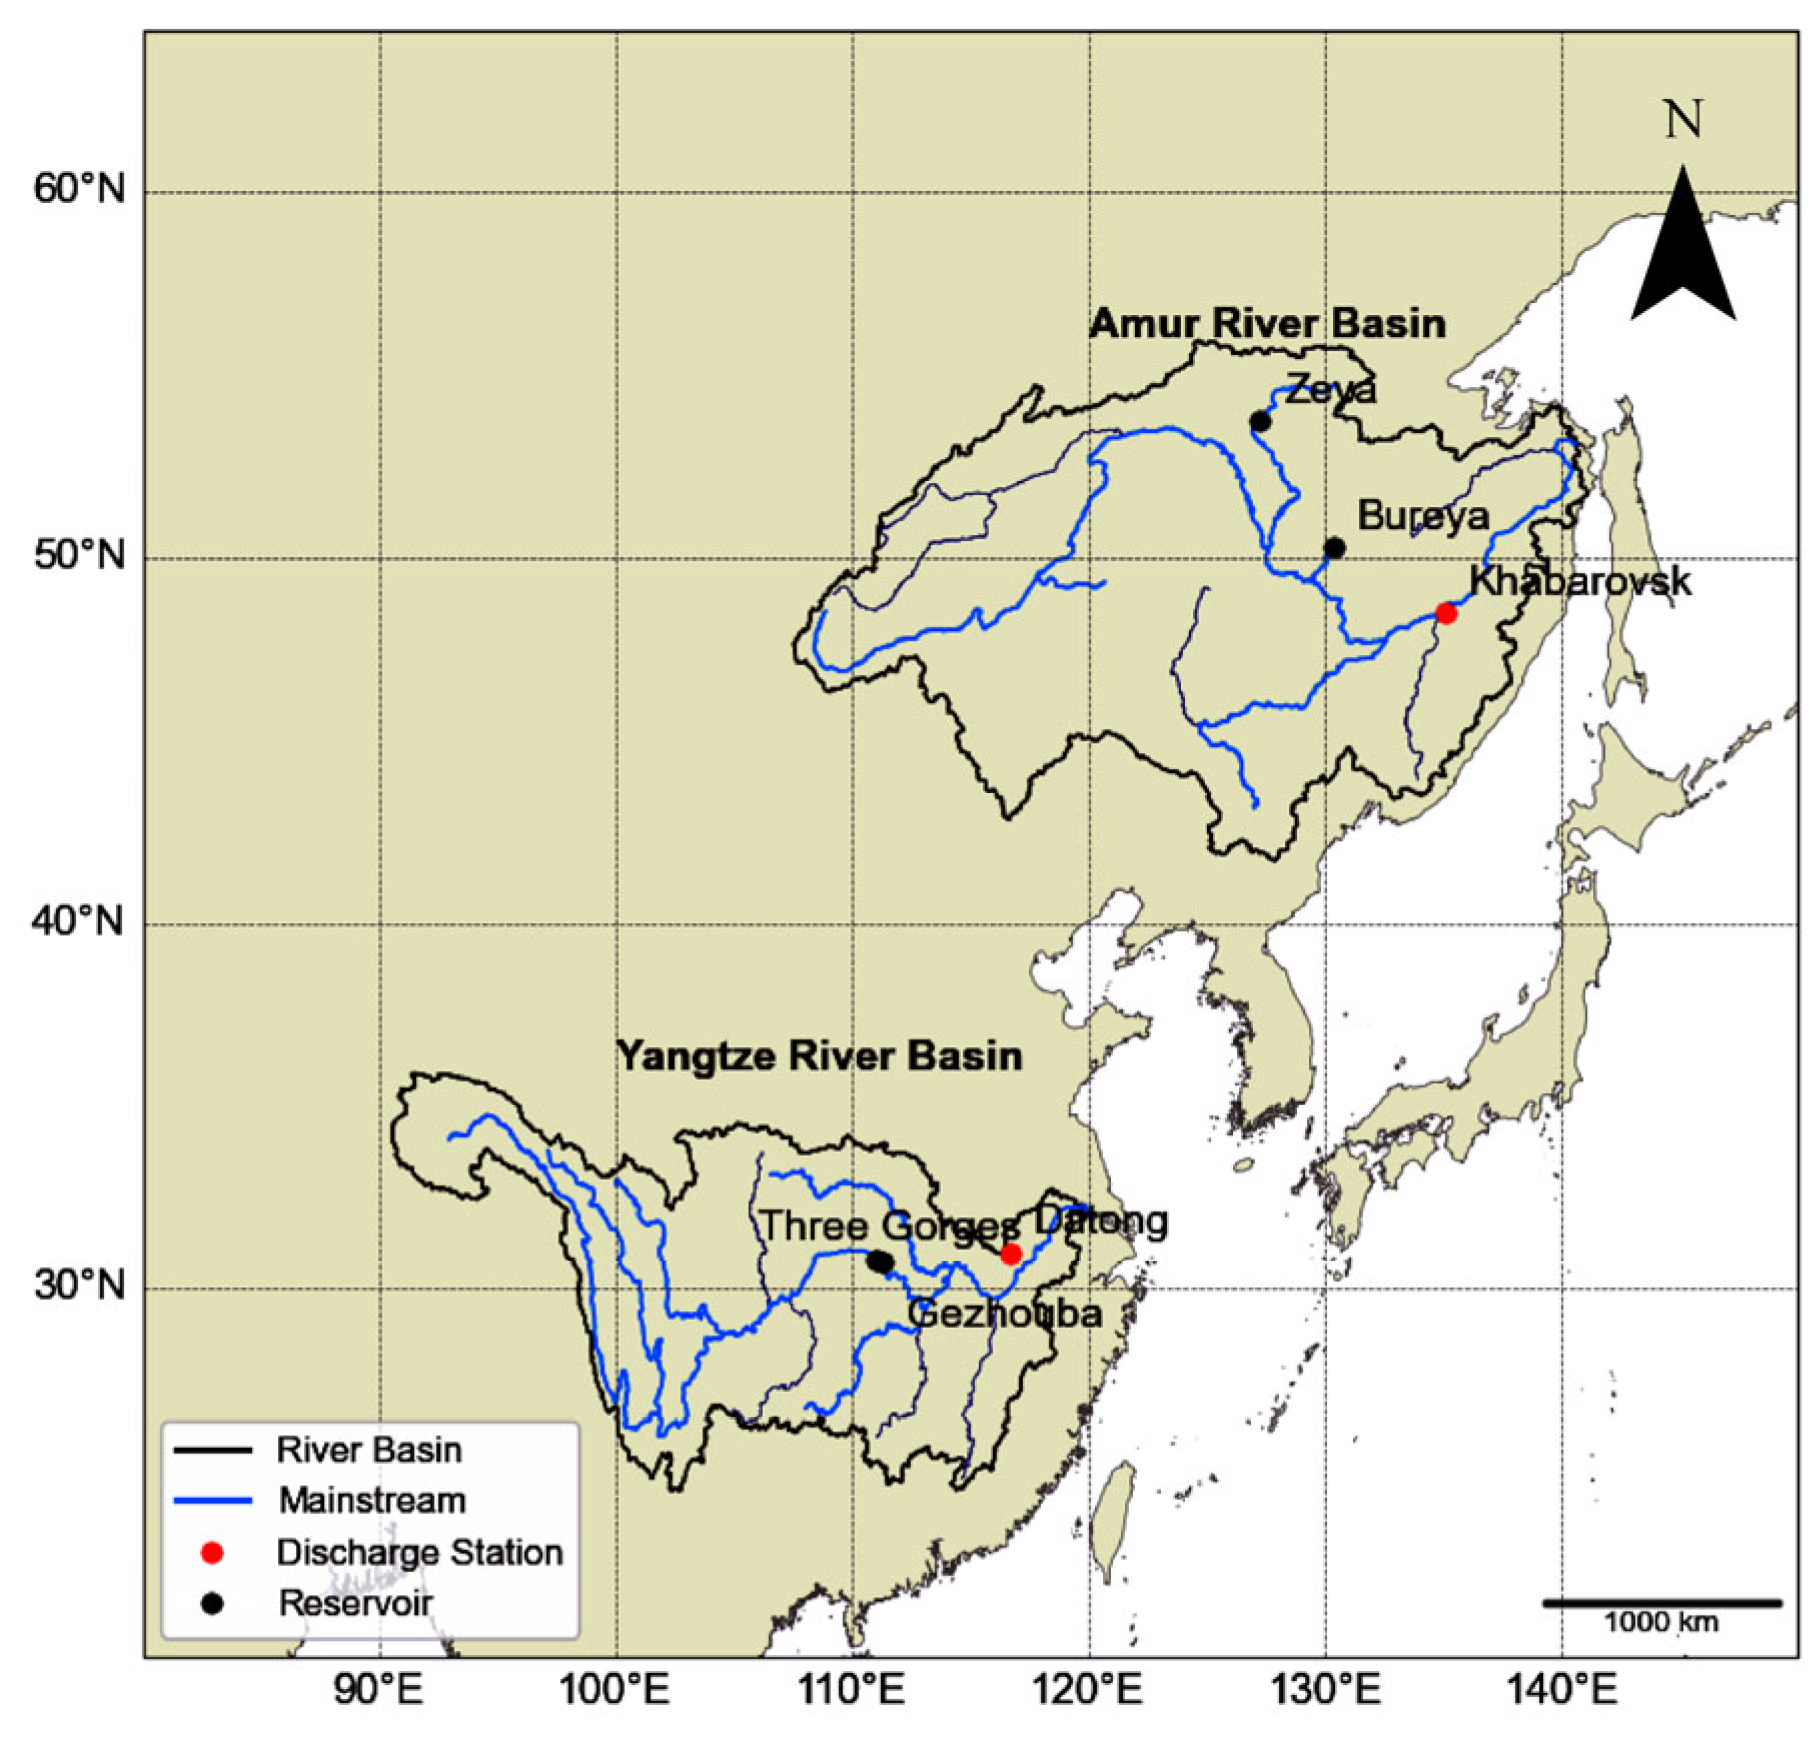
This study focuses on two major river systems which represent contrasting hydroclimatic regimes and regulation intensities. While the Amur basin is characterized by a cold continental monsoon climate with snowmelt-dominated runoff, the Yangtze basin is influenced by subtropical monsoon rainfall and intensive water infrastructure. These stations provide ideal testbeds to compare streamflow responses to climatic variability and anthropogenic regulation across differing environmental and institutional contexts. The geographical locations of the two basins and discharge stations are shown in Appendix A, Figure A1.
Recent research has significantly advanced the characterization of hydrological responses to the intertwined influences of climate variability and anthropogenic regulation. Efforts have focused on deciphering seasonal signatures, attributing discharge anomalies to atmospheric teleconnections, and diagnosing nonstationarity induced by reservoir operations across diverse hydroclimatic regimes. For instance, harmonic-based indices effectively capture how climatic seasonality translates into runoff variability [5], while circulation-type classifications reveal how shifts in pressure systems—such as ENSO-related ridges—modulate basin-scale precipitation and discharge [6]. In high-altitude or monsoon-sensitive catchments, abrupt regime shifts have been detected using composite statistical approaches [7], underscoring both climatic sensitivity and human-induced change.
The role of dam construction in altering streamflow seasonality, baseflow persistence, and flood amplitude has been widely documented. In the Amur River basin, regulation has been shown to suppress seasonal discharge contrast and modify multi-year periodicities [8], whereas in the Yangtze basin, upstream cascade reservoirs such as Gezhouba and Three Gorges have substantially reshaped flood magnitude and frequency patterns, particularly during extreme rainfall events [9]. Similar findings were reported in other basins worldwide, where dam construction and regulation led to significant changes in intra-annual flow regimes and hydrologic extremes [10,11], such as altered flood peaks, reduced low-flow variability, and delayed seasonal runoff timing. These studies collectively highlight that dam construction, often coupled with climatic variability, can significantly alter both seasonal flow regimes and hydrologic extremes, yet cross-basin comparative analyses remain limited.
To this end, physically based models and machine learning algorithms have increasingly been employed to separate climatic drivers from engineered influences [12,13]. Among various techniques, trend detection methods such as the Mann–Kendall test and Sen’s slope estimator are widely used to assess monotonic shifts in discharge under changing climate conditions [14,15]. The Pettitt test is applied to detect abrupt regime changes associated with dam construction or major climatic anomalies [16]. Wavelet analysis allows the identification of nonstationary periodic components in streamflow series, particularly those linked to multiscale teleconnection influences [17]. Recently, random forest models have gained traction for streamflow prediction due to their capacity to capture nonlinear and multivariate relationships. While their direct use for attribution remains limited, they offer potential for assessing the relative influence of climatic and anthropogenic factors on discharge variability [18].
Despite these advances, several knowledge gaps persist. Few studies offer unified frameworks that integrate both lagged climatic drivers and reservoir chronology across basins with distinct hydrological regimes. In particular, the spatial heterogeneity of teleconnection signals, the compound effects of climate extremes and infrastructure, and the mechanistic pathways through which regulation dampens or amplifies streamflow variability remain underexplored. Moreover, while previous research has often focused on either precipitation or temperature as the primary climate driver, few studies have incorporated multiple indices—including temperature, precipitation, ENSO, SOI, and AO—into a single attribution framework. Cross-basin comparisons between cold- and monsoon-dominated systems using an integrated methodology are also rare. These gaps underscore the need for comparative, multi-method assessments capable of separating natural and anthropogenic drivers across regions of contrasting hydroclimatic characteristics. This study addresses these gaps by employing a comprehensive approach that combines trend detection, wavelet analysis, percentile-based extreme event diagnostics, and machine learning-based attribution to evaluate streamflow nonstationarity and its drivers in two representative river basins. However, random forest models have limitations in interpretability and physical transparency, particularly in attributing lagged climate effects or assessing causal mechanisms.
To address these knowledge gaps, this study conducts a comparative assessment of streamflow nonstationarity at two major river stations with contrasting hydroclimatic settings and regulation intensities. We aim to clarify how climate variability and reservoir regulation jointly shape the long-term discharge variability, and which factors dominate the evolution of extreme discharge events in cold-temperate and monsoon-dominated basins. Specifically, we (1) identify discharge trends, regime shifts, and seasonal structure alterations using nonstationary diagnostics; (2) detect periodicities associated with climatic oscillations through wavelet analysis; (3) attribute streamflow variability to temperature, precipitation, and large-scale climate indices (ENSO, SOI, AO) using lagged random forest regression; and (4) quantify the contribution of regulation using a slope-based attribution method. This dual-basin framework integrates multiple diagnostic tools and machine learning, providing a process-oriented understanding of streamflow dynamics under compound climate–infrastructure influences, with practical implications for climate-resilient reservoir operation and adaptive water resource planning. Given the distinct climatic and regulatory contexts, we expect that streamflow at Khabarovsk is more influenced by regulation and temperature, while at Datong, monsoonal precipitation and climate teleconnections may play a greater role.

2. Materials and Methods

2.1. Study Area

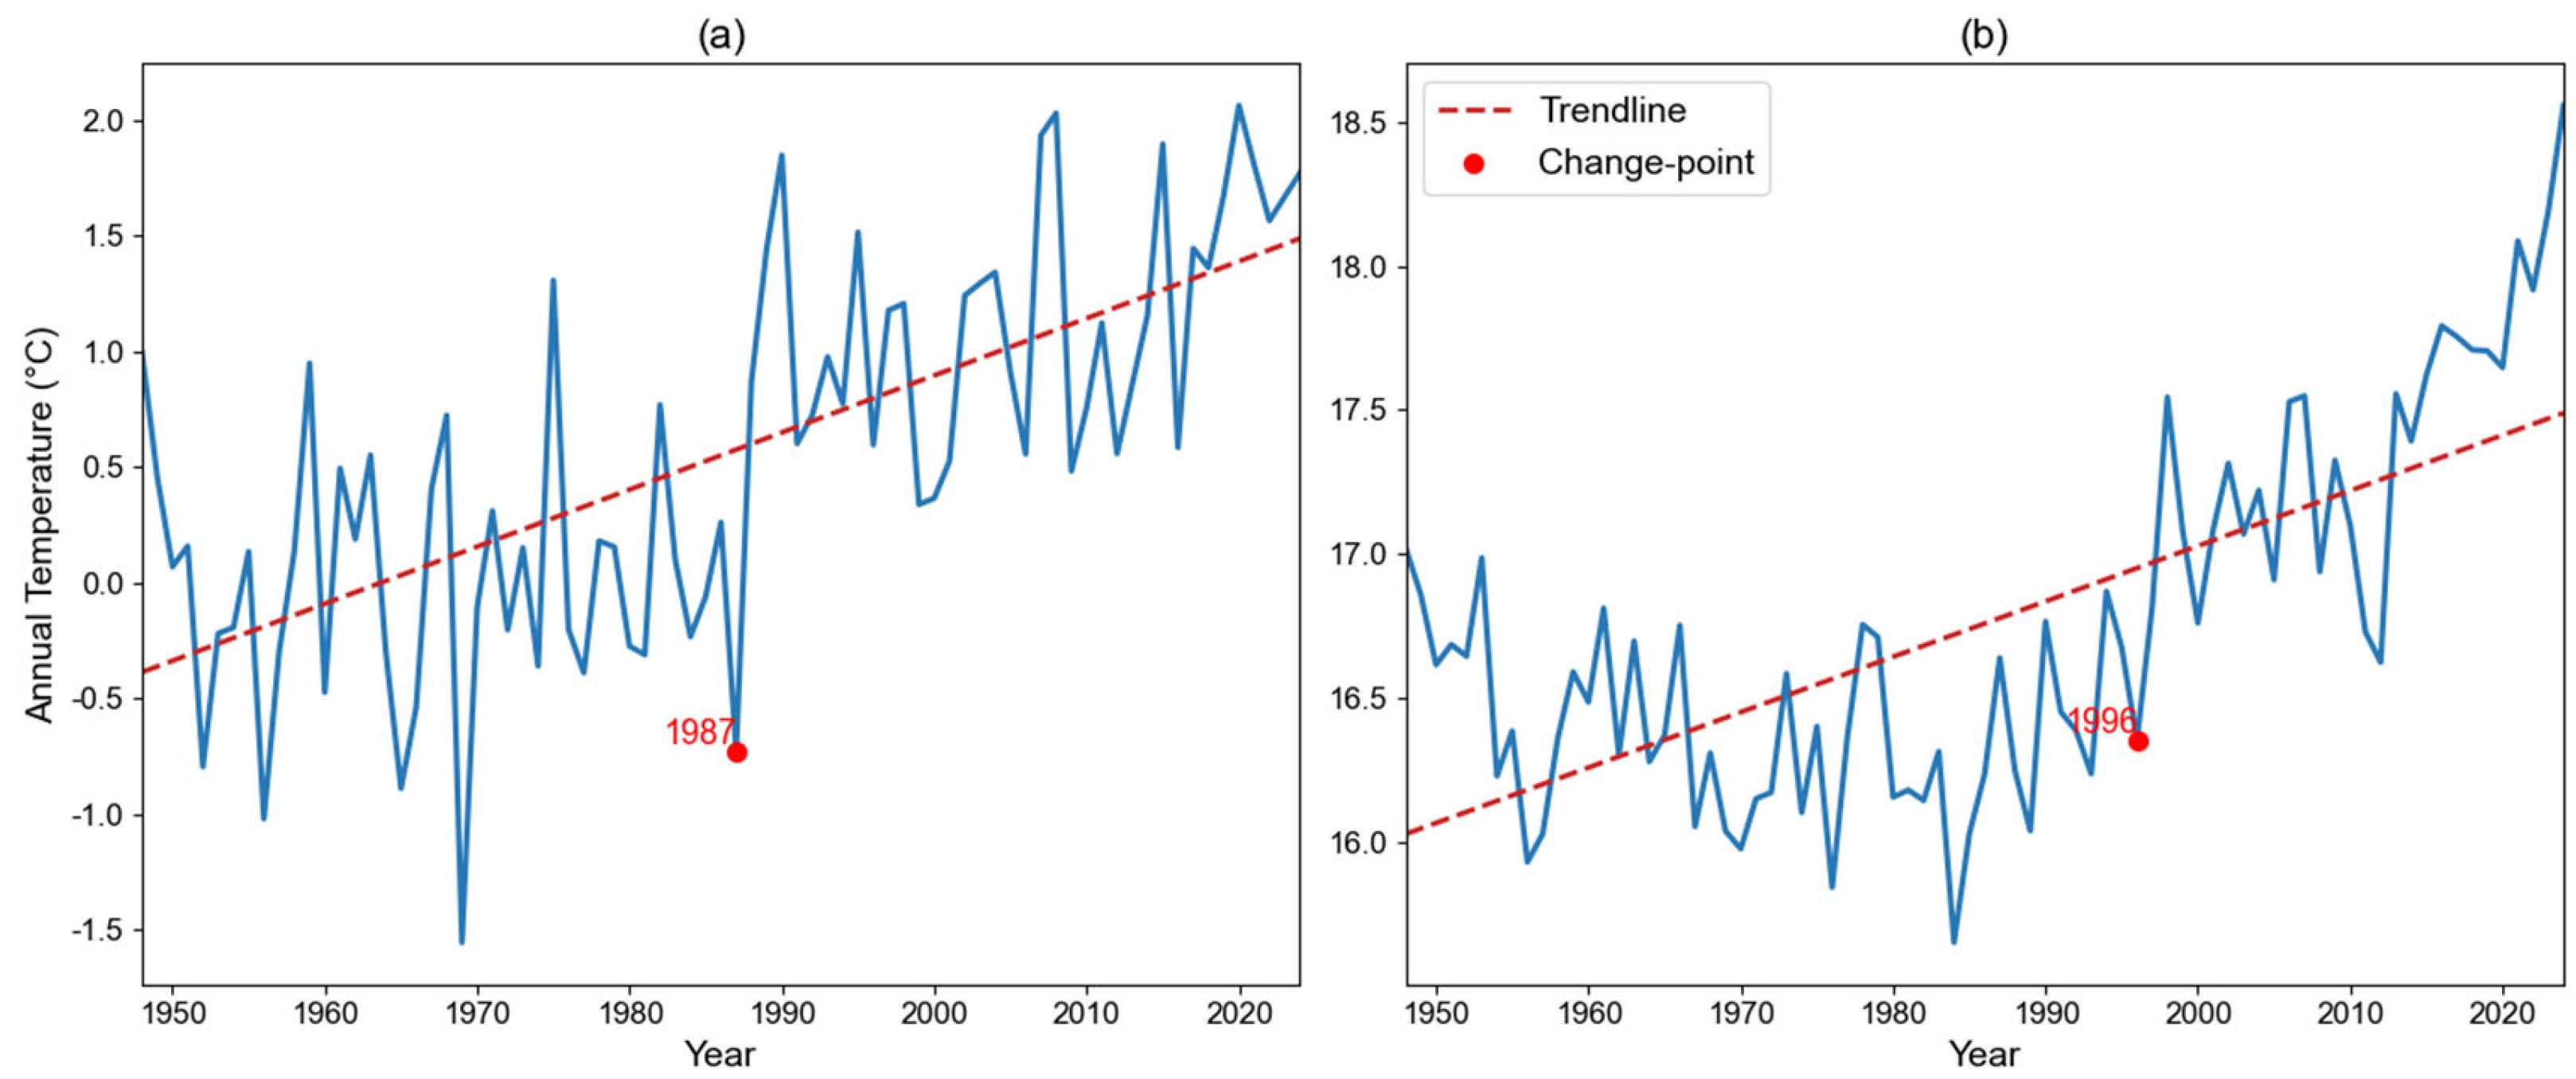
The Amur River (Figure 1a) originates in Mongolia and flows 4370 km through northeastern China and the Russian Far East, draining a basin of over 2 million km2. The region experiences a cold continental monsoon climate, with winter dominated by freezing and snow accumulation, and summer influenced by humid monsoons from the Sea of Okhotsk [19]. The Khabarovsk station (hereafter Khabar), in the lower Amur, is affected by upstream regulation from the Zeya and Bureya reservoirs. Zeya became operational in 1975, and Bureya in 2009, jointly altering seasonal discharge by supporting dry-season discharge and attenuating floods [20]. High discharge occurs from June to August, while winter baseflows reflect cold-season extremes and regulation. In recent decades, the region has exhibited a statistically significant upward trend in precipitation, with an abrupt change detected around 2008 (Appendix A, Figure A2a). Air temperature has also risen notably over the past seven decades, with a notable warming transition observed in 1987 (Appendix A, Figure A3a).
The Yangtze River (Figure 1b) spans 6300 km from the Tibetan Plateau to the East China Sea. The Gezhouba (1988) and Three Gorges (2009) projects regulate streamflow and influence downstream hydrology [21]. The Datong station, located in the lower Yangtze, serves as the final discharge control point. Streamflow peaks from June to August under the East Asian summer monsoon, while dry-season lows from December to February reflect winter monsoon influence [22]. Streamflow variability is shaped by both interannual climate forcing and upstream engineering controls [23]. Precipitation in the Datong region is relatively higher than that in Khabar, with a significant increasing trend and an evident change point identified in 2011 (Appendix A, Figure A2b). Similarly, a long-term warming trend is observed, with a turning point in 1996 (Appendix A, Figure A3b). These hydroclimatic characteristics lay the foundation for the comparative analysis of nonstationary discharge patterns between the two basins.

2.2. Data Sources

  • Discharge Data
Monthly discharge data for Khabar (1896–2021) were obtained from the Global Runoff Data Centre (GRDC, https://grdc.bafg.de/). For Datong, monthly discharge from 1965 to 2018 and annual extreme (maximum and minimum) monthly values from 1950 to 2018 were sourced from the GRDC, National Science & Technology Infrastructure of China (https://www.geodata.cn).
All datasets underwent quality control, including outlier correction and interpolation of missing records to ensure temporal consistency. These steps ensured temporal continuity and internal consistency of the discharge records. Key station characteristics are listed in Table 1.
Information on the major reservoirs affecting streamflow at the two stations—including construction year, commissioning year, total and active storage capacity—is summarized in Table 2.
  • Hydrometeorological Data
Daily precipitation data were obtained from the CMAP (CPC Merged Analysis of Precipitation) dataset (https://www.cpc.ncep.noaa.gov/, accessed on 4 August 2025) with a spatial resolution of 0.25° × 0.25°, covering the period 1979–2023. Monthly air temperature data were sourced from the GHCN_CAMS (Global Historical Climatology Network—Climate Analysis for Monitoring and Prediction) dataset (https://psl.noaa.gov/data/gridded/data.ghcncams.html, accessed on 4 August 2025) at a 0.25° resolution for 1948–2024. Monthly climate indices, including Niño3.4, the Southern Oscillation Index (SOI), and the Arctic Oscillation Index (AOI), were obtained from NOAA (https://psl.noaa.gov/data/timeseries/month/, accessed on 4 August 2025) for 1979–2021.
These indices and temperature fields have been widely used in hydrological studies as proxies for climate drivers. For instance, ENSO phases significantly influence rainfall and discharge variability in monsoon regions [24], while the Arctic Oscillation modulates wintertime circulation in cold basins [25]. Monthly temperature data capture the effect of long-term warming, which is an essential component of climate change impacts on streamflow regimes [26].
It should be noted that the precipitation dataset spans from 1979 to 2021, which limits climate–runoff linkage analyses to this period. Discharge data prior to 1979 (especially for Khabarovsk) are included for trend and regime shift analysis only, not for climate attribution. Temperature data were considered to reflect snowmelt and winter baseflow processes. Other factors such as evapotranspiration or monsoon indices were not included due to data limitations and to maintain a focused analysis. This limitation is noted in the Discussion. In particular, the lack of evapotranspiration data may introduce uncertainties in snowmelt-driven runoff processes in the Amur Basin, where energy availability strongly influences winter baseflow.

2.3. Methods

  • Nonstationary Analysis of Streamflow Time Series
To investigate the nonstationary characteristics of streamflow, we employed a suite of diagnostic methods to detect long-term trends, abrupt regime shifts, periodic cycles, and seasonal variability across multiple temporal scales.
Trend Detection. To detect long-term monotonic trends in the discharge time series, we applied the nonparametric Mann—Kendall (MK) test [27], which does not assume normality or linearity. It evaluates whether a monotonic upward or downward trend exists by calculating the MK statistic.
S = i = 1 n 1 j = i + 1 n s g n x j x i ,
where s g n x j x i denotes the sign function. Under the null hypothesis of no trend, S is approximately normally distributed. The standardized Z-score derived from S is then used to test statistical significance.
To quantify the trend magnitude, we further used Sen’s slope estimator [28], which calculates the median of all pairwise slopes between observations.
Q = m e d i a n x j x i j i ,     j > i
This method is reliable for outliers and especially suitable for hydrological datasets with non-normal distributions.
Regime Shift Identification. Abrupt shifts in the streamflow regime were detected using the Pettitt test [29], a rank-based, nonparametric change-point detection method. Unlike parametric approaches, it does not require prior specification of the change location and is sensitive to sudden shifts due to climatic variability or human regulation. The test statistic is defined as:
K t = m a x U t ,     U t = i = 1 t j = t + 1 n s g n x j x i
where the time t corresponding to the maximum absolute value K t is identified as the most probable change point. The statistical significance is evaluated through permutation-based approximations of the p-value. The significance of the identified change points was assessed based on the p-values derived from the Pettitt test (p < 0.05). However, we note that the Pettitt test can be sensitive to series length and data variability, which may affect the stability of detected change points.
It is worth noting that while the Pettitt test is a widely used nonparametric approach for abrupt change detection, it may exhibit sensitivity to the time series length and the underlying data distribution, potentially leading to spurious change-point detection. To mitigate this risk, test results were interpreted in conjunction with contextual hydrological changes (e.g., known dam operations or climatic shifts), and corroborated visual trend inspection and Sen’s slope results for consistency.
Wavelet analysis. To suggest the major periodicities in the streamflow series and their temporal evolution, we applied the continuous wavelet transform (CWT) using the Morlet wavelet as the mother function [30]. The CWT of a signal x t is defined as
W a , b = 1 a x t ψ * t b a d t
where a and b are the scale and translation parameters, respectively, and ψ * is the complex conjugate of the Morlet wavelet. Here, x t denotes the raw monthly discharge time series (mean, minimum, and maximum values), which is directly used as the input signal for the continuous wavelet transform. In the continuous wavelet transform, the scale parameter controls the stretching or compression of the wavelet, with smaller scales capturing high-frequency variations and larger scales capturing low-frequency trends. The translation parameter shifts the wavelet along the time axis to detect localized nonstationary features. The Morlet wavelet used in this study is complex-valued, and its complex conjugate allows for the extraction of both the amplitude and phase information of periodic components. This method provides a joint time–frequency representation of nonstationary signals, effectively identifying evolving periodic structures such as seasonal or multi-year oscillations in hydrological series. Wavelet power spectra were computed using the Morlet wavelet to examine the temporal evolution of dominant hydrological cycles. While the main figures display raw power distributions, supplementary tests were performed against a red noise background to assess the statistical significance of dominant periodicities. The cone of influence (COI) was also considered to avoid edge-effect misinterpretation. In Khabarovsk, the major power bands fell within the COI and exceeded the 95% confidence level, supporting their interpretive value. In contrast, most periodic signals in Datong lay outside the COI or lacked statistical support, and are thus treated as indicative rather than definitive patterns.
  • Definition and Characterization of Extreme Events
Extreme streamflow events were defined based on fixed percentile thresholds to ensure consistency across basins with different discharge regimes, following widely used practices in climate and hydrological studies [31]; monthly discharges above the 95th percentile were identified as extreme high discharge (floods), and those below the 5th percentile as extreme low discharge (droughts). Although this percentile-based approach may not capture absolute extremes such as 100-year floods, it provides a consistent relative measure of discharge anomalies for inter-station comparison. While duration–frequency–intensity (FDI) metrics or peak-over-threshold (POT) methods are widely used to assess design-level flood risks, this study adopts a magnitude-based percentile threshold as a first-order diagnostic. Future research could integrate these complementary methods to improve the representation of extreme event distributions. The number, magnitude, and timing of such events were extracted and compared across the study period to examine their variability and evolution, as listed in Table 3.
  • Attribution of Climatic Drivers Using Lagged Random Forests
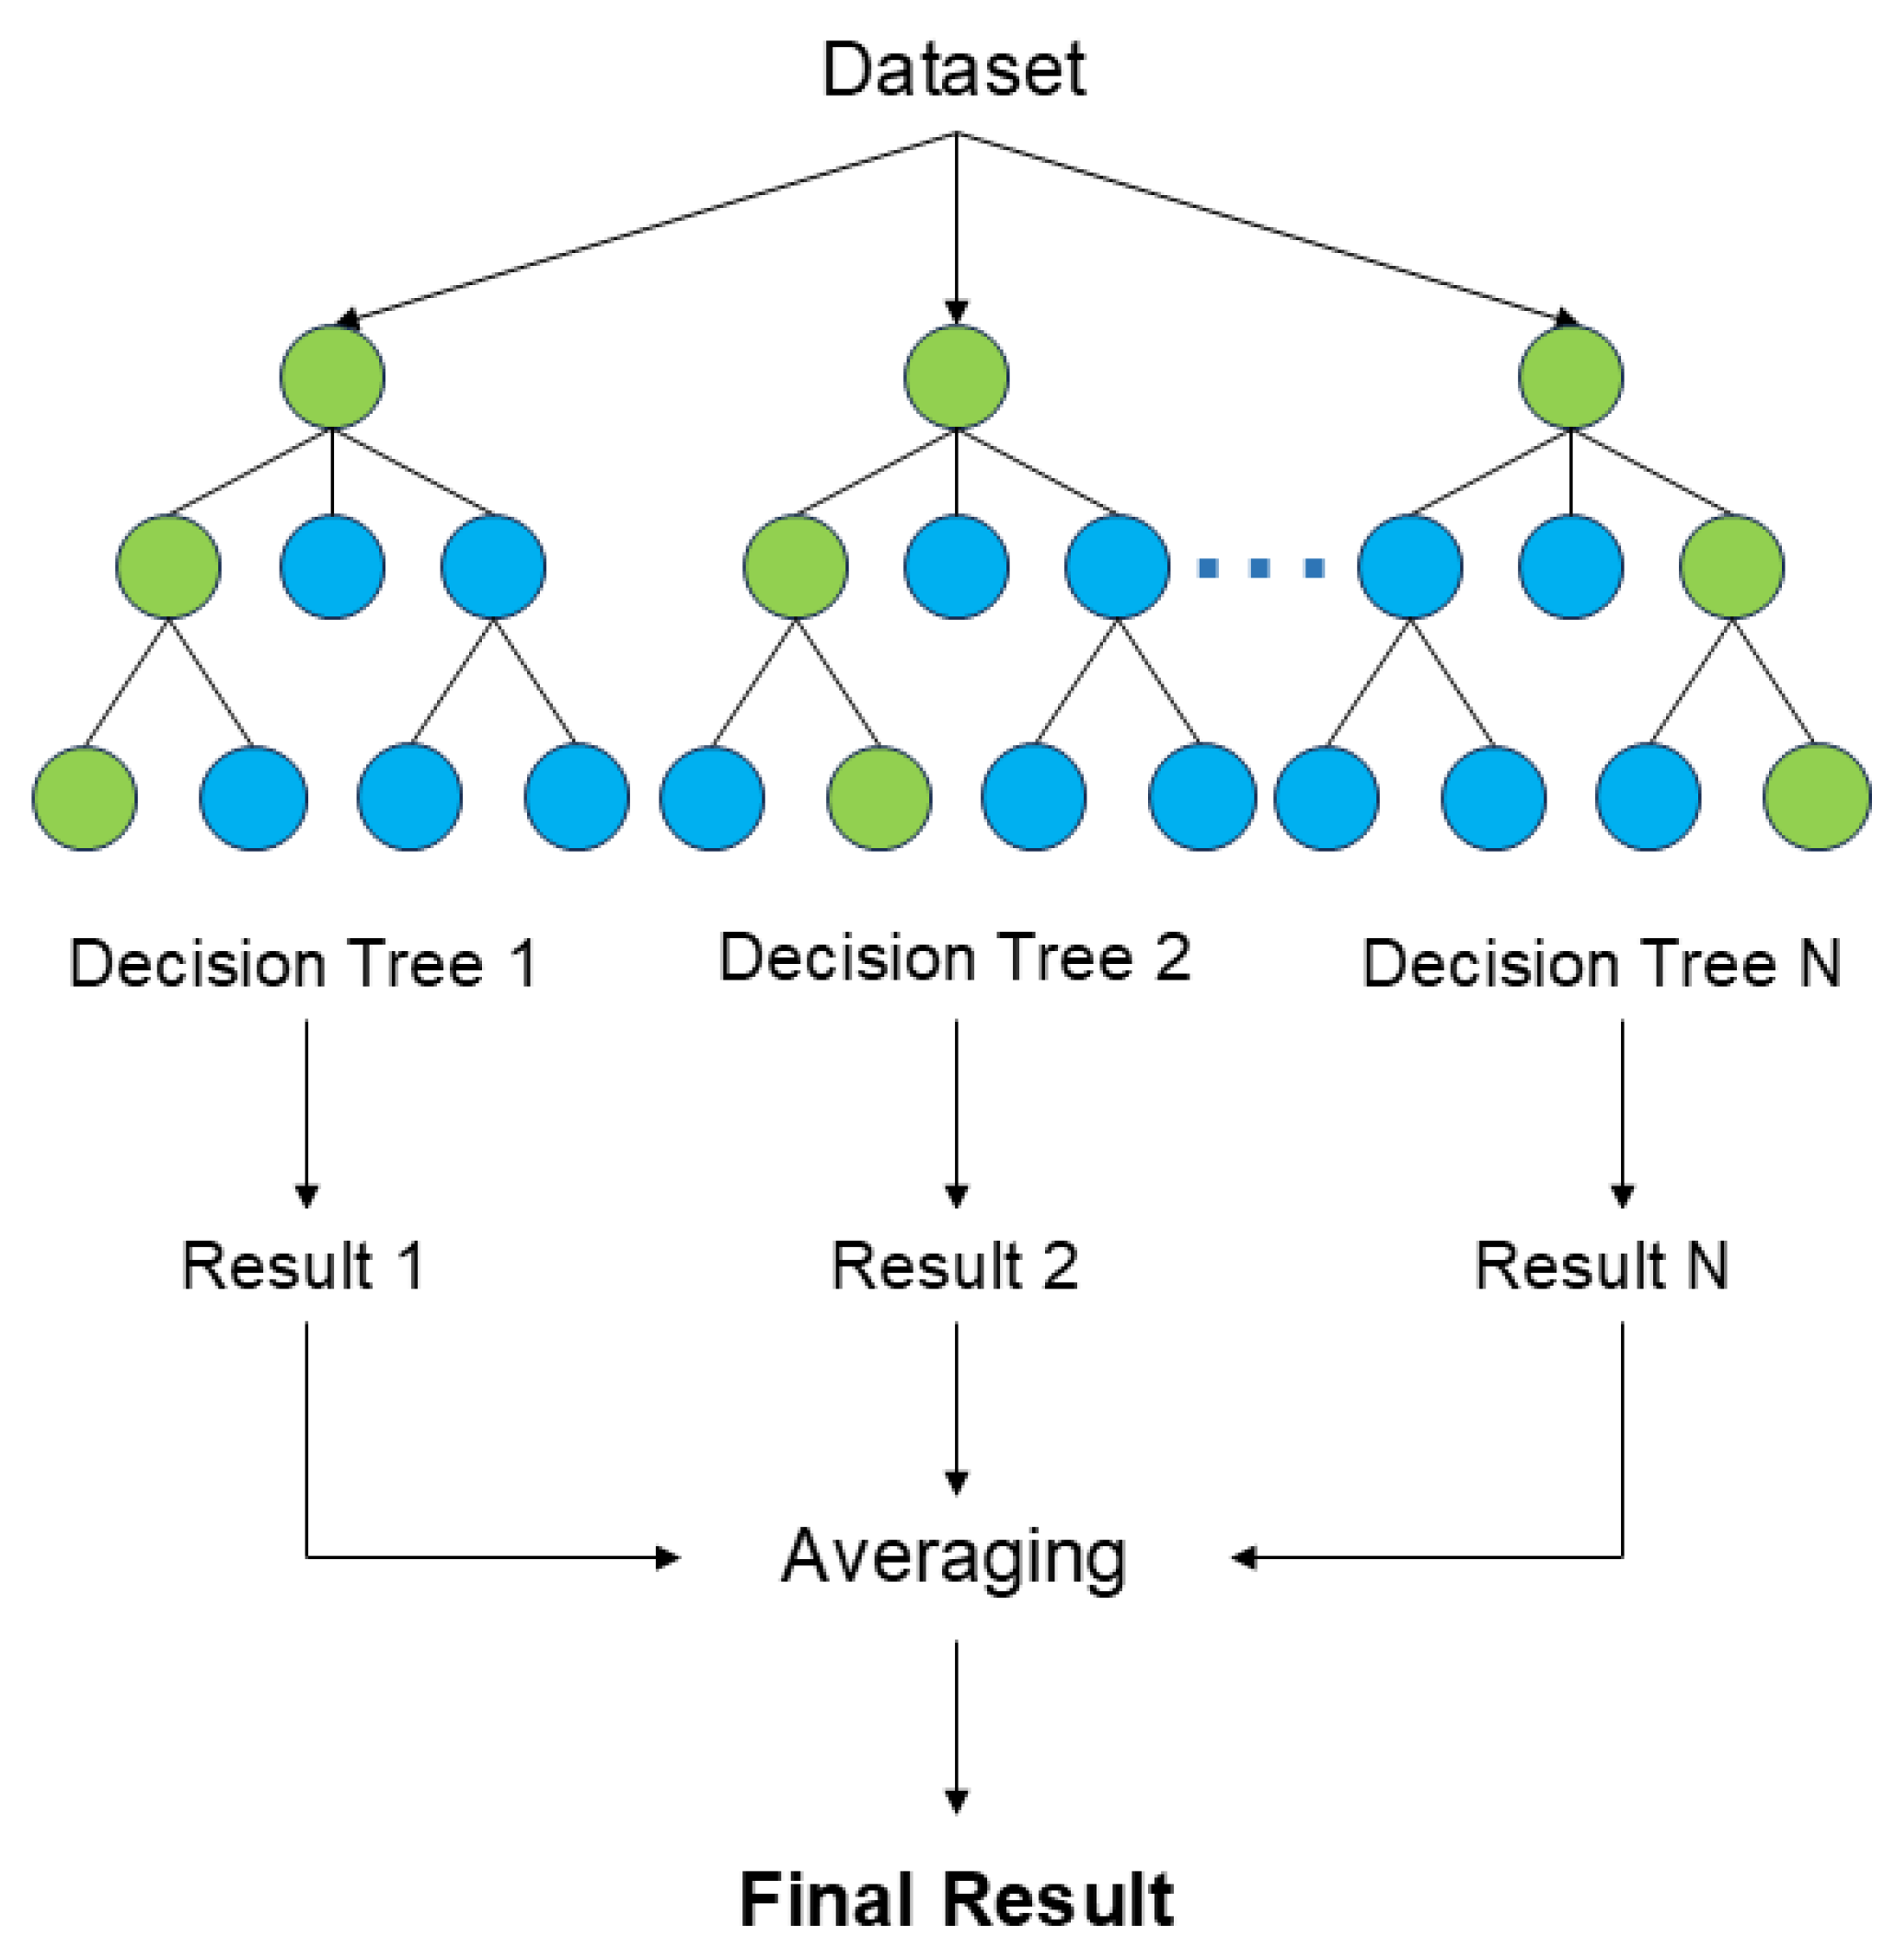
To evaluate the influence of climatic drivers on runoff variability, we applied a random forest (RF) regression model—an ensemble learning algorithm that aggregates multiple decision trees built from bootstrap samples and randomly selected predictors (Figure 2) [32]. RF reduces overfitting and improves predictive stability by averaging the outputs of individual trees, making it well-suited for capturing nonlinear relationships, high-dimensional structures, and inter-variable dependencies commonly present in hydrological data.
The model consisted of 1000 decision trees, with a maximum depth of 5 to avoid overfitting. Minimum samples required for node splitting and leaf formation were set to 10 and 2, respectively, to control model complexity. These parameters were selected to ensure generalizability across nonlinear climate–streamflow relationships.
In addition to prediction, RF calculates feature importance scores by evaluating the increase in prediction error when each variable is randomly permuted. This permutation-based metric provides insights into the relative contributions of climatic variables such as temperature, precipitation, and teleconnection indices. While correlation checks were performed, potential biases from spurious lags or residual multicollinearity cannot be fully excluded. Since the discharge and climate indices exhibit seasonal and long-term variability, random forest, as a nonparametric method, is less sensitive to stationarity assumptions. We further examined predictor correlations to avoid severe multicollinearity, ensuring stable variable importance rankings. The rationale for lag selection and variable importance interpretation is elaborated in the Results Section.
  • Slope-based Attribution Method:
To quantify the relative influence of climate variability and human regulation on discharge changes, we applied a slope-based attribution method built upon Sen’s slope estimates. A significant change point in the discharge time series was first identified using the Pettitt test. The linear trend during the pre-change period was assumed to represent climate-driven discharge evolution, while the post-change trend captured the combined effects of climate and anthropogenic regulation. This slope-based attribution approach cannot fully account for gradual or nonlinear climate influences, which may overlap with reservoir effects. It is a simplified diagnostic, providing a first-order comparison of pre-regulation and post-regulation trends. Gradual changes in temperature or precipitation may be partially conflated with reservoir effects; thus our attribution estimates should be interpreted as indicative rather than definitive.
The engineering and climate contributions were separated by comparing the pre- and post-change slopes with the overall trend across the entire period. Specifically, the Engineering Contribution Rate (ECR) and Climate Contribution Rate (CCR) were computed as
E C R = S p o s t S p r e S a l l × 100 % ,     C C R = S p r e S a l l × 100 %
where S p r e , S p o s t , and S a l l represent the Sen’s slopes for the pre-change period, post-change period, and the entire time series, respectively. This approach enables a first-order approximation of the discharge trend components attributable to natural climate forcing and human-induced modifications. Similar slope-based attribution frameworks have been employed in prior studies to assess anthropogenic impacts on hydrological nonstationarity [33]. We recognize that attributing all post-change variations to human activity oversimplifies the complex interactions between gradual climate change and engineering regulation. Our approach highlights the timing of major regime shifts (e.g., dam commissioning) but cannot fully disentangle overlapping effects from long-term climatic trends. In particular, it assumes that pre-change trends primarily reflect climatic variability, which may oversimplify gradual processes such as progressive warming and snowmelt dynamics in the post-change period.

3. Results

3.1. Streamflow Nonstationarity Characteristics

3.1.1. Interannual Trends and Abrupt Changes

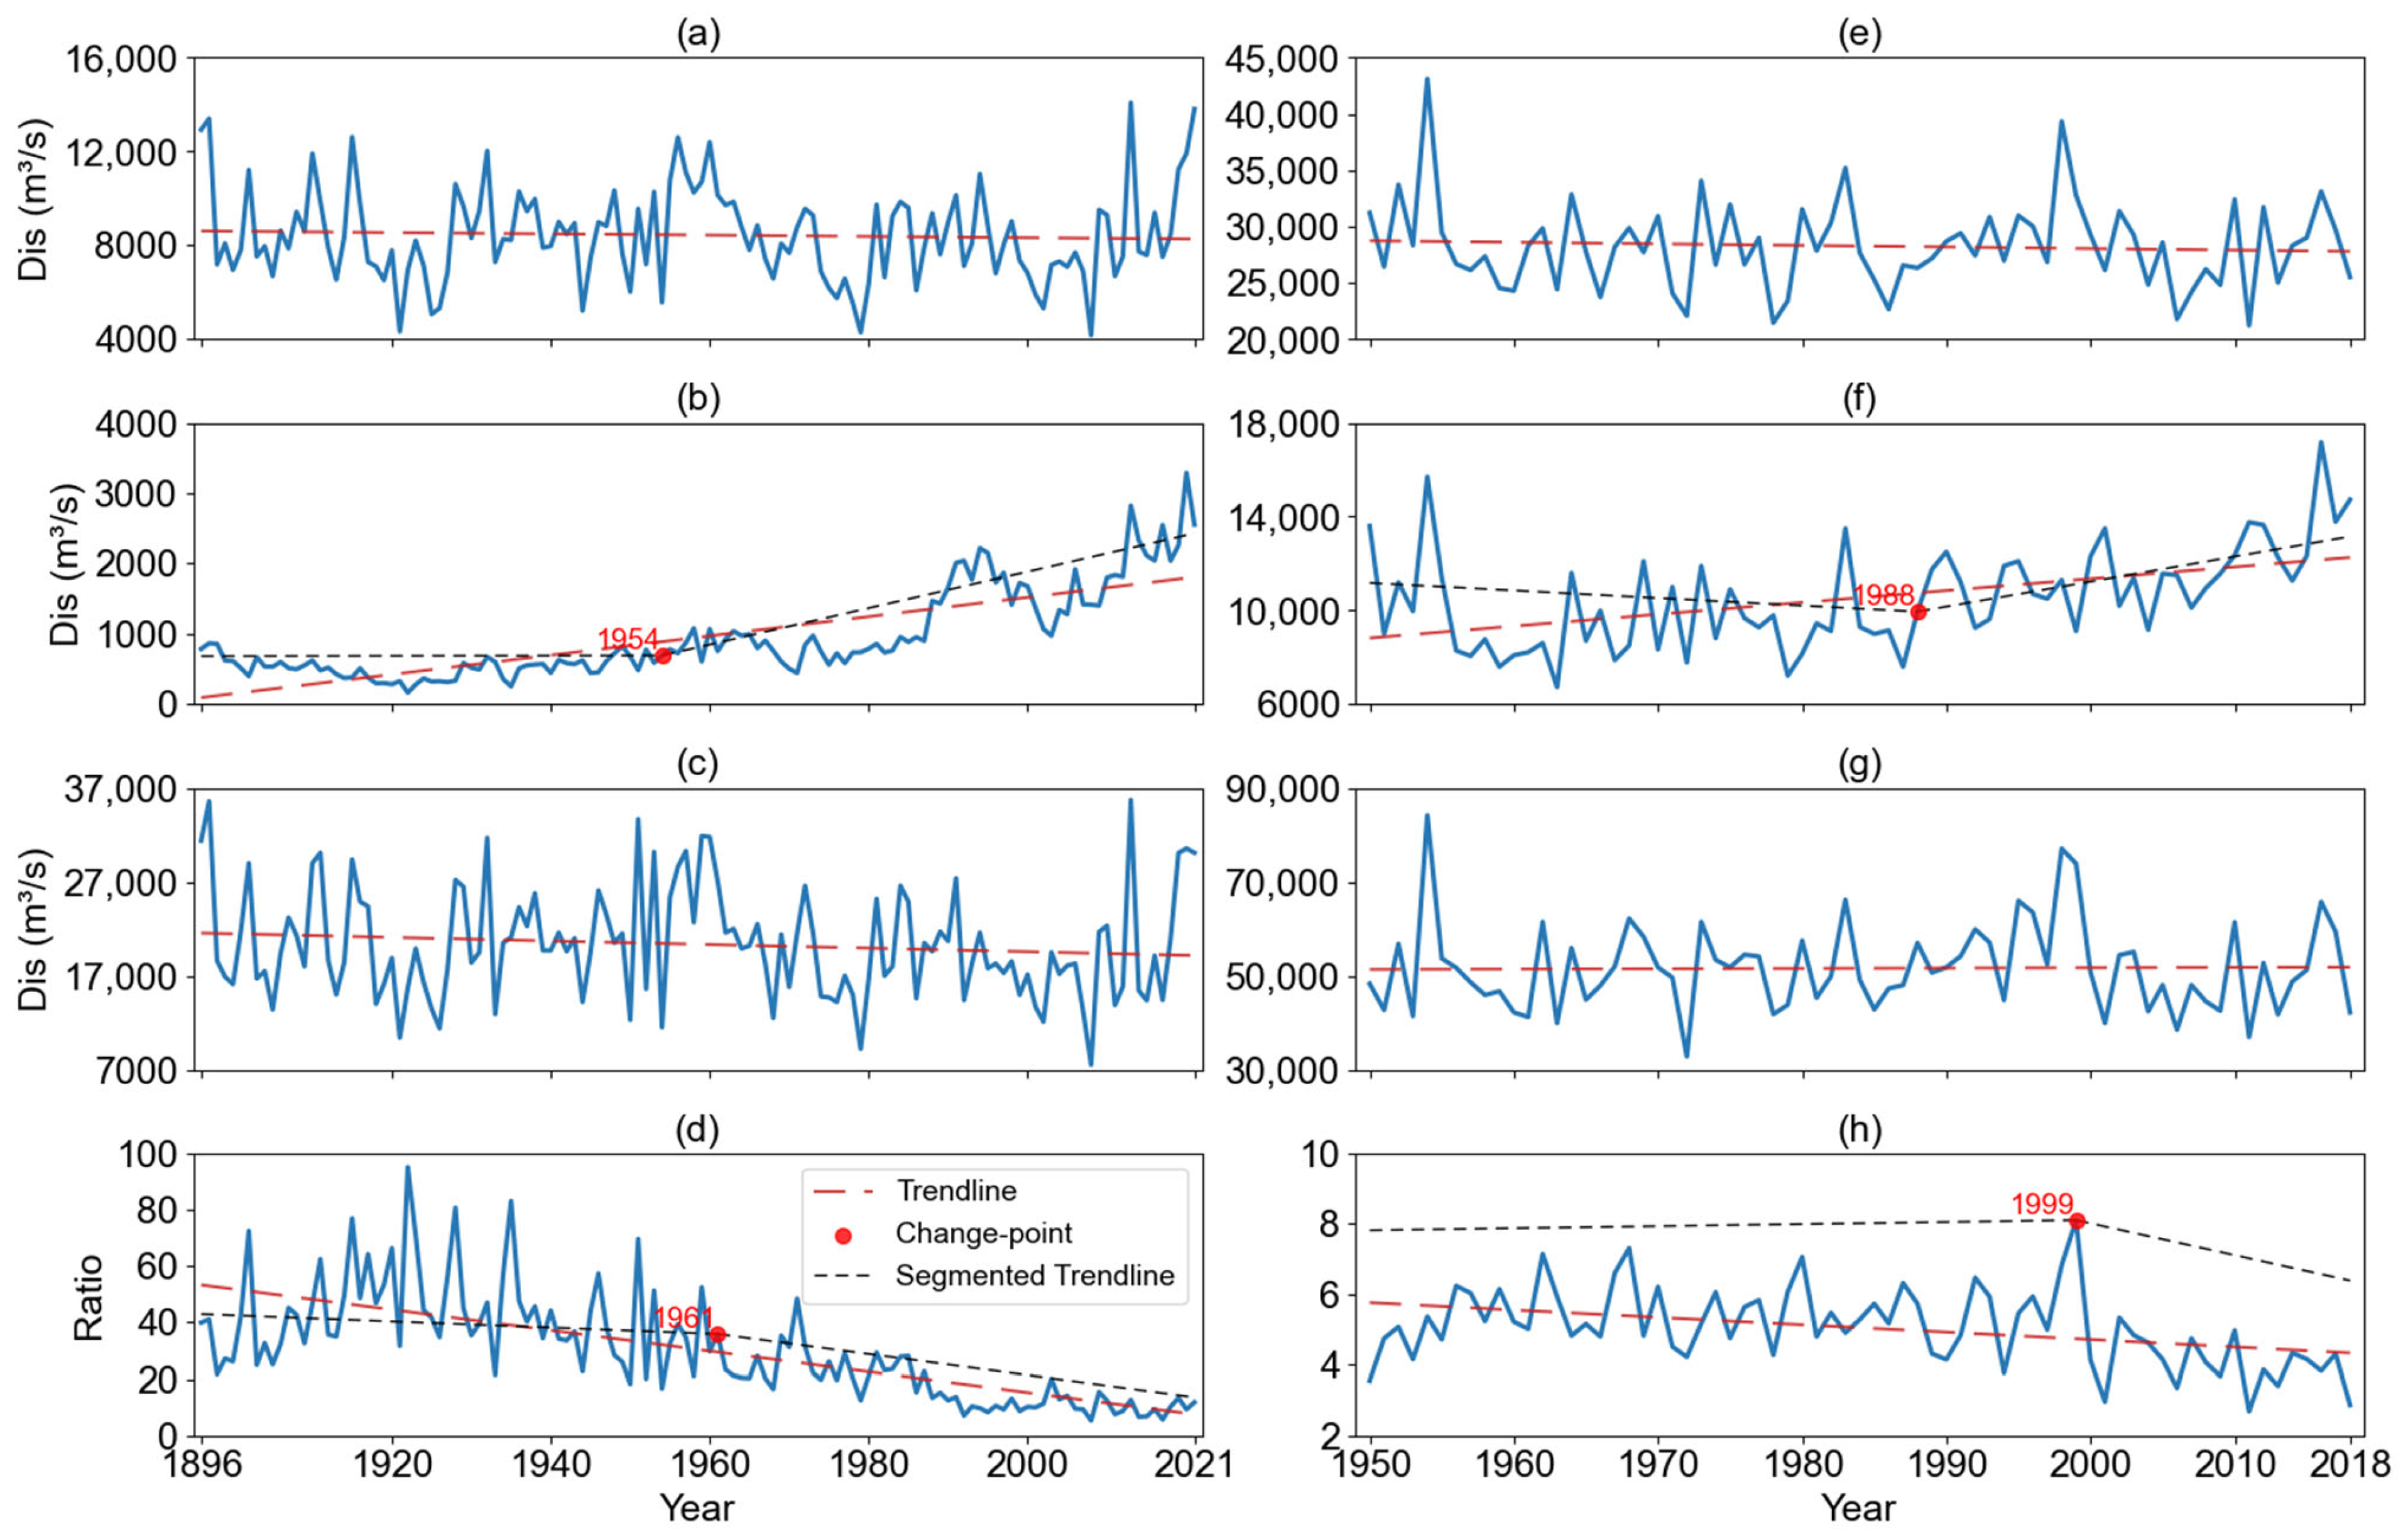
Figure 3 presents the long-term changes in streamflow characteristics at the Khabarovsk and Datong stations, focusing on the annual mean discharges, annual maximum and minimum monthly discharges, and the ratio between them (hereafter referred to as the discharge ratio). At Khabarovsk, the annual mean series (Figure 3a) remains largely stable over the period 1896–2021, with only a weak and statistically insignificant declining trend, while the annual minimum monthly discharges (Figure 3b) exhibit a marked upward trend with a significant change point in 1954 rising from 513 m3 /s to 1335 m3 /s. This shift occurred two decades prior to the operation of the Zeya Reservoir, and may reflect early hydrological transitions in the basin, which were later amplified by regulation. Baklanov & Voronov [34] reported a 6-8-fold increase in winter discharge after the reservoir’s operation, consistent with the observed rise in post-1950s baseflow. However, natural climate variability may also have contributed to this change, although regulation is likely the main factor. The annual maximum monthly discharges (Figure 3c) remain largely unchanged over time.
The discharge ratio at Khabarovsk (Figure 3d), reflecting intra-annual variability, shows a clear decline with a change point in 1961, as elevated minimum discharge reduces seasonal contrast. The ratio falls from 43 to 17, indicating enhanced winter baseflow due to upstream regulation [35]. At Datong, mean discharge (Figure 3e) shows a slight but nonsignificant decrease. Minimum discharge (Figure 3f) rises notably after 1988, increasing from 9386 to 10,754 m3/s. While the observed increase in flood-season discharge is consistent with the timeline of the Gezhouba Project, concurrent rises in regional precipitation—particularly after 2010—suggest that climate variability also contributed to this trend. Thus, the post-1988 increase likely reflects the combined effects of enhanced rainfall and modified regulation patterns [36]. Maximum discharge (Figure 3g) is stable, while the discharge ratio (Figure 3h) declines post-1999, from 5.5 to 4.0, reflecting discharge stabilization in dry seasons [37].

3.1.2. Periodicity and Long-Term Oscillations

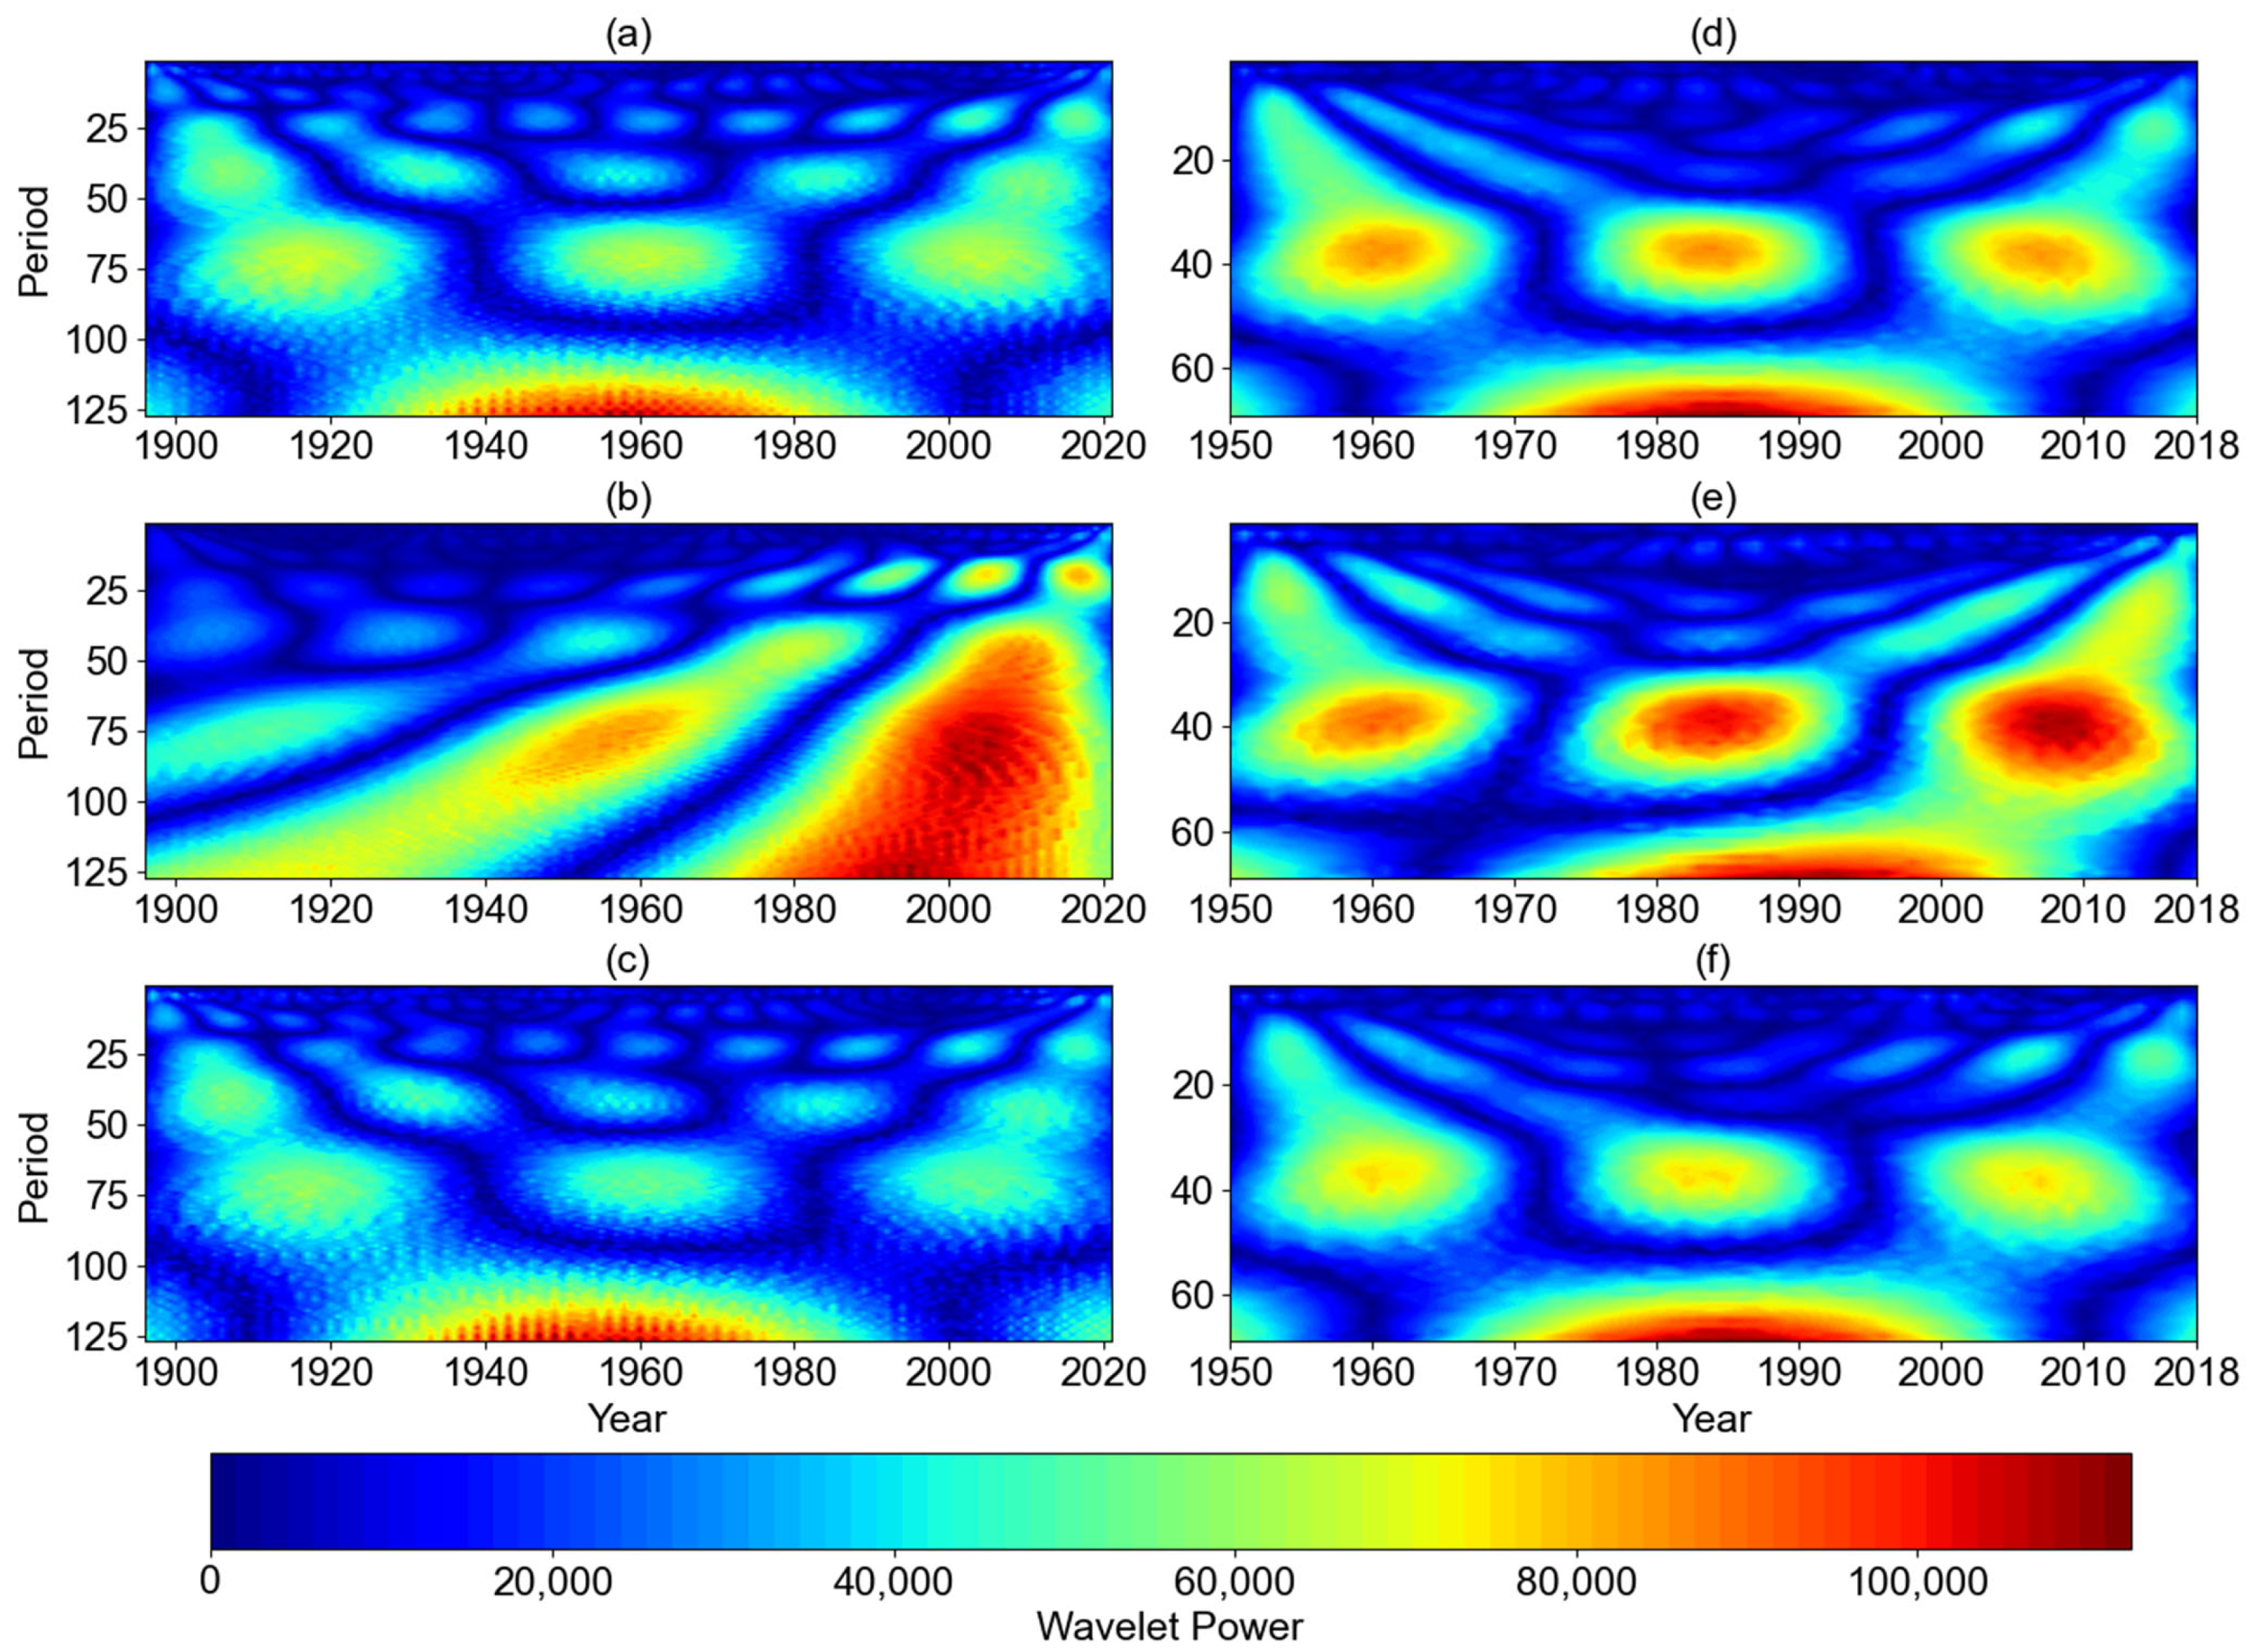
Wavelet analysis (Figure 4) suggests distinct periodic behaviors at the two stations. The color scale represents the normalized wavelet power, with warmer colors indicating stronger periodic signals. At Khabarovsk, the mean and maximum discharges (Figure 4a,c) exhibit predominant periodicities of 25–55 and approximately 100 years, with enhanced power during 1930–1980. The minimum discharge (Figure 4b) displays a noticeable increase in low-frequency power after 1960, reflecting the growing influence of long-term regulation and climatic processes. The 25–55-year cycles observed in Khabarovsk correspond to typical timescales of low-frequency climate oscillations such as the Pacific Decadal Oscillation (PDO), which modulates hydroclimatic variability across northern East Asia. This correspondence suggests a potential teleconnection influencing long-term baseflow and seasonal contrast. In contrast, all three discharge series at Datong (Figure 4d–f) demonstrate a consistent 40–50-year cycle, particularly after the 1980s. The strengthened periodicity in minimum and mean discharge suggests the combined effects of monsoonal variability and sustained reservoir regulation. Maximum discharge variability appears reduced, indicating a greater degree of flood control. These wavelet spectra are intended for comparative interpretation. Supplementary red noise significance testing confirmed that the identified periodicities in Khabarovsk lie within the COI and exceed the 95% confidence level. However, in Datong, the apparent 100-year cycle exceeds the available data record, which spans approximately 70 years, and falls outside the COI, suggesting a boundary effect. Therefore, Datong’s long-period signals are treated as qualitative references rather than statistically robust features.
Khabarovsk is mainly influenced by low-frequency variability tied to climate and cold-region hydrology, while Datong exhibits a stable decadal rhythm shaped by subtropical rainfall patterns and anthropogenic regulation. The contrast between the two stations indicates how runoff periodicity responds differently under distinct climatic and hydrological settings.

3.1.3. Seasonal Patterns of High and Low Discharges

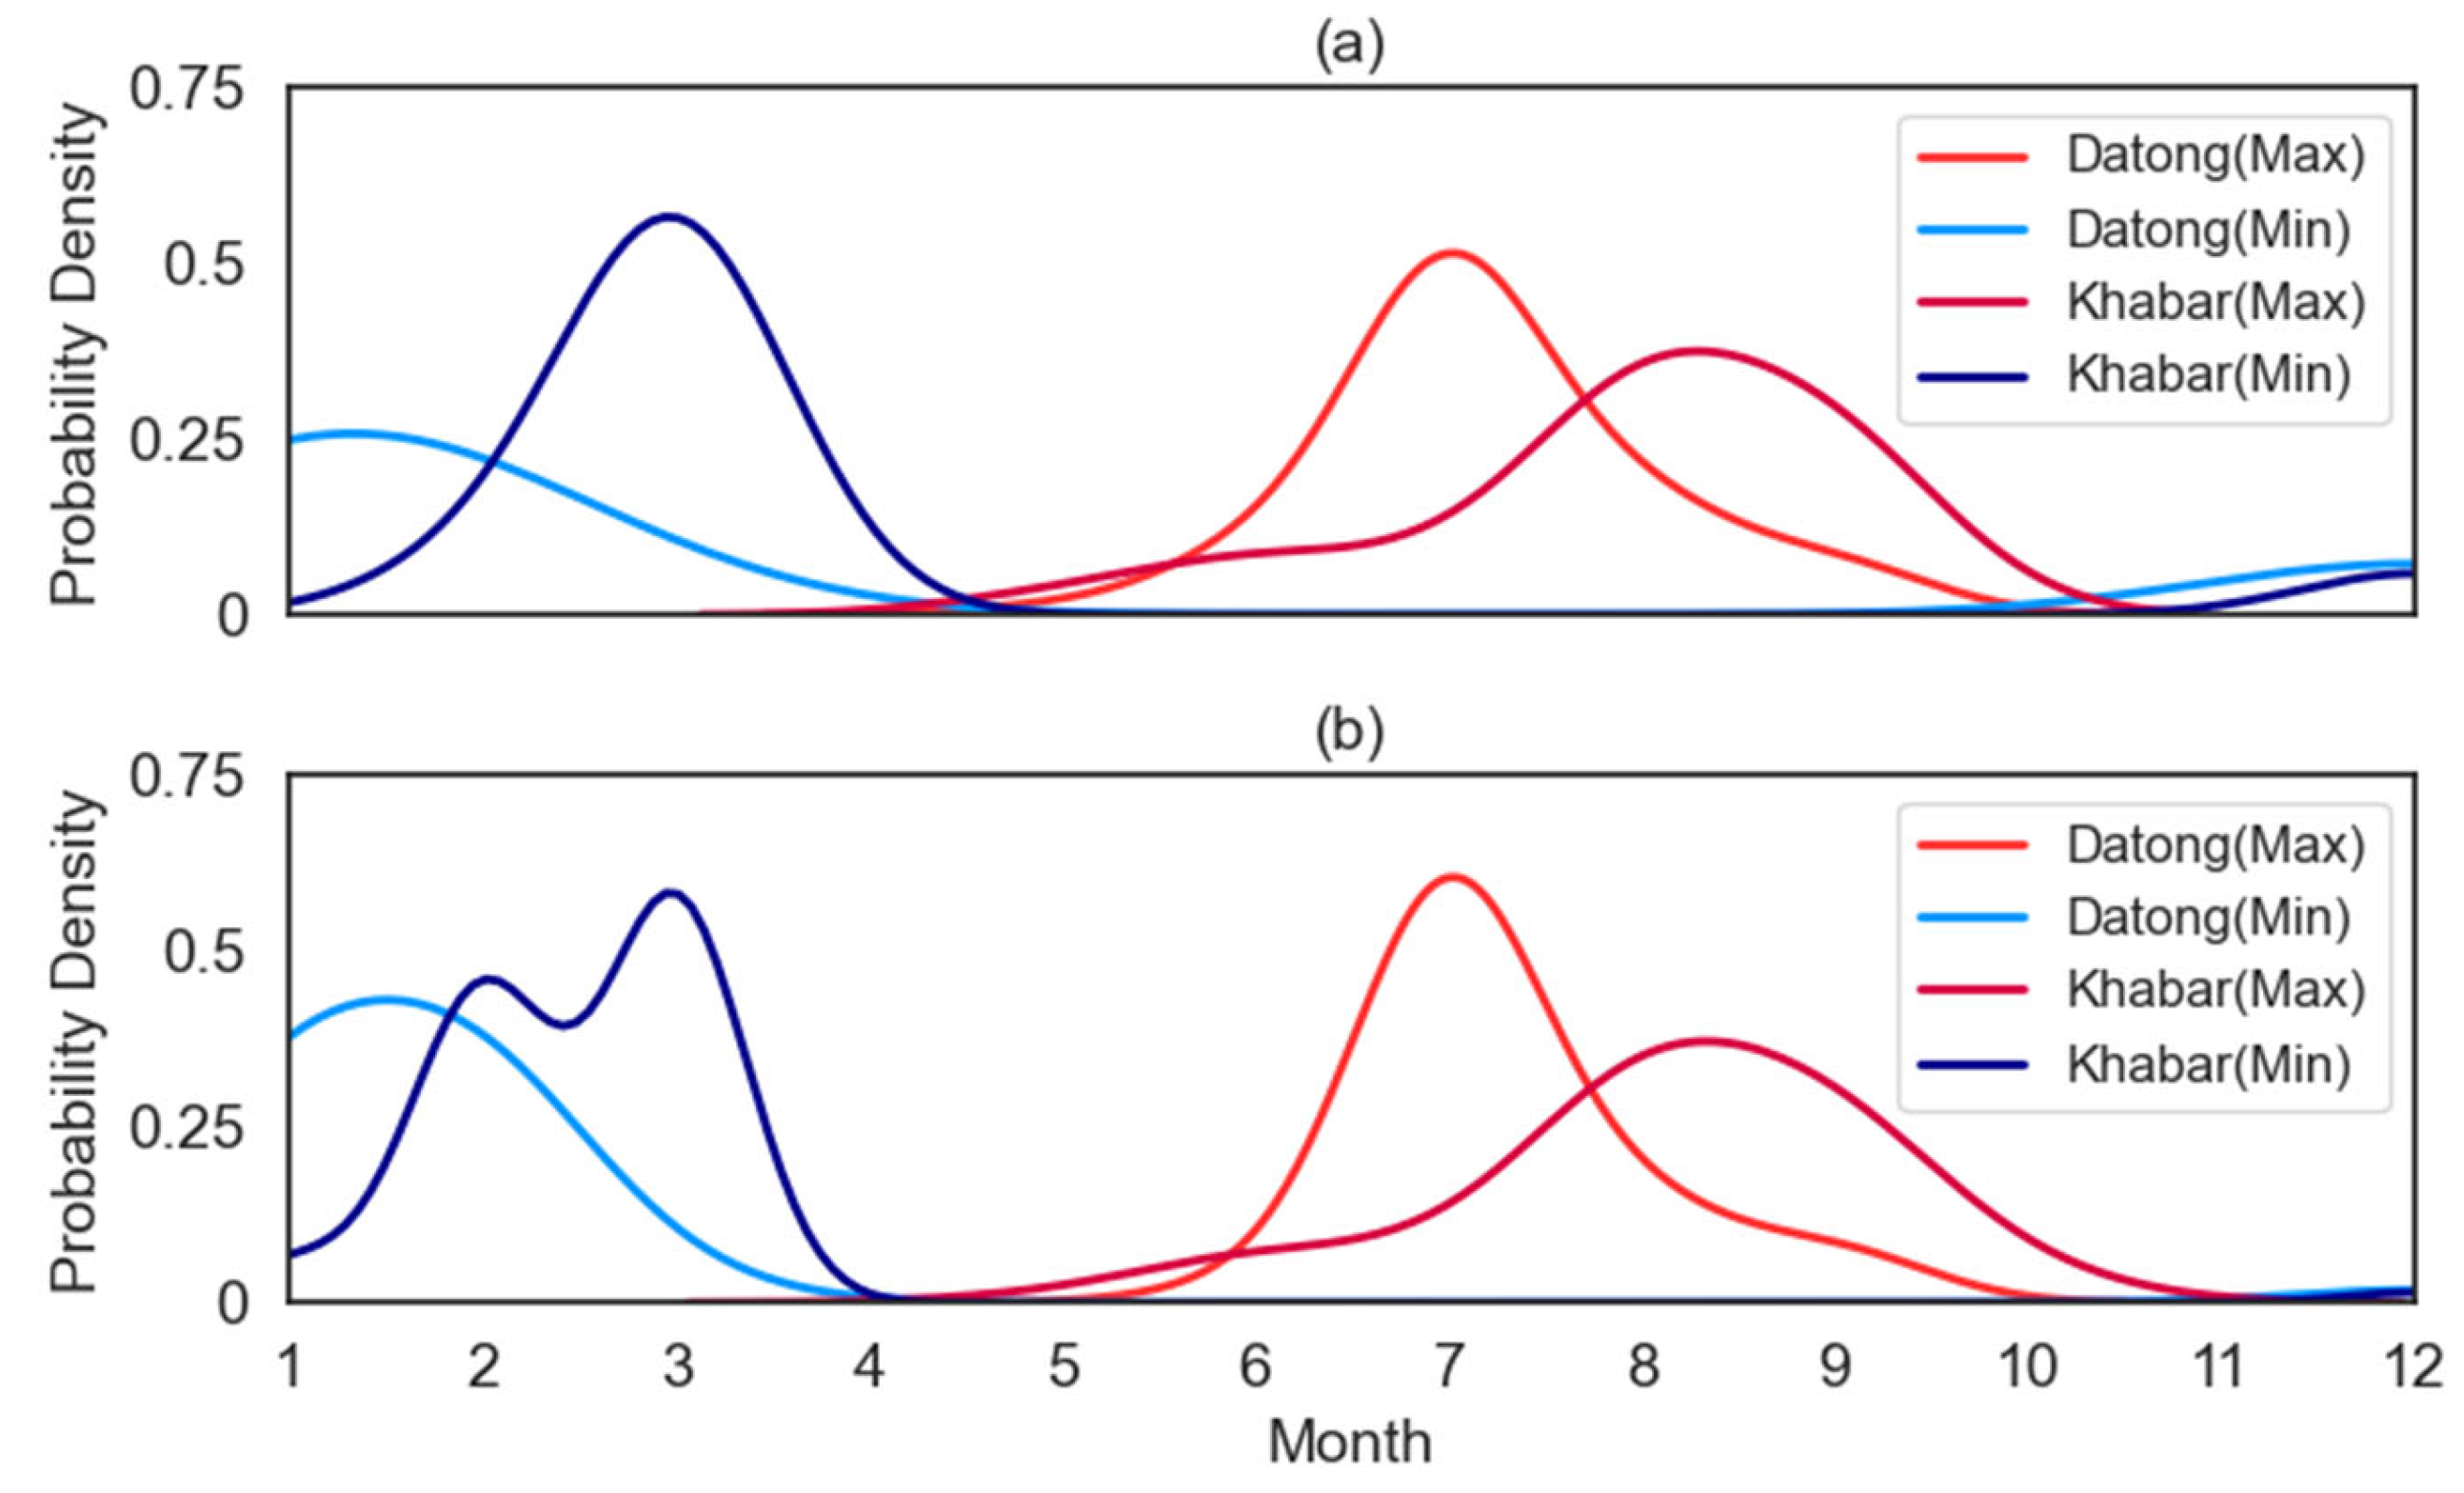
Figure 5a illustrates distinct seasonal patterns in discharge timing at Khabarovsk and Datong. At Khabarovsk, peak discharge is distributed from June to October, with a bimodal concentration in August–September, reflecting delayed runoff from summer rainfall and snowmelt contributions. Minimum discharge is tightly centered in March, indicating strong seasonal control by late winter baseflow and upstream reservoir operations. In contrast, Datong exhibits an earlier and sharper seasonal pattern, with peak discharges concentrated between June and August and a pronounced maximum in July that aligns with the East Asian summer monsoon peak. Minimum discharge primarily occurs from October to the following May, with the highest likelihood in January and February, coinciding with the regional dry season. The density curves differ in shape—steeper peaks for Datong’s maximum and Khabarovsk’s minimum discharge suggest more consistent timing, while broader peaks at Khabarovsk (maximum) and Datong (minimum) reflect more variable seasonal responses.
These seasonal patterns are further quantified by the monthly statistics summarized in Table 4, which highlights the variability and change points of discharge across different months at both stations.
Table 4 further compares monthly discharge characteristics. Khabarovsk shows higher variability during the low-discharge season (winter–spring), with coefficients of variation exceeding 50% and a peak of over 70% in March, indicating strong regulation impacts. Most change points in low-discharge months occur in the 1950s and 1960s, corresponding to early hydrological modifications from cold-region regulation. At Datong, streamflow variability is lower and more uniform, and most change points occur in the 1980s, associated with major infrastructure like the Gezhouba Project. Both stations exhibit rising trends in dry-season discharges, suggesting enhanced winter streamflow stability through reservoir regulation.
While Khabarovsk and Datong both exhibit long-term signals of reduced intra-annual variability—marked by increasing minimum discharge and declining discharge ratios—their hydrological responses differ significantly in timing, periodicity, and seasonal structure. Khabarovsk, influenced by cold-region hydrology, snowmelt processes, and early reservoir regulation, shows earlier change points in the 1950s–60s, more complex and low-frequency periodicity (>100 years), and a delayed and more dispersed seasonal discharge pattern. Its high streamflow variability in winter and spring also reflects the sensitivity to late snowmelt and regulated streamflow. In contrast, Datong responds more directly to subtropical monsoon dynamics and large-scale hydropower development. It demonstrates more recent hydrological shifts—primarily in the 1980s–1990s—stable decadal cycles (40–50 years), and earlier, sharper seasonal peaks associated with the summer monsoon. Its streamflow variability is lower and more uniform, indicating stronger control by reservoir cascades and flood regulation infrastructure. These contrasts underscore how basin-specific climatic regimes and regulation histories shape the manifestation of streamflow nonstationarity across large river systems.

3.2. Characteristics of Extreme Streamflow Events

3.2.1. Intra-Annual Distributions of Extremes

As shown in Figure 5b, the monthly probability density functions for extreme high and low discharge events are defined by the 95th and 5th percentile thresholds, respectively. At Khabarovsk, extreme low discharge events are concentrated in February–March and exhibit a bimodal pattern, indicating variability in snowmelt onset and winter discharge regulation. This contrasts with the unimodal pattern of minimum monthly discharge and suggests that extreme low discharge is more sensitive to seasonal transitions and reservoir management. Extreme floods primarily occur between July and October, with peaks in August–September, consistent with the regional late-summer flood regime.
In contrast, Datong shows a more concentrated seasonal response. Extreme low discharge peaks sharply in January and February, mirroring the regional dry season, while extreme flood events are tightly clustered in July, coinciding with the core of the summer monsoon. The narrow spread and steep density curves for both high and low extremes at Datong reflect a more synchronized hydrological regime and stronger modulation by upstream reservoirs.

3.2.2. Interannual Variability and Changing Intensity

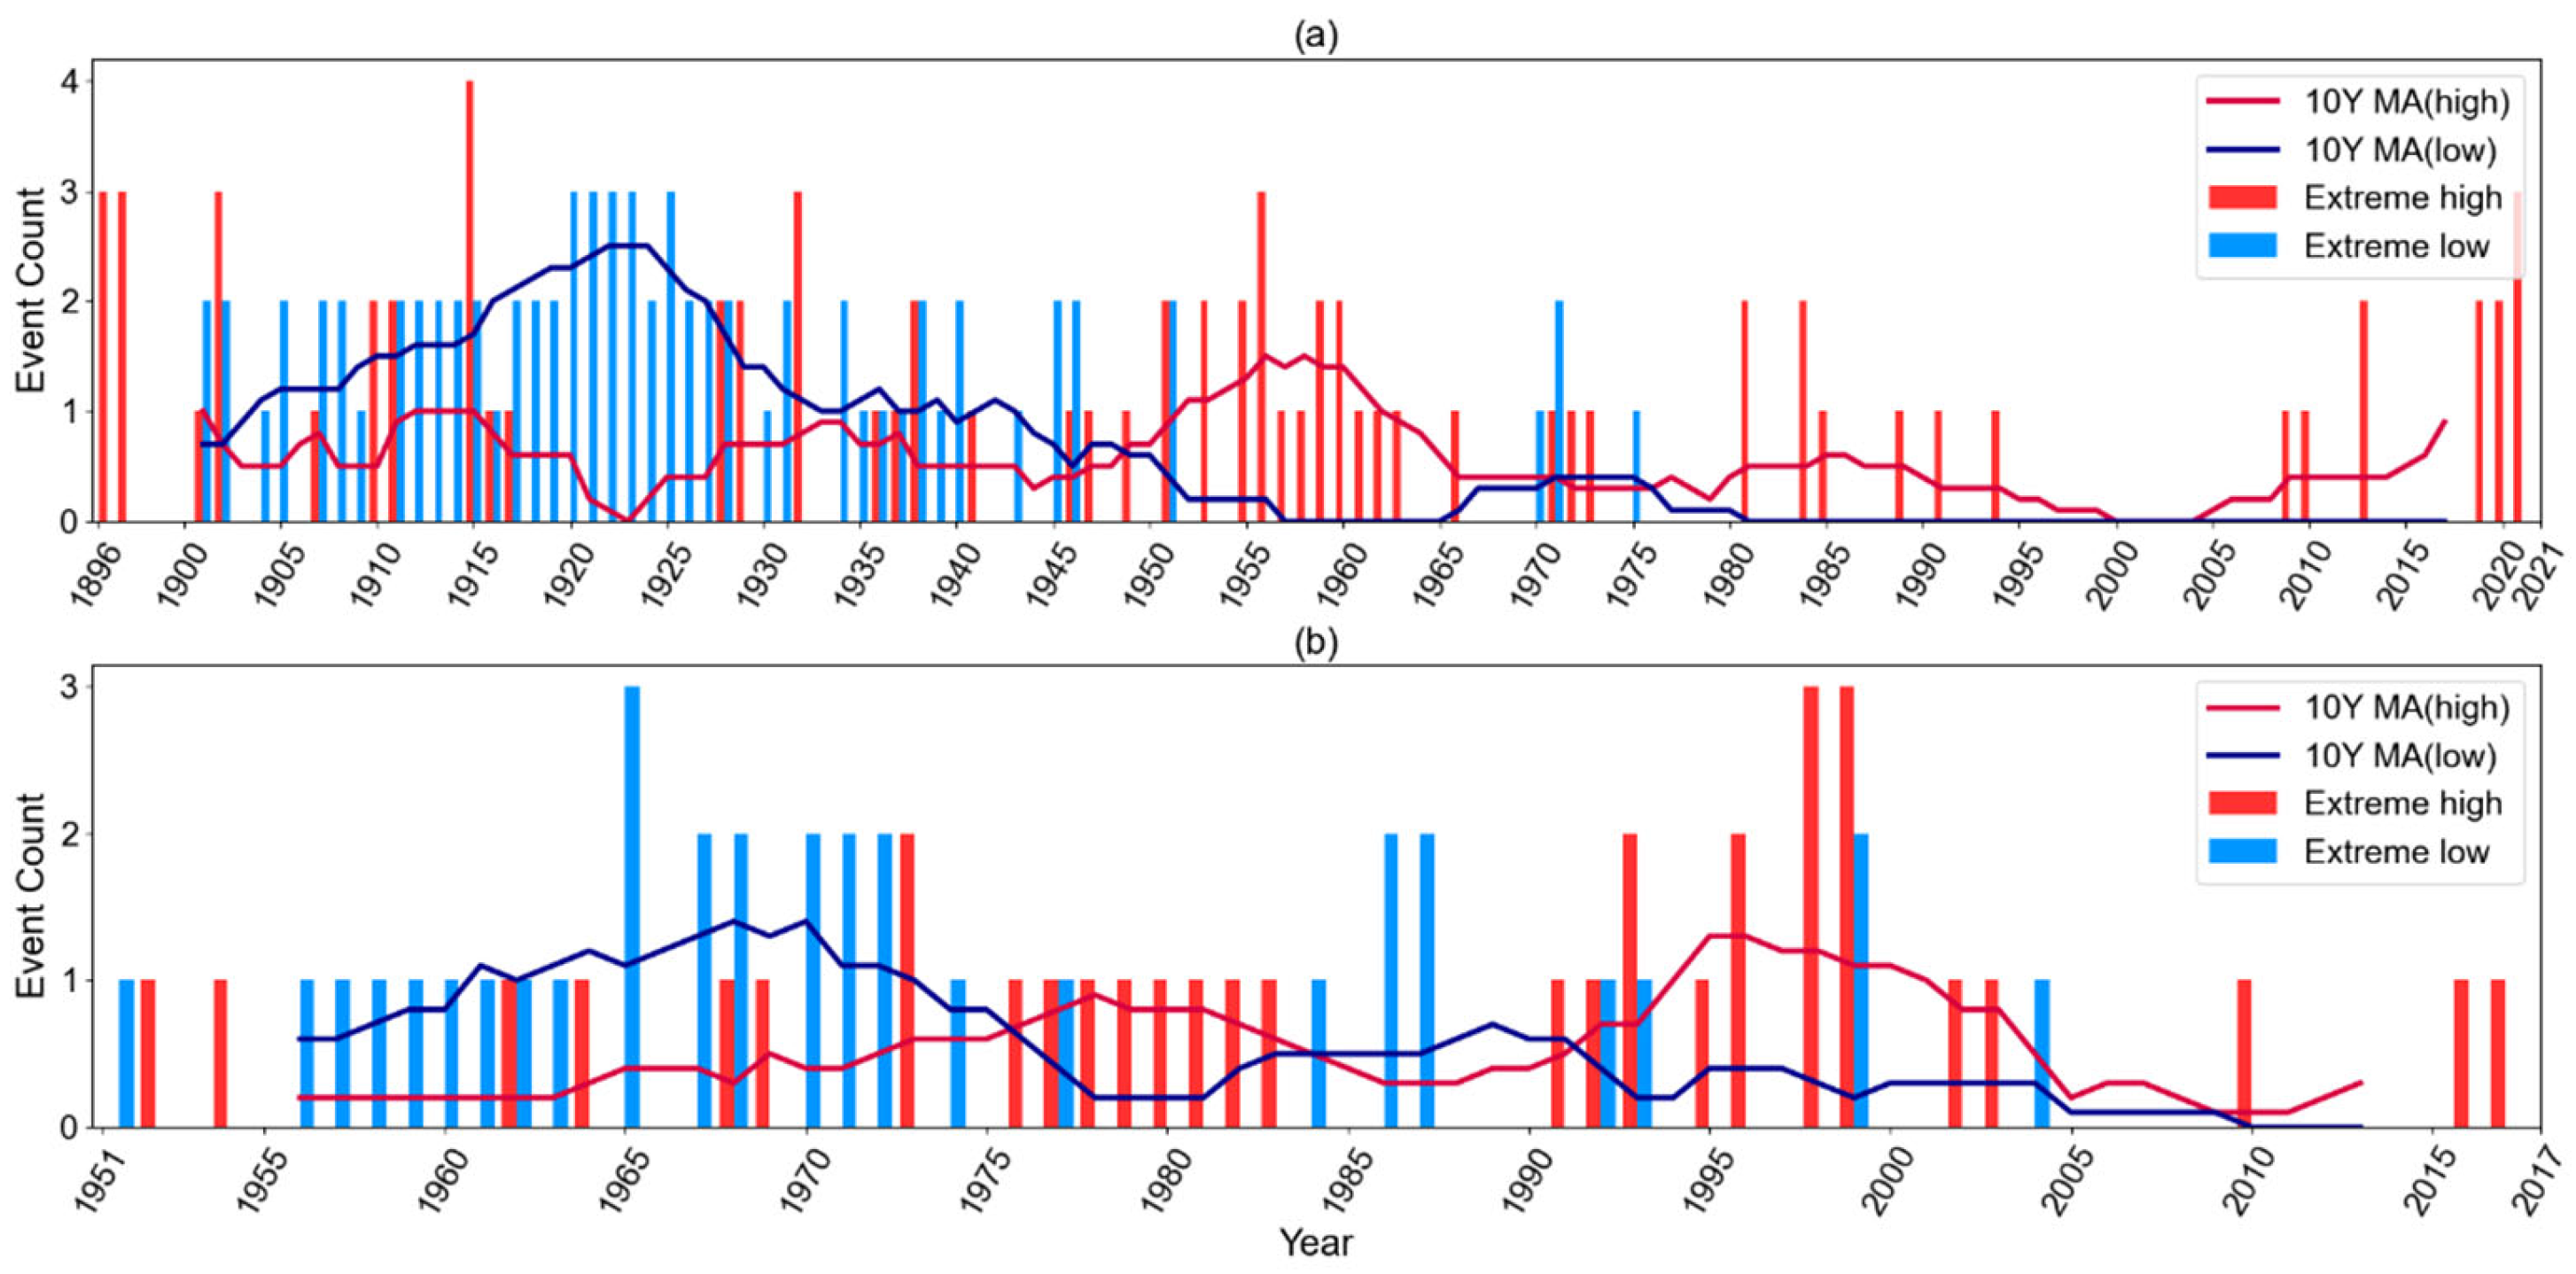
Figure 6 shows the interannual evolution of extreme discharge events and their 10-year moving averages at Khabarovsk and Datong. At Khabarovsk (Figure 6a), extreme low discharge events are frequent before the 1970s, especially between 1900 and 1950, with a peak moving average near 1920. After 1975, such events nearly vanish, indicating a strong suppression of drought extremes, likely due to the onset of upstream regulation such as the Zeya Reservoir. Flood events peaked in the 1950s but declined gradually after the 1970s, stabilizing at low levels in recent decades.
At Datong (Figure 6b), extreme low discharge is concentrated before 2000, with the highest occurrence between the 1960s and 1980s. The moving average of drought events peaks around 1970, then drops sharply after 2000, suggesting effective drought mitigation through large-scale projects like the Gezhouba and Three Gorges Dams. Flood events were more evenly distributed but peaked in the 1990s; since 2010, their frequency has declined notably, likely due to integrated reservoir scheduling and enhanced basin-level regulation.
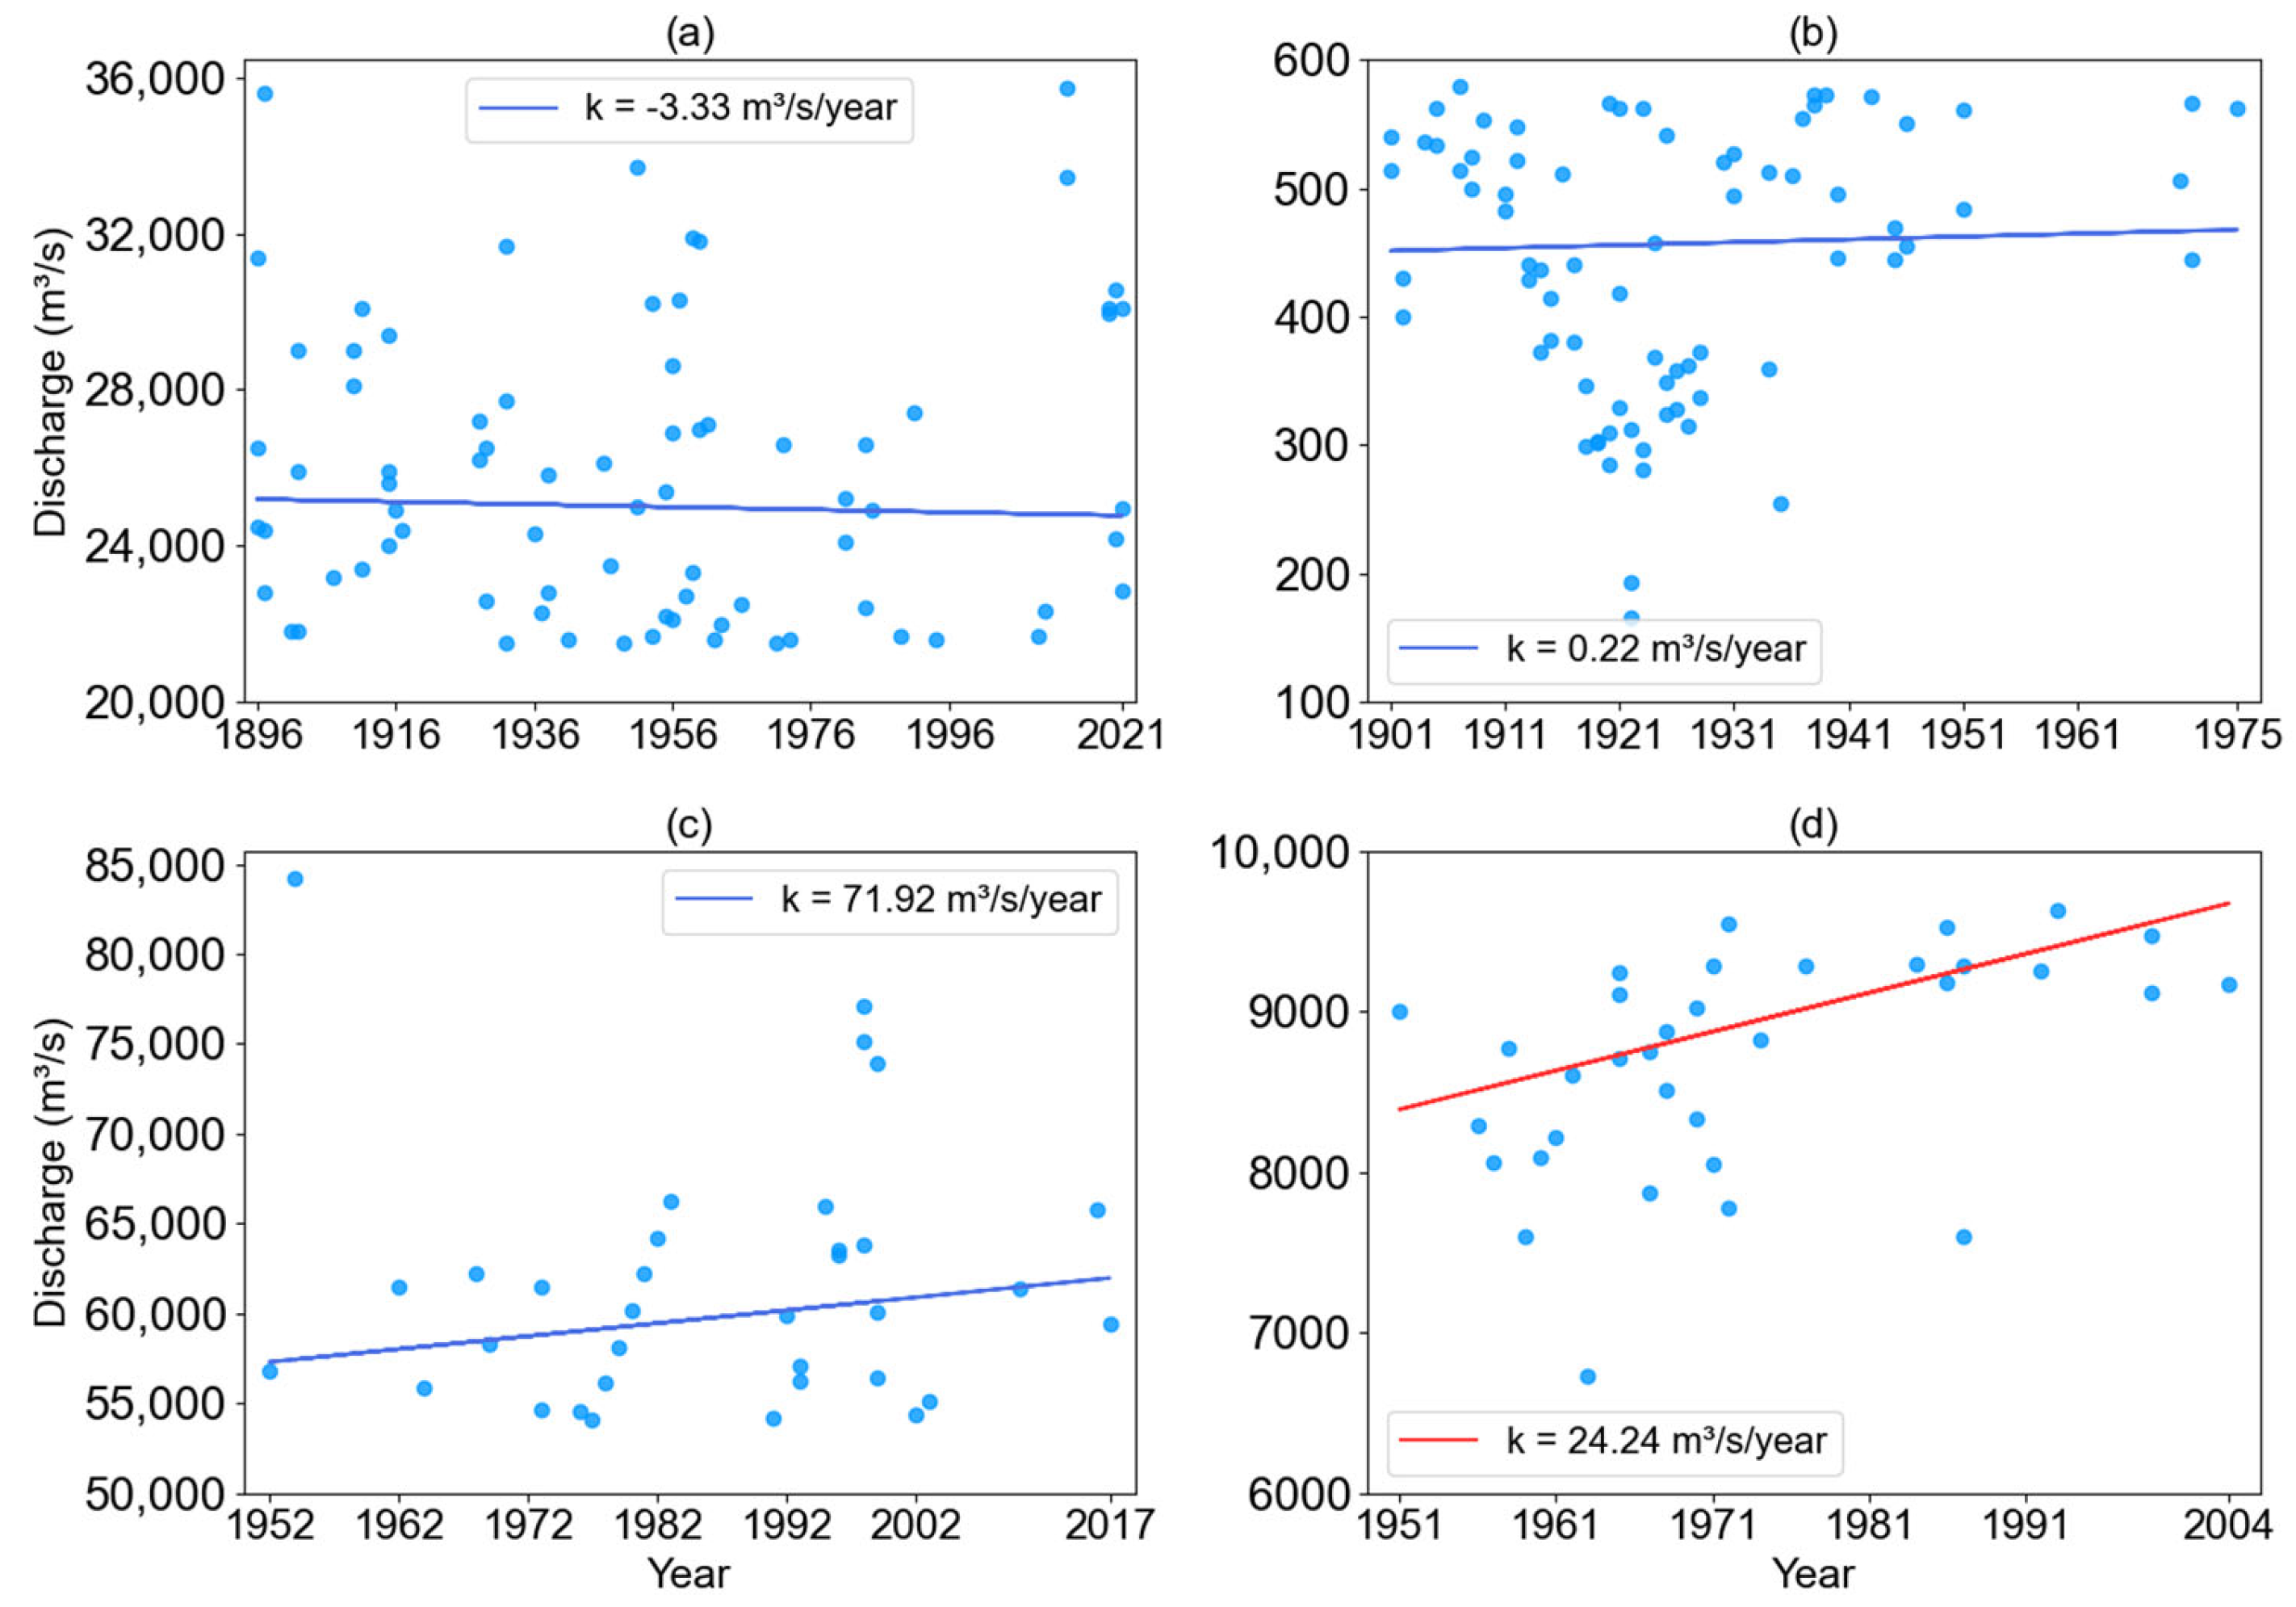
Figure 7 quantifies trends in extreme discharge intensity. At Khabarovsk, extreme floods (Figure 7a) show a nonsignificant downward trend of −3.33 m3/s/year, while extreme low discharge (Figure 7b) exhibits a slight upward trend of +0.22 m3/s/year—both changes are statistically insignificant, indicating that the magnitude of extremes has remained broadly stable under long-term cold-region regulation. In contrast, Datong exhibits more dynamic trends. Extreme flood discharges (Figure 7c) rise at +71.92 m3/s/year, and extreme low discharges (Figure 7d) increase at +24.24 m3/s/year, with the latter trend being statistically significant. These increases reflect enhanced peak discharges and a clear enhancement of streamflow conditions, likely driven by both climate variability and human regulation. At Datong, although the frequency of extreme discharge events has declined, the magnitude of peak events has increased, as reflected by the +71.92 m3/s/year trend in flood discharge. This suggests a possible intensification of individual flood events under regulation and climatic amplification, even as event counts decline.
Khabarovsk and Datong both show long-term reductions in extreme low discharge frequency, yet differ in timing and response patterns. Datong exhibits earlier and more concentrated extremes—floods in July and droughts in January and February—driven by monsoonal rainfall and modern reservoir regulation. Khabarovsk’s extremes are later and more dispersed, shaped by snowmelt and early cold-region regulation. In terms of intensity, Datong shows rising trends in both flood and drought discharge, with a particularly significant increase in low discharge. Khabarovsk’s extremes remain broadly stable. These contrasts reflect differing climate regimes and regulation histories, with Datong more responsive to recent climate and infrastructure changes, and Khabarovsk shaped by legacy regulation and snow-driven hydrology.

3.3. Attribution Analysis: Climate and Regulation Drivers

3.3.1. Climatic Controls on Streamflow Variability

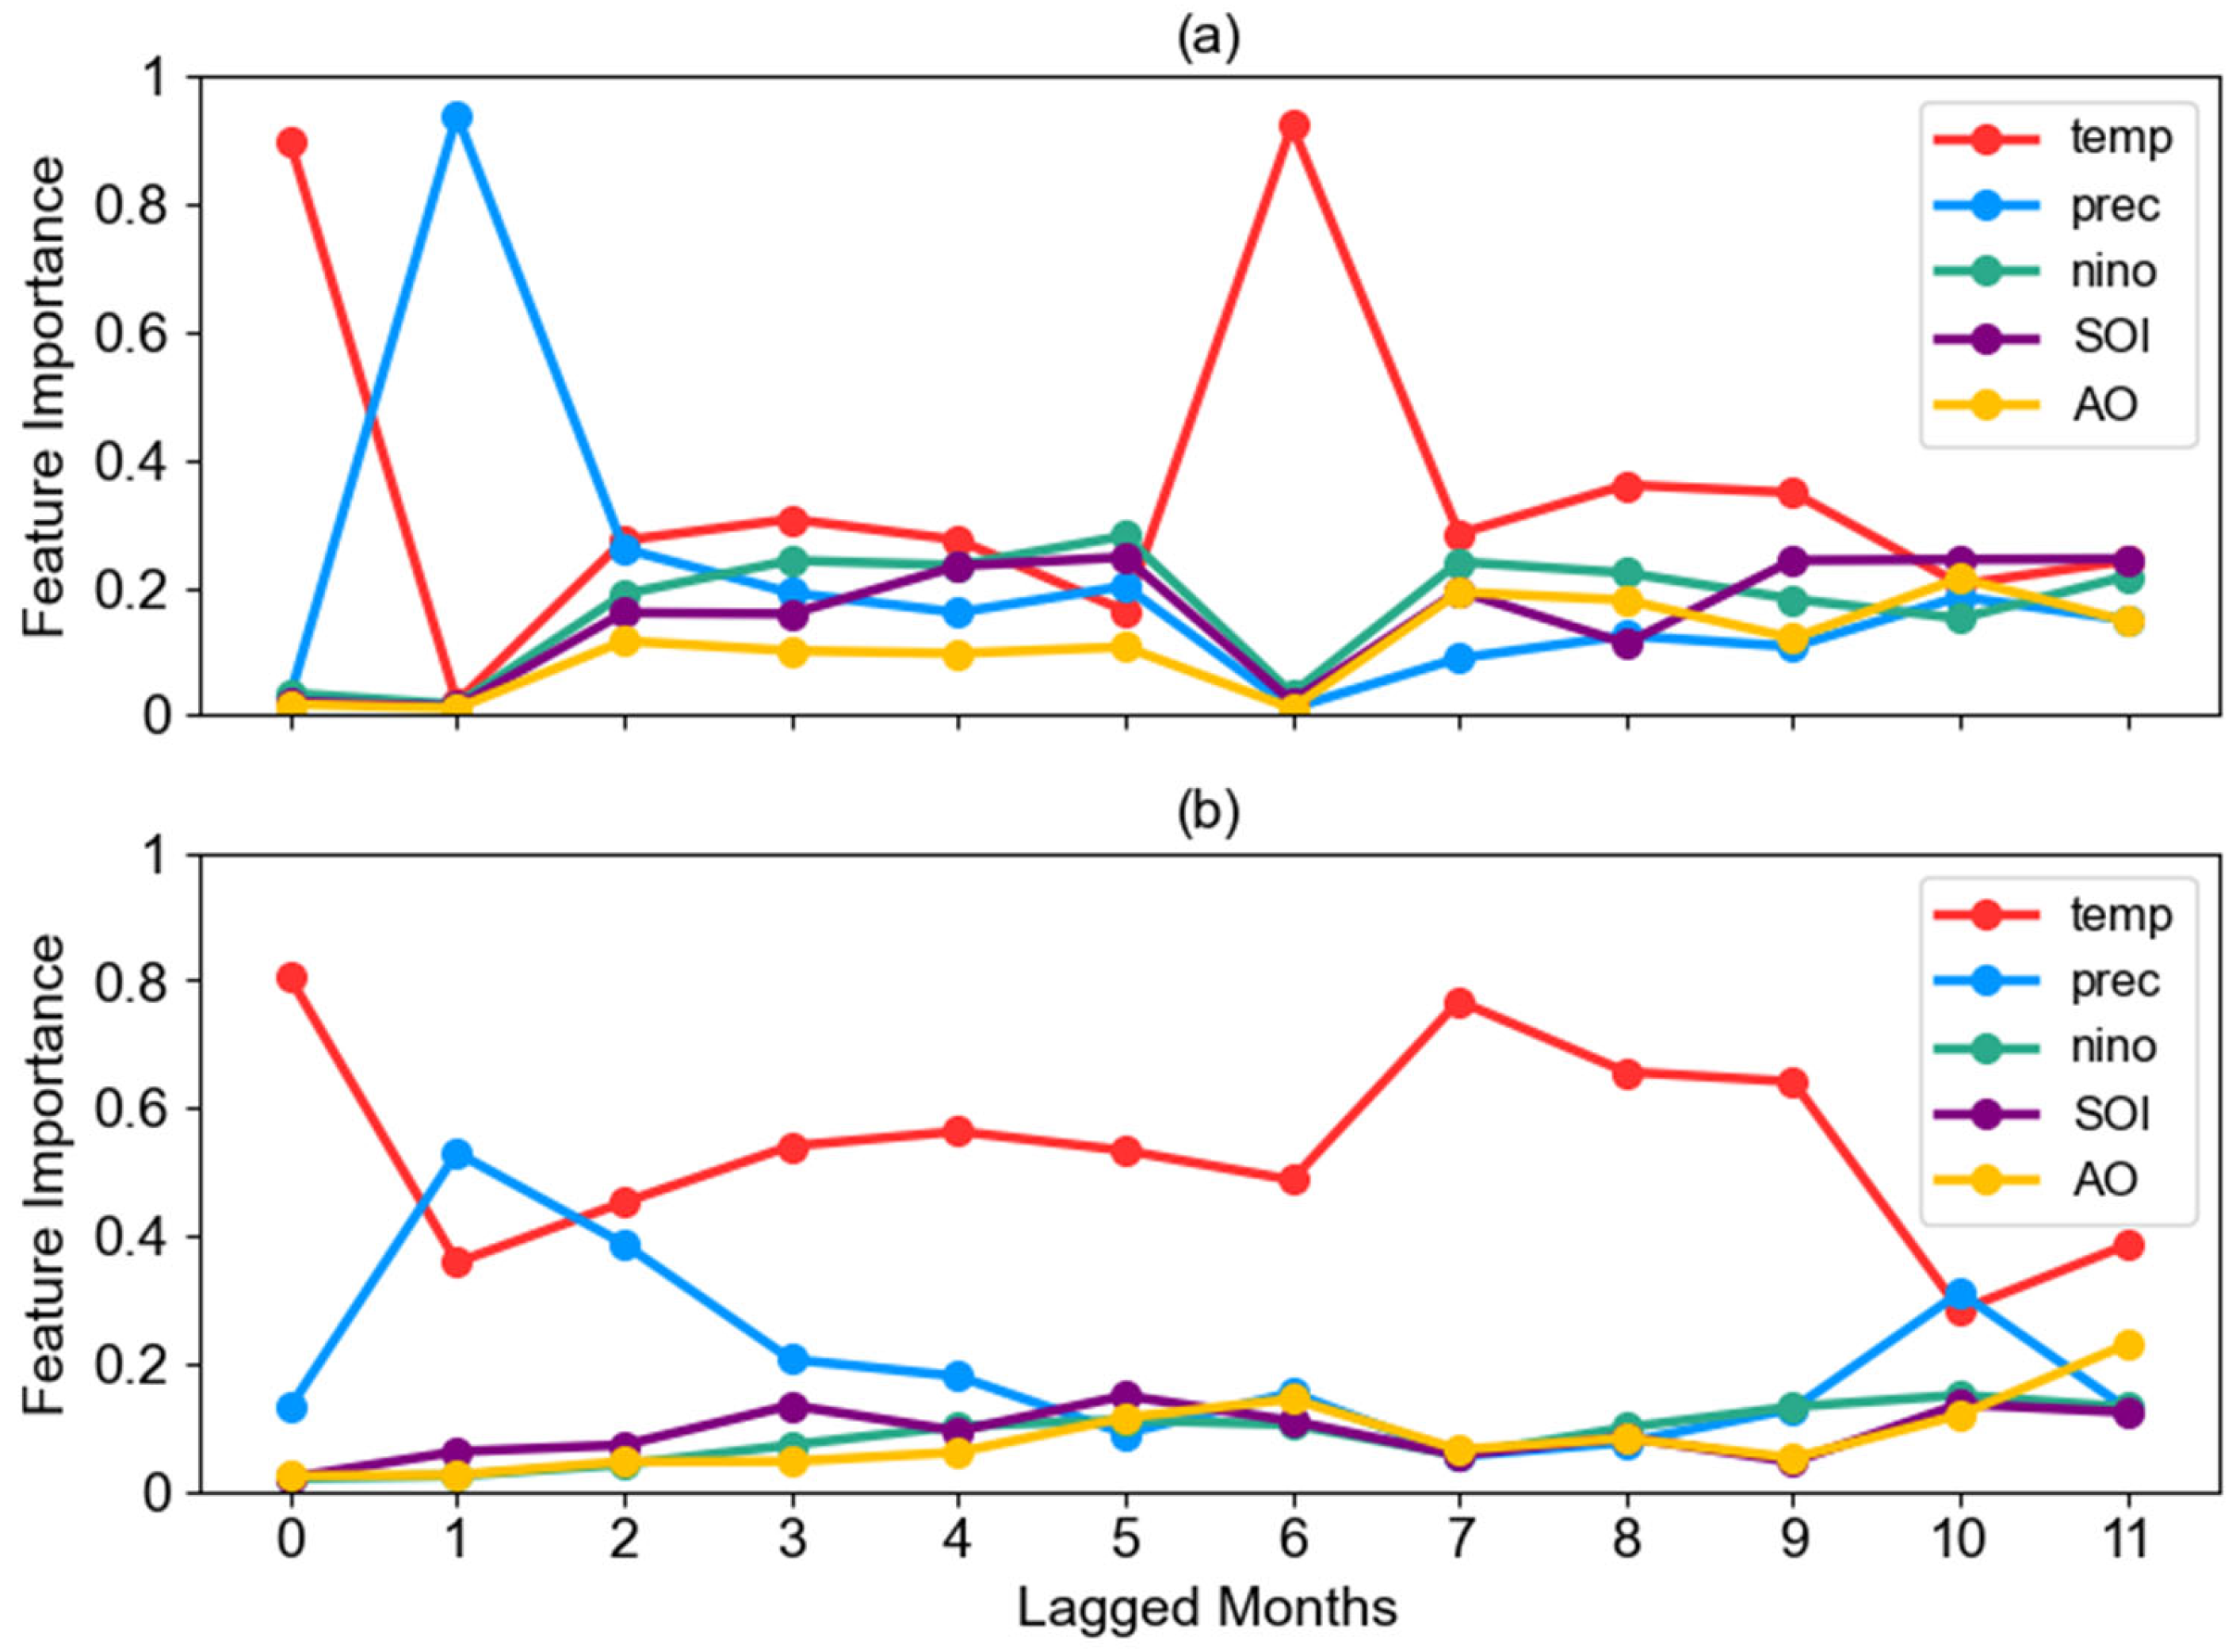
To investigate the climatic controls on streamflow, we used a random forest model to evaluate the lagged importance of five predictors: air temperature (temp), precipitation (prec), Niño index (nino), Southern Oscillation Index (SOI), and Arctic Oscillation (AO), with lags ranging from 0 to 11 months (Figure 8). Pearson correlation analysis among the five predictors indicated no severe multicollinearity, except for the known negative correlation between Niño and SOI. Variance Inflation Factors (VIFs) for all predictors were below the commonly used threshold of 5 (ranging from 1.1 to 4.6), indicating no severe multicollinearity among climate variables. The 0–11-month lag window was designed to capture both immediate and seasonal-scale responses of streamflow to climate signals, considering that large-scale oscillations often manifest with delayed hydrological impacts [24]. Despite these checks, potential biases from variable correlation or spurious lags are acknowledged.
At Khabarovsk (Figure 8a), air temperature dominates across all lags, with peaks at lag 0 and lag 7, indicating strong immediate and seasonal influences. Precipitation shows a narrow response at lag 1, while large-scale indices such as SOI, Niño, and AO exhibit weak and delayed effects.
In contrast, Datong (Figure 8b) shows a more distributed influence: temperature remains the leading predictor but with broader peaks at lag 0 and lag 6, while precipitation ranks second. ENSO-related indices (Niño and SOI) display modest but structured importance across multiple lags.
These model-based results are further corroborated by ENSO phase-wise comparisons: discharge differences across El Niño, La Niña, and neutral years are negligible at Khabarovsk, while Datong exhibits a modest but consistent response—La Niña years are associated with enhanced wet-season discharge, whereas El Niño conditions tend to suppress streamflow. It should be noted that, due to the temporal coverage of CMAP precipitation and other climate indices (1979–2021), the random forest regression and climate attribution analysis were confined to this period. As a result, the relationships between climate drivers and discharge variability prior to 1979, particularly in the Khabarovsk station, could not be quantitatively assessed using precipitation data. Interpretations are thus limited to the recent decades, and long-term hydrometeorological inference should be made with caution. Although the ENSO-related indices showed weak and distributed importance across 0–11 months, potential longer-lag influences (e.g., beyond 12 months) could not be fully captured within the current model window.

3.3.2. Engineering Impacts and Slope-Based Attribution

To assess the potential influence of reservoir regulation, we examined trends in minimum monthly discharge before and after the identified change points. The statistical significance of these trends was evaluated using the Mann–Kendall test (p < 0.05), and their magnitudes were quantified using Sen’s slope. At Khabarovsk, the Sen’s slope increased from 3.23 m3/s/decade before 1954 to 239.94 m3/s/decade after 1954, suggesting a marked upward shift likely associated with upstream reservoir operations. Similarly, at Datong, the slope changed from −190.00 m3/s/decade before 1988 to 925.81 m3/s/decade after 1988, reflecting a substantial hydrological adjustment that coincides with the commissioning of major reservoirs.
To obtain a first-order approximation of climate versus regulation effects, we applied a slope-based comparison between the two periods. At Khabarovsk, the contribution of reservoir regulation was estimated to exceed 200%, whereas climate-related changes contributed approximately 3%. At Datong, the estimated contributions were 194% for reservoir operations and 33% for climate variability. These values exceeding 100% result from the relative amplification of post-change discharge trends compared to pre-change slopes. They do not imply absolute dominance by regulation, but rather suggest a strong regulatory enhancement of low-flow conditions relative to underlying climatic contributions.
Overall, these results suggest differing hydrological responses: Khabarovsk shows pronounced winter low-flow augmentation associated with cold-region regulation, whereas Datong reflects a combined response to both climate variability and reservoir management under a monsoon-influenced setting.

4. Discussion and Conclusions

The hydrological characteristics of the Amur and Yangtze basins reflect their distinct climatic settings and regulation regimes. At Khabarovsk, streamflow is mainly influenced by temperature-driven processes and upstream reservoir operations, with the winter baseflow increase likely reflecting a combined effect of regulation and warming-induced snowmelt, though these drivers are not explicitly separated in this study. In contrast, Datong, situated in the subtropical monsoon region of the Yangtze River, is subject to multiple climatic influences, including precipitation and large-scale climate oscillations such as ENSO. The observed differences in seasonal discharge dynamics may reflect underlying variations in both climate sensitivity and regulation objectives—namely, dry-season support in the Amur and seasonal flood-drought balancing in the Yangtze.
Recent studies suggest that climate change has altered hydrological regimes in both basins, albeit in different forms. In the Amur, warming has led to a reduction in the freeze-up period by several days and enhanced winter flows [38], accompanied by an apparent increase in flood amplitude. The winter discharge increase at Khabarovsk likely reflects both reservoir operation and climate-induced changes such as warming-driven snowmelt. However, the relative contribution of these drivers cannot be precisely partitioned based on available data, and further modeling would be required to disentangle their effects. In the Yangtze, rainfall seasonality and intensity have shifted, with prominent dry–wet transitions observed during 2001–2011, influenced by both meteorological variables and teleconnection patterns. These basin-specific responses may help explain the differences in the timing and nature of streamflow changes observed in this study [39].
While previous research has explored climatic teleconnections and anthropogenic impacts independently, relatively few studies have examined their interactions across contrasting hydroclimatic regions. For example, Wen et al. [40] analyzed the influence of ENSO and monsoon variability on Yangtze discharge but did not address structural shifts or inter-basin comparisons. Jia and Yang [41] investigated land-use change in the Amur basin, though without direct hydrological attribution. Other works (e.g., Chalise et al. [42]; Nalley et al. [43]) have linked regulation and climate variability to streamflow shifts in North America. Building upon this literature, the present study applies a dual-basin comparative framework that integrates regime shift detection and feature attribution to investigate the evolving streamflow dynamics under both climatic and engineering influences.
Our results suggest that streamflow nonstationarity occurs with different timing and characteristics in the two basins. In the Amur, earlier shifts and a narrowing seasonal range were observed, potentially associated with warming-induced snowmelt and coordinated reservoir releases. In contrast, Datong exhibited later but more synchronized changes in low and high discharges, consistent with monsoon effects and reservoir cascade operations. Analysis of extreme events also indicates divergent patterns: Khabarovsk has experienced a decline in low-flow extremes since the 1970s, while Datong shows increasing flood–drought duality.
Attribution results suggest that streamflow variability in the two basins is shaped by distinct mechanisms. At Khabarovsk, air temperature emerges as the dominant factor, particularly in winter, whereas at Datong, lagged precipitation and ENSO-related signals play a more significant role. Regression-based findings indicate that discharge increases at Khabarovsk are primarily associated with reservoir regulation, while those at Datong reflect the joint influence of climatic variability and infrastructure. Notably, regulation at Datong appears to both mitigate peak floods through controlled releases and enhance baseflow persistence during dry seasons. This dual role implies that infrastructure may modulate the manifestation of climate variability, suppressing extremes while reinforcing seasonal hydrological signals.
Building upon the results of trend analysis, extreme event diagnostics, and attribution, these findings provide guidance for adaptive water management strategies. In cold regions such as the Amur, aligning reservoir operations with snowmelt and freeze–thaw patterns could help stabilize winter flows. Future forecasting efforts should integrate seasonal climate outlooks into reservoir operation rules, adopt flexible discharge thresholds based on interannual variability, and implement adaptive flood control strategies that account for both climatic trends and infrastructure legacies. Given the differing sensitivities of each basin, a generalized regulation strategy may not adequately address context-specific risks.
This study has several limitations. First, it does not explicitly incorporate land-use change, sediment transport, or ecological flow requirements, all of which may influence long-term streamflow variability. In particular, sediment depletion following the operation of the Three Gorges Project has altered channel morphology and hydraulic conditions in the Yangtze Basin, potentially affecting discharge records—an aspect not addressed in this analysis. Second, the reliance on station-based data limits the spatial resolution of the findings and may overlook heterogeneity across tributaries and sub-regions, especially in large, topographically complex basins. Third, the Sen’s slope-based attribution approach provides only a first-order estimation and cannot capture nonlinear or interacting effects between climate variability and human regulation. While diagnostic regression and slope comparisons offer useful insights, more advanced methods—such as counterfactual modeling, hydrological simulations with and without regulation scenarios, and socio-hydrological feedback frameworks—could enhance attribution accuracy. Lastly, the characterization of extreme events relied on percentile-based thresholds; distribution-based approaches (e.g., GEV or GPD) may better capture rare events, particularly in snow-dominated regions. Future research should consider integrating distributed modeling, sediment–hydrology coupling, and high-resolution climate projections to better disentangle the compound impacts of climate change and human interventions on streamflow dynamics.
Overall, this study provides a comparative assessment of streamflow nonstationarity in two major Asian river basins with contrasting hydroclimatic and regulation regimes. By integrating trend analysis, wavelet-based periodicity detection, and machine learning-based attribution, it establishes a framework for understanding how climate variability and human interventions jointly shape long-term discharge variability. The findings reveal divergent hydrological responses in cold-temperate and monsoon-dominated systems, underscoring the need for adaptive, basin-specific reservoir management under changing climatic and operational conditions. The distinct hydrological patterns observed may reflect different sensitivities to large-scale physical drivers—such as snowmelt dynamics and decadal oscillations (e.g., PDO) in the Amur Basin, and ENSO-related teleconnections in the Yangtze Basin—highlighting the importance of linking observed variability with underlying climatic processes. While some analyses remain exploratory, this work offers new insights into cross-basin differences in extreme discharge dynamics and their potential drivers. Future research could extend this approach by incorporating distributed hydrological modeling, more robust extreme event diagnostics, and high-resolution climate projections to better assess compound climate–infrastructure impacts.

Author Contributions

Conceptualization, Z.Z. and S.L.; data curation, Q.M., J.W. and N.L.; funding acquisition, Z.Z. and S.L.; investigation, J.W.; methodology, Q.M., N.L. and Z.Z.; resources, J.W., S.L., A.N.M. and A.F.M.; supervision, J.W., Z.Z., S.L., A.N.M., and A.F.M.; visualization, Q.M. and N.L.; writing—original draft, Q.M.; writing—review and editing, Z.Z. and S.L. All authors have read and agreed to the published version of the manuscript.

Funding

This research was funded by the National Natural Science Foundation of China, grant numbers 42371030 and 42271031.

Data Availability Statement

Most data used in this study are publicly available from the original sources cited in the article, including the Global Runoff Data Centre (GRDC), Climate Prediction Center (CMAP), GHCN_CAMS, and NOAA PSL. Some extended historical data were obtained through academic collaboration and are not publicly available.

Conflicts of Interest

The authors declare no conflict of interest.

Appendix A

Figure A1. Amur River and Yangtze River basins in Asia.
Water 17 02339 g0a1
Figure A2. Annual precipitation in Amur River (a) and Yangtze River (b) basins.
Water 17 02339 g0a2
Figure A3. Annual temperature in Amur River (a) and Yangtze River (b) basins.
Water 17 02339 g0a3

References

  1. Zhou, Z.Z.; Ren, J.; He, X.G.; Liu, S.G. A comparative study of extensive machine learning models for predicting long-term monthly rainfall with an ensemble of climatic and meteorological predictors. Hydrol. Process. 2021, 35, e14424. [Google Scholar] [CrossRef]
  2. IPCC. Climate Change 2021: The Physical Science Basis. Contribution of Working Group I to the Sixth Assessment Report of the Intergovernmental Panel on Climate Change; Cambridge University Press: Cambridge, UK, 2021. [Google Scholar] [CrossRef]
  3. Zhou, Z.Z.; Smith, J.A.; Baeck, M.L.; Wright, D.B.; Smith, B.K.; Liu, S.G. The impact of the spatiotemporal structure of rainfall on flood frequency over a small urban watershed: An approach coupling stochastic storm transposition and hydrologic modeling. Hydrol. Earth Syst. Sci. 2021, 25, 4701–4717. [Google Scholar] [CrossRef]
  4. Lei, N.; Gao, L.S.; Liu, S.G.; Zhou, Z.Z. The Spatiotemporal Clustering of Short-Duration Rainstorms in Shanghai City Using a Sub-Hourly Gauge Network. Earth Space Sci. 2024, 11, e2023EA003442. [Google Scholar] [CrossRef]
  5. Gnann, S.J.; Howden, N.J.K.; Woods, R.A. Hydrological signatures describing the translation of climate seasonality into streamflow seasonality. Hydrol. Earth Syst. Sci. 2020, 24, 561–580. [Google Scholar] [CrossRef]
  6. Johnson, Z.F.; Stuivenvolt-Allen, J.; Mahan, H.; Meyer, J.D.D.; Miksch, M. Upper Colorado River Streamflow Dependencies on Summertime Synoptic Circulations and Hydroclimate Variability. J. Hydrometeorol. 2024, 25, 277–291. [Google Scholar] [CrossRef]
  7. Aryal, A.; Shrestha, M.; Aryal, S.; Upadhyay, S.; Maharjan, M. Spatio-temporal variability of streamflow in major and medium rivers of Nepal. J. Hydrol. Reg. Stud. 2023, 50, 101590. [Google Scholar] [CrossRef]
  8. Zhang, K.W.; Ma, K.; Leng, J.W.; He, D.M. Alteration in Hydrologic Regimes and Dominant Influencing Factors in the Upper Heilong-Amur River Basin across Three Decades. Sustainability 2023, 15, 10391. [Google Scholar] [CrossRef]
  9. Tang, R.; Dai, Z.; Mei, X.; Lou, Y. Joint impacts of dams and floodplain on the rainfall-induced extreme flood in the Changjiang (Yangtze) River. J. Hydrol. 2023, 627, 130428. [Google Scholar] [CrossRef]
  10. Shakarami, L.; Ashofteh, P.-S.; Singh, V.P. Disaggregating the effects of climatic variability and dam construction on river flow regime. Water Resour. Manag. 2022, 36, 3813–3838. [Google Scholar] [CrossRef]
  11. Cui, T.; Tian, F.; Yang, T.; Wen, J.; Khan, M.Y.A. Development of a comprehensive framework for assessing the impacts of climate change and dam construction on flow regimes. J. Hydrol. 2020, 590, 125358. [Google Scholar] [CrossRef]
  12. Liu, Y.M.; Duffy, K.; Dy, J.G.; Ganguly, A.R. Explainable deep learning for insights in El Nino and river flows. Nat. Commun. 2023, 14, 339. [Google Scholar] [CrossRef] [PubMed]
  13. Yun, X.; Tang, Q.; Li, J.; Lu, H.; Zhang, L.; Chen, D. Can reservoir regulation mitigate future climate change induced hydrological extremes in the Lancang-Mekong River Basin? Sci. Total Environ. 2021, 785, 147322. [Google Scholar] [CrossRef]
  14. Ashraf, M.S.; Ahmad, I.; Khan, N.M.; Zhang, F.; Bilal, A.; Guo, J. Streamflow variations in monthly, seasonal, annual and extreme values using Mann-Kendall, Spearmen’s Rho and innovative trend analysis. Water Resour. Manag. 2021, 35, 243–261. [Google Scholar] [CrossRef]
  15. Garba, H.; Udokpoh, U.U. Analysis of trend in meteorological and hydrological time-series using Mann-Kendall and Sen’s slope estimator statistical test in Akwa Ibom state, Nigeria. Int. J. Environ. Clim. Change 2023, 13, 1017–1035. [Google Scholar] [CrossRef]
  16. Das, S.; Banerjee, S. Investigation of changes in seasonal streamflow and sediment load in the Subarnarekha-Burhabalang basins using Mann-Kendall and Pettitt tests. Arab. J. Geosci. 2021, 14, 946. [Google Scholar] [CrossRef]
  17. Yin, L.; Wang, L.; Keim, B.D.; Konsoer, K.; Zheng, W. Wavelet analysis of dam injection and discharge in three gorges dam and reservoir with precipitation and river discharge. Water 2022, 14, 567. [Google Scholar] [CrossRef]
  18. Liu, X.; Zhang, X.; Kong, X.; Shen, Y.-J. Random forest model has the potential for runoff simulation and attribution. Water 2022, 14, 2053. [Google Scholar] [CrossRef]
  19. Wang, X.W.; Zhu, Y.; Chen, Y.N.; Zheng, H.L.; Liu, H.N.; Huang, H.B.; Liu, K.; Liu, L. Influences of forest on MODIS snow cover mapping and snow variations in the Amur River basin in Northeast Asia during 2000–2014. Hydrol. Process. 2017, 31, 3225–3241. [Google Scholar] [CrossRef]
  20. Nikitina, O.I.; Dubinina, V.G.; Bolgov, M.V.; Parilov, M.P.; Parilova, T.A. Environmental Flow Releases for Wetland Biodiversity Conservation in the Amur River Basin. Water 2020, 12, 2812. [Google Scholar] [CrossRef]
  21. Yu, M.; Li, Q.; Lu, G.; Cai, T.; Xie, W.; Bai, X. Investigation into the Impacts of the Gezhouba and the Three Gorges Reservoirs on the Flow Regime of the Yangtze River. J. Hydrol. Eng. 2013, 18, 1098–1106. [Google Scholar] [CrossRef]
  22. Li, Y.; Yan, D.H.; Peng, H.; Xiao, S.B. Evaluation of precipitation in CMIP6 over the Yangtze River Basin. Atmos. Res. 2021, 253, 105406. [Google Scholar] [CrossRef]
  23. Yang, L.; Zhao, G.J.; Tian, P.; Mu, X.M.; Tian, X.J.; Feng, J.H.; Bai, Y.P. Runoff changes in the major river basins of China and their responses to potential driving forces. J. Hydrol. 2022, 607, 127536. [Google Scholar] [CrossRef]
  24. Kiem, A.S.; Franks, S.W. On the identification of ENSO-induced rainfall and runoff variability: A comparison of methods and indices. Hydrol. Sci. J. 2001, 46, 715–727. [Google Scholar] [CrossRef]
  25. Nummelin, A.; Ilicak, M.; Li, C.; Smedsrud, L.H. Consequences of future increased Arctic runoff on Arctic Ocean stratification, circulation, and sea ice cover. J. Geophys. Res. Ocean. 2016, 121, 617–637. [Google Scholar] [CrossRef]
  26. Wang, Y.; Ye, A.; Zhang, Y.; Yang, F. The quantitative attribution of climate change to runoff increase over the Qinghai-Tibetan Plateau. Sci. Total Environ. 2023, 897, 165326. [Google Scholar] [CrossRef]
  27. Kendall, M.G. Further Contributions to the Theory of Paired Comparisons. Biometrics 1955, 11, 43–62. [Google Scholar] [CrossRef]
  28. Sen, P.K. Estimates of the regression coefficient based on Kendall’s tau. J. Am. Stat. Assoc. 1968, 63, 1379–1389. [Google Scholar] [CrossRef]
  29. Pettitt, A.N. A Non-Parametric Approach to the Change-Point Problem. J. R. Stat. Soc. Ser. C (Appl. Stat.) 1979, 28, 126–135. [Google Scholar] [CrossRef]
  30. Goupillaud, P.; Grossmann, A.; Morlet, J. Cycle-octave and related transforms in seismic signal analysis. Geoexploration 1984, 23, 85–102. [Google Scholar] [CrossRef]
  31. Zhang, X.; Yang, F. RClimDex (1.0) user manual. Clim. Res. Branch Environ. Can. 2004, 22, 13–14. [Google Scholar]
  32. Breiman, L. Random forests. Mach. Learn. 2001, 45, 5–32. [Google Scholar] [CrossRef]
  33. Chen, H.; Chen, L.H. Response of runoff variation to the changing environments of karst regions in southwest China. Hydrol. Sci. J. 2022, 67, 2344–2357. [Google Scholar] [CrossRef]
  34. Baklanov, P.; Voronov, B. Threats and Risks to Sustainable Development in the Amur River Basin. Rep. Amur-Okhotsk 2010, 6, 315–325. [Google Scholar]
  35. Evgrashin, V. Construction of the Zeya hydro development. Hydrotech. Constr. 1973, 7, 1121–1125. [Google Scholar] [CrossRef]
  36. Guan, Y.H.; Zheng, F.L.; Zhang, X.C.; Wang, B. Trends and variability of daily precipitation and extremes during 1960-2012 in the Yangtze River Basin, China. Int. J. Climatol. 2017, 37, 1282–1298. [Google Scholar] [CrossRef]
  37. Wang, Y.; Rhoads, B.L.; Wang, D. Assessment of the flow regime alterations in the middle reach of the Yangtze River associated with dam construction: Potential ecological implications. Hydrol. Process. 2016, 30, 3949–3966. [Google Scholar] [CrossRef]
  38. Makhinov, A.; Makhinova, A. Assessment of the Impact of Climate Change on the Hydrological Regime of the Amur River in the Lower Reaches. Geogr. Nat. Resour. 2022, 43, S68–S73. [Google Scholar] [CrossRef]
  39. Yang, P.; Zhang, S.; Xia, J.; Zhan, C.; Cai, W.; Wang, W.; Luo, X.; Chen, N.; Li, J. Analysis of drought and flood alternation and its driving factors in the Yangtze River Basin under climate change. Atmos. Res. 2022, 270, 106087. [Google Scholar] [CrossRef]
  40. Wei, W.; Chang, Y.; Dai, Z. Streamflow changes of the Changjiang (Yangtze) River in the recent 60 years: Impacts of the East Asian summer monsoon, ENSO, and human activities. Quat. Int. 2014, 336, 98–107. [Google Scholar] [CrossRef]
  41. Jia, S.Z.; Yang, Y.P. Spatiotemporal Characteristics and Driving Factors of Land-Cover Change in the Heilongjiang (Amur) River Basin. Remote Sens. 2023, 15, 3730. [Google Scholar] [CrossRef]
  42. Chalise, D.R.; Sankarasubramanian, A.; Ruhi, A. Dams and Climate Interact to Alter River Flow Regimes Across the United States. Earths Future 2021, 9, e2020EF001816. [Google Scholar] [CrossRef]
  43. Nalley, D.; Adamowski, J.; Biswas, A.; Gharabaghi, B.; Hu, W. A multiscale and multivariate analysis of precipitation and streamflow variability in relation to ENSO, NAO and PDO. J. Hydrol. 2019, 574, 288–307. [Google Scholar] [CrossRef]
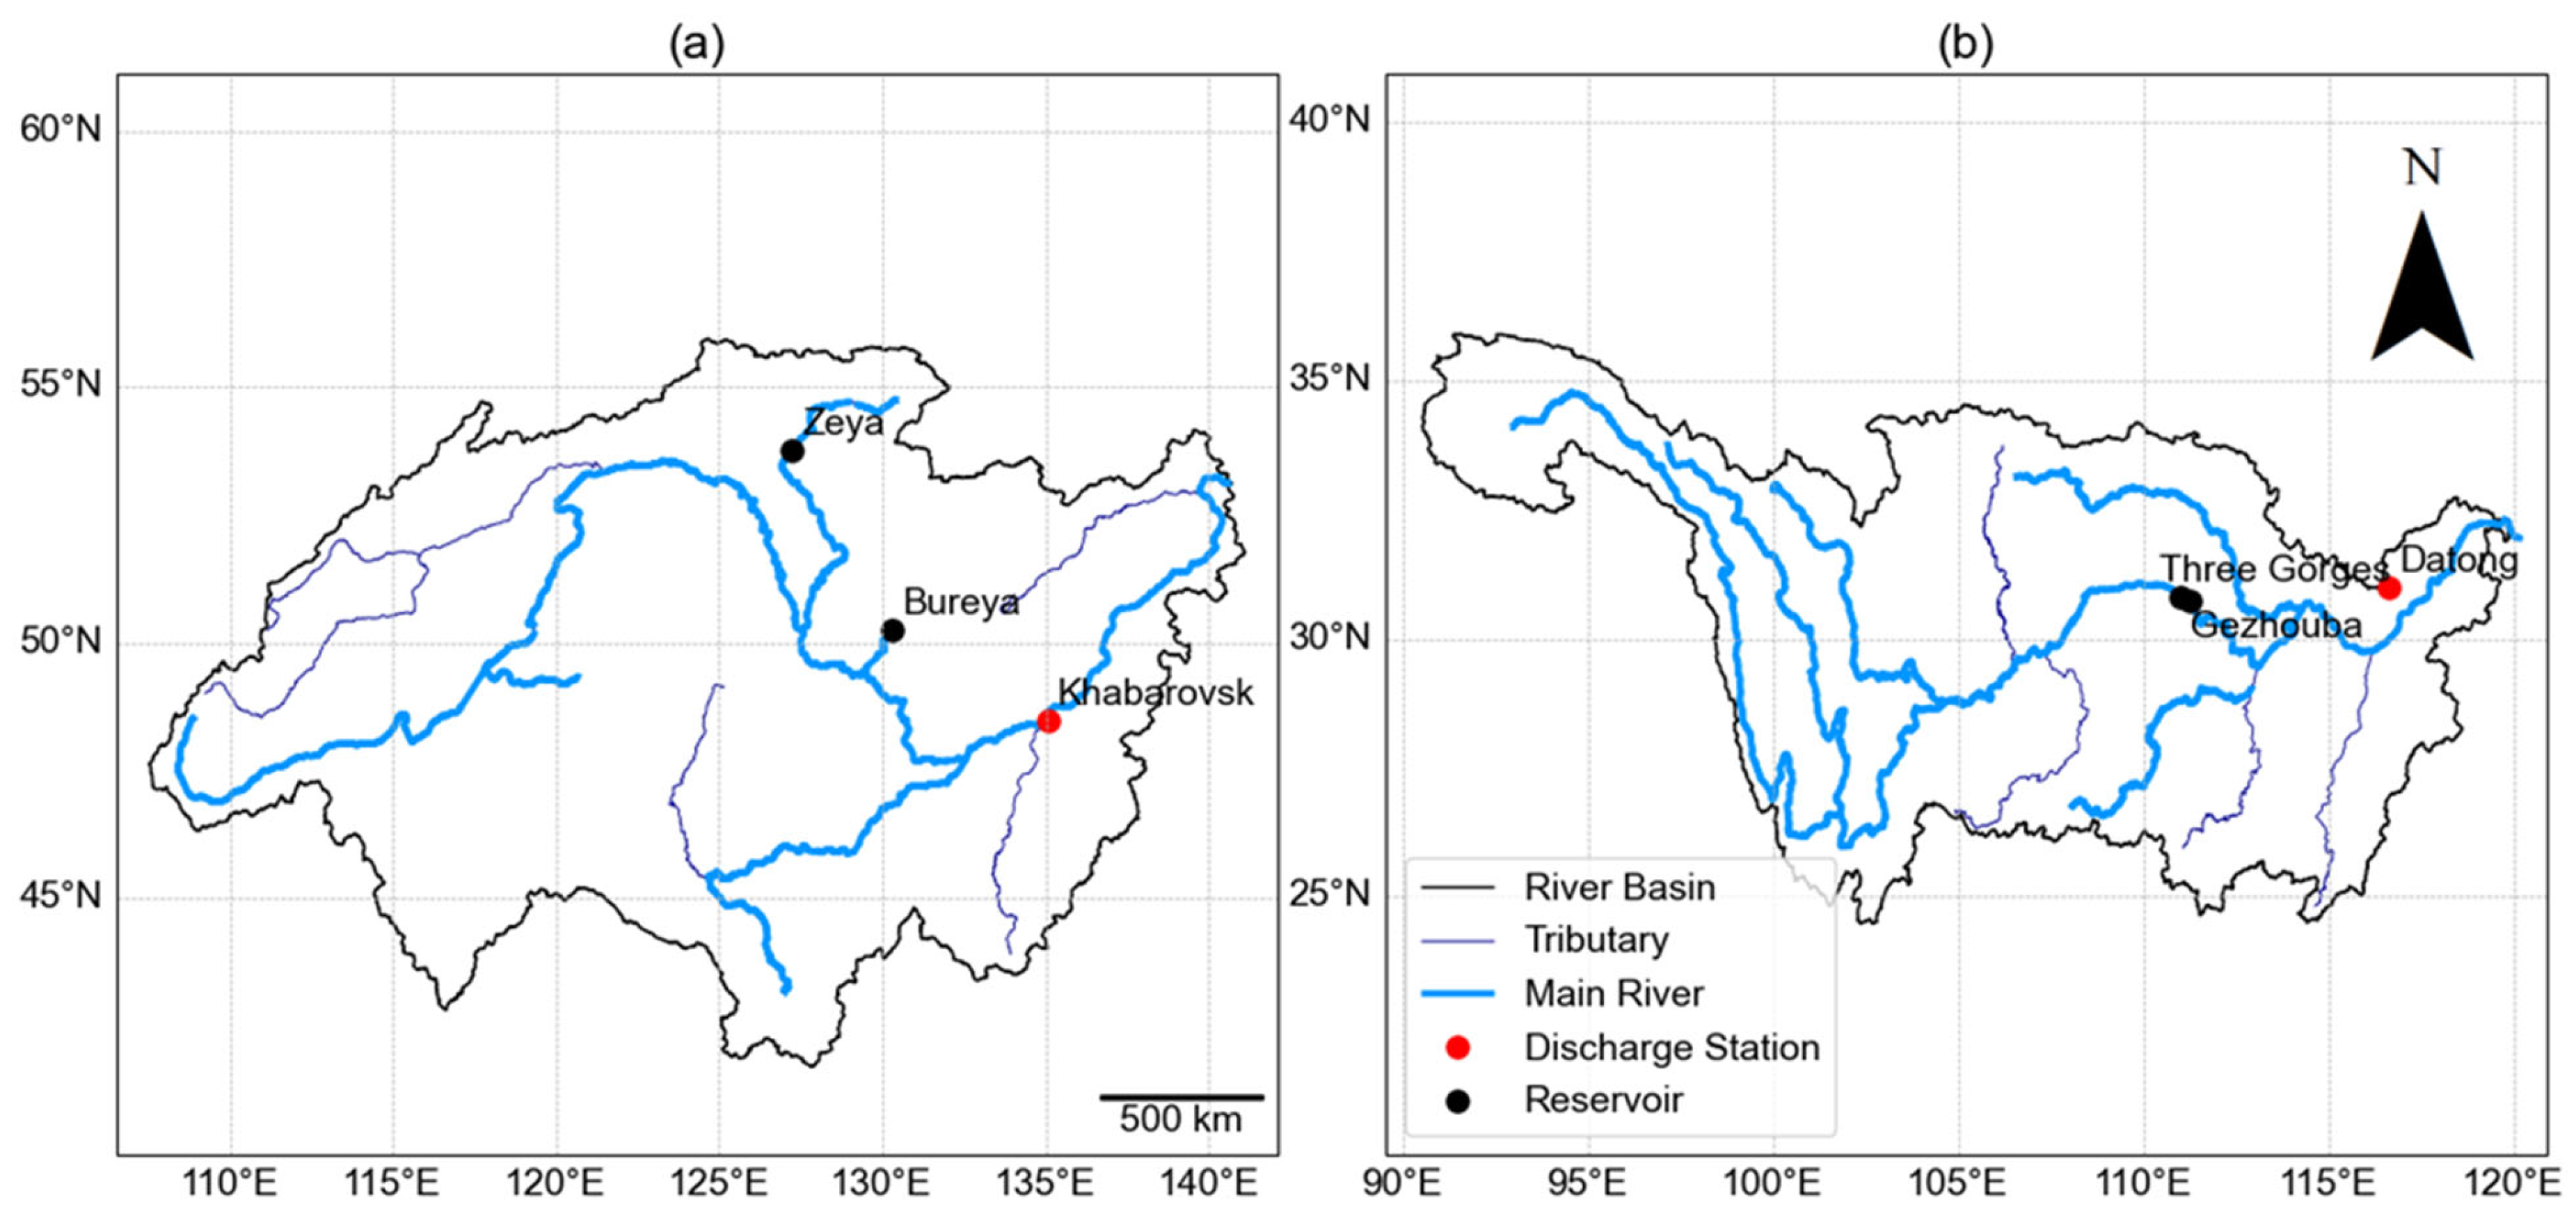
Figure 1. Amur River (a) and Yangtze River (b) basins.
Water 17 02339 g001
Figure 2. Schematic structure of the random forest regression model.
Water 17 02339 g002
Figure 3. Discharge trend analysis at Khabarovsk (ad) and Datong (eh): (a,e) annual mean discharge, (b,f) annual minimum monthly discharge, (c,g) annual maximum monthly discharge, and (d,h) annual monthly ratio.
Water 17 02339 g003
Figure 4. Wavelet power spectra of discharge series at Khabarovsk (ac) and Datong (df): (a,d) annual mean discharge, (b,e) annual minimum monthly discharge, and (c,f) annual maximum monthly discharge.
Water 17 02339 g004
Figure 5. Probability density of monthly occurrence for annual maximum and minimum discharges (a) and extreme discharge events (b).
Water 17 02339 g005
Figure 6. Interannual variation in extreme discharge events at Khabarovsk (a) and Datong (b).
Water 17 02339 g006
Figure 7. Intensity analysis of extreme discharge events at Khabarovsk (a,b) and Datong (c,d), with k denoting the trend slope. Red lines represent significant trends (p < 0.05), and blue lines represent nonsignificant trends.
Water 17 02339 g007
Figure 8. Feature importance analysis based on random forest at Khabarovsk (a) and Datong (b).
Water 17 02339 g008
Table 1. Hydrological Information of Stations.
StationDrainage Area/km2LocationPeriodTemporal Resolution
Khabarovsk1,630,00048.43° N, 135.05° E1896–2021Monthly
Datong1,705,38330.77° N, 117.62° E1950–2018Monthly
Table 2. Major reservoirs and hydropower projects in the study basins.
ReservoirsBasinStart YearOper. YearTotal Cap.
(108 m3)
Active Cap. (108 m3)
ZeyaAmur19641975684383
BureyaAmur19852009209.4115
Three GorgesYangtze19942009393221.5
GezhoubaYangtze1970198815.8-
Table 3. Extreme discharge characteristics (m3/s).
StationMean
Discharge
Flood
Threshold
Mean Flood
Discharge
Drought
Threshold
Mean Drought
Discharge
No. of Events
Khabarovsk8431.521,500.025,824.9581.2624.076 (each type)
Datong28,42253,846.561,573.69638.28710.534 (each type)
Table 4. Analysis of monthly mean discharge.
KhabarovskDatong
MonthAvg DisCVCPTrendAvg DisCVCPTrend
1151250.88198712,06026.711988
2109966.42195412,71725.41987
399770.52195417,05128.51987
4376440.18196024,62019.33
512,27428.633,64222.71983
613,96432.6197340,47118.22
713,90932.7151,92118.59
817,87732.2643,33121.57
917,61036.2136,76523.48
1011,85935.9230,69821.641985
11430041.7122,48921.621983
12195136.4199014,54921.48
Notes: Avg Dis = average monthly discharge (m3/s); CV = coefficient of variation (%); CP = change-point year; Trend = trend direction (↑ increasing, ↓ decreasing, — not detected).
Disclaimer/Publisher’s Note: The statements, opinions and data contained in all publications are solely those of the individual author(s) and contributor(s) and not of MDPI and/or the editor(s). MDPI and/or the editor(s) disclaim responsibility for any injury to people or property resulting from any ideas, methods, instructions or products referred to in the content.