Abstract
With the acceleration of urbanization in China, water resources have become a key factor restricting regional sustainable development. Current research primarily examines the temporal or spatial variations in the water resources ecological footprint (WREF), with limited emphasis on the integration of both spatial and temporal scales. In this study, we collected the data and information from the 2005–2022 Statistical Yearbook and Water Resources Bulletin of the Yangtze River Delta Urban Agglomeration (YRDUA), and calculated evaluation indicators: WREF, water resources ecological carrying capacity (WRECC), water resources ecological pressure (WREP), and water resources ecological surplus and deficit (WRESD). We primarily analyzed the temporal and spatial variation in the per capita WREF and used the method of Geodetector to explore factors driving its temporal and spatial variation in the YRDUA. The results showed that: (1) From 2005 to 2022, the per capita WREF (total water, agricultural water, and industrial water) of the YRDUA generally showed fluctuating declining trends, while the per capita WREF of domestic water and ecological water showed obvious growth. (2) The per capita WREF and the per capita WRECC were in the order of Jiangsu Province > Anhui Province > Shanghai City > Zhejiang Province. The spatial distribution of the per capita WREF was similar to those of the per capita WRECC, and most areas effectively consume water resources. (3) The explanatory power of the interaction between factors was greater than that of a single factor, indicating that the spatiotemporal variation in the per capita WREF of the YRDUA was affected by the combination of multiple factors and that there were regional differences in the major factors in the case of secondary metropolitan areas. (4) The per capita WREF of YRDUA was affected by natural resources, and the impact of the ecological condition on the per capita WREF increased gradually over time. The impact factors of secondary metropolitan areas also clearly changed over time. Our results showed that the ecological situation of per capita water resources in the YRDUA is generally good, with obvious spatial and temporal differences.
1. Introduction
Water resources are fundamental for human survival and societal progress [1]. The growing population and rapid urbanization have led to a continuous rise in the use and need for water resources [2]. However, due to disparities in availability across different regions and times, as well as incongruences between water availability and economic development patterns, the discrepancy between water supply and demand has become more pronounced [3,4,5]. Consequently, water scarcity has emerged as a critical constraint on regional sustainable development [6]. The water resources ecological footprint (WREF) is a metric used to calculate the necessary biological production area to maintain human life and production to water resources consumption and absorb water pollution under the conditions of a certain population and economic scale, is to convert water resources related consumption into water resources land area [7]. It is an important indicator for measuring the degree of water resource development and use by human activities and the sustainable usage status of water resources [8,9]. Calculating the WREF and analyzing its dynamic changes is of great significance for the development and use of regional water resources and the sustainable evolution of the social economy [10].
The ecological footprint theory was first proposed by Canadian ecological economists Rees et al. [11] in 1992. Later, in 2002, it was further expanded by Dutch scholars Hoekstra et al. [12], who introduced the concept of the ecological footprint into water resource assessment and proposed the “water footprint” theory to identify regional water use efficiency and water resource pressure. It has now been widely applied to reflect the water resource carrying capacity of a region and evaluate the degree of sustainable use [7,10,13]. In recent years, some scholars have conducted research related to water ecological footprints at scales such as provinces and cities [10,13,14,15,16], urban agglomerations [17,18], and river basins [19] to explore the sustainability of regional water resources. For instance, Huang et al. [16] established a water resources land account, comprehensively considering all the functions of surface water and groundwater, and calculated and analyzed the changes in the WREF in Jiangsu Province from 1998 to 2003. Based on the ecological footprint model, Huang et al. [10] analyzed the changing characteristics of the per capita WREF, the per capita water resources ecological carrying capacity (WRECC) and the per capita water resources ecological pressure index (WREPI) of each city in Hubei Province from 2005 to 2019, and discussed the pattern of water utilization. Sun et al. [13] demonstrated how to achieve sustainable utilization of water resources by analyzing the WREF and the WRECC calculated using the model of WREF in Beijing, Shanghai, Tianjin, and Chongqing from 2004 to 2015.
Meanwhile, Zhang et al. [17] examined the temporal changes and spatial variations in the water resource use in the three major urban agglomerations in China’s Yangtze River Economic Belt using an improved water ecological footprints (WEFs) model and investigated the spatial autocorrelation of the WEFs. Chen et al. [20] calculated the WREF using a three-dimensional ecological footprint model and found that there was regional complementarity in the breadth and depth of the water ecological footprint. They further evaluated the sustainable development degree of the urban agglomeration in the middle reaches of the Yangtze River from 2000 to 2015. Wang et al. [19] introduced the ecological stress index into the WREF model and evaluated the sustainability of water resources in the Liao River Basin at multiple scales. Guan et al. [21] further corrected the factors in the WREF model based on the “provincial hectare” model and comparatively analyzed the changing characteristics of the WREF, WRECC, and ecological compensation amount in the upper, middle, and lower reaches of the Yangtze River Basin from 2015 to 2017. At present, however, the dynamic research on the distribution of the WREF focuses on analyzing the variation either in time or in space, while the exploration of the WREF combining time and space is relatively weak. This may lead to an insufficient comprehensive understanding of the differences in regional WREF.
The factors controlling WREF have been explored in many past studies. For instance, Fang et al. [22] established an exponential decomposition model through the logarithmic mean Dethel index method, analyzed the influencing factors of the WREF in Dongguan City, and concluded that economic development and population played a positive role in its dynamics, while the structure of the water footprint played a negative role. Chen et al. [23] analyzed the agricultural WREF of Beijing from 1980 to 2012 using the STIRPAT (Stochastic Impacts by Regression on Population, Affluence, and Technology) model and revealed that factors such as population, gross domestic product (GDP), and total rural power generation had inhibitory effects on it. The analysis results of Zheng et al. [24], using the decomposition method of LMDI (Logarithmic Mean Divisia Index), indicated that changes in the WREF of Yunnan Province from 2006 to 2018 were related to technical and economic factors. Ma et al. [25] used the CFEM (Cross-sectional Fixed Effects Model) model to explore the explanatory degree of 16 indicators in terms of economy, population, environment, agriculture, and water conservancy and concluded that seven indicators, such as economic development level, population size, and reservoir capacity, had a positive impact on the changes in the WREF of Shaanxi Province from 2000 to 2019. An et al. [26] adopted the Divisia index model to study the use of water resources in the Huai River Basin and its five provinces from 2001 to 2016 and concluded that economic growth was an important factor causing the change in the WREF in the Huai River Basin.
Although the sampling methods of the above-mentioned research explored various drivers of the WREF, there is insufficient understanding of the spatiotemporal heterogeneity of the WREF and the interaction among the influencing factors. Geographic detector (Geodetector) is a statistical method for detecting the spatiotemporal heterogeneity of variables and their driving factors [27]. Because they have advantages, such as fewer usage restrictions, reliable results in processing mixed-type data, and attention to factor interactions, they are widely used in related research to explain the controls on natural and socio-economic phenomena [28,29].
The Yangtze River Delta Urban Agglomeration (YRDUA) is one of the most important economic circles in China [30]. The sustainable use of water resources is related to the high-quality integrated development of the regional economy. The region is located in the eastern coastal area of China and is one of the key ecological nodes of the Yangtze River Basin system [31]. Its ecological functions are extremely important and sensitive. As the region is located in a climate transition zone, the monsoon effect is significant, and rainfall amounts vary greatly from year to year, albeit mainly concentrated in the summer and autumn, resulting in drought and flood disasters. In addition, there are about 167 million permanent residents in the region (by the end of 2022). Therefore, although the total amount of water resources in the YRDUA is abundant, the per capita water resources are insufficient, showing uneven temporal and spatial distribution—that is, more in the south and less in the north and more in the summer and autumn and less in the winter and spring, respectively. There are numerous rivers and lakes in the region. However, with the continuous acceleration of urbanization, the rapid growth of water demand, the unreasonable water use structure, and water pollution and other reasons, the conflict between supply and demand has become increasingly prominent, and the situation of water resource shortage has become increasingly severe [32].
This study collected relevant data, such as precipitation amounts, total per capita water resources, permanent resident population size, industrial wastewater discharge, and vegetation coverage rate; calculated the corresponding evaluation indicators, such as ecological footprint, ecological carrying capacity, ecological pressure, and ecological surplus and deficit; and analyzed the spatiotemporal evolution of the WREF of the YRDUA from 2005 to 2022. To further explore the causes of the spatiotemporal evolution of the WREF, we used factor detectors and interaction detectors in Geodetector to investigate the factors driving the spatiotemporal changes in the WREF from four aspects: natural resources, social economy, technological level, and ecological condition.
2. Materials and Methods
2.1. Study Area
According to the “Development Plan for the Yangtze River Delta Urban Agglomeration” issued by the State Council of the People’s Republic of China in 2016, it is clearly defined that the Yangtze River Delta is composed of the entire regions of Shanghai, Jiangsu, Zhejiang, and Anhui provinces (as Chaohu City in the YRDUA was adjusted to a county-level Chaohu City in August 2011 and is under the jurisdiction of Hefei City, the data and information related to this city were included in the calculation of Hefei City), with 26 cities including Shanghai as the central area (Figure 1). The terrain of this area is mainly alluvial plains, and it has a subtropical monsoon climate with four distinct seasons. The water system is well-developed, featuring numerous rivers and lakes such as the Yangtze River, Qiantang River, Huaihe River, Taihu Lake, and Chaohu Lake, providing abundant available water resources. This region is one of the areas with the highest economic development and urbanization levels in China. By the end of 2022, the regional GDP was approximately 24.25 trillion yuan, accounting for about 20% of the national GDP in China. The permanent resident population was 166,928,600. As such, the GDP growth rate and population density are greater than the national average, and the integration within the region are prominent. As one of the world’s six major urban agglomerations, the YRDUA is not only the geographical center of East Asia and a key point of the East Asian shipping route in the Western Pacific but also an important intersection area of the “Belt and Road Initiative” and the Yangtze River Economic Belt.
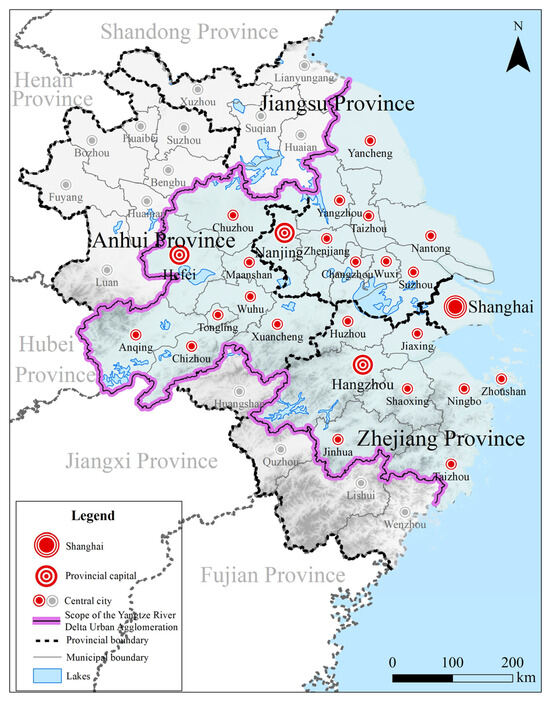
Figure 1.
Schematic diagram of the study area.
Based on the radiation and driving effects of the metropolitan areas within the YRDUA, this paper divided the YRDUA into six secondary metropolitan areas: Nanjing Metropolitan Areas, Hangzhou Metropolitan Areas, Hefei Metropolitan Areas, Suzhou–Wuxi–Changzhou Metropolitan Areas, Ningbo Metropolitan Areas, and Shanghai Metropolitan Areas (Table 1).

Table 1.
The division of metropolitan areas in the YRDUA.
2.2. Research Methods and Data Sources
2.2.1. The WREF
The WREF is used to calculate the necessary biological production area to maintain human life and production to water resources consumption and absorb water pollution under the conditions of a certain population and economic scale. It converts the water resource-related consumption into the area of land containing water resources [7]. Per capita WREF was calculated following Equation (1),
where is the per capita WREF (hm2/person), is the global balance factor of water resources, is the total water consumption of regional water resources (m3), is the total population of the region, and is the global average production capacity of water resources (m3/hm2).
2.2.2. The WRECC
The WRECC refers to the maximum capacity of a region’s water resources to support sustainable economy, environment, and society at a certain stage of economic, environmental, and social development [33]. Per capita WRECC was determined by Equation (2),
where is the per capita WRECC (hm2/person), while is the regional water resources production factor, calculated as:
In the above formula, , the average water production modulus (m3/hm2), is calculated by dividing the total water resources of a region by its land area; is the average total water resources (m3) during the study period; is the area (hm2); and is the total regional water consumption (m3), because the total water resources reflect potential water resources and do not completely equal the amount of water resources that can be used. In the humid Yangtze River Delta region, the precipitation and river runoff are relatively large, and the total water resources are relatively abundant. The ecological footprint of water resources calculated from the total amount of water used cannot fully reflect the actual use of water resources in a region. Therefore, in this paper, is replaced by the total regional water consumption. Meanwhile, for the biodiversity compensation index, for the Yangtze River Delta region, paper refers to the “Technical Outline for Establishing a National Water Resources Carrying Capacity Monitoring and Early Warning Mechanism” issued by the Water Resources and Hydropower Planning and Design Institute of the Ministry of Water Resources in 2016 and takes the value of 0.1.
2.2.3. The WREP
The WREP is the ratio of the WREF to the WRECC of a certain area, which can be used to assess the ecological health of regional water resources to sustain the economy and society [34]. Per capita WREP was calculated following Equation (5),
where represents the per capita WREP; the larger the value of , the greater the degree of regional water resource insecurity. When 0 < < 1, such indicates that the ecological environment of regional water resources is in a safe state and has the potential for further development and use. = 1 indicates that the supply of the regional water resources environment is balanced and the exploitation degree of water resources reaches the maximum. Conversely, > 1 indicates that the regional water resources utilization is in an unsustainable usage state.
2.2.4. The WREF per 10,000 Yuan GDP
The WREF per 10,000 yuan GDP is the ratio of the WREF of a certain region to this regional GDP, which can be used to evaluate the efficiency of water resource utilization [35]. Per capita WREF per 10,000 yuan GDP was calculated following Equation (6):
where represents the per capita WREF per 10,000 yuan GDP, and the is the regional gross domestic product (the unit is 10,000 yuan). A smaller value of indicates less water resources consumption per 10,000 yuan GDP, reflecting higher efficiency of the regional water resource utilization.
2.2.5. The WRESD
The ecological surplus or ecological deficit of water resources can be used to measure the balance between regional water supply and demand and the degree of sustainable use of regional water resources [36]. Per capita WRESD was determined by Equation (7),
where is the per capita regional WRESD index. > 0 indicates that there is an ecological surplus of regional water resources and the use of water resources is sustainable, while = 0 indicates an ecological balance, and < 0 indicates that there is an ecological deficit of regional water resources and the use of water resources is unsustainable.
2.2.6. Geodetector
The Geodetector is a spatial statistical model used for detecting the spatial differentiation of a certain geographical phenomenon and its explanatory factors. It includes factor detectors, interaction detectors, risk detectors, and ecological detectors and can be used to detect to what extent each factor can explain the spatial differentiation [27]. The Geodetector classifies spatial data with the help of ArcMap software (version 10.3), further detects the consistency of the spatial pattern of dependent and independent variables through spatial heterogeneity, calculates and compares the values of individual factors and the superposition of two factors, and determines whether there is an interaction between factors and the strength of the interaction (Table 2).
Table 2.
Interaction Detection [37].
Before using the Geodetector, the ArcMap10.3 symbol system module was applied to classify the potential influencing factors into five levels and four categories using the natural discontinuity point method. The factor detector within the Geodetector is selected to detect the spatiotemporal heterogeneity of the per capita WREF in the YRDUA and the explanations of each driving factor for this heterogeneity. The interaction detector within the Geodetector is selected to evaluate whether there is a pairwise interaction of each influencing factor that affects the explanatory power of the spatiotemporal heterogeneity of the per capita WREF in the YRDUA.
2.2.7. Data Sources and Parameter Descriptions
Basic hydrological data, such as the total water consumption of regional water resources () and the total water resources of regional water resources (), were sourced from the “Statistical Yearbook” and “Water Resources Bulletin” of Jiangsu Province, Zhejiang Province, Anhui Province, and Shanghai Municipality from 2005 to 2022. Similarly, the data of the total regional population () and the regional gross domestic product () were sourced from the Statistical Yearbooks of Jiangsu Province, Zhejiang Province, Anhui Province, and Shanghai Municipality from 2005 to 2022. Considering the stability of regional administrative divisions and economic development, the periodicity of planning and construction, and the phased implementation of government policies, this study divided the period from 2005 to 2022 into three-time nodes (2010, 2016, and 2020) with a 6-year boundary to analyze the spatiotemporal changes in the WREF.
Considering the comparability of parameters, the global equilibrium factor of water resources () used to calculate the WREF and the WRECC () adopted the calculation results of the World Wide Fund for Nature (WWF), with a value of 5.19 [16], and the global average production capacity of water resources () was taken as 3140 m3/hm2. According to Equations (3) and (4), the average water resources production factor () of the Yangtze River Delta from 2005 to 2022 was calculated to be 2.037 ± 0.477.
2.2.8. Potential Drivers
Considering the availability of data and the actual situation of the YRDUA, this study, referring to the research of Tao and Guo [38], Zhu et al. [39], and others, explores the controlling factors of the spatiotemporal changes in the per capita WREF of the YRDUA from four potentially influential aspects: natural resources, social economy, technological level, and ecological condition (Table 3). The precipitation and the total per capita water resources were selected to reflect the status of natural water resources. The social economy selects population density, gross national product, output value of the secondary industry, and output value of the tertiary industry and analyzes the influence of human and economic factors. The technical level selects the water consumption per RMB 10,000 yuan of industrial added value and the invention patent factors of industrial enterprises. The ecological condition mainly considers the total amount of industrial wastewater discharge and the impact of forest coverage rate.
Table 3.
Driving factors of the water resources ecological footprint.
3. Results
3.1. Spatiotemporal Evolution of the WREF
3.1.1. Temporal Variation in the WREF in the YRDUA
The per capita WREF in the YRDUA exhibited a fluctuating downward trend between 2005 and 2022, with a reduction rate of 19%. It peaked in 2007 at 4.46 hm2/person (Figure 2). Analyzing the three provinces and one municipality within the region reveals varying levels of per capita WREF; specifically, the ranking in terms of the per capita WREF, from highest to lowest, is Jiangsu Province, Anhui Province, Shanghai City, and Zhejiang Province. Over the period from 2005 to 2022, Anhui Province experienced a fluctuating upward trend in the per capita WREF, rising from 0.87 hm2/person in 2005 to 1.04 hm2/person in 2022, marking a 20% increase. Conversely, Zhejiang Province, Jiangsu Province, and Shanghai City exhibited fluctuating downward trends in the per capita WREF; Zhejiang Province and Jiangsu Province maintained levels within the range of 0.43–0.97 hm2/person and 0.85–1.21 hm2/person, respectively, while Shanghai experienced the most substantial decline at 51.9%.
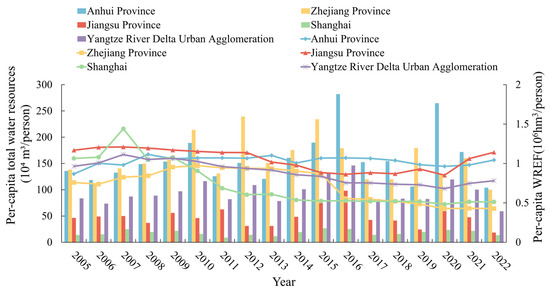
Figure 2.
Temporal variation in the per capita WREF in the YRDUA. The bar chart represents the per capita total water resources; the line chart represents the per capita WREF.
Figure 3 illustrates the per capita WREF across various water usage categories. Between 2005 and 2022, the per capita WREF for agricultural and industrial water uses in the YRDUA exhibited a fluctuating downward trend, while domestic and ecological water uses both demonstrated a fluctuating upward pattern. The per capita WREF for agricultural water use ranged from 1.24 to 1.79 hm2/person, with relatively minor fluctuations. In contrast, the WREF for industrial water use experienced significant variations, reaching a peak of 2.17 hm2/person in 2007 before decreasing by 38.1%. The per capita WREF for domestic water use displayed substantial fluctuations until 2009, stabilizing thereafter. Moreover, the WREF for ecological water use experienced a rapid increase from 2005 to 2008, fluctuated, then declined from 2008 to 2011 before steadily rising again from 2011 to 2022. Regional differences are observed in the per capita WREF of various water usage types within the YRDUA, encompassing three provinces and one municipality. The per capita WREF of agricultural water use exhibited a fluctuating downward trend in Jiangsu Province, Zhejiang Province, and Shanghai City; Zhejiang Province and Shanghai City demonstrated a consistent decline, while Anhui Province displayed a fluctuating upward trend. Meanwhile, the trend in Jiangsu Province mirrored that of the YRDUA. Concerning the per capita WREF of industrial water use, all regions experienced a fluctuating decrease; that of Shanghai City notably reduced by 46.9% between 2005 and 2012, stabilizing thereafter. Conversely, the per capita WREF of domestic water use showed a fluctuating increase across the three provinces and one municipality. Here, Shanghai’s trend aligned with that of the YRDUA, while Anhui Province, Zhejiang Province, and Jiangsu Province maintained a stable growth. Furthermore, the per capita WREF of ecological water use declined in both Zhejiang Province and Shanghai City, by 65.63% and 65.51%, respectively, while Anhui Province and Jiangsu Province experienced an upward trend, with growth rates of 3.68% and 3.05%, respectively.
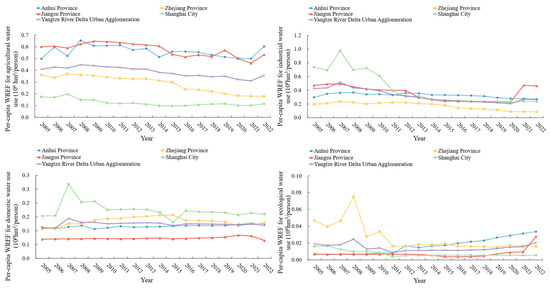
Figure 3.
Temporal variations in the per capita WREF of different water use types in the YRDUA.
To further explore the sustainable development and use of water resources in the YRDUA, the per capita WRECC, WREP, WREF per 10,000 yuan GDP, and WRESD were calculated by Equations (2) and (5)–(7) (Figure 4). From 2005 to 2022, the per capita WRECC in the YRDUA generally showed a fluctuating downward trend, with a decrease of 31%. Among them, the per capita WRECC in Jiangsu Province decreased the most. During the study period, both the per capita WREF and the per capita WRECC of the urban agglomerations showed downward trends. The WRECC was generally greater than the WREF, indicating that the YRDUA as a whole was in an ecological surplus state. However, Jiangsu Province has long been in an ecological deficit state, especially in 2022, when both its ecological pressure and ecological deficit reached their peak values. From 2005 to 2022, the per capita WREP in the YRDUA increased significantly, and the threat to regional water resource security intensified. However, the overall situation remains safe. Overall, the per capita WREF in 10,000 yuan of the GDP in the YRDUA and the three provinces and one municipality has decreased significantly. The overall change trend in Anhui Province was similar to that of the YRDUA, with a decrease of 82.6%.
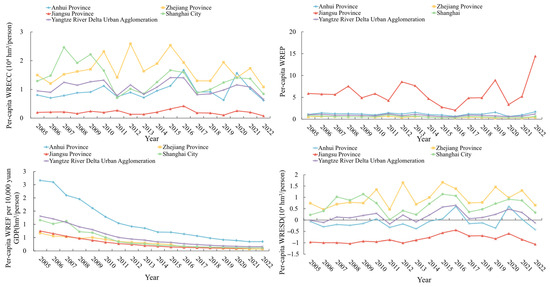
Figure 4.
Temporal variations in the per capita WRECC, WREP, WREF per 10,000 yuan GDP, and WRESD in the YRDUA.
3.1.2. Spatiotemporal Variation in the WREF in the YRDUA
According to the classification by the natural discontinuity point method, the per capita WREF in the YRDUA can be divided into five grades, namely (>1.6), ([1.2, 1.6]), ([0.8, 1.2]), ([0.5, 0.8]), and (1.6) as the high-value areas; ([0.5, 1.6]) as the medium-value area; and (<0.5) as the low-value area. With a 6-year boundary, three typical years, 2010, 2016, and 2022, were selected to analyze the spatial changes in the per capita WREF in the YRDUA (Figure 5). The spatial variation in the per capita WREF in the YRDUA was relatively large. In general, there was a distinct spatial distribution pattern, with higher values observed in the northern regions and lower values observed in the southern regions. Approximately 73.10% of cities fall within the medium- to low-value range, suggesting efficient water resource use in most areas of the YRDUA. However, instances of excessive water consumption were evident in certain cities. Notably, there was a clear increase in the number of cities with high WREF values in 2022, particularly concentrated in the Nanjing Metropolitan Area, the northern sector of the Suzhou–Wuxi–Changzhou Metropolitan Area, and the Hefei Metropolitan Area. Changes in the medium- to low-value categories were primarily influenced by the Nanjing Metropolitan Area and the urban agglomeration in northern Jiangsu.
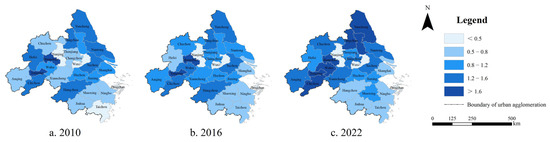
Figure 5.
Spatial-temporal variations in the per capita WREF in the YRDUA.
The per capita WRECC and the per capita WRESD in the YRDUA also have significant spatial differences (Figure 6 and Figure 7). The per capita WRECC of the YRDUA remains relatively stable. The number of areas with the per capita WREP values exceeding 1 decreased from five to three, while those nearing 1 have shown a gradual rise in number (Figure 8). This indicated a balanced equilibrium between water resource supply and demand within the region. The per capita WRECC in the YRDUA exhibited fluctuations and declined across the three provinces and one municipality during the study period, with a spatial distribution pattern showing higher levels in the southern regions and lower levels in the northern areas. Jiangsu Province has consistently experienced a low per capita WRECC and significant water ecological deficits, leading to an imbalance in the regional water resource supply and ecological conditions that hinders sustainable development. In contrast, Zhejiang Province maintains a relatively high per capita WRECC and an ecological surplus of water resources, indicating its sustainable water resource use state. Anhui Province has experienced a notable decrease in the per capita WRECC, particularly concentrated in the Hefei Metropolitan Area, resulting in a reduced support capacity for regional sustainable development alongside an increasing water resource demand, aligning with the trend of per capita industrial water resources ecological footprint. Nonetheless, the region demonstrates an ecological surplus status.
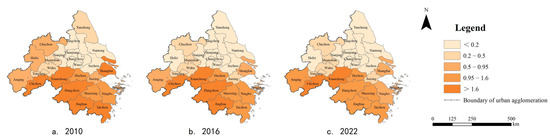
Figure 6.
Spatial-temporal variations in the per capita WRECC in the YRDUA.
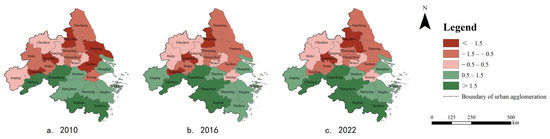
Figure 7.
Spatial-temporal variations in the per capita WRESD in the YRDUA.
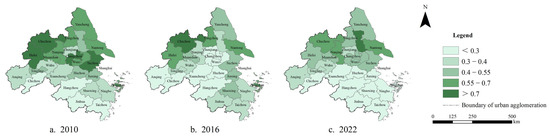
Figure 8.
Spatial-temporal variations in the per capita WREP in the YRDUA.
Between 2005 and 2022, the per capita WREF per 10,000 yuan GDP in the YRDUA exhibited a gradual decline, accompanied by an increase in medium- and low-value areas, reflecting a continuous enhancement in regional water resource use efficiency (Figure 9). Analysis at the level of the three provinces and one municipality revealed spatial disparities in the per capita WREF per 10,000 yuan GDP within the YRDUA during the study period. High-value areas were predominantly situated in the northern and western regions, with Anhui Province exhibiting the highest values, followed by Jiangsu Province. Conversely, Zhejiang Province and Shanghai Municipality consistently demonstrated relatively lower values. Notably, Hefei City experienced a substantial reduction in the per capita WREF per 10,000 yuan GDP from 2.66 hm2/person in 2005 to 0.35 hm2/person in 2022, signifying a marked improvement in water resource use efficiency.
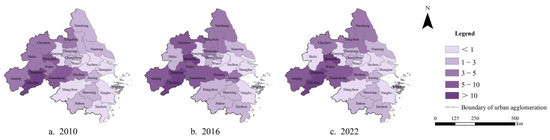
Figure 9.
Spatial-temporal variations in per capita WREF per 10,000 yuan GDP in the YRDUA.
3.2. Controlling Factors of the Spatiotemporal Variation in per Capita WREF in the YRDUA
3.2.1. Driving Factors in the YRDUA
The factor detector in the Geodetector model was used to analyze the influence of each influencing factor on the spatiotemporal variations in the per capita WREF in the YRDUA (Figure 10). According to the explanatory power of the impact factor, such can be divided into the major impact factor and the secondary impact factor. The explanatory power of the major impact factor exceeds 50% in both cases. Overall, the explanatory power of the major driving factors in 2010 from largest to smallest was industrial wastewater discharge (X10), precipitation (X1), total per capita water resources (X2), GDP (X4), output value of the secondary industry (X5), output value of the tertiary industry (X6), and water consumption per RMB 10,000 yuan of industrial added value (X8). The explanatory power of the major driving factors in 2016 from high to low was industrial wastewater discharge (X10), precipitation (X1), forest coverage rate (X11), the number of valid invention patents of industrial enterprises (X9), total per capita water resources (X2), and population density (X3). The explanatory power of the major driving factors in 2022, from high to low, is as follows: industrial wastewater discharge (X10), output value of the secondary industry (X5), forest coverage rate (X11), water consumption per RMB 10,000 yuan of industrial added value (X8), population density (X3), and precipitation (X1). From 2005 to 2022, the explanatory power of industrial wastewater discharge (X10) was the highest. Precipitation (X1) maintained relatively high explanatory power. The explanatory power of forest coverage rate (X11) increased from a secondary influencing factor of 0.44 in 2010 to a major influencing factor of 0.96 in 2022, ranking third. The explanatory power of the ecological state gradually strengthened. This indicates that the YRDUA is still mainly influenced by natural resources, but the influence of the ecological conditions is gradually increasing.
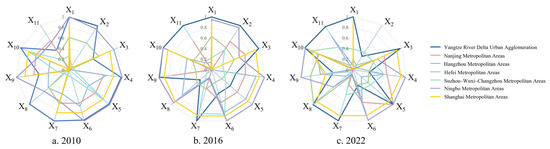
Figure 10.
Detection of driving factors of the per capita WREF in the YRDUA.
Among secondary metropolitan areas, the impact factors of Nanjing Metropolitan Area are primarily social and economic. In 2016, population density (X3) and GDP (X4) became the major factors, while the explanatory power of forest coverage rate (X11) declined. The major driving factors of Hangzhou Metropolitan Area, Hefei Metropolitan Area, and Suzhou–Wuxi–Changzhou Metropolitan Area have changed significantly over time, shifting from natural resources and the social economy to the technological level and the ecological condition, respectively. The output value (X5) of the secondary industry in Hangzhou Metropolitan Area has decreased from 0.84 in 2016 to 0.21 in 2022. The number of major driving factors in Hefei Metropolitan Area and Suzhou–Wuxi–Changzhou Metropolitan Area has increased. In addition, the number of valid invention patents of industrial enterprises (X9) and the discharge of industrial wastewater (X10) have become new major driving factors, and their explanatory power has steadily risen, reaching 0.81 and 0.71 and 0.56 and 0.86, respectively, in 2022. This indicates that, with the development of science and technology and the social economy and the improvement of water resource use efficiency, the influencing factors of natural resources are no longer the key factors affecting the spatiotemporal changes in the WREF. Ningbo Metropolitan Area is significantly affected by non-natural factors. The explanatory power of precipitation (X1) and total per capita water resources (X2) decreased from 0.99 and 0.92 in 2010 to 0.14 and 0.16 in 2022, respectively, both dropping from major driving factors to secondary influencing factors. The number of major driving factors in Shanghai Metropolitan Area is relatively high and changes little. In 2016, water consumption per RMB 10,000 yuan of industrial added value (X8) became a major driving factor, with an influence as high as 0.91.
3.2.2. Integration of Driving Factors in the YRDUA
The interactions of drivers on the spatiotemporal differentiation characteristics of the per capita WREF in the YRDUA were analyzed by means of the interactive detector in the Geodetector model (Figure 11). After the interactive detection of each driving factor, there was an interaction of bilinear enhancement and nonlinear enhancement. There was no situation of nonlinear weakening or mutual independence—that is, after the interaction of two variables, the explanatory power of the factors increased, indicating that the spatiotemporal variation in the per capita WREF of the YRDUA is the result of the joint action of multiple factors. Overall, the interaction explanatory power between the total per capita water resources (X2) and GDP (X4) of the YRDUA was the highest in 2010, reaching 0.98. In 2016, the interaction explanatory power between the number of valid invention patents of industrial enterprises (X9) and forest coverage rate (X11) was the highest, reaching 0.99. In 2022, the interaction explanatory power between precipitation (X1) and the output value of the secondary industry (X5), and water consumption per RMB 10,000 yuan of industrial added value (X8) was the highest. Similarly, the interaction between the output value of the secondary industry (X5) and water consumption per RMB 10,000 yuan of industrial added value (X8) also has a high explanatory power.
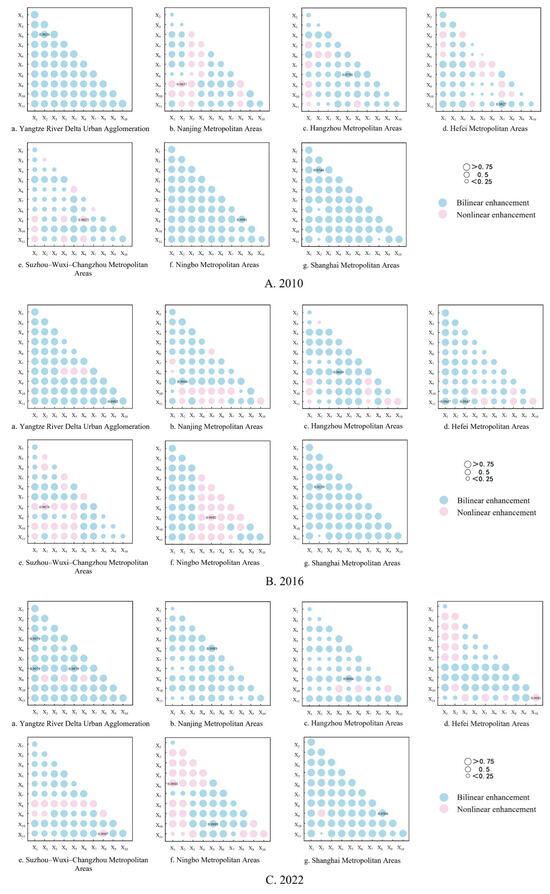
Figure 11.
Detection of the interactions among factors driving the per capita WREF in the YRDUA.
Among secondary metropolitan areas, Nanjing Metropolitan Area has shifted from an interaction between the total per capita water resources (X2) and the number of valid invention patents of industrial enterprises (X9) to the interaction between the output value of the secondary industry (X5) and the output value of the tertiary industry (X6), mainly influenced by socio-economic factors. The interaction between the water consumption per RMB 10,000 yuan of industrial added value (X8) and the other ten factors in Hangzhou Metropolitan Area from 2010 to 2022 was the strongest, fully demonstrating that water consumption per RMB 10,000 yuan of industrial added value (X8) is the most significant influencing factor among the multi-influencing factor interactions in Hangzhou Metropolitan Area. Hefei Metropolitan Area has shifted from the interaction between natural resources and the ecological condition to an internal interaction within the ecological condition, reflecting the increasing influence of the ecological condition on the per capita WREF. The highest interactive explanatory power factor of Suzhou–Wuxi–Changzhou Metropolitan Area changed from the output value of the tertiary industry (X6) and the number of valid invention patents of industrial enterprises (X9) in 2010 to the total per capita water resources (X2) and water consumption per RMB 10,000 yuan of industrial added value (X8) in 2016, then to the water consumption per industrial added value (X8) and forest coverage rate (X11) in 2022. The explanatory power in terms of technical level keeps improving; the various influencing factors of Ningbo Metropolitan Area have changed from a single bilinear enhancement to bilinear enhancement and nonlinear enhancement, and the interactive explanatory power in terms of science and technology has steadily increased. During the research period, the interaction of various influencing factors in Shanghai Metropolitan Area continued to increase. In 2022, the interaction explanatory power of water consumption per RMB 10,000 yuan of industrial added value (X8) and the number of valid invention patents of industrial enterprises (X9) was the highest, reaching 0.92.
4. Discussion
In contrast to the other two provinces and one municipality, the per capita WREF in Anhui Province showed an overall upward trend during the study period (Figure 2 and Figure 5), which was consistent with the research results of Xiong et al. [40]. They found that the water ecological footprint of Anhui Province has generally increased from 2007 to 2016. The per capita WREFs of the YRDUA, including its three provinces and one municipality, have all declined to varying degrees since 2012 (Figure 2 and Figure 5). This may be related to the implementation of the country’s strictest water resources management system, the “Three Red Lines” and the “Four Indicators,” in 2011. The implementation of these systems has exerted the important constraints on water resources [41,42]. The fragile balance between water supply and demand is increasingly worsening due to global warming, leading to a future where water resources struggle to meet growing societal and environmental needs [43,44,45]. The result of the simulation study based on the warming scenarios indicated that under a 1.5 °C warming scenario, the global water gaps increase to 484.4 km3/yr with respect to the baseline climate, representing a 5.8% increase compared to the baseline global water gap (457.9 km3/yr) [46]. Our study reveals a 19% reduction in the WREF in the YRDUA from 2005 to 2022 (Figure 2), highlighting the success of recent water management strategies in promoting sustainable water use in this region. To more effectively mitigate water scarcity issues amplified by climate change, these management strategies should be further strengthened and improved.
The proportion of industrial water use in the WREF of the YRDUA is high and shows a downward trend, while the proportion of domestic water use and ecological water use is constantly increasing (Figure 3). This phenomenon may be influenced by the established scale of the industrial sector in the YRDUA, coupled with a growing permanent resident population and improved living standards in recent years. [47,48]. The per capita WREF of industrial water uses in Shanghai notably declined between 2005 and 2012 (Figure 3), possibly attributed to the substantial expansion of the new energy industry (e.g., nuclear power, wind power, and integrated gasification combined cycle) during this period. This expansion consequently led to a marked decrease in industrial water consumption in thermal power plants [49]. Meanwhile, the per capita WREP in the YRDUA has been steadily increasing (Figure 4 and Figure 8), indicating a heightened level of insecurity in regional water resource development and use, aligning with findings by Zhu et al. [50]. Their study identified that nine cities faced moderate water scarcity, while 12 cities experienced severe water scarcity, with several cities including Shanghai, Nanjing, Hefei, Hangzhou, and Jinhua exhibiting significant water ecological pressure. Despite this, the overall per capita WREF per 10,000 yuan GDP in the YRDUA has decreased (Figure 4 and Figure 9), signaling a notable enhancement in water resource utilization efficiency. This trend is in line with the observations of Zhu et al. [51] regarding the rapid adoption of advanced water-saving and water-use technologies in the eastern region of the Yangtze River Economic Belt. The above results have also been proved in the study from Liu and Yuan [52]. They found the efficiency of water resource utilization in the Yangtze River Economic Belt has been greatly improved.
The per capita WRECC and the per capita WREF per 10,000 yuan GDP of Hefei City in Anhui Province have both declined (Figure 4, Figure 6 and Figure 9). This may be related to the active undertaking of various industrial transfers by the Hefei Metropolitan Area represented by Hefei, Wuhu, and Ma’anshan and the rapid development of local high-tech industries [40]. This study, taking into account the imbalance between water supply and demand caused by the uneven temporal and spatial distribution of precipitation in Jiangsu Province, has conclusions similar to Hou [53], indicating that Jiangsu Province is in an ecological deficit state (Figure 7), with high pressure on the sustainable use of regional water resources.
Our results indicate that the changes in per capita WREF in the YRDUA are mainly influenced by natural resources and the ecological condition, and the explanatory power of the forest coverage rate (X11) has significantly increased (Figure 10 and Figure 11). However, the research of Song [54] shows that the total industrial output value, GDP, and the total fixed asset investment of the whole society have a significant impact on the YRDUA. This different understanding may be related to the different timespans of concern. The research form Song [54] used data collected from 2000 to 2010, while this study used some more current data from 2005 to 2022, indicating that the factors driving the spatiotemporal changes in the WREF evolve rapidly over time. In recent years, in order to achieve sustainable development, the YRDUA has vigorously promoted regional green economic development, improved water resource use efficiency, and increased forest coverage through a series of policies such as improving production technologies and strengthening environmental protection [31,55,56,57,58], which have had a significant impact on the spatiotemporal changes in the per capita WREF in this region. Therefore, future models predicting the sustainability of water resource utilization in the YRDUA should focus on the temporal dynamics of key driving factors. The detection results of the explanatory powers of the factors driving the spatiotemporal variations in the WREF in this study also provide a theoretical basis for our future research on predicting the sustainability of water resource utilization in this region.
5. Conclusions
- (1)
- The ecological condition of per capita water resources in the YRDUA is generally favorable. From 2005 to 2022, the per capita WREF generally exhibited a fluctuating downward trend. The per capita WREF is mainly agricultural water use and industrial water use. The per capita WREF of industrial water use fluctuates greatly, while the per capita WREF of domestic water use and ecological water use shows a significant upward trend. Among them, Jiangsu Province has the highest per capita WREF, while Zhejiang Province has the lowest per capita WREF.
- (2)
- The spatial changes in the per capita WREF in the YRDUA show regional differences. The spatial distribution characteristics of per capita WRECC and WREF are similar, and the use of water resources in most areas is relatively favorable. Among them, the per capita WRECC and the per capita WREF per 10,000 yuan GDP in Anhui Province decreased, the regional water resource utilization efficiency improved, and the overall situation demonstrated an ecological surplus state. Due to factors such as precipitation, the WRECC in Jiangsu Province has long been lower than the WREF. The regional water resource supply is unbalanced and is in a state of water resource ecological deficit.
- (3)
- According to the factor detection and interaction detection results from the Geodetector model, the spatiotemporal variation characteristics of the per capita WREF in the YRDUA are jointly affected by multiple factors. Among them, the top three driving factors for single-factor detection, from large to small, are industrial wastewater discharge (X9), precipitation (X1), and total per capita water resources (X2). The interaction of driving factors is greater than the effect of a single factor. Due to the different driving factors, there are obvious regional differences in the major interaction of each secondary metropolitan area.
- (4)
- The factors driving the per capita WREF of the YRDUA and its secondary metropolitan areas vary with time and space. The per capita WREF of the YRDUA is influenced by natural resources, while the influence of the ecological condition is gradually increasing. Nanjing Metropolitan Area is mainly influenced by social economy. Hangzhou Metropolitan Area, Hefei Metropolitan Area, and Suzhou–Wuxi–Changzhou Metropolitan Area have shifted from being influenced by natural resources and social economy to being influenced by technological level and ecological condition. Ningbo Metropolitan Area is mainly affected by non-natural factors, while the driving factors of Shanghai Metropolitan Area change relatively little.
The YRDUA and its satellite metropolitan areas should adhere to the principle of “Four Waters and Four Determinations” based on their specific circumstances. This principle involves aligning urban development, land use, population size, and industry with water resources. Additionally, they should adopt a water-management strategy focused on water conservation, spatial equilibrium, systematic governance, and collaboration between government and market forces. Enhancing water resource management in both temporal and spatial dimensions is crucial for advancing sustainable development. As a globally significant urban agglomeration, the Yangtze River Delta should refine its economic development model and water usage practices and foster synergy between economic growth, social progress, water resources capacity, and environmental preservation. It is imperative to deepen inter-regional cooperation for water resource management, enhance mechanisms for cross-regional collaboration on water resources, and facilitate the sustainable and protective use of water resources. These efforts will underpin the high-quality advancement of the integrated development of the YRDUA.
Author Contributions
Conceptualization, A.C. and L.C.; methodology, A.C., L.C. and P.Z.; software, A.C., L.C. and X.W.; validation, A.C., L.C. and X.W.; formal analysis, A.C., L.C. and P.Z.; investigation, A.C. and L.C.; resources, A.C.; data curation, A.C.; writing—original draft preparation, A.C. and L.C.; writing—review and editing, A.C., X.S., G.Z., Y.L., H.D. and P.Z.; project administration, A.C. and X.W.; funding acquisition, A.C. and X.W. All authors have read and agreed to the published version of the manuscript.
Funding
This research was funded by the Natural Science Key Research Project of Universities in Anhui Province (grant no. 2022AH051672), the National Natural Science Foundation of China (grant no. 42301128), the Forestry Carbon Sink Self-Raised Scientific and Technological Research Project of Forestry Bureau in Anhui Province (grant no. 0041122055), the Research Start-Up Fee Project for High-Level Talents in West Anhui University (grant no. WGKQ2021065), and the Natural Science Research Project of West Anhui University (grant no. WXZR202201).
Data Availability Statement
Data will be made available on request.
Conflicts of Interest
The authors declare no conflicts of interest.
References
- Oki, T.; Kanae, S. Global hydrological cycles and world water resources. Science 2006, 313, 1068–1072. [Google Scholar] [CrossRef]
- He, C.Y.; Liu, Z.F.; Wu, J.G.; Pan, X.H.; Fang, Z.H.; Li, J.W.; Bryan, B.A. Future global urban water scarcity and potential solutions. Nat. Commun. 2021, 12, 4667. [Google Scholar] [CrossRef]
- Graymore, M.L.M.; Sipe, N.G.; Rickson, R.E. Sustaining Human Carrying Capacity: A tool for regional sustainability assessment. Ecol. Econ. 2010, 69, 459–468. [Google Scholar] [CrossRef]
- Allan, C.A.; Xia, J.; Pahl-Wostl, C. Climate change and water security: Challenges for adaptive water management. Curr. Opin. Environ. Sustain. 2013, 5, 625–632. [Google Scholar] [CrossRef]
- Sun, Y.H.; Liu, N.N.; Shang, J.X.; Zhang, J.Y. Sustainable utilization of water resources in China: A system dynamics model. J. Clean. Prod. 2017, 142, 613–625. [Google Scholar] [CrossRef]
- Dolan, F.; Lamontagne, J.; Link, R.; Hejazi, M.; Reed, P.; Edmonds, J. Evaluating the economic impact of water scarcity in a changing world. Nat. Commun. 2021, 12, 1915. [Google Scholar] [CrossRef]
- Hu, M.H.; Yuan, J.H.; Chen, L. Water ecological footprint size, depth and its spatial pattern correlation in the “Four-city Area in Middle China”. Ecol. Indic. 2021, 133, 108387. [Google Scholar] [CrossRef]
- Tan, X.J.; Zheng, Q.Y. Dynamic analysis and forecast of water resources ecological footprint in China. Acta Ecol. Sin. 2009, 29, 3559–3568. (In Chinese) [Google Scholar]
- Li, H.; Zhao, F.; Li, C.H.; Yi, Y.J.; Bu, J.H.; Wang, X.; Liu, Q.; Shu, A.P. An improved ecological footprint method for water resources utilization assessment in the cities. Water 2020, 12, 503. [Google Scholar] [CrossRef]
- Wang, H.; Huang, J.J.; Zhou, H.; Deng, C.B.; Fang, C.L. Analysis of sustainable utilization of water resources based on the improved water resources ecological footprint model: A case study of Hubei Province, China. J. Environ. Manag. 2020, 262, 110331. [Google Scholar] [CrossRef]
- Rees, E.W. Ecological Footprints and Appropriated Carrying Capacity: What Urban Economics Leaves Out. Environ. Urban 1992, 4, 121–130. [Google Scholar] [CrossRef]
- Hoekstra, A.Y. Human appropriation of natural capital: Comparing ecological footprint and water footprint analysis. Ecol. Econ. 2009, 68, 1963–1974. [Google Scholar] [CrossRef]
- Su, Y.; Gao, W.J.; Guan, D.J.; Su, W.C. Dynamic assessment and forecast of urban water ecological footprint based on exponential smoothing analysis. J. Clean. Prod. 2018, 195, 354–364. [Google Scholar] [CrossRef]
- Deng, C.X.; Liu, Z.; Li, R.R.; Li, K. Sustainability evaluation based on a three-dimensional ecological footprint model: A case study in Hunan, China. Sustainability 2018, 10, 4498. [Google Scholar] [CrossRef]
- Hu, D.; Li, F.; Wang, B.N.; Lei, K.P.; Cao, A.X.; Wang, Z.; Yin-Hua, L. An effect analysis of changes in the composition of the water ecological footprint in Jiangyin City, China. Int. J. Sustain. Dev. World 2008, 15, 211–221. [Google Scholar] [CrossRef] [PubMed]
- Huang, L.N.; Zhang, W.X.; Jiang, C.L.; Fan, X.Q. Ecological footprint method in water resources assessment. Acta Ecol. Sin. 2008, 28, 1279–1286. (In Chinese) [Google Scholar]
- Zhang, X.Z.; Zhang, D.Y.; Zhang, Y.W. Temporal Changes and Spatial Driving Mechanisms of Water Ecological Footprints in the Context of Urbanization: Taking Three Major Urban Agglomerations in China’s Yangtze River Economic Belt as an Example. Water 2023, 15, 760. [Google Scholar] [CrossRef]
- Jiang, P.R.; Sheng, J.B.; Hu, T.S.; Mahmoud, A.; Guo, L.D.; Liu, Y.; Wu, Y.T. Spatiotemporal evolution of sustainable utilization of water resources in the Yangtze River Economic Belt based on an integrated water ecological footprint model. J. Clean. Prod. 2022, 358, 132035. [Google Scholar] [CrossRef]
- Wang, S.; Yang, F.L.; Xu, L.; Du, J. Multi-scale analysis of the water resources carrying capacity of the Liaohe Basin based on ecological footprints. J. Clean. Prod. 2013, 53, 158–166. [Google Scholar] [CrossRef]
- Chen, Y.Z.; Qiao, Y.F.; Hao, C.; Lu, H.W.; Peng, H.; Xia, J. Coordination between ecological footprint index and socioeconomic development of the urban agglomeration in the middle reaches of the Yangtze River Basin. Resour. Sci. 2022, 44, 2137–2152. (In Chinese) [Google Scholar] [CrossRef]
- Guan, D.J.; Jiang, Y.N.; Yan, L.Y.; Zhou, J.; He, X.J.; Yin, B.L.; Zhou, L.L. Calculation of ecological compensation amount in Yangtze River Basin based on ecological footprint. Acta Ecol. Sin. 2022, 42, 8169–8183. (In Chinese) [Google Scholar] [CrossRef]
- Fang, W.C.; Sun, C.F.; Guo, W.X. Analysis of influence factor of water resources ecological footprint in Dongguan based on LMDI method. J. Water Resour. Water Eng. 2015, 26, 115–117+123. (In Chinese) [Google Scholar]
- Chen, J.; Huang, K.; Yu, Y.J.; Zhang, Y. Analysis of Influencing Factors of Water Footprint Based on the STIRPAT Model: Evidence from the Beijing Agricultural Sector. Water 2016, 8, 513. [Google Scholar] [CrossRef]
- Zheng, T.; Mi, Z.J.; Xie, Y.C. Analysis of Dynamic Change and Driving Factors of Ecological Footprint of Water Resources in Yunnan Province. Pearl River 2021, 42, 7–12. (In Chinese) [Google Scholar]
- Xiaolei, M.A.; Yaqi, Q.I.A.O.; Jie, W.A.N.G.; Shixing, J.I.A.O.; Man, Z.H.A.N.G. The spatiotemporal patterns of water ecological footprints, depth, size, and influencing factors in Shaanxi Province. Arid Zone Res. 2023, 40, 469–480. (In Chinese) [Google Scholar]
- An, M.; Fan, L.J.; Huang, J.; Yang, W.J.; Wu, H.L.; Wang, X.; Khanal, R. The gap of water supply—Demand and its driving factors: From water footprint view in Huaihe River Basin. PLoS ONE 2021, 16, e0247604. [Google Scholar] [CrossRef]
- Wang, J.F.; Xu, C.D. Geodetector: Principle and prospective. Acta Geogr. Sin. 2017, 72, 116–134. (In Chinese) [Google Scholar]
- Wang, J.F.; Li, X.H.; Christakos, G.; Liao, Y.L.; Zhang, T.; Gu, X.; Zheng, X. Geographical Detectors-Based Health Risk Assessment and its Application in the Neural Tube Defects Study of the Heshun Region, China. Int. J. Geogr. Inf. Sci. 2010, 24, 107–127. [Google Scholar] [CrossRef]
- Ren, Y.; Deng, L.Y.; Zuo, S.D.; Luo, Y.J.; Shao, G.F.; Wei, X.H.; Hua, L.Z.; Yang, Y.S. Geographical modeling of spatial interaction between human activity and forest connectivity in an urban landscape of Southeast China. Landsc. Ecol. 2014, 29, 1741–1758. [Google Scholar] [CrossRef]
- Hu, H.; Lv, T.G.; Zhang, X.M.; Xie, H.L.; Fu, S.F.; Wang, L. Spatiotemporal coupling of multidimensional urbanization and resource–environment performance in the Yangtze River Delta urban agglomeration of China. Phys. Chem. Earth 2023, 129, 103360. [Google Scholar] [CrossRef]
- Hu, H.; Yan, K.G.; Shi, Y.; Lv, T.G.; Zhang, X.M.; Wang, X.Y. Decrypting resilience: The spatiotemporal evolution and driving factors of ecological resilience in the Yangtze River Delta Urban Agglomeration. Environ. Impact Assess. Rev. 2024, 106, 107540. [Google Scholar] [CrossRef]
- Chen, Y.Z.; He, P.M.; Zhang, S.S.; Liu, Z.T.; Peng, H. Green development threshold effect and its spatial heterogeneity from the perspective of water resources utilization: A case study of three urban agglomerations in the Yangtze River Economic Belt. J. Water Resour. Water Eng. 2025, 36, 105–117. (In Chinese) [Google Scholar]
- Świąder, M.; Lin, D.; Szewrański, S.; Kazak, J.K.; Iha, K.; Hoof, J.V.; Belčáková, I.; Altiok, S. The application of ecological footprint and biocapacity for environmental carrying capacity assessment: A new approach for European cities. Environ. Sci. Policy 2020, 105, 56–74. [Google Scholar] [CrossRef]
- Yang, Y.F.; Wang, H.R.; Li, Y.Y.; Zhang, L.; Zhao, Y. New green development indicator of water resources system based on an improved water resources ecological footprint and its application. Ecol. Indic. 2023, 148, 110115. [Google Scholar] [CrossRef]
- Zhu, G.L.; Zhao, C.Z.; Zhu, W.H.; Tong, S.Z. Evaluation of sustainable water resources utilization in Jilin Province based on the ecological footprint model. J. China Agric. Univ. 2020, 25, 131–143. (In Chinese) [Google Scholar]
- Li, Y.G.; Yuan, Y.L.; Li, Z.C.; Guo, X. Evaluation of sustainable utilization of water resources in Henan Province based on spatial-temporal variation of energy water ecological footprint. Yellow River 2022, 44, 100–104+162. (In Chinese) [Google Scholar]
- Long, X.R.; Lin, H.; An, X.X.; Chen, S.D.; Qi, S.Y.; Zhang, M. Evaluation and analysis of ecosystem service value based on land use/cover change in Dongting Lake wetland. Ecol. Indic. 2022, 136, 108619. [Google Scholar] [CrossRef]
- Tao, Q.J.; Guo, C.X. Quantitative evaluation and influential factor of water resources ecological footprint in Guangdong Province. Water Resour. Prot. 2018, 34, 28–33. (In Chinese) [Google Scholar]
- Zhu, Z.R.; Zhan, Y.Q.; Cao, Y.Q.; Jiang, J.C. Spatio-temporal Characteristics and Influencing Factors of Water Resources Ecological Footprint in Liaoning Province. J. Chang. River Sci. Res. Inst. 2022, 39, 29–34. (In Chinese) [Google Scholar]
- Xiong, H.B.; Zhou, Y.S. An Analysis of Water Resources Pressure and Driving Forces in Anhui Province Based on LMDI-Three-Dimensional Water Footprint Model. Water Soil Conser Bull 2019, 39, 194–203. (In Chinese) [Google Scholar]
- Wu, Z.N.; Chen, X.Y.; Di, D.Y. Evaluation of Regional Water Ecological Economic System Sustainability Based on Emergy Water Ecological Footprint Theory—Taking the Yellow River Basin as an Example. Water 2023, 15, 3137. [Google Scholar] [CrossRef]
- Shao, J.; Lu, M.S.; Du, T.; Wang, Z.X. Water Resources Ecological Footprint in Yangtze River Basin and Its Driving Factors. J. Chang. River Sci. Res. Inst. 2021, 38, 19–24. (In Chinese) [Google Scholar]
- Veldkamp, T.; Wada, Y.; Aerts, J.; Döll, P.; Gosling, S.N.; Liu, J.; Masaki, Y.; Oki, T.; Ostberg, S.; Pokhrel, Y.; et al. Water scarcity hotspots travel downstream due to human interventions in the 20th and 21st century. Nat. Commun. 2017, 8, 15697. [Google Scholar] [CrossRef]
- Jones, E.R.; Bierkens, M.F.P.; van Vliet, M.T.H. Current and future global water scarcity intensifies when accounting for surface water quality. Nat. Clim. Chang. 2024, 14, 629–635. [Google Scholar] [CrossRef]
- Niazi, H.; Wild, T.B.; Turner, S.W.D.; Graham, N.T.; Hejazi, M.; Msangi, S.; Kim, S.; Lamontagne, J.R.; Zhao, M.Q. Global peak water limit of future groundwater withdrawals. Nat. Sustain. 2024, 7, 413–422. [Google Scholar] [CrossRef]
- Rosa, L.; Sangiorgio, M. Global water gaps under future warming levels. Nat. Commun. 2025, 16, 1192. [Google Scholar] [CrossRef]
- Wu, R.; Yu, G.; Cao, Y.M. The impact of industrial structural transformation in the Yangtze River economic belt on the trade-offs and synergies between urbanization and carbon balance. Ecol. Indic. 2025, 171, 113165. [Google Scholar] [CrossRef]
- Tong, J.X.; Zhao, C.Y. Environmental regulation and utilization efficiency of water resources based on urban agglomerations in Yangtze River Delta. J. Econ. Water Resour. 2021, 39, 1–7. (In Chinese) [Google Scholar]
- Zhou, F.; Qiu, W.G. Evaluation on sustainable utilization degree of water resources in Shanghai from 2013 to 2019. Yellow River 2022, 44, 51–53. (In Chinese) [Google Scholar]
- Zhu, M.M.; Wang, J.G.; Zhang, J.; Xing, Z.C. The impact of virtual water trade on urban water scarcity: A nested MRIO analysis of Yangtze River Delta cities in China. J. Clean. Prod. 2022, 381, 135165. [Google Scholar] [CrossRef]
- Zhu, Z.Y.; Pan, T.T.; Yang, M.F.; Zhu, X.D.; Li, Z.J.; Li, H.Q. Changes of Water Footprint in Yangtze River Economic Belt under the Background of Water Ecological Civilization Construction. J. Chang. River Sci. Res. Inst. 2021, 38, 160–166. (In Chinese) [Google Scholar]
- Liu, Y.W.; Yuan, L. Evolution of water-use efficiency in the Yangtze River Economic Belt based on national strategies and water environment treatment. Ecol. Inform. 2022, 69, 101642. [Google Scholar] [CrossRef]
- Hou, C.X. Ecological Footprint Assessment and Sustainable Development of Water Resources in Jiangsu Province. Master’s Dissertation, Southwest University, Chongqing, China, 2021. (In Chinese). [Google Scholar]
- Song, X.J. Study on Temporal-Spatial Patterns and Influencing Factors Ecological Deficit or Ecological Surplus of Yangtze River Delta Urban Agglomeration. Master’s Dissertation, East China Normal University, Shanghai, China, 2017. (In Chinese). [Google Scholar]
- Geng, C.X.; Cui, Z.Y. Analysis of spatial heterogeneity and driving factors of capital allocation efficiency in energy conservation and environmental protection industry under environmental regulation. Energy Policy 2020, 137, 111081. [Google Scholar] [CrossRef]
- Sun, F.Y.; Mejia, A.; Zeng, P.; Che, Y. Projecting meteorological, hydrological and agricultural droughts for the Yangtze River basin. Sci. Total Environ. 2019, 696, 134076. [Google Scholar] [CrossRef]
- Yang, Y.Y.; Lu, H.W.; Liang, D.Z.; Chen, Y.Z.; Tian, P.P.; Xia, J.; Wang, H.; Lei, X.H. Ecological sustainability and its driving factor of urban agglomerations in the Yangtze River Economic Belt based on three-dimensional ecological footprint analysis. J. Clean. Prod. 2022, 330, 129802. [Google Scholar] [CrossRef]
- Lu, W.N.; Sarkar, A.; Hou, M.Y.; Liu, W.X.; Guo, X.Y.; Zhao, K.; Zhao, M.J. The Impacts of Urbanization to improve agriculture water use efficiency—An empirical analysis based on spatial perspective of panel data of 30 provinces of China. Land 2022, 11, 80. [Google Scholar] [CrossRef]
Disclaimer/Publisher’s Note: The statements, opinions and data contained in all publications are solely those of the individual author(s) and contributor(s) and not of MDPI and/or the editor(s). MDPI and/or the editor(s) disclaim responsibility for any injury to people or property resulting from any ideas, methods, instructions or products referred to in the content. |
© 2025 by the authors. Licensee MDPI, Basel, Switzerland. This article is an open access article distributed under the terms and conditions of the Creative Commons Attribution (CC BY) license (https://creativecommons.org/licenses/by/4.0/).