1. Introduction
Altered hydrological flows from urbanizing watersheds can cause a range of harmful effects on aquatic life, which may manifest into what is commonly referred to as the urban stream syndrome [
1,
2,
3]. Urban stream syndrome describes the effects of significant and unmitigated urbanization on stream systems [
3]. The common symptoms include change in flow regime, erosion and sedimentation, and associated impacts on pollutant loading and habitat health [
4,
5]. In particular, bank erosion may contribute a significant fraction of total phosphorous (P) loads [
6,
7].
Regime conditions refer to a state of dynamic stability where energy expenditure by flowing water is at a minimum, erosive forces of the flowing water are in balance with substrate resistance to erosion, and the net transport of sediment into and out of the reach approaches zero [
8]. In watercourses impacted by urban development, the distribution of flow increases and may cause the erosive forces of the flowing water to become out of balance with the channel geometry and substrate resistance to erosion. In a previous study, we assembled a database of channel geometry and sediment size for in-regime rivers and used machine learning to develop a model of regime conditions based on stream power [
8]. The specific stream power (stream power per unit channel width) model was found to be a reliable indicator of stream reaches both in and out-of-regime conditions [
8]. In a subsequent study, flow distribution and contaminant loading in the Southern Ontario, Canada, study area were investigated and found to be well correlated with the level of urbanization in the contributing watershed [
9].
Urban stormwater management systems can partially mitigate the adverse effects of urbanization on streamflow and sediment regimes [
3]. Systems prioritizing storage, infiltration, and evapotranspiration should be included to mitigate the effects of urbanization on the water budget and form determining peak flows. Efforts to reduce the component of the annual sediment load mobilized by larger flood flows, streambed and bank stabilization, and stormwater management systems that significantly control peak flows during large storm events will be most beneficial.
Low-impact development (LID) green infrastructure is increasingly utilized in urban stormwater management and has proven effective in both water quality and peak flow control [
10,
11,
12,
13,
14,
15,
16]. LIDs are designed to mimic natural hydrologic processes and address hydrologic symptoms of the urban stream syndrome [
17]. In rural areas in watersheds such as agricultural farmlands, several studies report the effectiveness of agricultural best management practices (BMPs) such as no-tillage, buffer strips, and cover crops in stream water quality improvements [
18,
19,
20,
21,
22].
In recent stormwater management systems, LID and green infrastructure practices are often combined with agricultural BMPs and stream restoration projects [
23,
24,
25]. However, in highly degraded streams, bank stabilization has the largest potentially beneficial effect in improving stream water quality [
26]. Customized solutions show better results when selecting an approach for urban stream management [
27]. Further research is required to identify cost-effective BMPs to restore the ecosystem’s health in urbanizing streams.
Aquafor Beech Ltd. [
28] completed a review of published total phosphorus (TP) concentrations in streambank materials. After screening data and limiting it to North American studies, they found that “the arithmetic average of total phosphorus concentration was approximately 400 mg of Total Phosphorus (TP) per kg of sediment [
26]”. This value can be used as a representative estimate of TP content in bank materials to estimate potential TP load that may be prevented with stream restoration work. However, if a stream restoration project is deemed worthy of phosphorus (P) offset credits, site-specific sampling of bank materials should be completed to improve the estimate of TP content before finalizing the dollar amount of credit to be awarded.
Recent studies have emphasized combining interrelated river functions when calculating stream restoration credits [
29,
30]. The Chesapeake Bay Stormwater Network recently reviewed and provided consensus recommendations for assigning stream restoration credits through an existing Prevented Sediment Protocol [
31]. Credits given under the Prevented Sediment Protocol recognize that stream restoration can secure sediment and phosphorus at the source and prevent it from contributing to phosphorus loading downstream. Recent studies [
29,
30,
31,
32,
33,
34] have recommended that restoration credits seek a balance between sediment entrance and exit by acknowledging the combination of hydrologic contribution and bed and bank erosion to nutrient load. Conversely, stream restoration projects only built for infrastructure protection should not be eligible [
33]. In addition, past research indicates that stream restoration projects are more effective at the watershed scale rather than the reach scale [
35,
36].
Several studies have identified stream corridor erosion as a significant source of sediment and P loads; however, a method to assess the magnitude of P loads using readily available data remains a knowledge gap [
29,
30,
31,
32,
33,
34,
35,
36]. Identifying a general relationship between stream channel stability or regime conditions and sediment and phosphorous load, based on readily available data, represents an additional knowledge gap. A readily applicable method to assess the relative role of stream corridor sources of sediment and P loads, compared with upland sources, including wash-off from impervious urban areas and sediment delivery from agricultural land, also represents a knowledge gap. In addition, a method to assess the relative benefits of common mitigation measures, including stream restoration, LID, and BMPs, on reducing total P load represents a knowledge gap.
Therefore, the main goal of this study is to develop a more accurate methodology to quantify the relative contribution of stream bed and bank erosion compared with the upland watershed sources of sediments and phosphorous loads. The sediment and phosphorous loads source contribution allocation results are then used in a catchment scale cost–benefit analysis of available mitigation measures, including BMPs for the rural areas of the watershed, green stormwater management infrastructures (LIDs) for the urban areas, and stream restoration projects for the degraded portions of the stream network in urbanizing watersheds.
2. Materials and Methods
This section provides an overview of the data sources and methods used to assess sediment and P loading, mitigation measures, including stream restoration, and a cost–benefit analysis. The results of this analysis are discussed in
Section 3.
2.1. Data Sources
Tannery Creek is a tributary of the East Holland River, which flows to Lake Simcoe near Holland Landing, Ontario. Tannery Creek drains an approximately 40 km
2 watershed in an urbanizing area with a history of agricultural land use. In this study, we optimized mitigation alternatives to reduce sediment and phosphorous loads from Tannery Creek and its watershed. The Tannery Creek Watershed is shown in
Figure 1.
The Tannery Creek watershed has a history of agricultural land use, with significant urban development over the last few decades, particularly in Aurora. The Ontario Watershed Information Tool (OWIT) was used to delineate catchment areas contributing to Tannery Creek tributaries, find incremental and total upstream catchment areas contributing to each numbered reach, and assess the percentage of the incremental catchment area with urban or rural land use from the Ontario Land Cover layer. The incremental catchment area is the local area contributing to the study reach, not including areas contributing to upstream tributaries, while the total upstream catchment area includes both the local catchment and the catchment contributing to all upstream tributaries of the local reach. The results are illustrated in
Figure 1 and summarized in
Table 1.
Percentage impervious cover (PIC) for every reach was estimated using OWIT urban land use areas for the Tannery Creek watershed. Using PIC and the incremental catchment area, the area of impervious cover in each incremental catchment and the total contributing upstream catchment were calculated. Typical performance data for various common Low-impact development (LID) features were sourced from the Sustainable Technologies Evaluation Program (STEP) Low-Impact Development Stormwater Management Planning and Design Guide [
37]. Three common LID features were considered in this study, including infiltration trenches, bioretention cells, and permeable pavement. Infiltration trenches are designed to capture stormwater runoff and allow it to infiltrate into the ground over an extended period of time [
37].
Bioretention cells are vegetated stormwater storage facilities that are excavated into the ground and filled with filter media capable of supporting vegetation [
37]. Bioretention cells may serve to detain and filter stormwater prior to discharge or retain and infiltrate stormwater, depending on the conductivity of the surrounding soil. Permeable pavement is porous to allow precipitation to infiltrate through the pavement and into an underlying storage area, where it may be detained and discharged or retained and infiltrated into the surrounding soil over an extended period of time [
37]. These features are commonly used to intercept and treat stormwater from impervious areas.
The cost of implementing LID measures varies significantly depending on the type of LID, whether the LIDs are implemented as part of a new development or retrofit, the planned lifetime of the LID and the development it services, the existing level of urbanization of the development area, real estate costs, topography, surficial soils and depth to the groundwater table. However, representative lifecycle costs for various LID measures were required to compare the costs and benefits of common LIDs with stream restoration costs. A range of cost data was reviewed and used to identify representative LID life cycle unit costs, as summarized in
Table 1 [
38,
39,
40,
41].
Table 1.
Summary table for cost and performance of various LID features [
38,
39,
40,
41].
Table 1.
Summary table for cost and performance of various LID features [
38,
39,
40,
41].
| LID 1 SWM 2 Practice | Infiltration Trench | Bioretention Cells | Permeable Pavement |
|---|
| Ratio of DA 3 to Treatment Area (range) | 5:1 to 20:1 | 5:1 to 15:1 | 1:1 |
| Ratio of DA 3 to Treatment Area (typical) | 20:1 | 15:1 | 1:1 |
| Underdrain | Yes | No | No |
| STEP 5 | Life Expectancy (years) | 25 | 25 | 25 |
| Lifecycle Cost (Cdn $/m2) | $670 | $433 | $201 |
| Chesapeake Bay Area | Life Expectancy (years) | 23 | 23 | 23 |
| Life Cycle Cost (Cdn $/m2) 4 | $529 | $440 | $274 |
| Adopted Life Cycle Cost (Cdn$/m2) 6 | $529 | $440 | $274 |
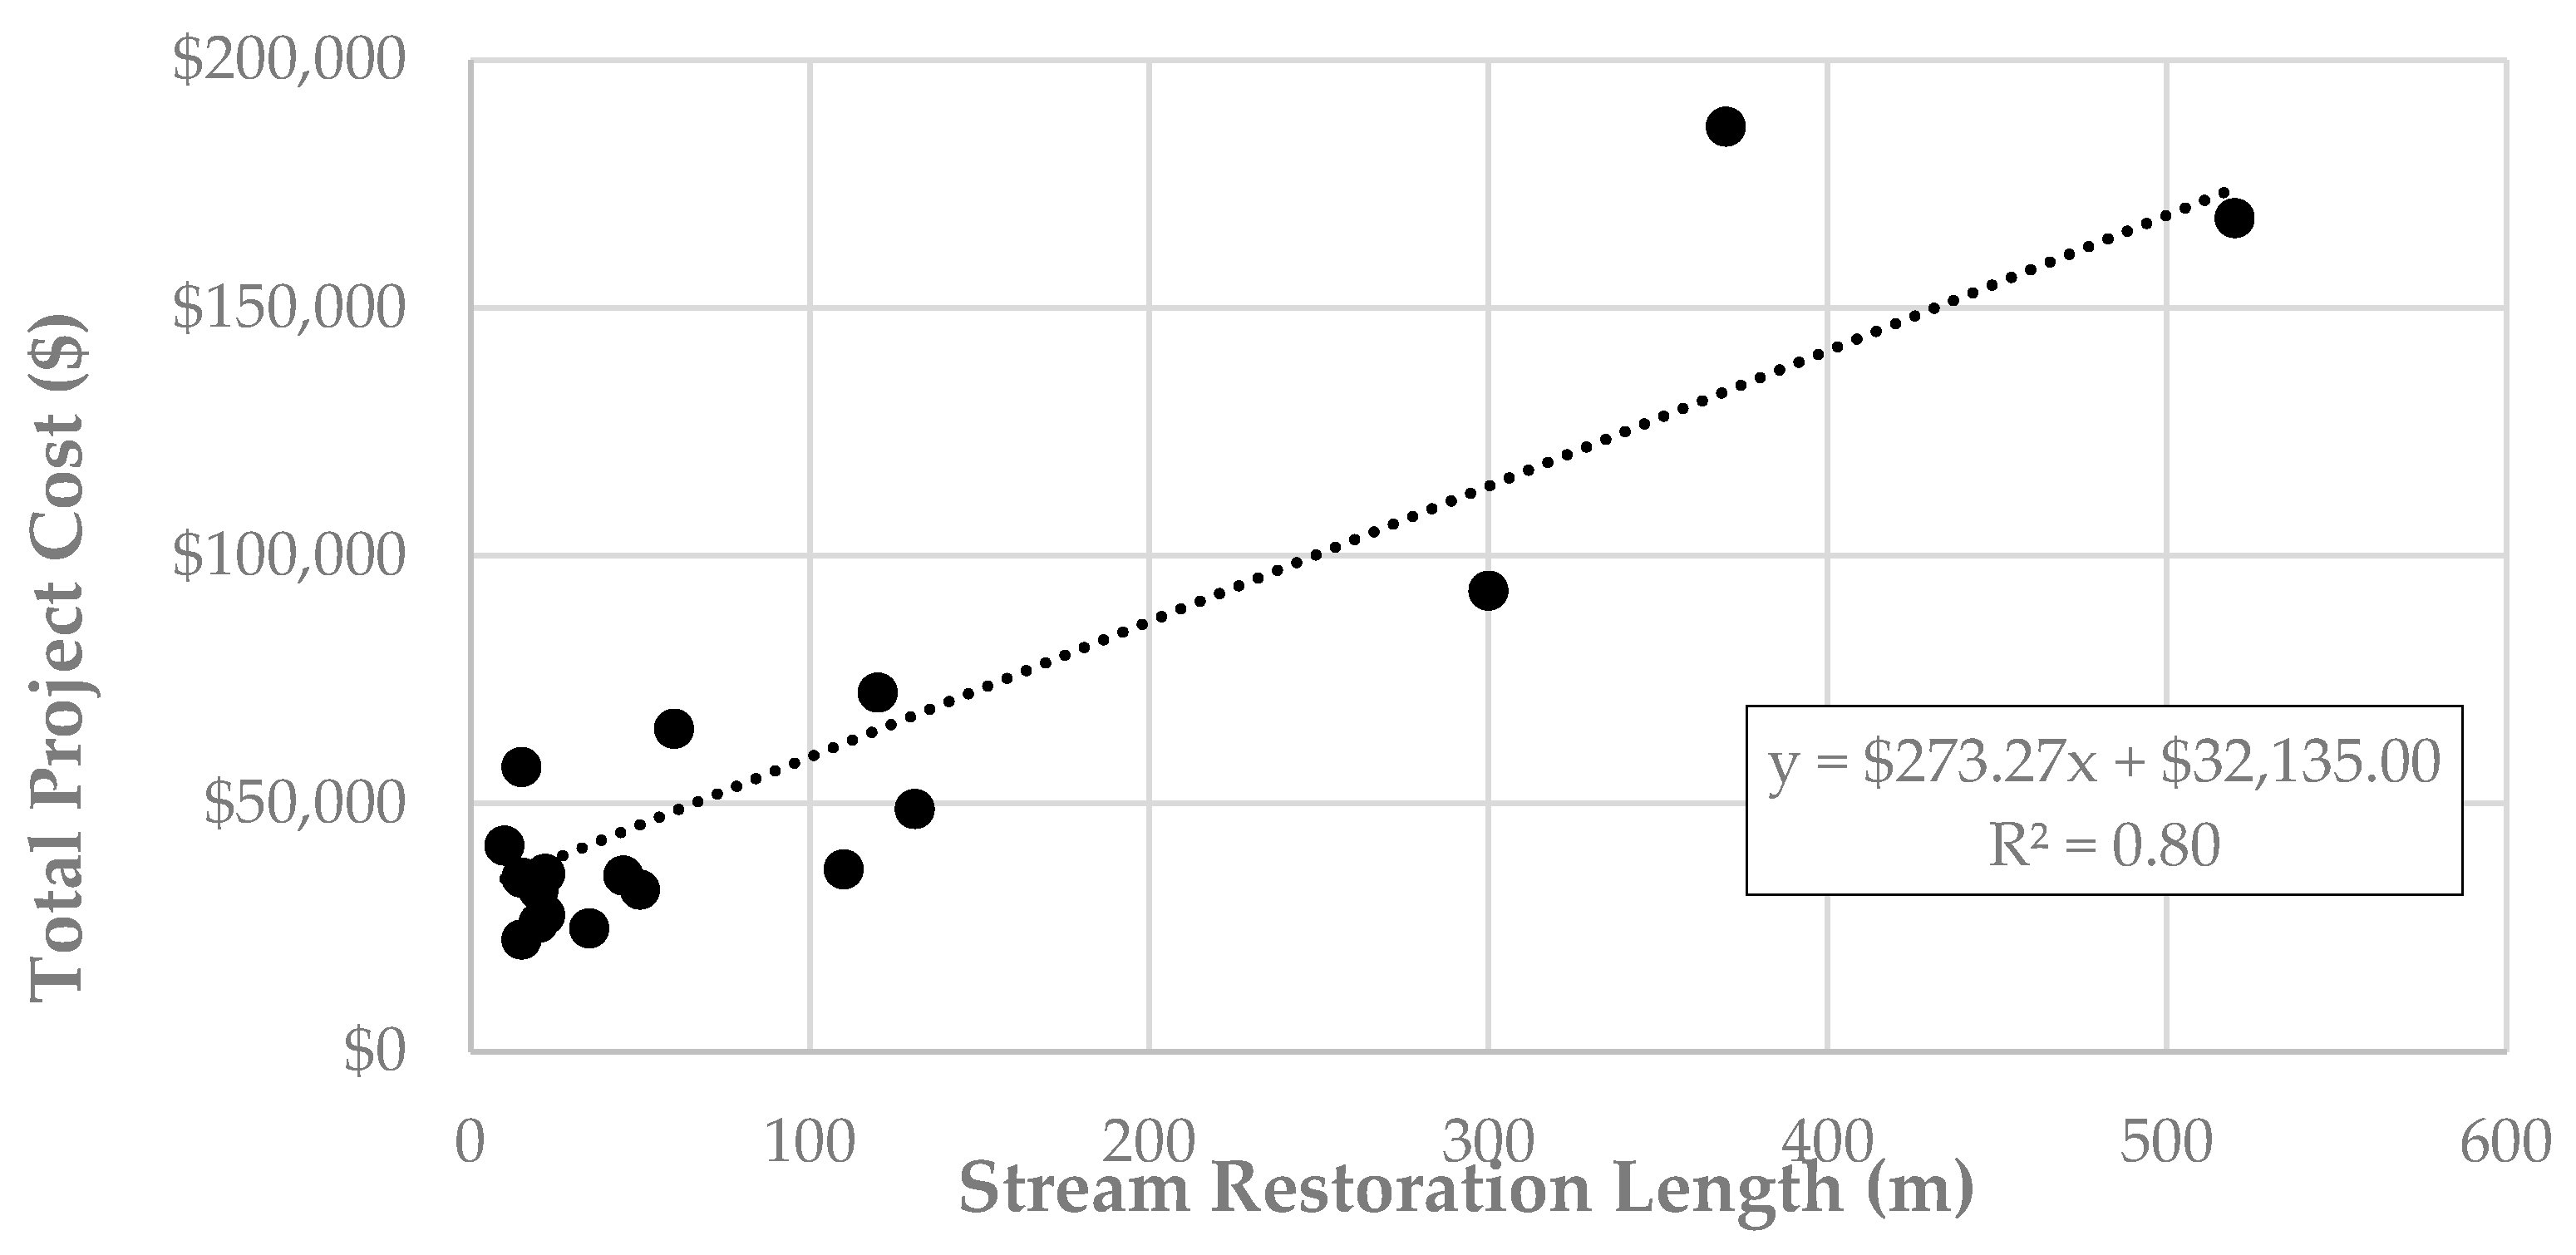
Stream restoration cost may vary significantly based on several factors: the length of the channel restored, the ease of access to the channel, the level of urban development and encroachment on the channel, the cost of negotiating and restoring access easement, topography, type of native and introduced substrate materials, and the design concept employed. For this study, representative stream restoration costs were obtained from Lake Simcoe Region Conservation Authority (LSRCA) records of stream restoration projects in the East Holland River watershed (
Figure 2), which Tannery Creek is a part of, showing a linear increase in project cost stream restoration length.
Figure 2 shows a linear trend between the stream restoration length and total project cost, with an initial cost of about
$32,000 (to cover the equipment, design, permitting, and mobilization) and about
$274 per meter length of the stream restoration project. Data for
Figure 2 were collected by the Lake Simcoe Region Conservation Authority (LSRCA) and provided to the authors for use in this study. These data include records of total costs to complete stream restoration projects in the Holland River watershed (which is within the Lake Simcoe Region Conservation Authority Jurisdiction).
Variability in these data is attributed to a range of project-specific factors, including ownership of the land, site access and mobilization costs, the required level of engineering design, and whether other infrastructure was affected by the restoration works. These costs are for past projects, and the inflation needs to be considered to estimate the cost for future projects. However, in this study, we are interested in the relative cost of stream restoration, compared with the cost of LIDs for the upland watershed and the cost of agricultural best management practices (BMPs) for a given snapshot in time.
2.2. Total Sediment and Phosphorus Loads
Total load estimates were calculated using the results of our recent studies [
8,
9], which were developed from fieldwork in the watershed as well as historic hydrometric data from the Water Survey of Canada and LSRCA, and water quality data from the Ontario Provincial Water Quality Monitoring Network. Observed total loads were found for six monitored watersheds within the study area, including both early and later stages of urbanization, resulting in 12 observed sets of observed loads and corresponding watershed land use distributions [
9]. Previous studies have established the correlation between loading and contributing areas of specific land uses [
42,
43,
44,
45,
46,
47,
48,
49,
50,
51,
52]. MacKenzie et al. also showed that total phosphorous load strongly correlates with suspended sediment load in the study area [
8,
9]. These observed data and established correlations with land use in the contributing watershed were used to develop linear relationships between land use and sediment loading at the outlet of the catchment areas included in the current study, as discussed in
Section 3.4.
The estimated annual average P loads for Lake Simcoe is approximately 72 t/y, of which about 41 t/y is delivered to Lake Simcoe from tributaries [
8,
9]. The East Holland River drains approximately 15% of the total tributary load, indicating an average annual sediment load of approximately 2000 t/y (or 32 kg/d/km
2) and P load of approximately 4.5 t/yr (or 0.07 kg P/d/km
2). Total sediment and phosphorus load estimates for Tannery Creek tributaries were allocated based on the catchment area and PIC [
8,
9].
2.3. Upland Sediment Sources
Comparison between rural and urban area sediment loads reveals rural areas, with limited over-land-flow connectivity, have lower sediment loads than developed areas with higher levels of imperviousness. As imperviousness limits the availability of exposed soil, sources of sediment load move from upland areas to the stream corridor, destabilizing stream channels and causing erosion of the stream banks and bed [
39,
40].
2.4. Estimating Riverbank Sources
The specific stream power is the work of flowing water per unit area of the channel per unit time and is calculated using the following equation,
where
ω (W/m
2) is the specific stream power,
γ is the unit weight of water (kN/m
3),
S is the slope of the channel,
Q2 (m
3/s) is the 2-yr return period flood flow, typically consistent with the bankfull discharge, and
T (m) is the top width of the main channel. In previous studies, we developed a model for regime conditions using specific stream power [
40]. The regime-specific stream power model was developed based on a large database of previously published regime channel geometry, flow, and substrate data using machine learning and considered channel slope, width, depth, substrate median particle size, and the 2-yr return period peak flow (
Q2) [
40]. The model was tested against a range of observed stream reaches in the study area and found to identify reaches that were out-of-regime reliably [
40]. Thayer et al. [
41] discussed the effects of setting on the relative sensitivity of stream geometry parameters and noted that slope can only be considered a dependent variable on a geological time scale and is often not sensitive to change in shorter time scales typically associated with urbanization in stream power limited watercourses [
41].
MacKenzie et al. [
8,
9] provided a discussion of the relative sensitivity of change in the key regime channel parameters and, based on typical conditions in the study area, identified flow as the most sensitive variable to urbanization-induced changes, followed by width and substrate size, then depth and lastly slope. The regime-specific stream power model provides a way to evaluate the stability of urbanizing watersheds and was used to evaluate regime-specific stream power for the Tannery Creek watershed.
Total stream corridor sediment sources were informed by data from the International Reference Group On Great Lakes Pollution From Land Use Activities (PLUARG) for stream bank erosion [
53]. MacKenzie et al. [
8,
9] demonstrated the effects of percent impervious cover (PIC) on net sediment and phosphorous loads in urbanizing watersheds. Increasing PIC was shown to cause increases in both the flow duration curve and sediment rating curve, which can result in increases in sediment and phosphorous loading.
We defined regime conditions based on the ratio of the specific stream power (ω) during the
Q2 event to the regime-specific stream power (ώ) (Equation (2)), following the methodology we developed in [
8,
9]. Channel reaches with ω/ώ ≈ 1.0 were deemed to be within the regime, while reaches with ω/ώ ≥ 1.5 were out of the regime, and reaches that were in between values with 1.0 ≤ ω/ώ ≤ 1.5 were in transition. Out-of-regime channel density (ORD) is defined as the fraction of total stream length in a catchment that is out-of-regime as defined by Equation (2).
Identifying out-of-regime channel reaches using Equation (2) requires knowledge of the existing channel geometry, slope and substrate size, as well as the 2-yr return period flow under existing conditions and estimated pre-development and future conditions. Hydraulic modeling was used to evaluate specific stream power under these conditions for comparison of the regime-specific stream power for each reach.
2.5. Hydraulic Modelling
The US Army Corps of Engineers, Hydrologic Engineering Center’s River Analysis System (HEC-RAS) model was constructed for Tannery Creek and its tributaries to simulate streamflow and water level and validated against observed water level data. A range of estimated 2-yr return period flows spanning historic, current, and potential future levels of impervious cover were used to model hydraulic conditions in Tannery Creek.
Staff gauges equipped with logging water level transducers were installed at seven (7) locations in the Tannery Creek watershed to collect water level data from 2 September to 21 November 2021. In addition, a logging barometric pressure transducer (barologger) was installed at the same location as Staff Gauge No. 7 (SG7) to allow the collected water level data to be corrected for atmospheric pressure variations.
During the September to November 2022 monitoring period, one significant peak flow event on 13 October 2022 was used to validate the hydraulic model. The peak flows observed at LSRCA Tannery Creek at St. Andrew’s College and Water Survey of Canada’s Holland River East Branch at Holland Landing were prorated, based on drainage area, and used to populate flow change locations in the hydraulic model to run steady state simulations.
The modeled water level results from the steady state simulation were compared with the observed peak water levels at the staff gauge, and Manning’s coefficients were adjusted in the model until the modeled flow depths reasonably approximated observed peak water levels during the 13 October 2022 event.
In addition to the model of current conditions in Tannery Creek, simulations of historical pre-development conditions and future fully built-out conditions were also completed. The 2-yr return period flows (Q2) for the pre-development and future conditions scenarios were estimated using a developed relationship between Q2 and PIC in the upstream catchment.
2.6. Mitigation Measures
The mitigation measures considered for this study included LID, BMPs, and stream restoration. LID measures considered in the study included infiltration trenches and bioretention facilities. Other LIDs, such as green roofs and permeable pavement, were initially considered but ultimately not included because of the relatively high cost and small treated area, especially when considered as retrofit opportunities. These measures should still be considered for future greenfield development, in addition to infiltration trenches and bioretention facilities. Further discussion of potential mitigation measures in the Tannery Creek setting is included in
Section 3.5,
Section 3.6 and
Section 3.7.
2.7. Cost–Benefit Analysis
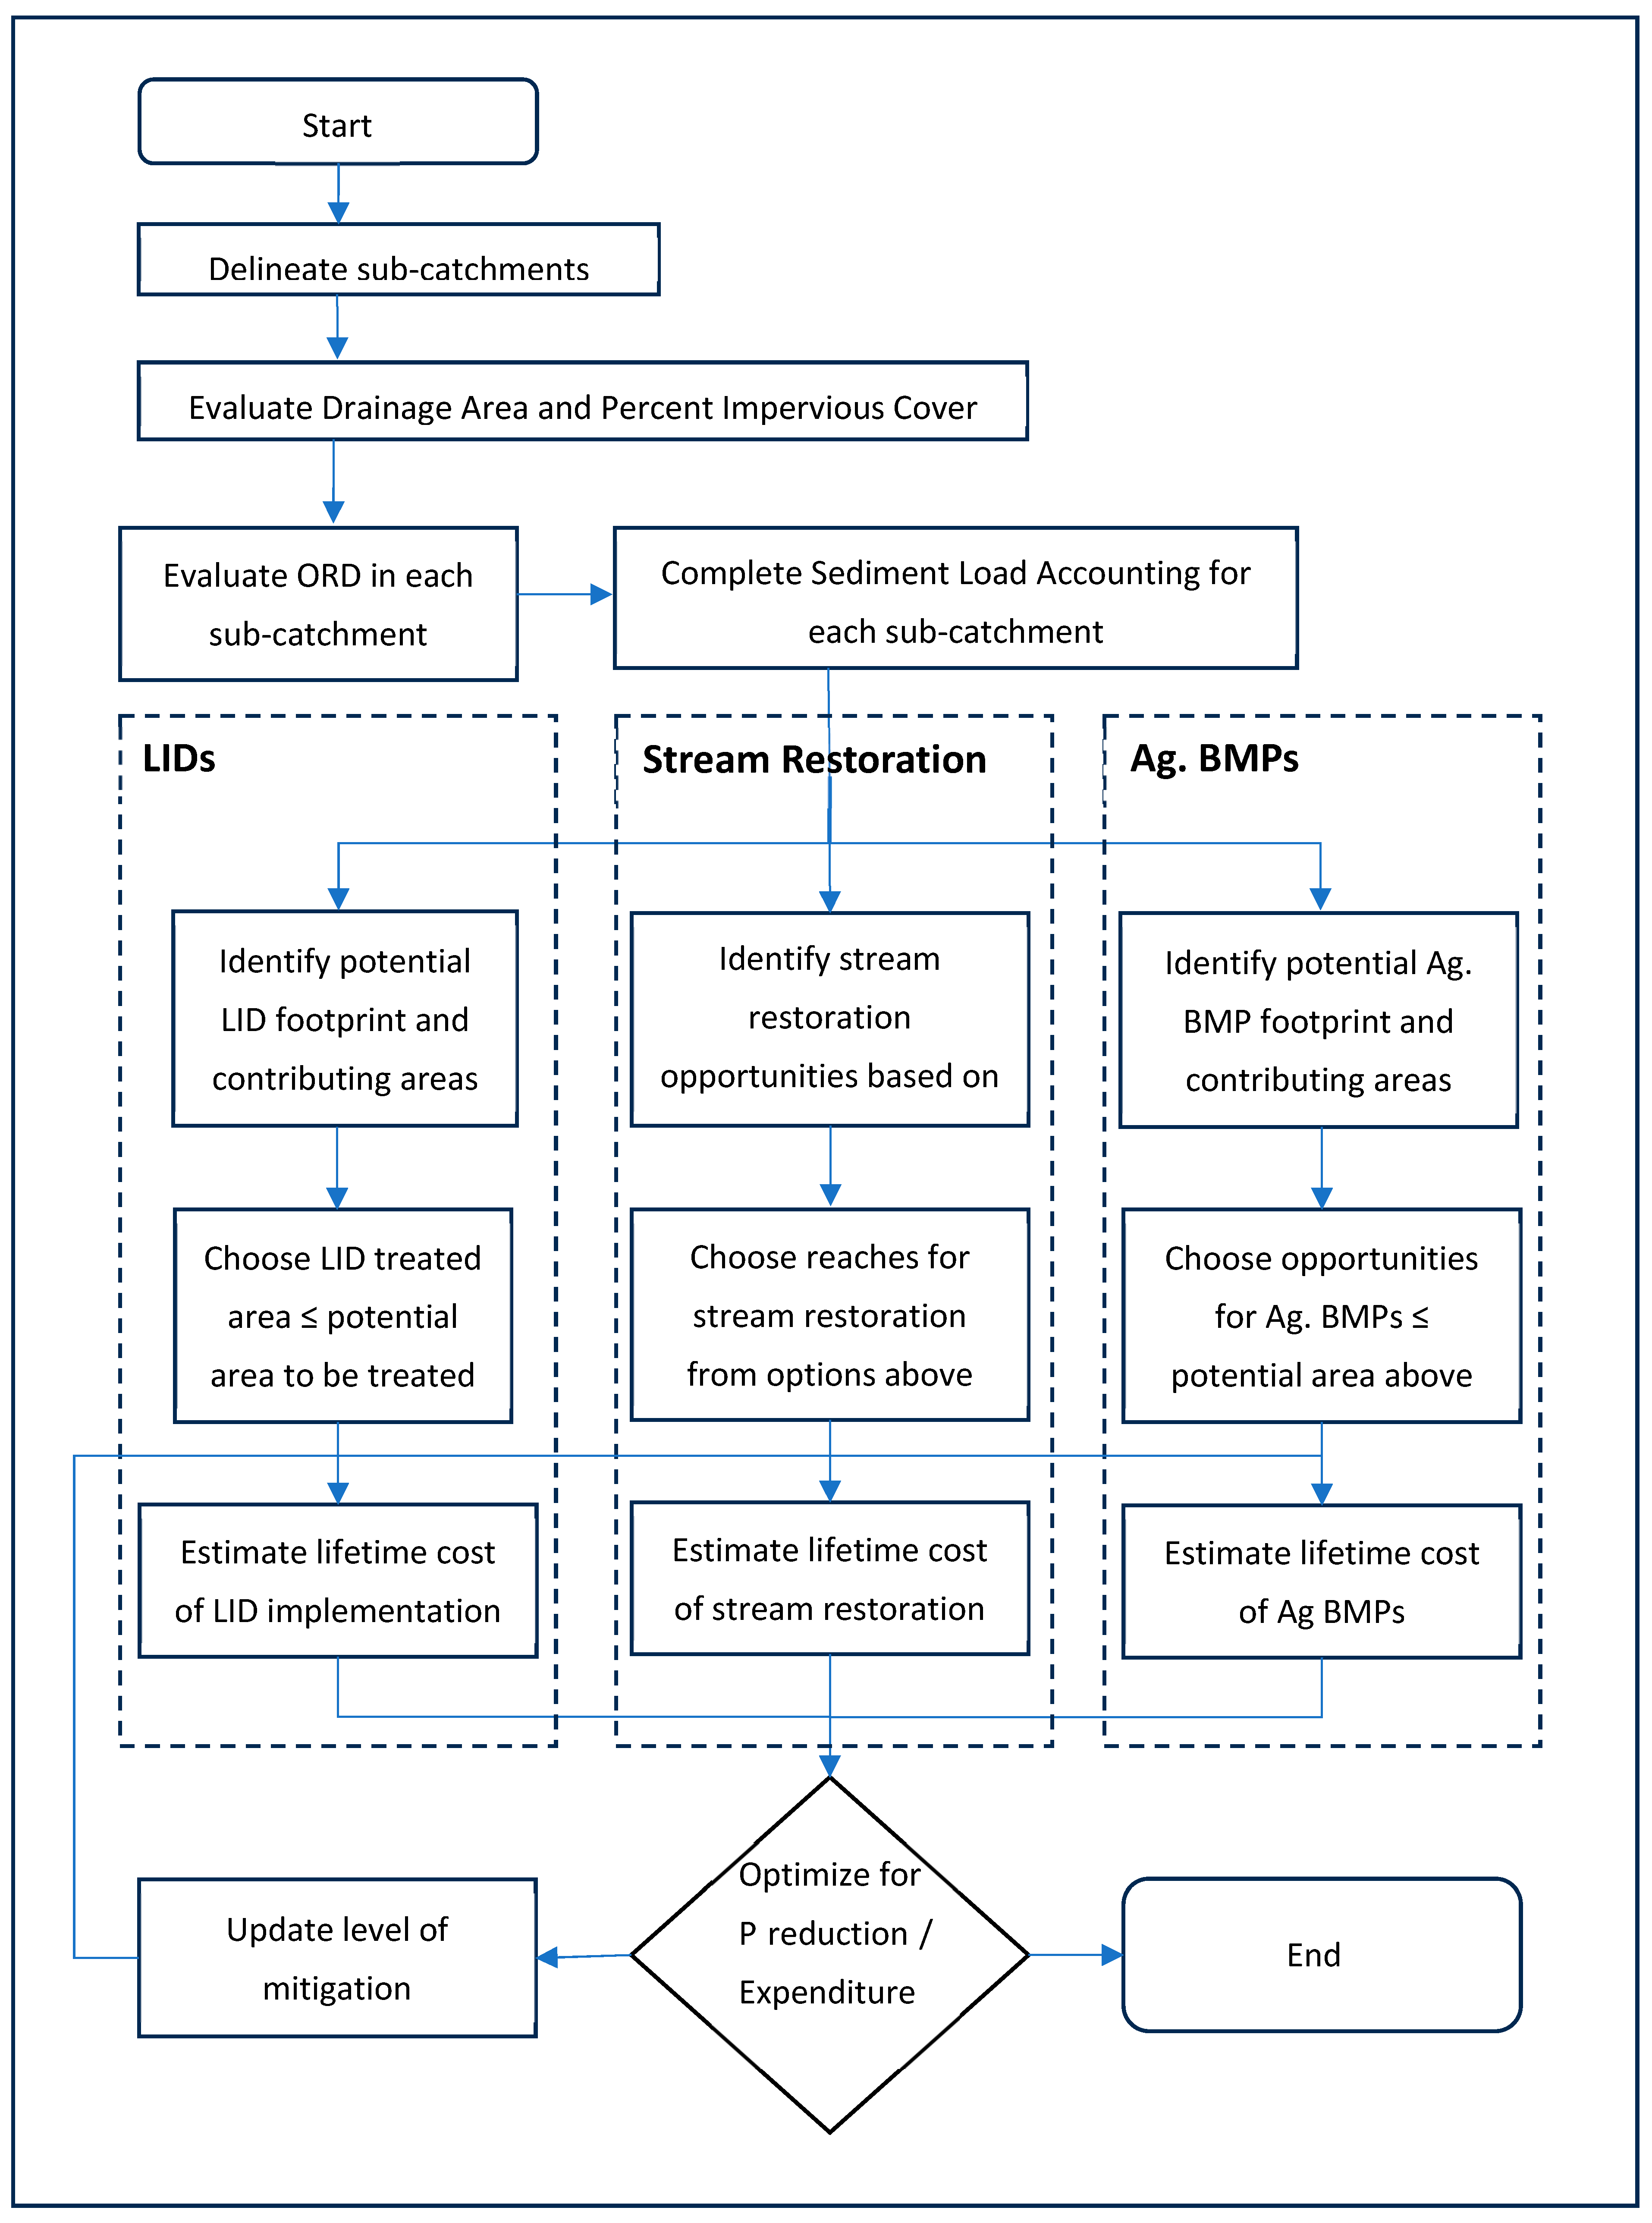
A cost–benefit analysis focused on P load reduction was completed for Tannery Creek considering the above mitigation measures. The objective of the cost–benefit analysis was to explore each mitigation measure’s relative costs and benefits. The watershed-scale approach of this study will help to quantify the required funding to obtain the desired level of P load reduction. The results are specific to Tannery Creek and typical support funding mechanisms in place in 2023 but demonstrate a method that could be applied to mitigation planning in other study areas. The approach to mitigation and cost optimization is illustrated in
Figure 3 and discussed further in
Section 3.4,
Section 3.5,
Section 3.6,
Section 3.7 and
Section 3.8.
3. Results and Discussions
The following sections provide a discussion of the results of this study, including the catchment characteristics, streambank erosion sources, hydraulic modeling, and sediment load accounting for Tannery Creek. The results of the cost-optimized plan for mitigating sediment and phosphorous loads using low-impact development (LID), stream restoration, and agricultural best management practices (BMPs) in the Tannery Creek watershed are also presented.
3.1. Catchment Characteristics
Tannery Creek catchment and sub-catchment characteristics were identified using a combination of site knowledge gained in the field, GIS analysis, Google Earth review, and spatial data available from the Lake Simcoe Region Conservation Authority (LSRCA) spatial data portal. Catchment areas were delineated using the Ontario Watershed Information Tool (OWIT) and calculated from urban area land use data. Tannery Creek sub-catchments are shown in
Figure 1 and summarized in
Table 2.
For some variables in
Table 2, both an incremental (for the sub-catchment) and total upstream value are included as upland processes typically scale with incremental catchment area and land use characteristics. In contrast, stream corridor processes usually scale with the total upstream contributing area and land use characteristics.
3.2. Stream Bank Erosion Sources
Urbanization-induced changes to the hydrological flow regime include a significant increase in peak flow and total runoff volume during storm events. When peak flows increase, the channel typically responds by increasing erosion rates. Identifying the existing channel geometry and the projected regime channel geometry suitable for the changed hydrological flows allows the quantification of erodible sediment contributing to sediment and phosphorous loading without intervention.
In regime channels, bank erosion typically represents a small fraction (less than 5%) of the annual sediment load in undeveloped or rural/agricultural watersheds; however, the streamflow regime is altered in urbanized watersheds, resulting in elevated stream erosive power. For Southern Ontario streams, the International Reference Group On Great Lakes Pollution From Land Use Activities study found that the sediment yield rate from bank erosion sources was 5 to 223 kg·ha
−1.yr
−1 (1.37 to 61.1 kg·km
−2·d
−1) [
39].
In addition, the Ontario Ministry of Natural Resources (MNR, now MNRF) Technical Guide for River and Stream Systems: Erosion Hazard Limit notes that stream bank recession rates in Ontario typically range from 1 to 11.5 m/100-years (average of 0.01 to 0.12 m/yr). Stream bank erosion contributes approximately 5% of the annual sediment load in undisturbed watersheds and up to 30% in urbanized watersheds with significant lengths of channel out-of-regime, candidates for stream restoration projects [
8,
9]. The International Reference Group On Great Lakes Pollution From Land Use Activities study results in constrained total stream corridor sediment sources for stream bank erosion [
39].
3.3. Hydraulic Modelling
Hydraulic modeling of the river network is needed to assess the urbanizing stream’s stability and estimate the sediment and phosphorus loads contributed by the out-of-regime stream reaches. For this study, a channel reach was deemed out-of-regime if the ratio of specific stream power to regime-specific stream power was more significant than or equal to a threshold of 1.5. Hydraulic modeling (HEC-RAS) was used to evaluate specific stream power (during the Q2 event) and regime conditions in Tannery Creek. Each tributary’s out-of-regime channel length was totaled and compared with the percent impervious cover (PIC) in the upstream catchment. The out-of-regime channel length, as a percentage of the total channel length in each tributary (ORD), was found to vary approximately linearly, with PIC for low to moderate values of PIC and, hence, was assumed to be roughly equal to PIC to identify the potential length of channel eligible for stream restoration.
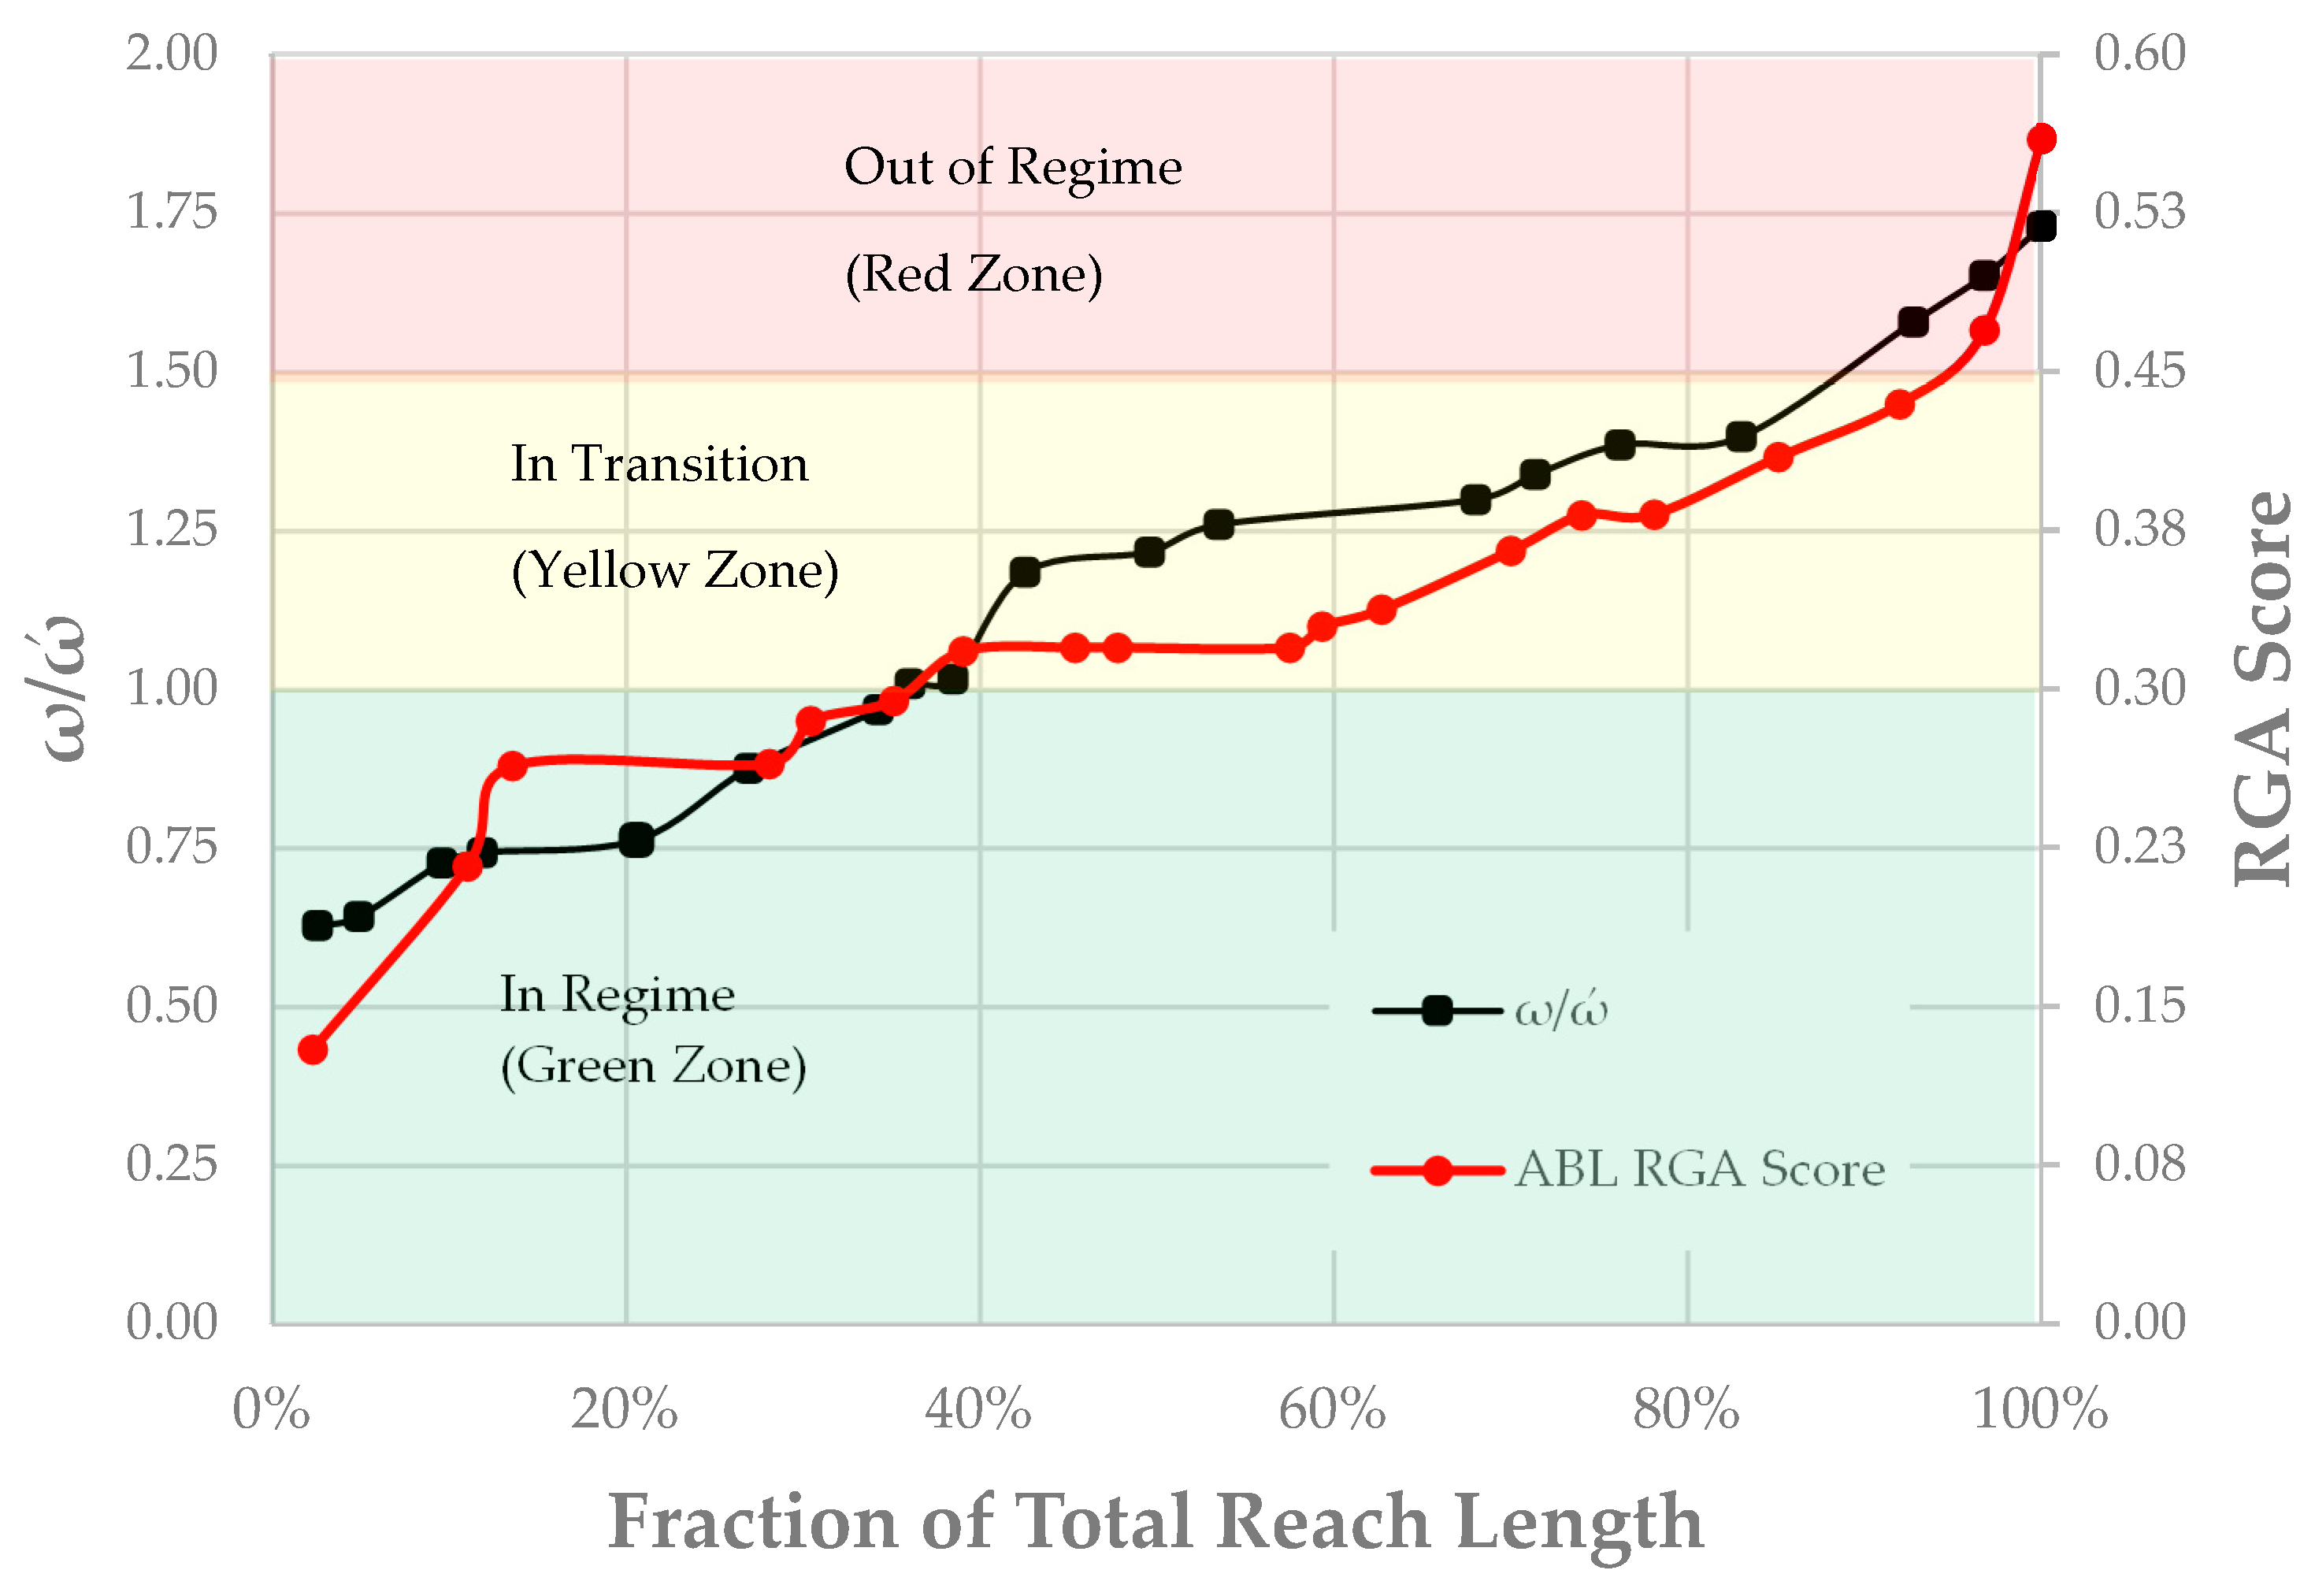
A comparison between the length of the out-of-regime channel, identified in the current study using stream power (ω/ω’), and the rapid geomorphic assessment (RGA score) study conducted by the Aquafor Beech Ltd. [
32] classifications is shown in
Figure 4, that shows a good agreement between the two methods. Based on this finding, the ω/ω’ criteria (<1 in regime; between 1 and 1.5 in transition; and >1.5 out-of-regime) may be used to assess regime conditions from topographic surveys and discharge records for short reaches of stream channels.
In addition to evaluating existing regime conditions, historical and future
Q2 estimates may be used to assess out-of-regime channel length under pre-urbanization and future full urban development scenarios. The ability to evaluate regime conditions under differing hydrological flows provides a supplemental tool to RGA, which is limited to evaluating the current state of a stream reach based on current and recent flow regimes.
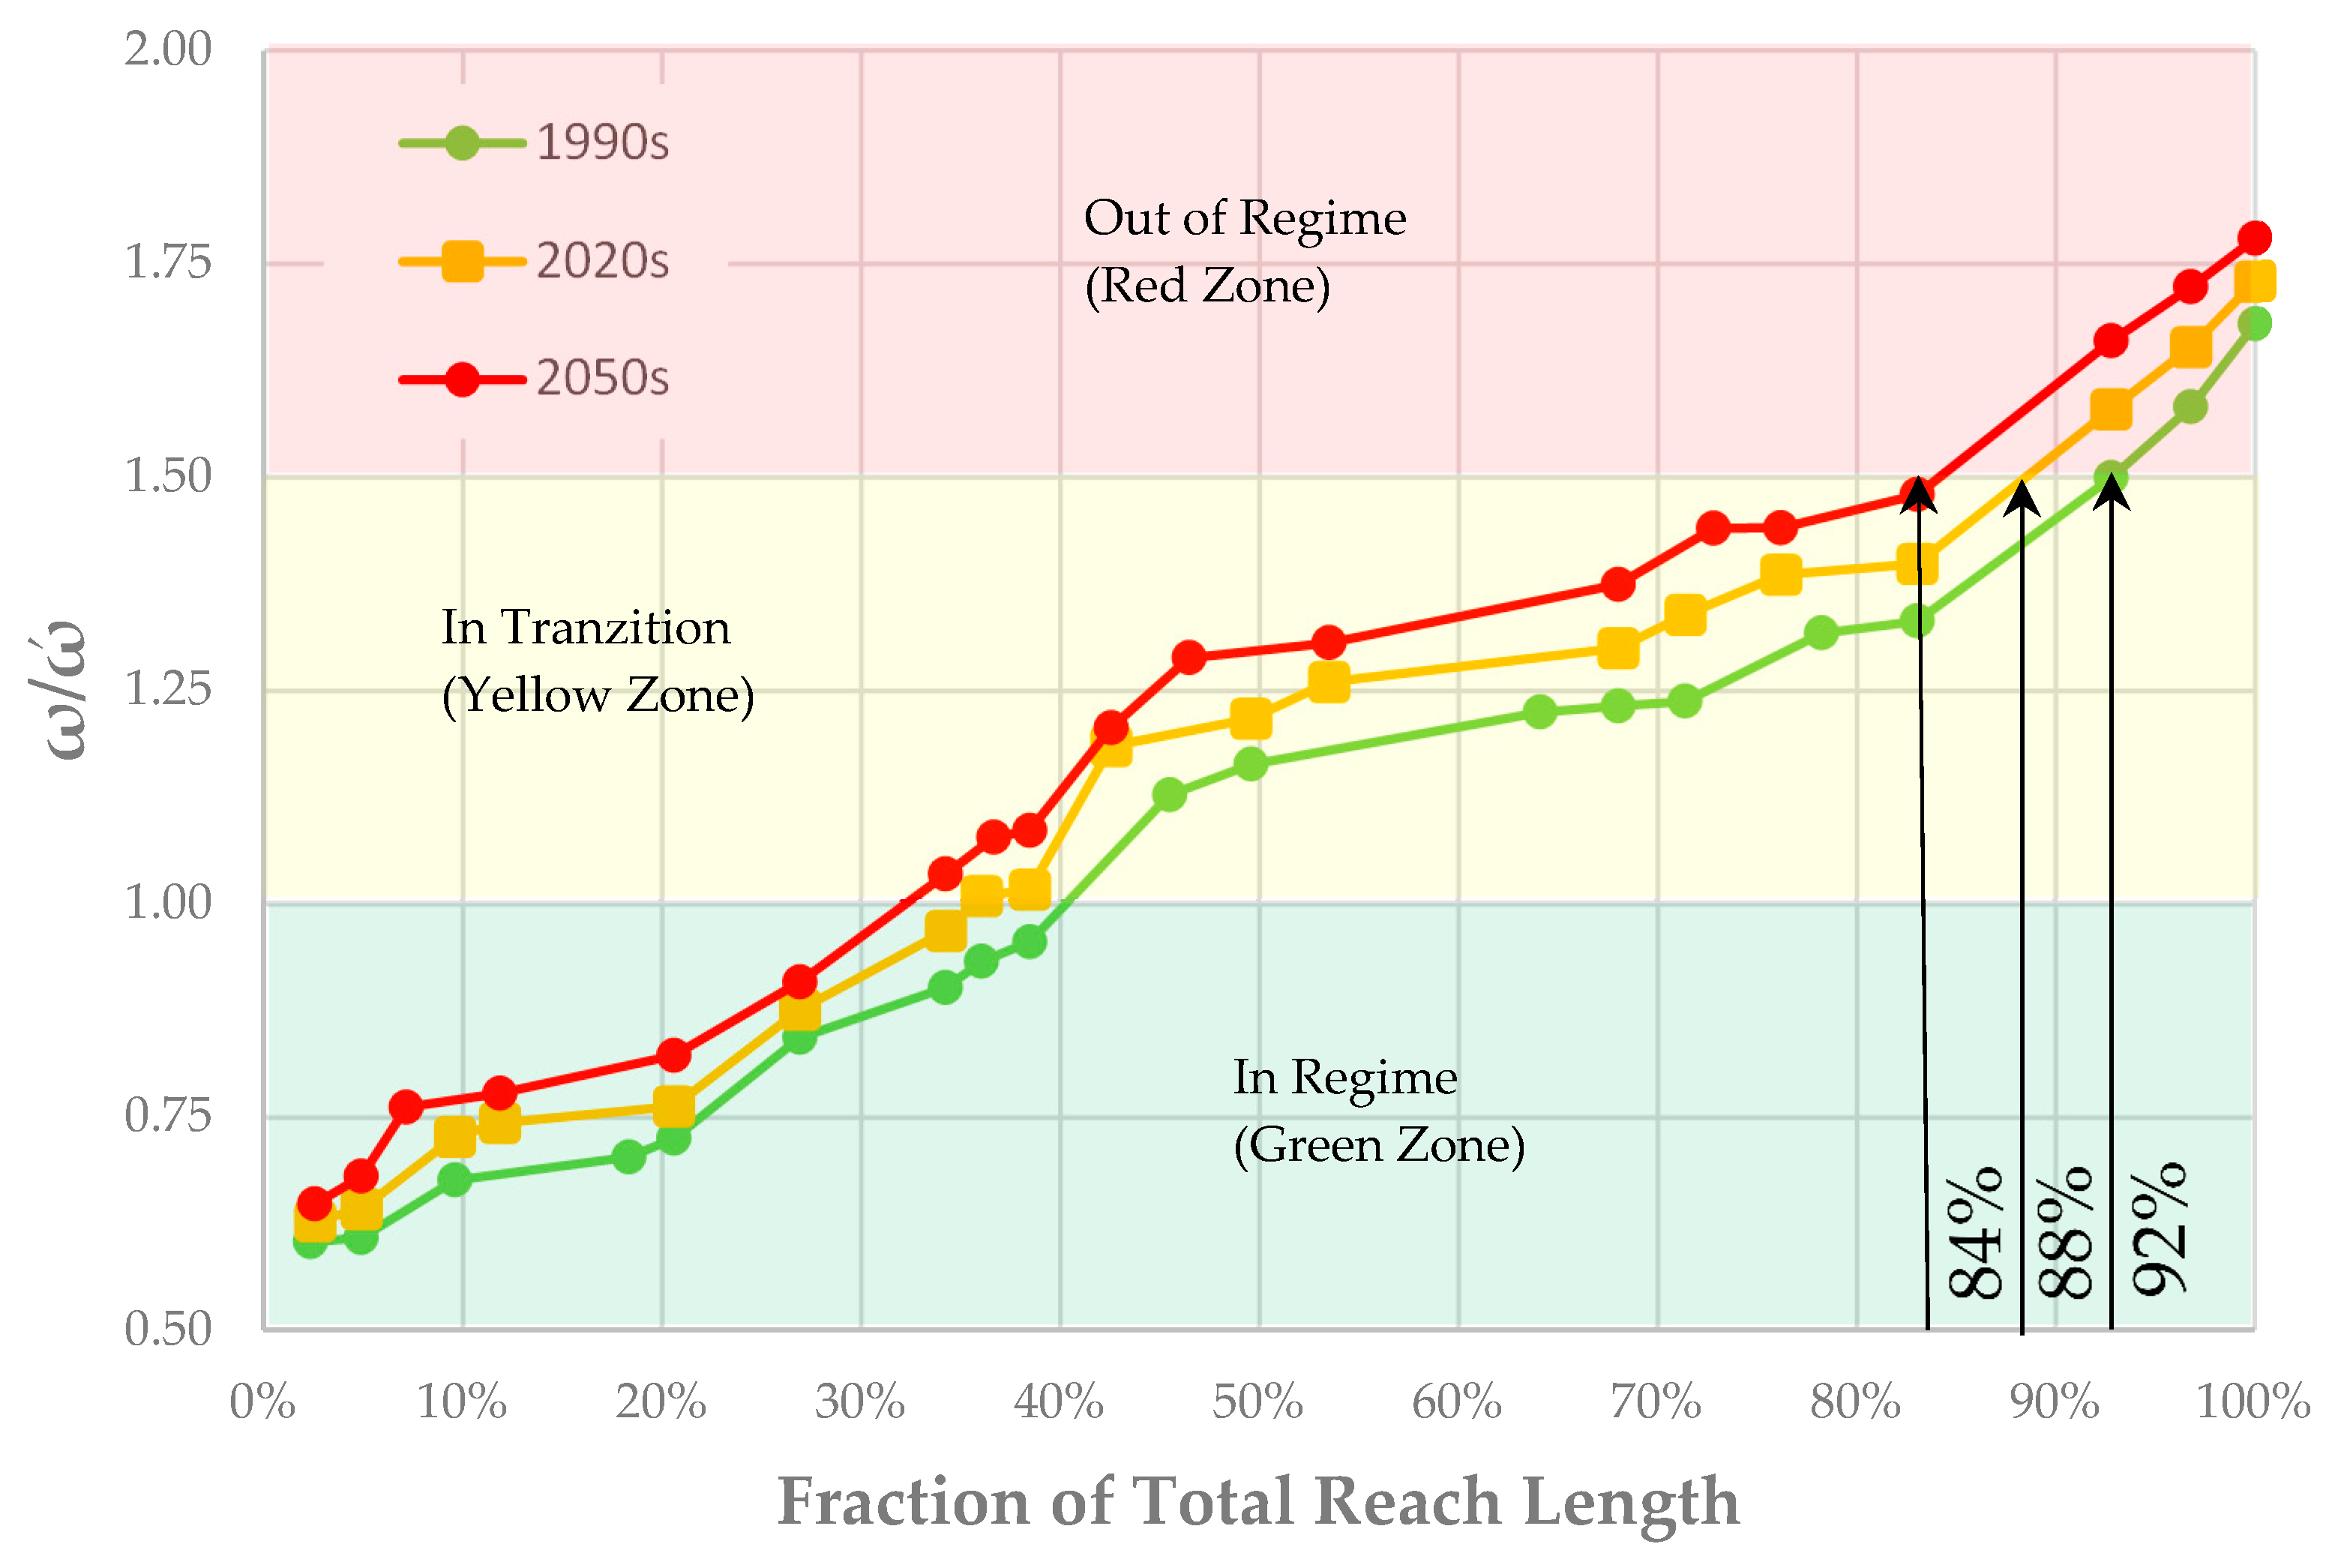
Figure 5 shows a comparison of modeled out-of-regime channel lengths in the Tannery Creek catchment approximately 20 years ago, at present conditions, and approximately 20 years in the future. These different scenarios are based on observed rates of change in
Q2 and PIC between the 1990s and the present day.
3.4. Sediment and Phosphorus Load Accounting for Tannery Creek
The total suspended sediments (TSS) and total phosphorus (TP) loads in Tannery Creek, the East Holland River, and a dozen other nearby watersheds, summarized in
Table 3 [
8,
9], were correlated with PIC and used to develop three linear equations (Equations (3)–(5)) for the area based estimates of the sediment or phosphorus loading in the current study. The linear relationships between sediment load and land use in the contributing catchment area were found using the Solver function in Microsoft Excel, and the observed TSS load data are shown in
Table 3.
Observed TSS loads were assumed to be sourced from three component land uses in the contributing catchment, impervious area, permeable area, and stream corridor, based on the findings of MacKenzie et al. (2022) [
9]. The component TSS load contributions for all catchments in
Table 3 were solved simultaneously by assuming the form of the linear relationship shown in Equations (3)–(5) and solving for the empirical coefficients that resulted in the best match between total predicted and total observed load.
To implement the solver function, the predicted component loads were summed for each catchment area, and the square error (difference squared) between the total predicted and observed loads was found. The coefficients in Equations (3)–(5) were changed iteratively until the sum of squared errors between observed and predicted total loads was minimized. The solution for the coefficient in Equation (4) for stream corridor contributions was constrained to the range of stream bank-sourced loads discussed in MacKenzie et al. [
8,
9] and the PLUARG study [
9,
53].
Equations (3)–(5) can be used to quantify the suspended sediment load with knowledge of the contributing catchment area and land use. The contribution from permeable sources (PER) included both urban and rural permeable areas. The resulting percentage contributions of each of the component TSS load contributions are summarised in
Table 3.
Equations (3)–(5) relate the relative contributions of sediment in Tannery Creek to the fraction of impervious area in the sub-catchment. The method used in this study is based on the observed sediment load in the downstream receiving watercourse (i.e., measured at the outlet of the watershed) and estimates the net sediment and phosphorus yield considering the well-established concept of “sediment delivery ratio.” The sediment delivery ratio is the ratio of sediment yield at the watershed outlet to gross erosion, affected by changes in storage in the drainage network and interception by infiltration, deposition, and plant uptake. While the sediment delivery ratio was not independently estimated using the current study methodology, the net effect of source load and sediment delivery ratio are implicitly included in the component load estimates provided by Equations (3)–(5). This approach differs from other methods that evaluate loads considering the export coefficient at or near the source [
42,
45].
Table 3 shows that as urbanization advances and pervious areas are converted into impervious areas, the TSS and TP loads per unit watershed area increase by an order of magnitude. In addition, the contribution of the stream corridor increases as rapidly urbanizing streams tend to go out-of-regime, and the bed and bank erosion loads become significant.
To estimate the sediment yield in a receiving watercourse, the loading per unit area estimated using Equations (3)–(5) is multiplied by the whole upstream contributing area. This approach differs from other methods that use the export coefficient, which is applied to the specific source area of interest [
42,
45]. Equations (3)–(5) may be used to explore the benefits of mitigation that adjust the effective catchment impervious cover or minimize bank erosion by reducing stream channel susceptibly to erosion.
3.5. Mitigating Sediment Loads Using Low-Impact Development
While evaluating the role of stream corridor sources of sediment and P loading is the focus of this study, the relative benefits of other mitigation measures, including catchment level low-impact development (LID) implementation, were included to allow a side-by-side comparison of costs and benefits. Typical LID features function by intercepting runoff from the footprint area of the LID and an upgraded catchment area. Intercepted water is retained within a typically underground storage unit and infiltrated for runoff events up to the design event. The typical ratio of the catchment area treated by an LID to the LID footprint area is 20:1 and 15:1 for the infiltration trench and the bioretention cell, as presented in
Table 1. For permeable pavements, this ratio is 1:1. That is, for every m
2 of bioretention cell installed, 15 m
2 of impervious area is treated, reducing the PIC accordingly.
Upon intercepting and infiltrating runoff, LIDs moderate peak flows in receiving watercourses. In addition, contaminants in intercepted runoff are prevented from entering receiving watercourses and downstream waterbodies. For this study, a simplifying assumption was made that impervious areas contributing to infiltration LIDs effectively become permeable areas. This assumption was used to modify sub-catchment PIC and quantify Q2 in Tannery Creek sub-catchments; however, relatively limited opportunities for LID implementation in the significantly urbanized sub-catchments limit the potential to mitigate Q2 in those sub-catchments significantly. Similarly, contaminants in intercepted runoff were assumed to be contained in the LID and prevented from contributing to downstream receiving watercourses. This assumption implies that LIDs will be properly maintained to avoid fouling and contaminant breakthroughs.
Available opportunities for four types of LID were identified in the Tannery Creek watershed based on previous studies implemented by the Lake Simcoe Region Conservation Authority: green roof, permeable pavement, bioretention, and infiltration trenches [
42]. The costing example below disregarded the green roof and permeable pavement developments due to the high cost-to-treatment benefit ratio and predominantly private land opportunities. Google Earth Imagery was used to determine potential LID siting for infiltration trenches & bioretention cells, as shown in
Figure 1.
An analysis of LID implementation and benefits on phosphorus loading is presented in
Table 4. For example, with reference to
Table 4, the PIC for TC 3 before mitigation is 21%. If drainage from 5% of the available 15 ha of the catchment were diverted to bioretention LIDs, 5% of the 1.4 ha to infiltration trenches, and 5% of the available 1.8 ha to permeable pavement, the effective PIC after mitigation would drop to 15%, thereby reducing the TP load to Tannery Creek from that catchment by approximately 34.5 kg/y at a life cycle cost of
$3,590,000.
Based on incentive and offset funding available in 2023, P credits of approximately
$3,080,000 would be available to fund the mitigation, resulting in a cost recovery ratio (P credit/life cycle cost of LIDs) of 0.9, meaning the proposed LID implementation in TC 3 is one of the more affordable and beneficial options. The focus of past stormwater management (SWM) and phosphorous load reduction has been on upland areas with less attention paid to riparian corridors; however, changed receiving watercourse hydrology increases erosive power of the flowing water and may destabilize regime channels and erode sediment and P from the riparian corridor as discussed in
Section 3.7.
Moderating (reducing) Q2 by implementing LID measures in upstream catchments can partially reduce erosive forces in stream corridors, with corresponding reductions in sediment and P loads. For this study, the implementation of LIDs for this costing example is 5% of the estimated total available area for LID. The total treated area was defined as the footprint area of constructed LIDs plus the catchment area draining to the LID. LID implementation reduces the impervious cover of the catchments. In the costing example, the reduced PIC of the cumulative upstream catchment after the LIDs was calculated.
3.6. Mitigating Sediment Loads Using Stream Restoration
Stream restoration to stabilize eroding reaches and “immobilize sediments in place” represents an additional mitigation opportunity against sediment and phosphorous loading. As discussed in [
8,
9], urbanization increases PIC, resulting in increased peak flows and, if left unmitigated, development of the urban stream syndrome in receiving watercourses.
As watercourses become unstable and the out-of-regime channel length increases, sediment and associated P loading from stream corridor sources also increase. If allowed to continue, this channel adjustment process would typically continue for decades until the channel cross section expands sufficiently to bring the erosive forces of increased hydrologic flows back into balance with substrate resistance to erosion. In addition to increased erosion and contaminant loading, changes to the substrate composition, low flow depths, and ecological function of impacted watercourses may never recover to pre-development conditions.
Stream restoration may reduce sediment and P loading. Still, it should be viewed as a second line of defense after catchment-level hydrological flow regime mitigation, which moderates both upland catchment and stream corridor sources by mitigating hydrological flows. Every stream reach that is restored would not contribute to the sediment and phosphorus load of the watershed. An analysis of stream restoration measures and benefits on sediment and P loading using Equations (3)–(5) is presented in
Table 5.
For example, with reference to
Table 5, the PIC for TC 1 is 25%, which is a reasonable proxy measure of the fraction of total channel length in the catchment that is out-of-regime. If all of the out-of-regime channels within the TC 2 catchment were restored to match the hydrologic flow regime, we can assume that the P load from that catchment would approach zero during typical flow conditions. As a result, the P load from that catchment would be reduced by 15.4 kg/y at an estimated life cycle cost of
$991,000. Based on P load reduction incentives and offset funding available in 2023, P credits of approximately
$1,380,000 would be available to fund the mitigation, resulting in a cost recovery ratio (P credit/life cycle cost of LIDs) of 1.4, meaning the proposed LID implementation in TC 1 is a highly worthwhile investment and an effective mitigation measure.
While close-to-source mitigation measures, such as LIDs and green and blue infrastructure, should remain the first line of defense, stream restoration should be considered as an additional tool to mitigate against the effects of urbanization on stream stability, contaminant loading, and ecological function. Stream restoration can be used to stabilize out-of-regime channel reaches by adjusting the channel cross section and profile to match the increased urban flow regime better or by armoring bed and bank materials with less erodible materials to resist erosion by flowing water in the creek. Where successfully implemented, stream restoration measures may reduce stream corridor sources of sediment and associated contaminants to a minimum, similar to regime conditions.
3.7. Mitigating Sediment Loads Using Agricultural Best Management Practices
While evaluating the role of stream corridor sources on sediment, P loading is the focus of this study. The relative benefits of other mitigation measures, including agricultural BMPs, were included to allow a side-by-side comparison of costs and benefits. As discussed in
Section 3.4, loading from these areas decreases with urbanization as impervious land uses gradually replace them. The relative contribution of contaminant loading from permeable sources may become less significant with increasing urbanization; however, disturbed permeable areas such as construction sites and active agricultural areas represent readily attainable opportunities to mitigate sediment and P loads. This study considered BMPs to compare sources and mitigation options to address sediment and P loading to receiving watercourses.
Agricultural BMPs designed to address ongoing land disturbance include a range of land use practices intended to reduce soil loss, increase agricultural productivity, and reduce sediment yield to receiving watercourses. This study considered cover crops, vegetative buffer strips (VBSs), and conservation tillage practices (including no-till). VBSs are typically planted along the downgradient edge of agricultural fields and are not disturbed or harvested. By allowing dense ground covering vegetation to propagate in VBSs, eroded soil in runoff is trapped, and the vegetation consumes nutrients from upgradient areas. Typical sediment removal efficiencies for BMPs were sourced from [
43], while typical annual costs per hectare were taken from [
44]. Opportunities for BMPs were identified using OWIT and by reviewing historical Google Earth imagery.
A summary of the proposed BMPs and P removal for catchments with significant amounts of agricultural land use, is included in
Table 6. For example, with reference to
Table 6, the TSS load from TC 7 is 9.3 kg/d/km
2 (24,200 kg/y) before implementing BMPs. If 60% of the available 170 ha of active agricultural land starts using cover crops, 60% of the available 3.62 ha area for VBSs is established along the downgradient edge of fields, and 60% of the available 73 ha is moved to conservation tillage practices, the TSS load contributed to Tannery Creek from that catchment would drop by 12,600 kg/y with a corresponding reduction in P load of approximately 12.8 kg/y at a life cycle cost of
$1,480,000. Based on incentives and offset funding available in 2023, P credits of approximately
$1,130,000 would be available to fund the mitigation, resulting in a cost recovery ratio (P credit/life cycle cost of LIDs) of 0.76 meaning that the proposed LID implementation in TC 7 is one of the more affordable and beneficial options.
3.8. Cost–Benefit Analysis
A cost–benefit analysis was completed for Tannery Creek to provide a case study example of how P load mitigation funding may be applied to LID, Ag. BMP and stream restoration initiatives to maximize the benefits per dollar spent. The Tannery Creek sub-catchments were organized based on PIC and ORD (% of channel length with ω/ώ > 1.5). Sub-catchments with PIC > 10% and significant ORD were given priority for LID retrofit and stream restoration opportunities, while those with low values of PIC were considered for Ag. BMPs. Stream restoration opportunities were given priority ranking based on potential P-load reduction and cost.
Areas potentially available for LID retrofits were identified from existing mapping sources as discussed in
Section 3.6 and prioritized for LID implementation based on potential P load reduction and cost. The cost of stream restoration versus LID and Ag. BMP implementation was compared and optimized based on P load reduction per dollar spent.
Table 6 illustrates the relative costs and benefits of stream restoration, LID implementation, and Ag. BMPs in the Tannery Creek catchment. In addition to optimizing P load reduction, the cost recovery ratio was estimated for each of the three mitigation alternatives. Cost recovery is the ratio of available financial incentives for mitigation projects divided by the estimated lifetime cost of the projects.
To allow for side-by-side comparison, all mitigation measures were scaled to a twenty-five-year lifetime. However, some are funded and implemented more frequently and have shorter effective lifetimes (e.g., cover crops).
Table 7 shows that the urban LID retrofits have the highest potential benefit on annual P load reduction in Tannery Creek. However, they are also the most expensive option. Stream restoration opportunities in Tannery Creek result in the second highest potential benefit on annual P load reduction. They would cost approximately an order of magnitude less than LID, resulting in the highest percent reduction in annual P load and the highest cost recovery ratio of the three mitigation options. Opportunity, based on ORD, limits opportunities to further capitalize on the benefits of stream restoration to reduce P load in the Tannery Creek catchment.
Agricultural BMP opportunities in the Tannery Creek catchment are limited because of the relatively low fraction of the total area in active agricultural land use; however, the annual P load reduction from agricultural BMPs is still significant; the lifetime cost is comparable to stream restoration, and significantly less than LID implementation. The percent reduction in annual P load is smaller for agricultural BMPs, primarily due to ongoing maintenance costs, and the cost recovery ratio is lower than the other two mitigation options considered.
However, BMPs have other significant benefits (e.g., increased crop yield, reduced irrigation requirements, reduced soil loss) that were not considered in this cost–benefit analysis of P load mitigation. Stream restoration and LID retrofits also have other benefits not considered in this cost–benefit analysis. LIDs are necessary for stormwater management and have other water quality treatment benefits and flood mitigation functions. The sediment and P load reduction benefits of stream restoration have been recognized in the literature in recent years. The reasons for conducting stream restoration (e.g., ecological function, erosion control, infrastructure protection) remain important.
Of the three groups of mitigation considered in this study, LID and stream restoration provided the most significant opportunities to mitigate the effects of urban development partially; however, implementation of these measures was limited by the amount of out-of-regime stream reaches and access to suitable areas for LID implementation in already significantly developed sub-catchments. Agricultural BMPs remain a vital part of the overall approach to minimizing sediment and phosphorus loads but represent a small opportunity in the Tannery Creek Catchment because of the relatively small fraction of the catchment in active agricultural land use.
Mitigation using LIDs has two modes of effect on sediment and phosphorus loads. First, LIDs may be used to intercept runoff from upland urban areas and retain and infiltrate it, resulting in the removal of suspended contaminants, including phosphorus, from surface runoff to receiving water courses. The secondary mode of the effect of LIDs is to moderate peak flows in the receiving watercourse by effectively causing impervious surfaces to respond to precipitation more similar to impermeable surfaces. Modifying peak flows in the receiving watercourse can mitigate stream corridor erosion and associated suspended sediment and phosphorus loads.
4. Conclusions
This study presents a novel methodology to evaluate the relative contribution of the stream corridor versus upland watershed contributions to total sediment and phosphorus loads in receiving watercourses. The new method can be used to develop a cost-optimized mitigation plan for the impacted watersheds, including the implementation of low-impact development (LID) for urban areas and best management practices (BMPs) for rural areas of the watershed as well as stream restoration projects for degraded stream reaches. We showcased the new method for the Tannery Creek watershed, which has gone through significant urbanization in recent decades.
The case study analysis of sediment and phosphorus loading in Tannery Creek illustrated the effects of urbanization and the potential benefits of three groups of mitigation measures (LIDs, stream restoration, and BMPs). The results showed that hydromodification caused by urbanization has resulted in increases in sediment and P loads to downstream receivers. Sediment and associated phosphorus loading were attributed to urban wash off from introduced impervious surfaces, stream corridor erosion resulting from increased hydrological flows, and some residual load from diminishing agricultural areas with frequent disturbance. Stream corridor erosion was primarily attributed to out-of-regime stream reaches in urbanizing sub-catchments.
The novel methodology developed in this study can assess the costs and benefits of mitigation measures, including low-impact development (LID), stream restoration, and agricultural best management practices (BMPs), and may be applied in other watersheds to facilitate mitigation planning. The fraction of total channel length that is out-of-regime (ORD) in an unmitigated urbanizing catchment is approximately equal to the percent impervious cover (PIC) of the contributing catchment area for low to moderate levels of PIC.
The cost–benefit analysis for the Tannery Creek Watershed showed that stream restoration should be included in water quality management programs as a cost-effective mitigation against increased contaminant loads associated with urbanization. Implementing various LIDs, BMPs, and stream restoration projects should be complemented with ongoing water quality monitoring near the watershed outlet and a re-analysis about five years after each significant implementation of mitigation measures to assess the water quality improvements achieved.


