Abstract
Pollution in the Port of Gdynia can encompass various types of substances and contaminants that affect the quality of water and sediment in this region. Ships entering and leaving the port can release pollutants such as oil, fuel, waste, and chemicals into the water. Controlling and monitoring these pollutants is a crucial part of environmental stewardship. In recent years, uncrewed units have been increasingly in use for in situ water and sediment sampling. Boat-based water sampling crews face significant safety risks at sea. Eliminating the need for a boat-based sampling crew, uncrewed units allow sampling from locations that are difficult to access by traditional sampling methods. To validate the HydroDron-1 method, water samples and bottom sediments were collected from five basins in the Port of Gdynia using the HydroDron-1 method and accredited sampling methods. The values of measured parameters were similar for both methods. Using the HydroDron-1 method at the Port of Gdynia has the potential to improve safety while reducing sampling costs and increasing data collection. The project was implemented as part of the POLNOR 2019 Call program, announced by the National Center for Research and Development (NCRD): “Marine port surveillance and observation system using mobile unmanned research units” NOR/POLNOR/MPSS/0037/2019.
1. Introduction
The Port of Gdynia is one of the most significant Baltic seaports. It is situated in the central part of the southern Baltic coast, strategically located in the Gulf of Gdańsk and surrounded by the city center of Gdynia. The port of Gdynia is a part of the goods supply system necessary for the functioning of the economy and the creation of a sustainable society as it is a key link in Corridor VI of the Trans-European Transport Network (TEN-T) [1,2]. The transport of environmentally hazardous products in the Baltic Sea area has increased in recent years [3].
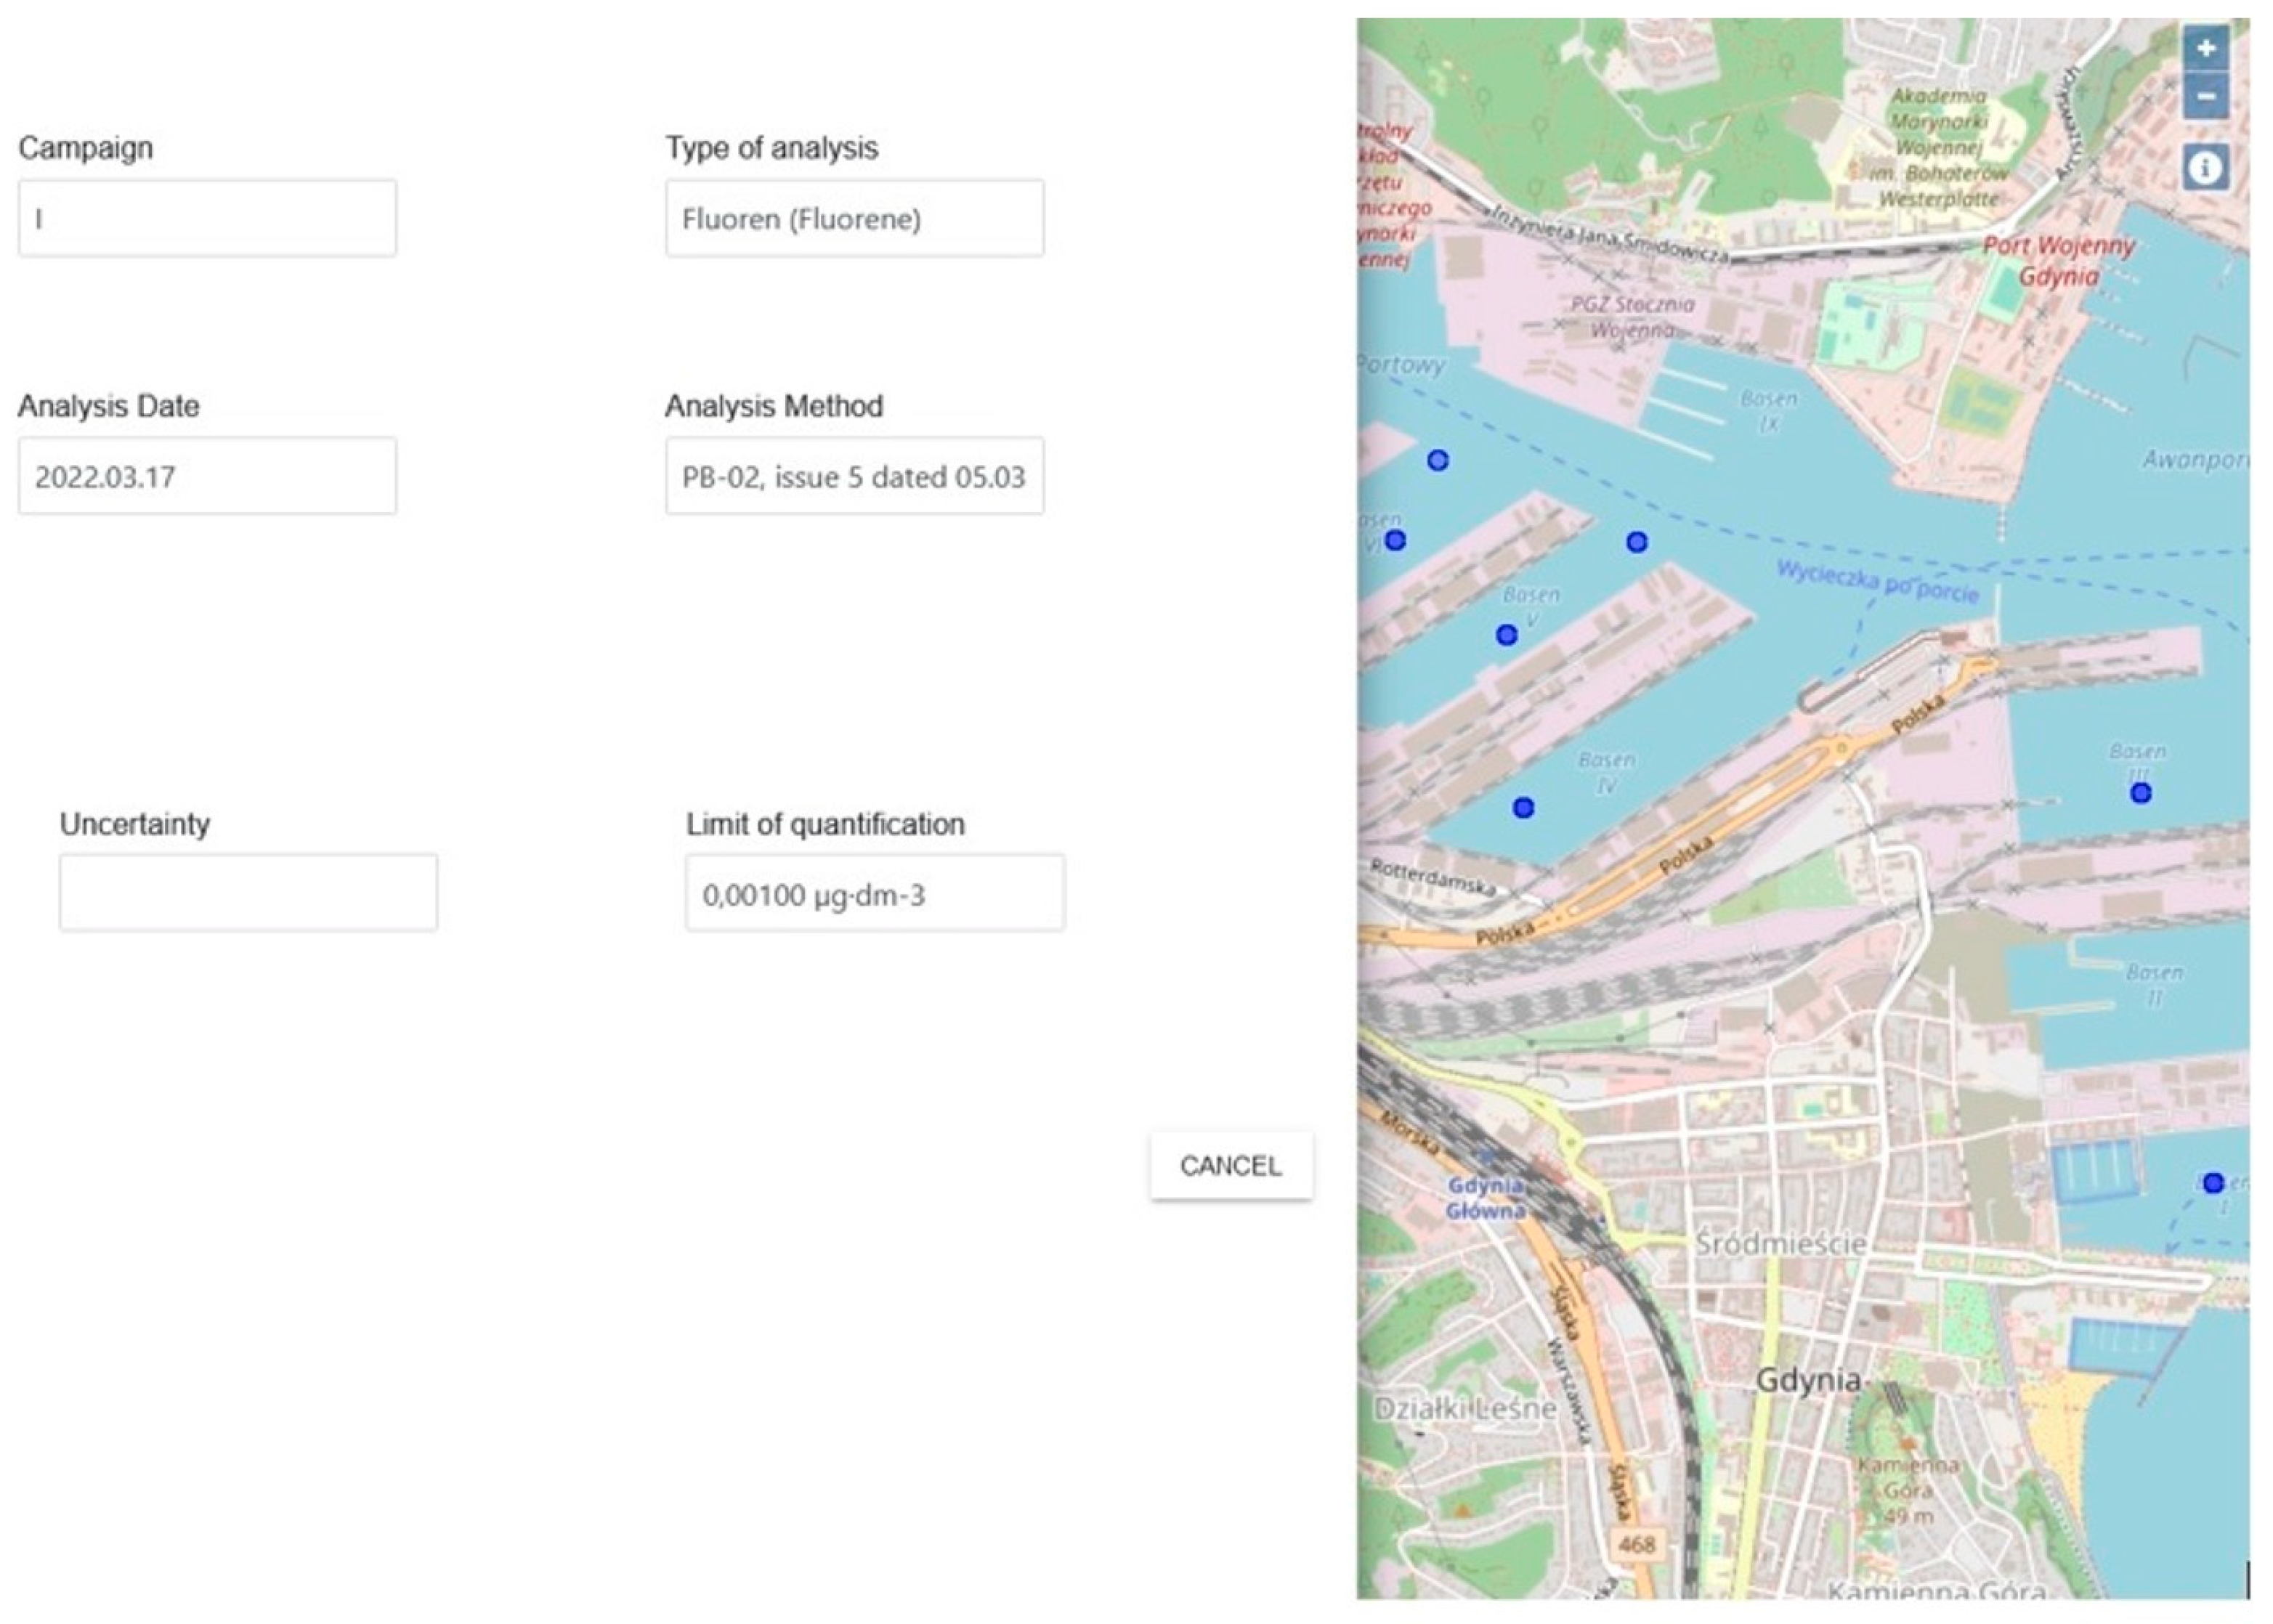
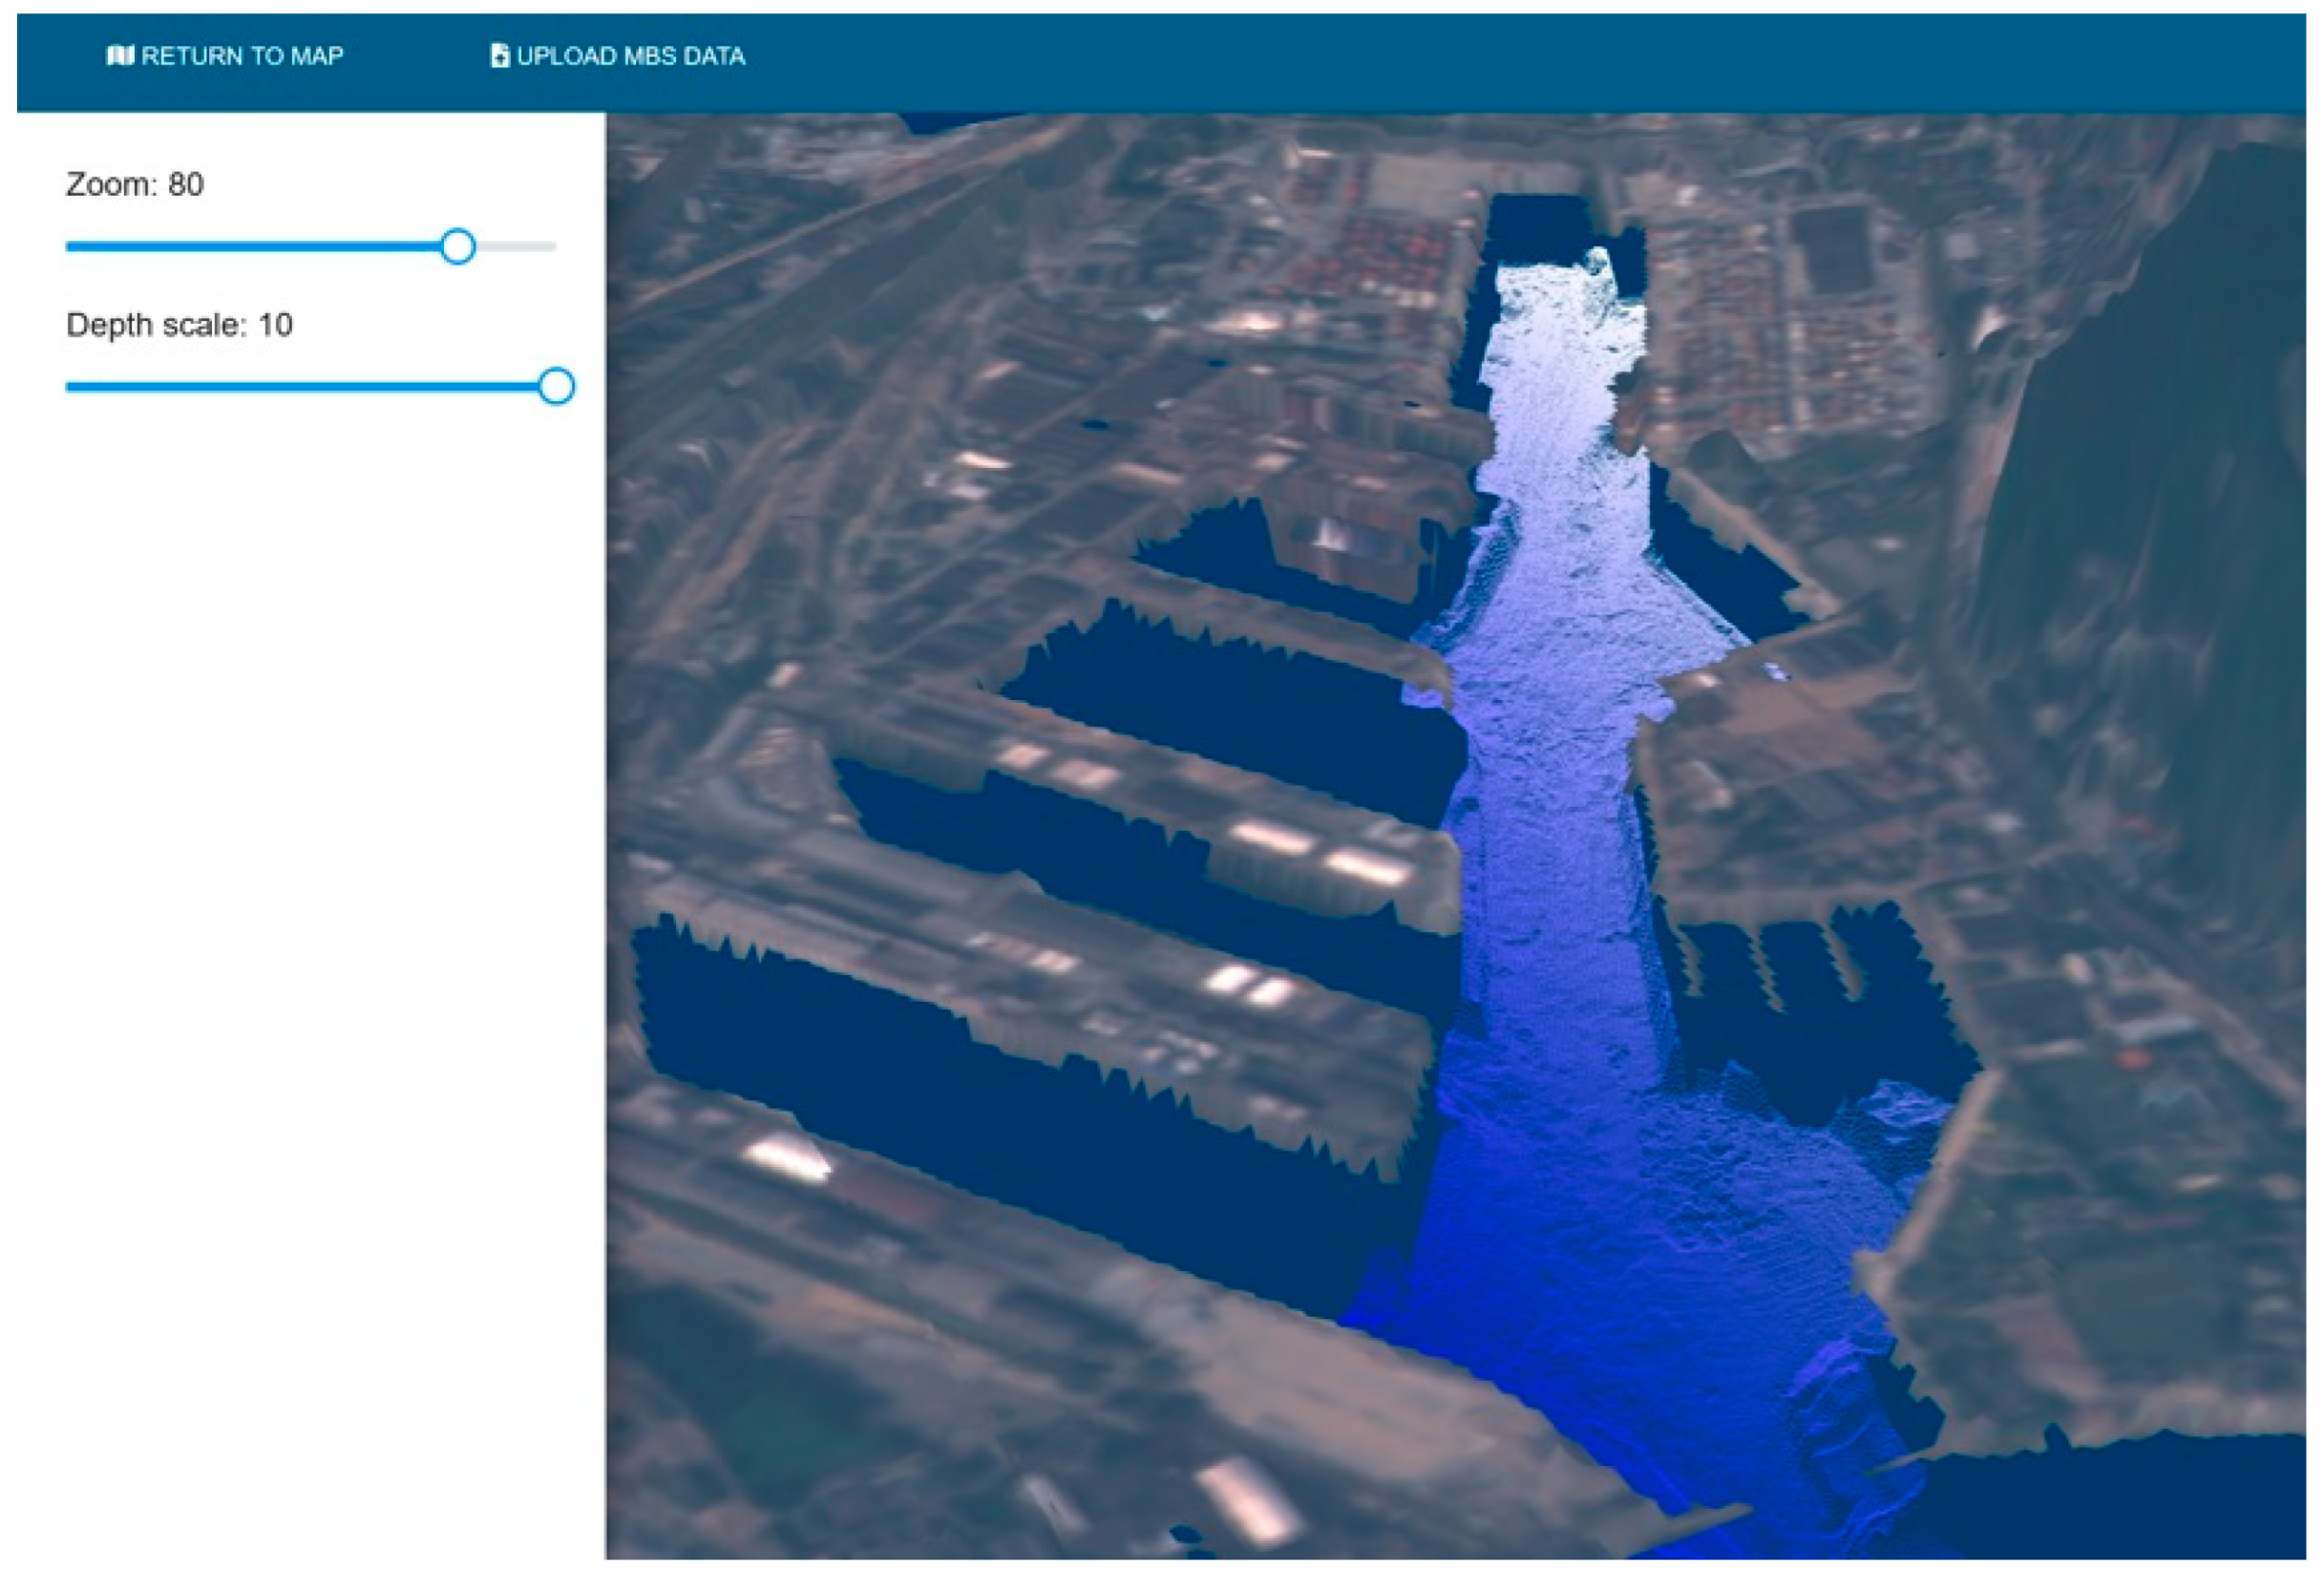
The main goal of the POLNOR 2019 Call project “Marine port surveillance and observation system using mobile unmanned research units” (MPSS) is to build an integrated tool as an IT system providing efficient management of surveillance activities in the Port of Gdynia. They include real-time monitoring of hydrodynamic conditions, i.e., current and waves, oil spill detection for the port area and conducting standardized tests of water quality and bottom sediments for the determination of changes in the content of nutrients, petroleum substances and persistent organic pollutants in water and port sludge. The autonomous unit is foreseen for conducting bathymetric measurement cycles to verify the shape of the ground and the current deposition of sediments, as well as collecting samples for physicochemical tests with respect to presence of several substances and pollutants. Also, the 3D hydrodynamic, water quality and water oil spill model will be utilized to forecast the ecological status for the Port of Gdynia. One of the main tasks of the project is the development of the geo-warehouse allowing the storage of the surveillance data, the analysis of them, and the dissemination of the processing results. The geo-warehouse, accompanied by a friendly interface containing the Web-GIS component and allowing comprehensive management of data, will be interoperable across various data models and sources. Examples of the MPSS system user interface functions are presented in Figure 1 and Figure 2. Figure 1 shows the form containing the information corresponding to a given measurement sample and an analysis method, along with the map of the port area created by the Web-GIS component, presenting the acquisition locations of water and sediment samples. Figure 2 presents the 3D view of the bathymetry map for the main route in the Port of Gdynia.
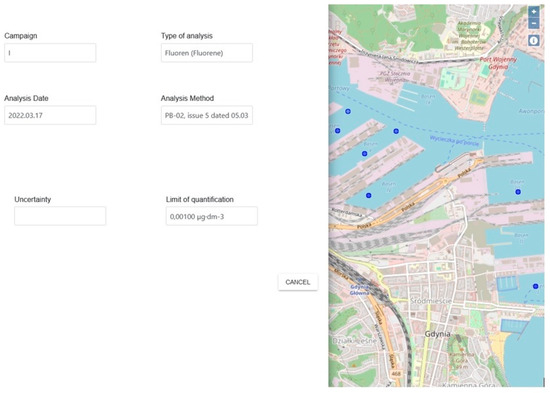
Figure 1.
Elements of the MPSS system user interface: a part of the form containing the information on a given measurement sample and an analysis method (left) and the Web-GIS map showing the acquisition locations of measurement samples (right).
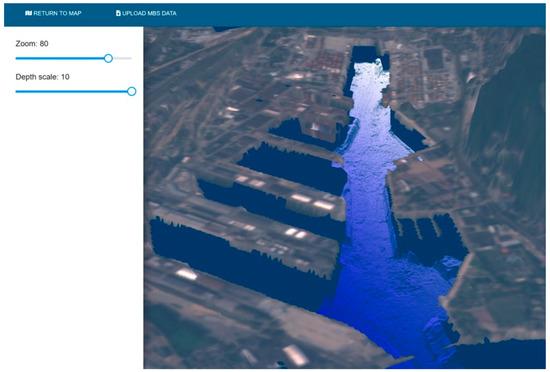
Figure 2.
The 3D view of the bathymetry map for the main route in the Port of Gdynia.
One of main issues addressed in the MPSS project is the pollution of the Gdynia port area. Anthropogenic pollution from industry, tourism and shipping has a strong impact on the coastal zone of the Port of Gdynia. Today, the pollution of the sea by waste, sewage and emissions from transport has become one of the most important environmental problems. It is essential to constantly monitor the pollution that occurs in the coastal zone of the southern Baltic Sea. The port’s shipping traffic is high and is increasing every year [4]. These risks highlight the dangers of working on or near water [5]. Port monitoring is hampered by the spatial and temporal constraints of collecting individual samples and transporting them to a laboratory testing. Working in harbors exposes boat-based water and bottom sediment sampling personnel to deadly hazards. One solution is to use unmanned surface vehicles (USV) for sampling [6]. USV can be defined as a generic vessel that is capable of operating without a human operator on board. The definition can be applied to any type of such vehicle able to operate without a human operator on board, including airborne, ground and underwater vehicles [6]. Unmanned surface vehicles (USVs) have become an attractive alternative in a wide range of maritime missions through development and machine learning [7,8]. USVs are in use in a wide range of research and industrial applications and will be in demand in the future. In the broadest sense, the applications of drones include imaging, geophysics, sampling, harbor patrolling or even search and rescue (SAR) [9]. Today’s unmanned systems are a viable alternative to traditional marine mammal survey methods thanks to recent technological developments [10]. Unmanned and autonomous vehicles for oil spill observation, tracking and damage assessment are emerging as a powerful tool with strategic potential [11]. They are becoming increasingly commonplace in various fields of science and business. One of the most important aspects in developing such a solution is to ensure that the vehicle can navigate autonomously without having to intervene, or at least to minimize the human intervention that is required [12,13,14]. There has been some development of unmanned floating platforms in Poland in recent years. One of them is HydroDron-1, which was built by Marine Technology [6].
HydroDron-1 is a mobile unit designed to measure and survey the waterborne environment. Missions are conducted using bathymetric, sonar, LiDAR and other measurements. The unit can operate in autonomous mode, following the planned trajectory, or in remote control mode. This is particularly useful in areas difficult for larger manned vessels to access [6]. Thanks to its versatility, HydroDron-1 has been adapted for the automated sampling of water and bottom sediments in the port basins of the Port of Gdynia. Sampling using devices installed on board unmanned units allows hard-to-reach places to be accessed. However, keep in mind that the sampling process is an established procedure. The sample taken for testing should be representative of the entire installation [15]. During the sampling process, reference is made to the normative provisions that indicate what equipment should be used for sampling and what containers should be used for storage. To be considered reliable, a measured result needs to be presented together with its uncertainty and evaluated according to an appropriate procedure. It is necessary to include the uncertainty relating to the sampling procedure in the uncertainty-budget calculations. Reporting the measurement uncertainty demonstrates that the laboratory operates according to internationally recognized standards. The total uncertainty of the measurement result can be significantly influenced by the sampling procedure [16].
The uncertainty of sampling refers to the contribution of sampling errors to the combined uncertainty associated with the analytical measurement, where the quantity being measured is the analyte concentration in the sample [17,18]. According to Thompson, sampling errors can only be quantified after the sample has been analyzed, so routine measurement results include both sampling errors and analytical errors. As a result, results used to estimate sampling uncertainty must come from planned experiments [17].
The experimental method of determining measurement uncertainty allows for a quick and relatively straightforward assessment of all sources of uncertainty associated with sample collection [16,19,20]. The application of the sampling procedure twice allows for checking the precision of sample collection and determining the variance of the entire sample collection process. In the MPSS project, samples were collected from a given location by different individuals using different sampling techniques. In this case (according to theory), the combined uncertainty was determined as the difference between the measurement results obtained using different techniques by different individuals. Conclusions are drawn based on variance analysis (ANOVA) [19,21].
In accredited testing laboratories, sampling uncertainty is estimated in a validation process of a new sampling method. In order to take into account as many variables as possible, four measurement series in different seasons were performed. Although all samples’ results should be taken into account during uncertainty estimation, there is no need to separate results from different measurement seasons.
The innovative aspect of this article is the use of an unmanned platform to collect samples of water and bottom sediments in port basins. No automatic platform has yet been accredited for collecting samples of water and bottom sediments in the natural environment, and the presented research is an initial stage of this process. Currently, unmanned platforms are most often used only for bottom sonar. In accordance with Polish law (Dz. U. 2022.2556 art. 147a), sampling should be performed by an accredited laboratory. Therefore, the results of water and bottom sediment samples taken by HydroDron-1 were compared with the results of samples collected by the crew the IMOS unit. This approach meets all accreditation requirements. In order to improve the monitoring of water and bottom sediments in the Port, it is planned to accredit sampling using HydroDron-1 in the future.
The aim of the work presented in this paper was to examine the correctness of the method of collecting water and sediment samples by the HydroDron-1 unmanned unit and comparing it with the currently used accredited sampling methodology. Real samples collected by HydroDron-1 and the standard boat of the IMOS-2 sampling and prepared for analysis in accordance with the procedure were subject to precision evaluation with the application of ANOVA analysis of variance.
2. Materials and Methods
2.1. Unmanned Research Platform
HydroDron-1 (Marine Technology, Gdynia, Poland) is a 4 m-long and 2 m-wide double-hulled catamaran. It is driven by two independent Torqeedo Cruise 4.0 RL electric motors, each with a power of 4 kW. It weighs approximately 300 kg. The maximum working time is about 12 h. HydroDron-1 has a maximum speed of 26 km/h. The remote control ranges up to 40 km, but onboard data transmission is limited to 6 km.
2.2. Boat
IMOS-2 motorboat is a pneumatic hard-bottomed survey boat designed and built for hydrographic surveying in inland and open sea waters up to 3 nautical miles from the coast. An additional cabin equipped with brackets allows the installation of measuring equipment. This unit is used for measurement work at sea in the area of coastal waters up to 5 m deep. The crew of the motorboat consists of 2 people—the system operator and the helmsman.
2.3. Water Samples
Sampling using both methods was carried out in accordance with the PN-ISO 5667-9:2005 standard [22]. Physicochemical analysis of all collected water samples was performed in the accredited Laboratory of Environmental Protection of the Maritime Institute, Gdynia Maritime University (GMU). The methods presented in Table 1 were used to measure the parameters of Port Gdynia water (Table 1).

Table 1.
Methods used to study the waters.
2.4. Sediment Samples
Sediment samples used in the study were collected according to PN-EN ISO 5667-19:2006 [28]. The methods presented in Table 2 were used to measure the parameters of Port Gdynia sediments (Table 2).

Table 2.
Methods used to study the sediments.
2.5. Location of Sampling Points
Water samples were taken in 2022 at different seasons from the selected locations in the Port of Gdynia. Four sampling campaigns were carried out in five basins in the port of Gdynia. The first winter campaign lasted from 28 February to 3 March, the second—spring campaign—from 16 to 19 May, the third—summer campaign—from 18 to 21 July, and the fourth—autumn campaign—took place in October from 17 to 20. Sampling sites were selected on the basis of historical data. They were indicative of the optimal locations for sampling from the point of view of the objectives of the project. The locations of samples are presented on the map in Figure 1.
2.6. Validation of the Unmanned Unit HydroDron-1
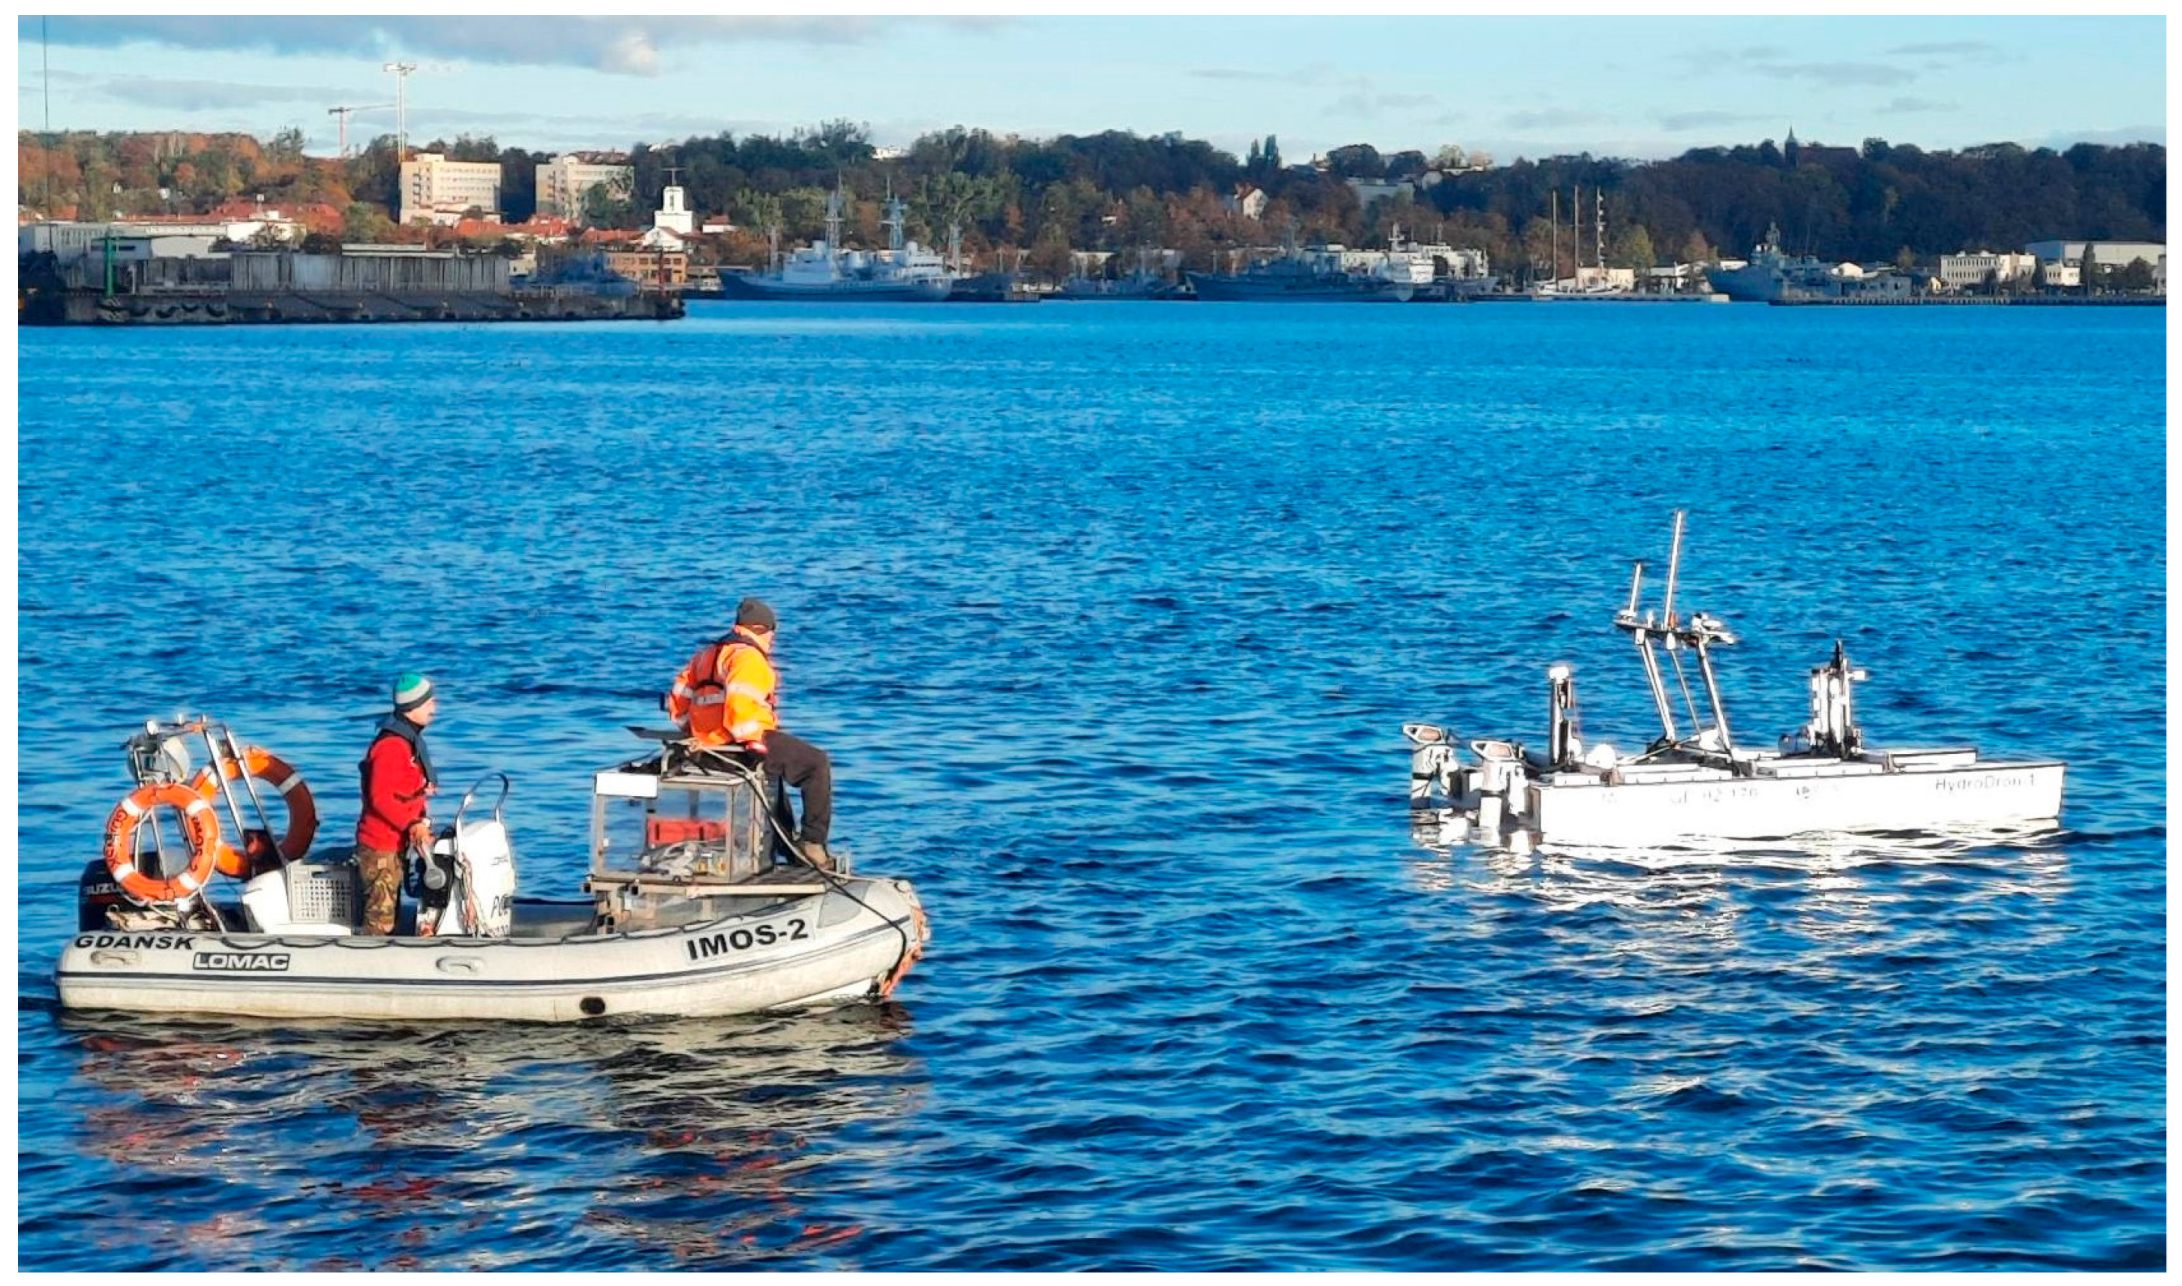
To validate the unmanned unit sampling method, the HydroDron-1 method was compared to manned IMOS-2 sampling (Figure 3). Both units have a bathometer system for collecting water samples and a Van Veen grab sampler for collecting sediments samples. The bathometer is an upright water sampler. It is widely used in marine water sampling. It consists of a tube with a diameter of 20 cm with rubber caps covering both ends, which are internally connected by a strong elastic cord. The caps are attached to a trigger in the ‘open’ position. A messenger is used to trigger the bathometer to close when it reaches a target bottom. Van Veen grab is used for collecting bottom sediments for biological, geochemical and environmental studies. It is made of stainless steel. In low wind conditions with a smooth water surface, experience has shown the HydroDron-1 method to be reliable and useful. Very strong winds can push the drone, making it difficult for sampling and causing damage to the installed equipment. Vertical and horizontal drift can cause errors with sampling at a given bottom. HydroDron-1 uses an on-board global positioning system (GPS) to maintain a constant horizontal position. This can minimize errors associated with horizontal drift. Sampling by boat is also subject to both vertical and horizontal drift. The IMOS-2 drifted during sampling, but it was repositioned using a handheld GPS before the next sample was taken. IMOS-2 and HydroDron-1 were not at exactly the same place on one sampling site. There was a maximum distance of 10 m between vessels at a sampling site in the study.
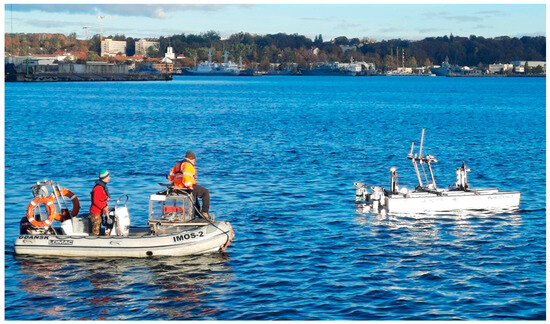
Figure 3.
IMOS-2 and HydroDron-1 vessels in the waters of the Gdynia Port basin (Photo credit: A. Bojke).
2.7. Method for HydroDron-1 Sampling
While one team member set up the drone, a second team member calibrated the SVP Base X2 sonic velocity profiler (manufactured by AML) to measure temperature, electrical conductivity and pH. HydroDron-1 is designed to collect water and sediment samples and measure physical water parameters in the water column. The system consists of a winch-lowered probe that measures physical water parameters. A bathometer or grab can be connected to the lift to collect water or sediment samples at various selectable levels. The drone returned to the staging area where bottles were filled.
2.8. Method for IMOS-2 Sampling
Manual sampling from the IMOS-2 boat was performed by employees from the accredited Environmental Protection Laboratory of the Maritime Institute, Gdynia Maritime University (GMU). Seawater samples were collected using a bathometer according to PN-EN ISO 5667-9:2005 [22], while sediment samples were collected using a Van Veen sampler according to PN-EN ISO 5667-19:2006 [28]. Seawater samples were taken manually. They were then bottled directly on the ship. Sediment samples were taken manually, averaged directly on board and transferred to glass vessels.
2.9. Statistical Analyses
Sampling was planned following the Eurachem/CITAC guide on measurement uncertainty arising from sampling: a guide to methods and approaches [19,20,21,31]. An analysis of variance (ANOVA) statistical technique is applied to the resulting data and has been used to estimate uncertainty and its components. Comparison of the data was performed using a statistical significance test: pairwise comparison of values [32].
3. Results
3.1. Assessment of Duplicate Sample Collection
Over the course of the project, we collected a total of 112 water samples and 56 samples of the bottom sediments from 7 locations in the Port of Gdynia. Original measurement data, including all parameters, are contained in spreadsheet files water_sampling_data.xlsx and sediment_sampling_data.xlsx published as the Supplementary Materials of this article.
Precision was used to assess the quality of sampling water and sediments by HydroDron-1 relative to sampling by people on the boat IMOS-2. The relative percentage difference (RPD) was calculated in accordance with the guidelines recommended by the US Environmental Protection Agency. The acceptance criterion for a duplicate sample is a maximum of 20% (35% for solid samples) (United State Agency Environmental Protection 1994). The relative percentage difference (RPD) calculated for selected analytes is shown in Table 3.

Table 3.
The relative percentage difference between sample collection by HydroDron-1 relative to sampling by people on the boat IMOS-2.
The basic equation for RPD is
where
- IM—results of samples collected by IMOS-2;
- H—results of samples collected by HydroDron-1.
The water sample meets the requirements using the strict criteria, assuming the duplicate sampling procedure was correct. Our results show that there is a degree of agreement between the analysis obtained from drone and boat samples. The relative percentage difference of the analytical results was less than ±20% for most parameters. The increased RDP values result from the fact that concentration results were compared at low levels. In such a situation, a small value of the concentration difference generates a high RDP value. The results of mineral oils and the sum of gasoline were often below the limit of quantification or at its limit. Thus, the HydroDron-1 sampling method provided chemical data equivalent to those collected by the people on the IMOS-2 boat under EPA guidelines. The surface samples showed the lowest relative percentage differences. For the sediment samples, differences between samples were observed. Sediment sampling is subject to greater error. This is due to the specificity of the study area and increased anthropogenic activity. Differences between the two samples may be greater. Our results show that the relative percentage difference of the sediment sample collected by HydroDron-1 and the samples collected by the people on the IMOS-2 boat is a little higher regarding the criteria.
3.2. Results of Sample Comparisons
The sampling HydroDron-1 gathered in situ profiles of temperature, electrical conductivity, and pH using SVP Base X2 sonic. The samples collected by the people on the IMOS-2 boat crew were measured in according to the methods in Table 1.
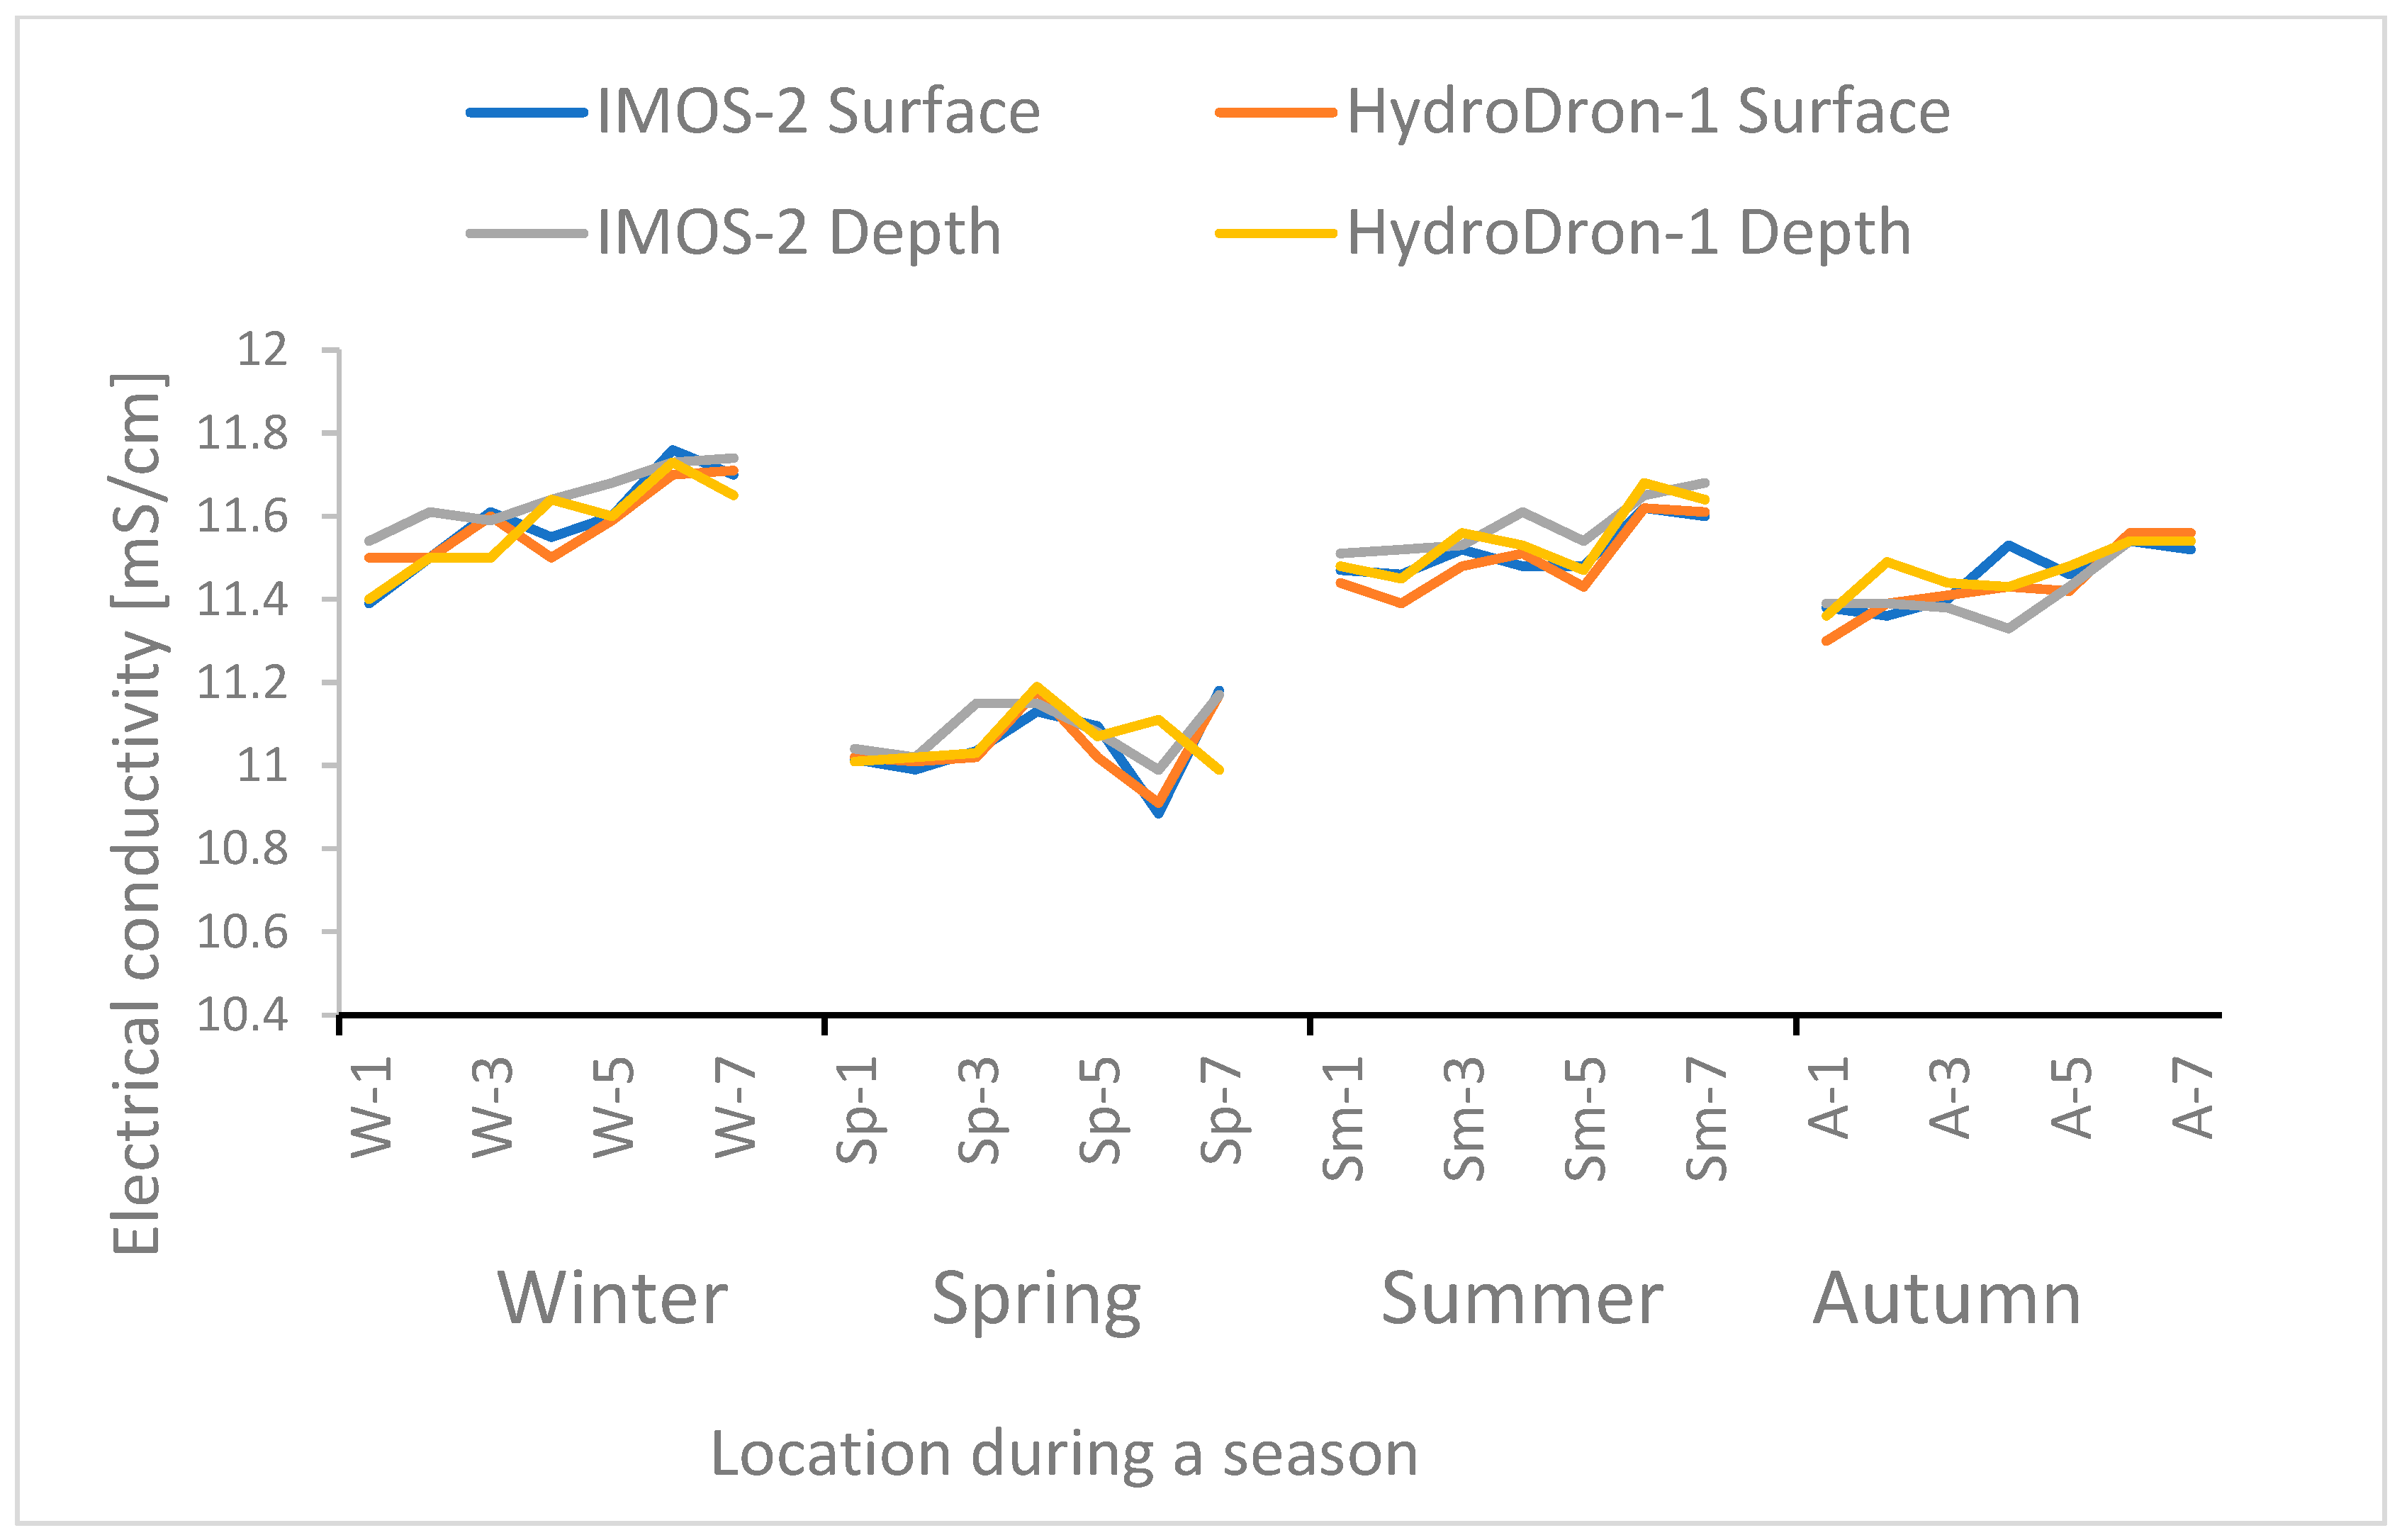
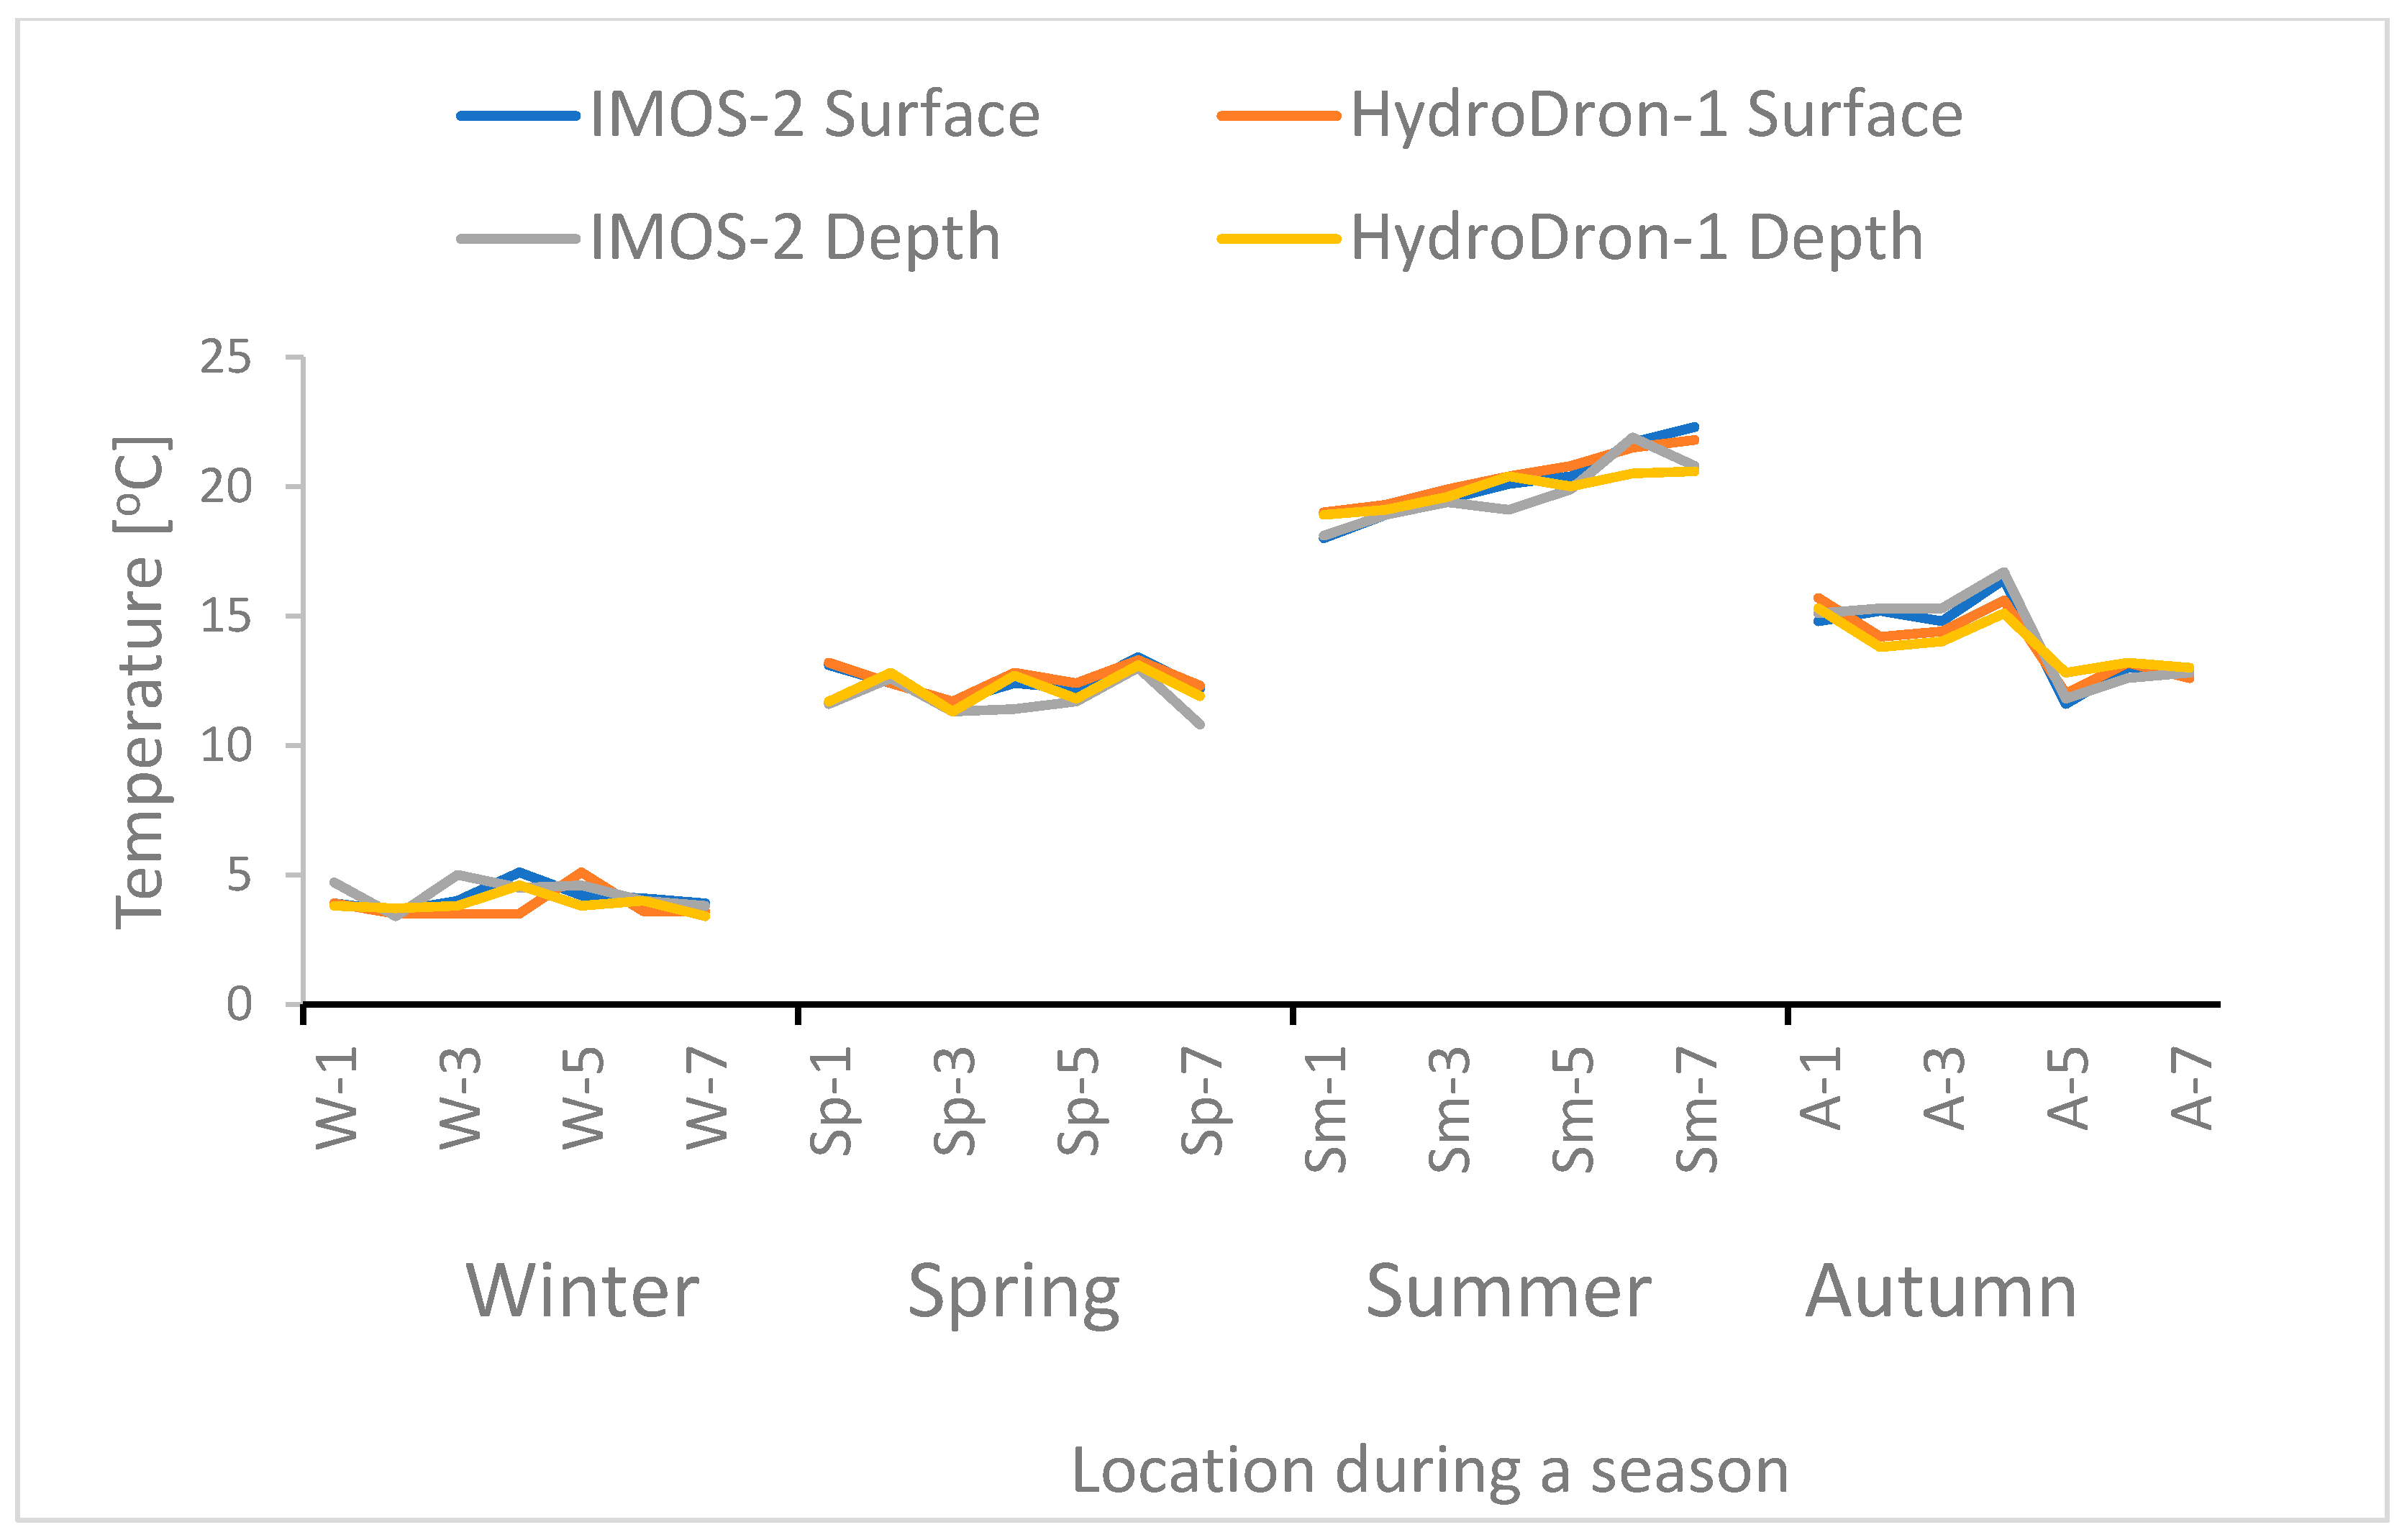
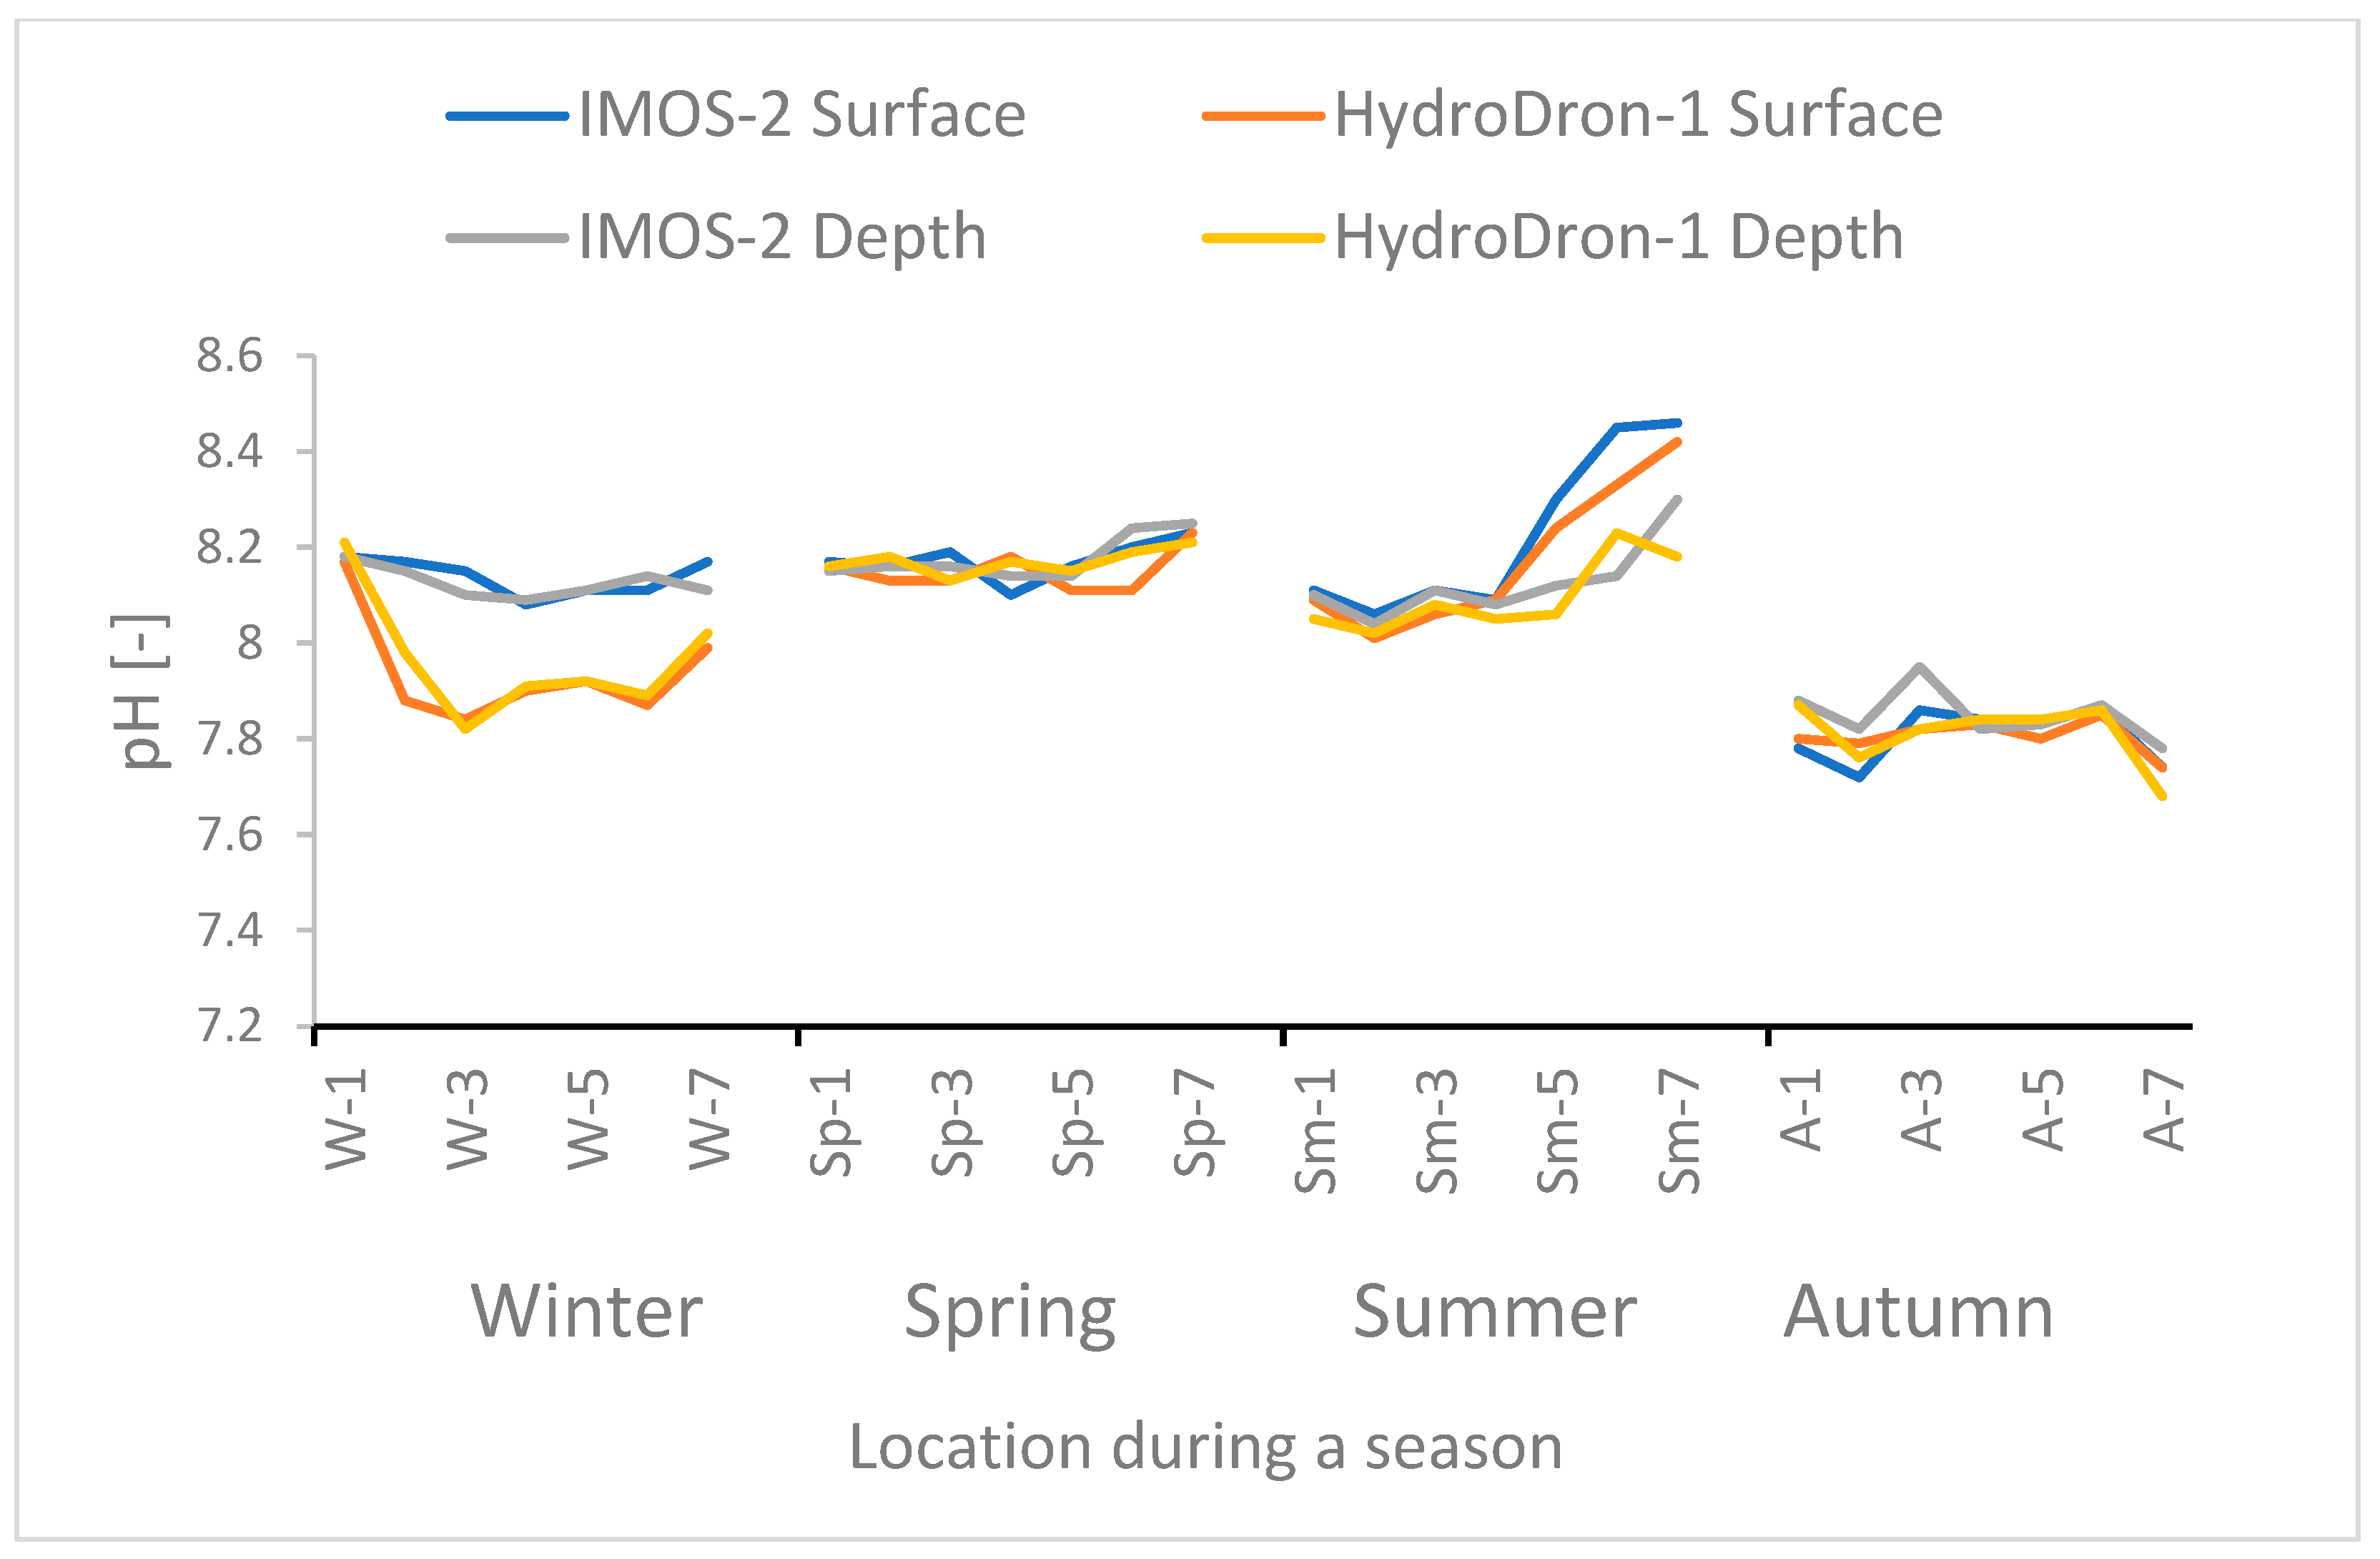
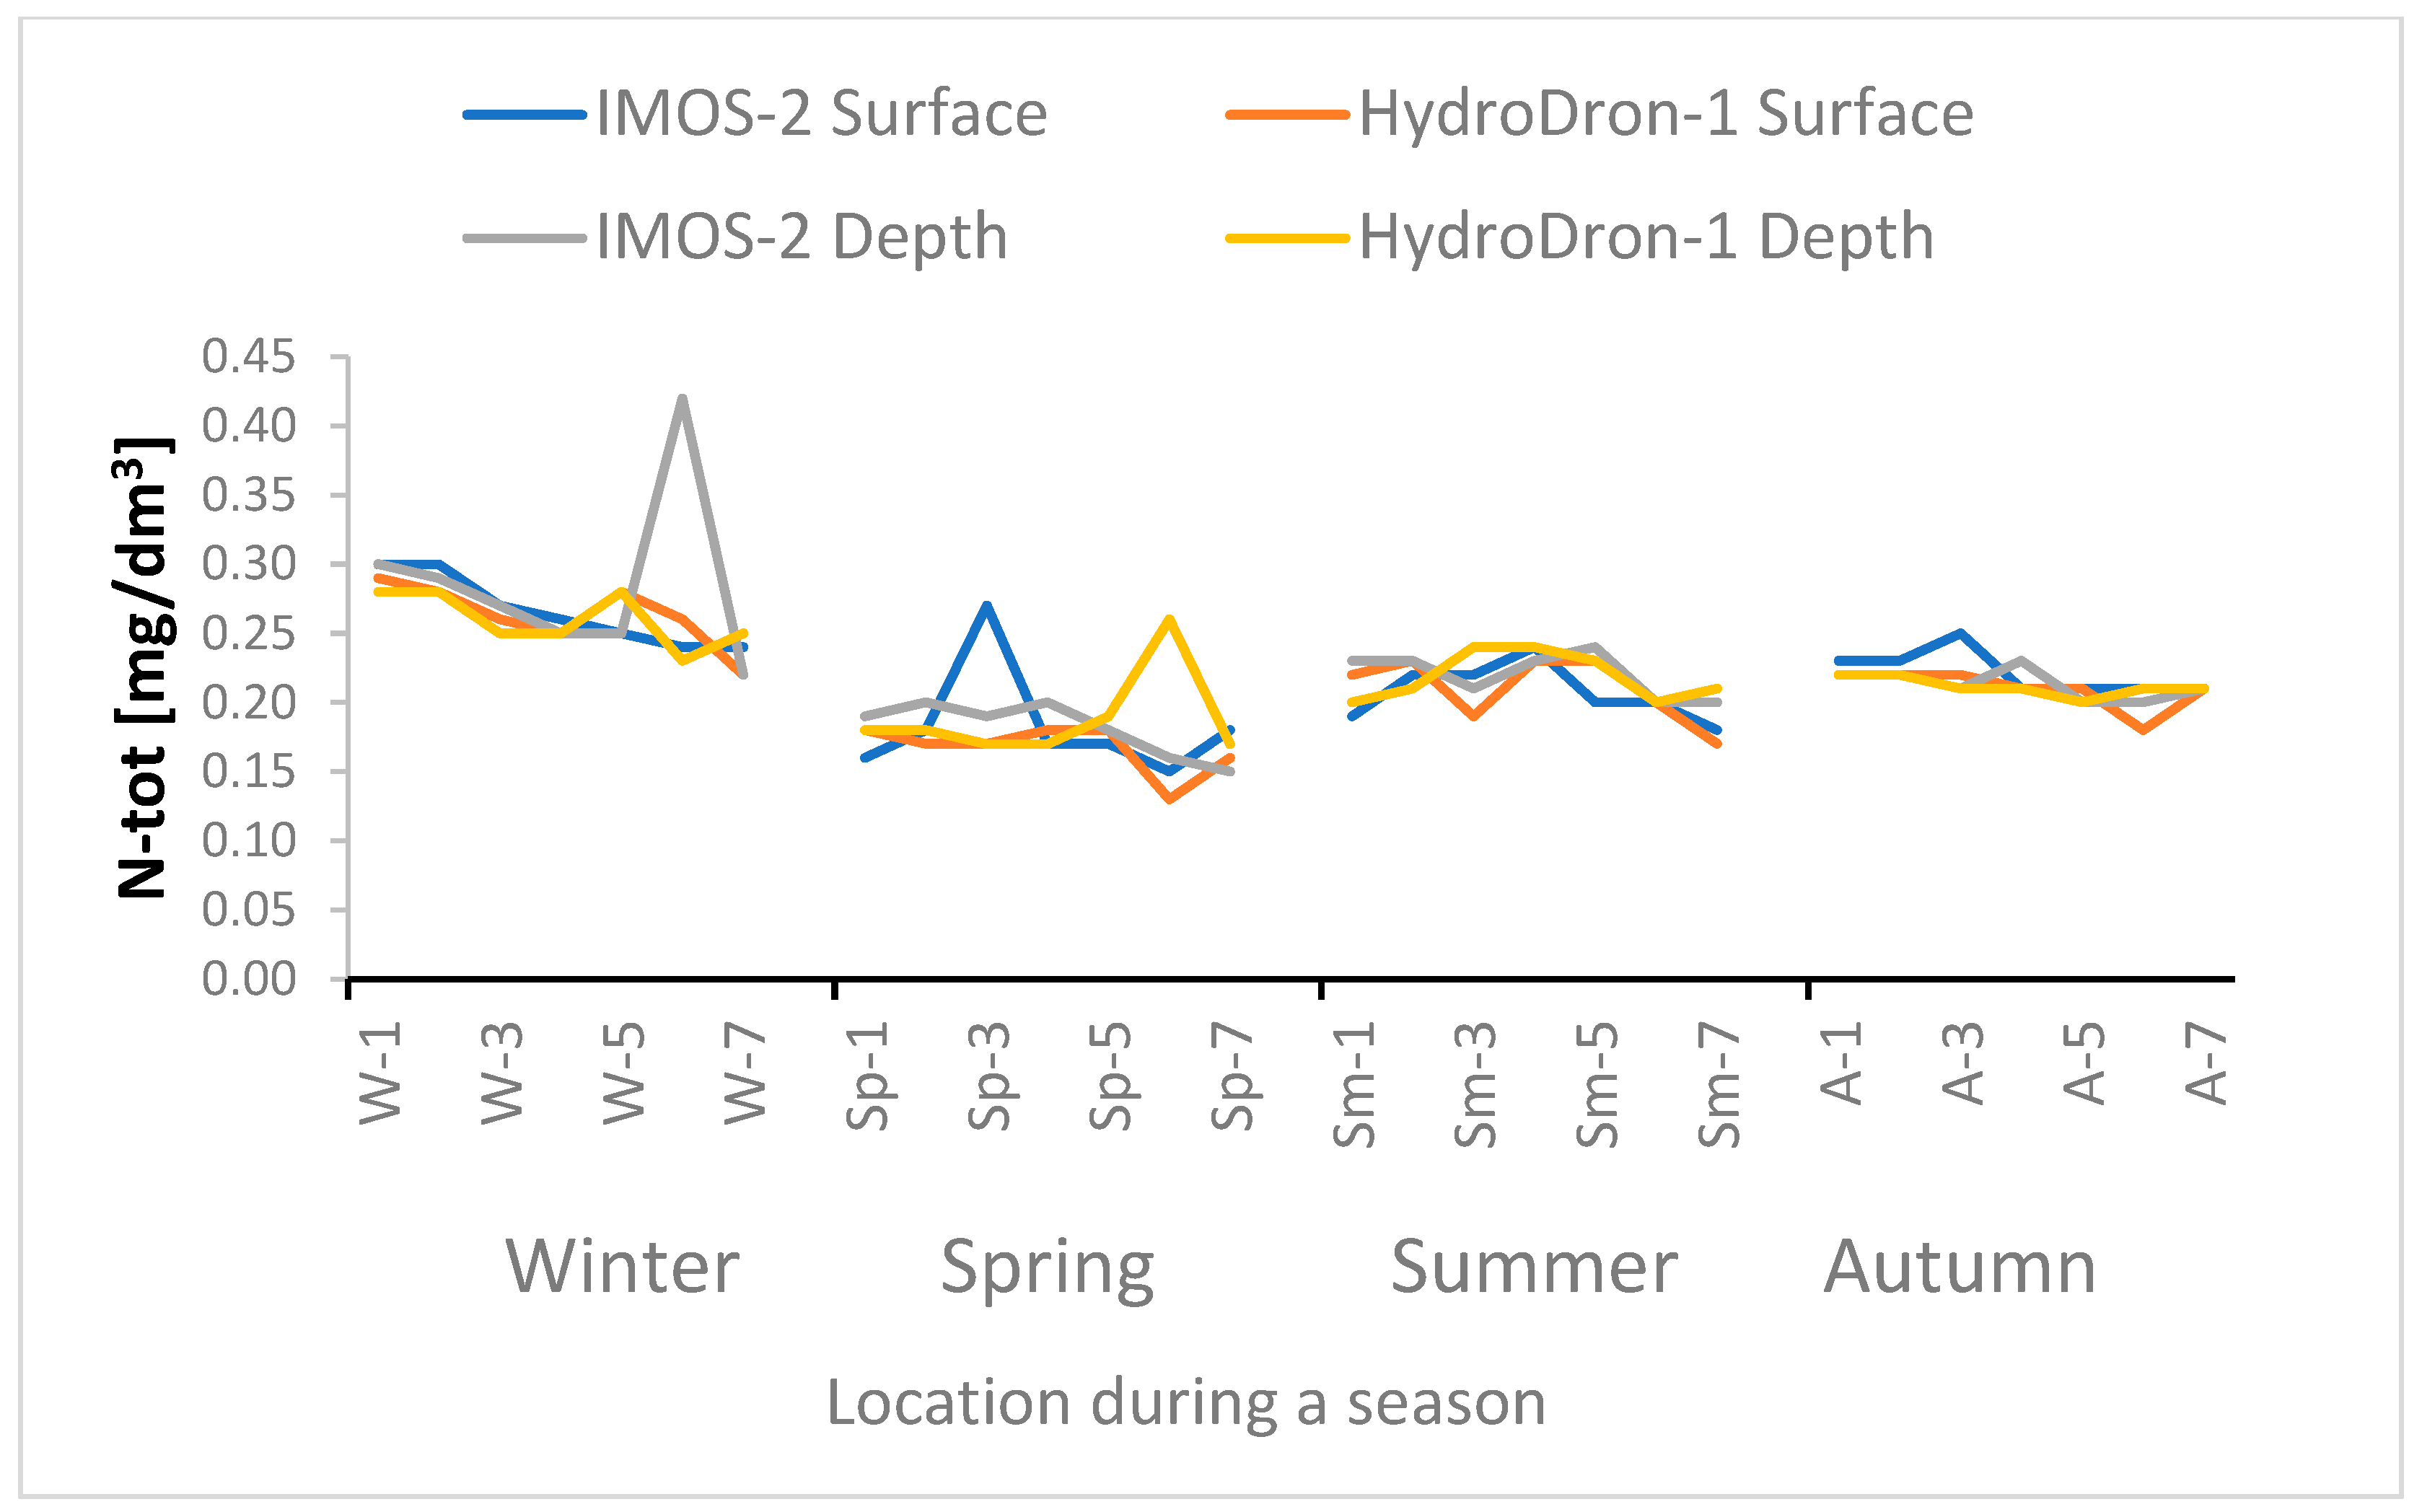
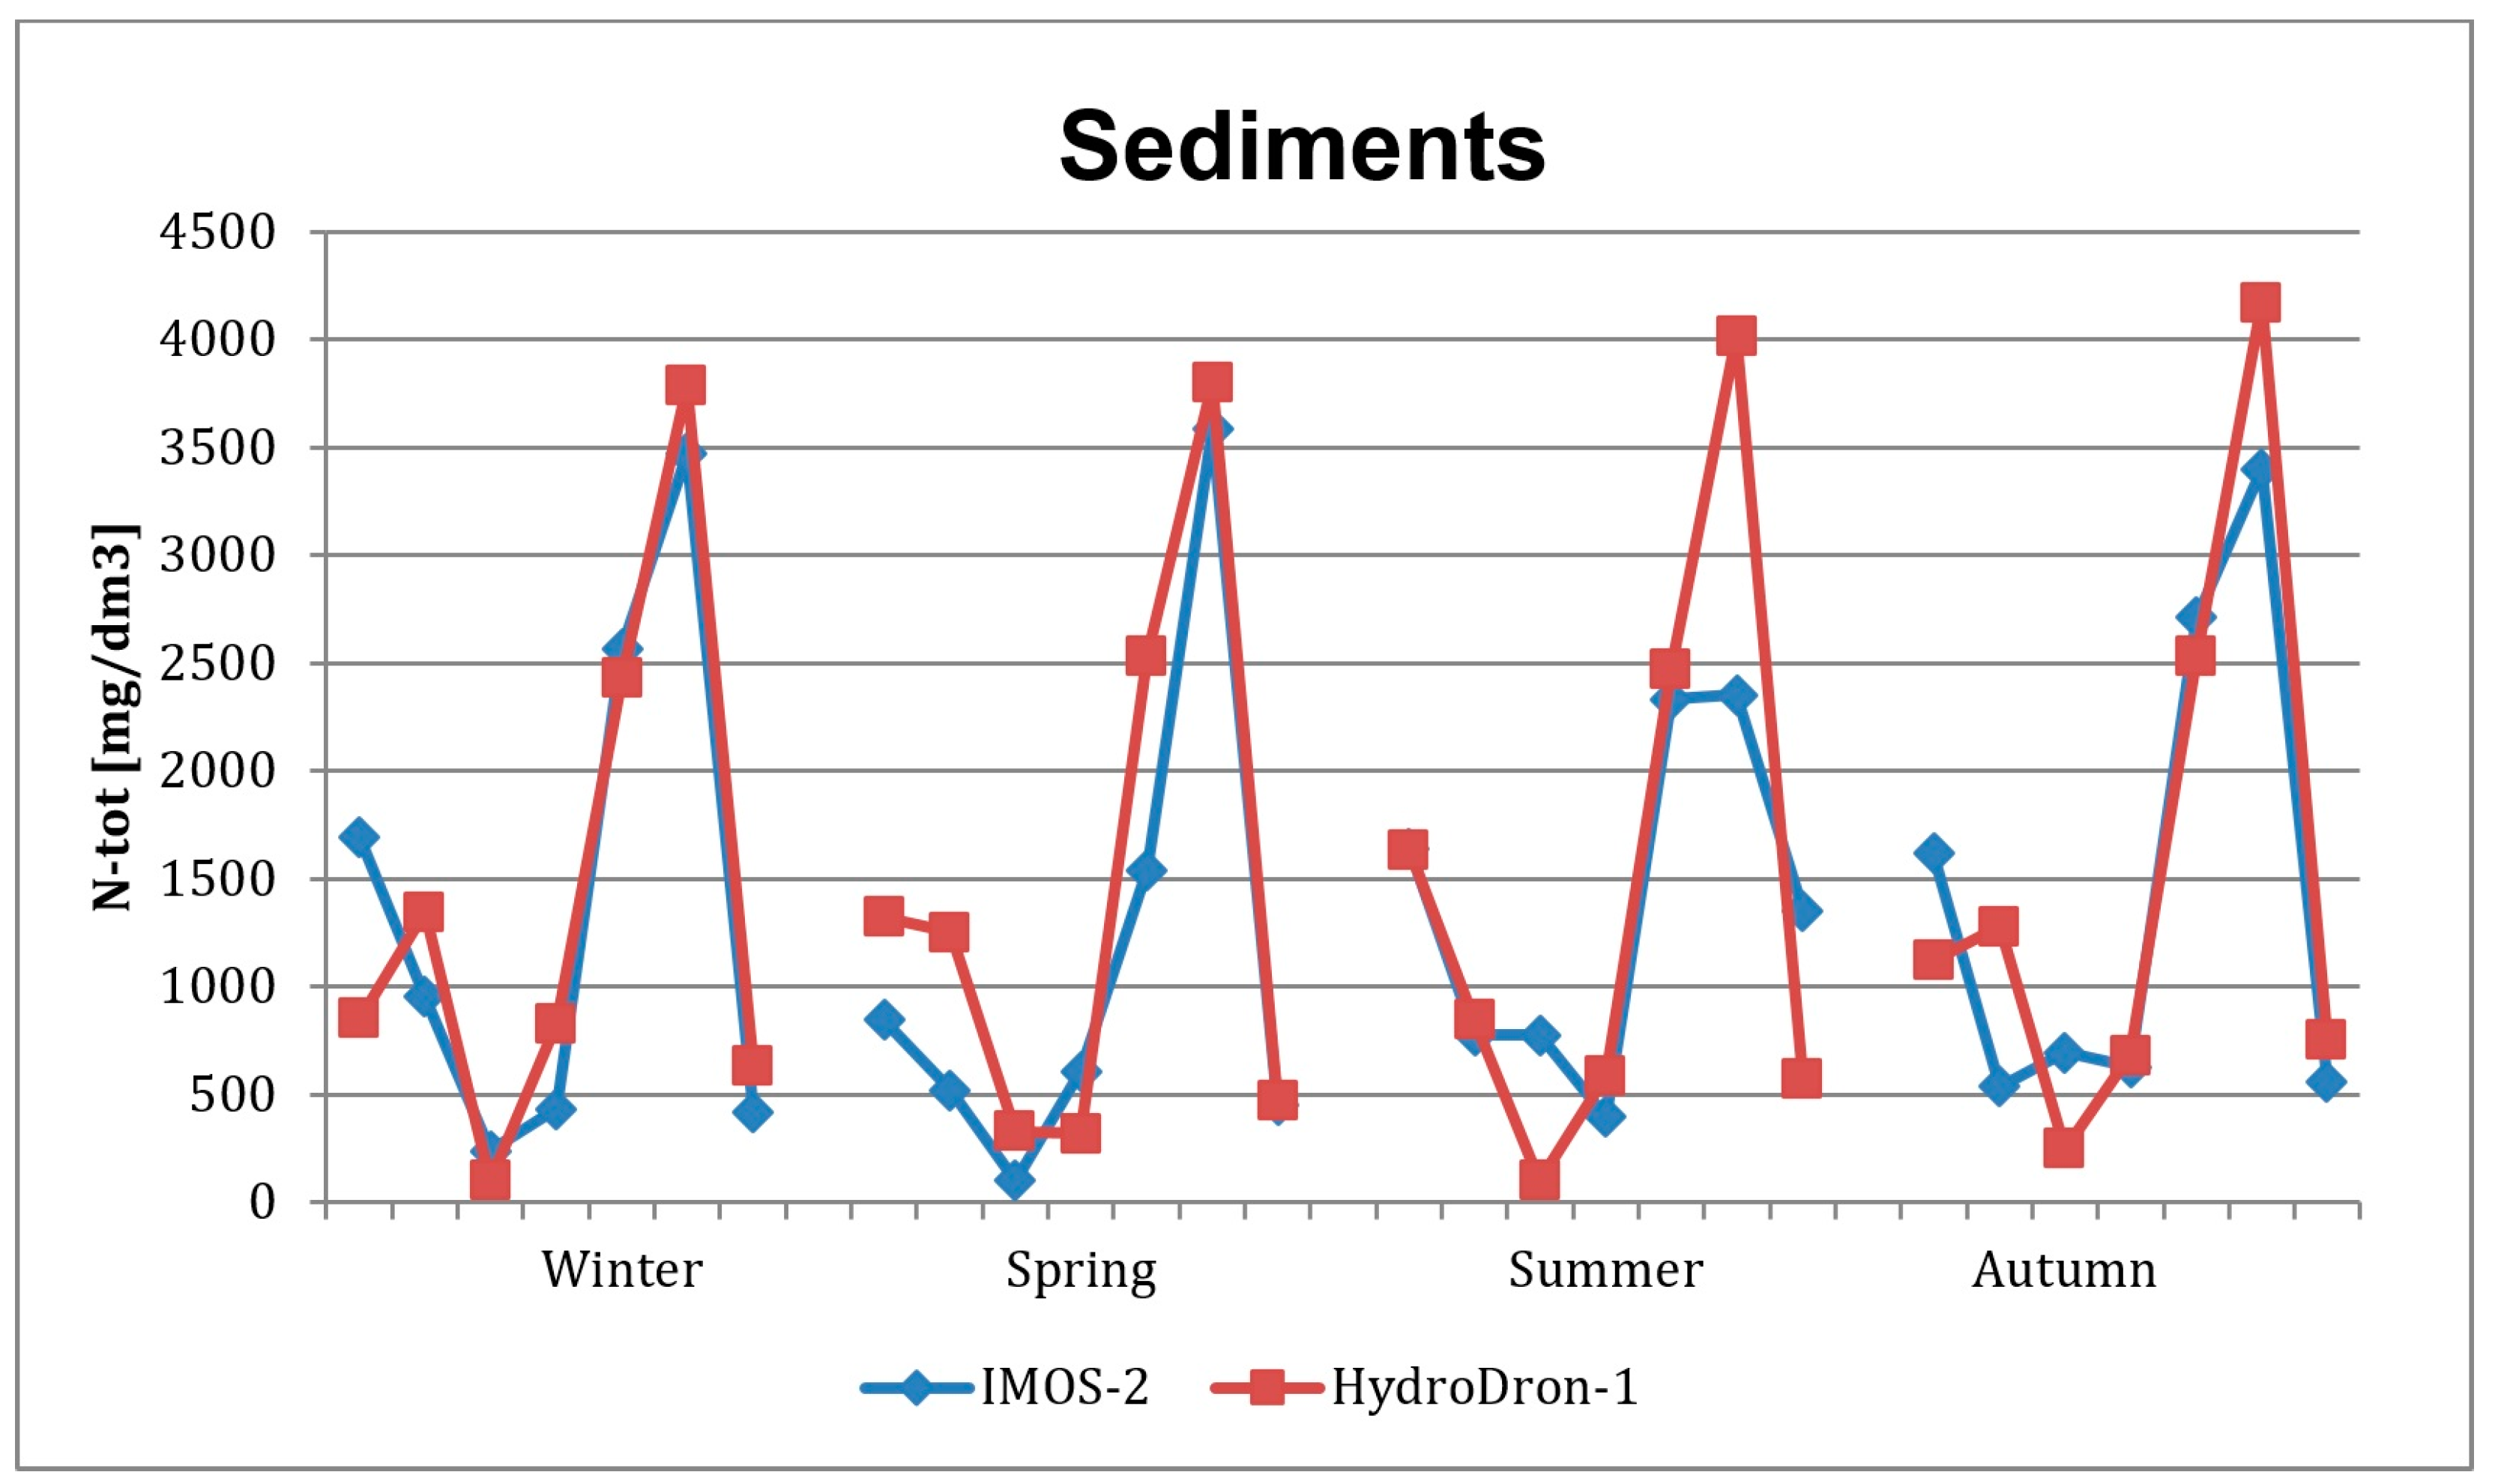
The larger values of the relative percentage difference were observed for the samples taken at the bottom. This difference is due to the fact that the samples from SVP Base X2 sonic measure in situ profiles of the temperature, electrical conductivity and pH of the water. People on the IMOS-2 boat measured temperature, electrical conductivity and water pH on land. All these parameters are characterized by high seasonal variability. The results obtained are consistent with the published monitoring data on port water quality on the Port of Gdynia website. These differences are not significant. The results are shown in Figure 4, Figure 5, Figure 6 and Figure 7, namely, for conductance (Figure 4), temperature (Figure 5), pH (Figure 6), and N-total (Figure 7). Figure 8 presents the results of N-total sediment samples.
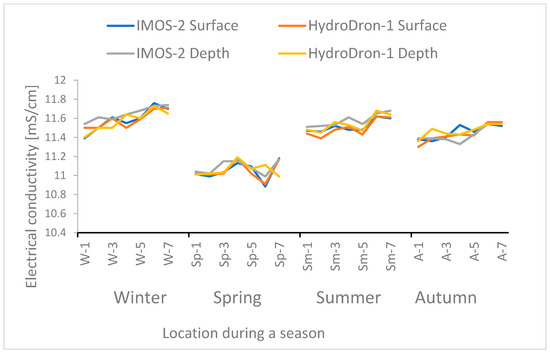
Figure 4.
Results of electrical conductivity (mS/cm) in surface and bottom water samples collected by HydroDron-1 and the IMOS-2 boat during four campaigns.
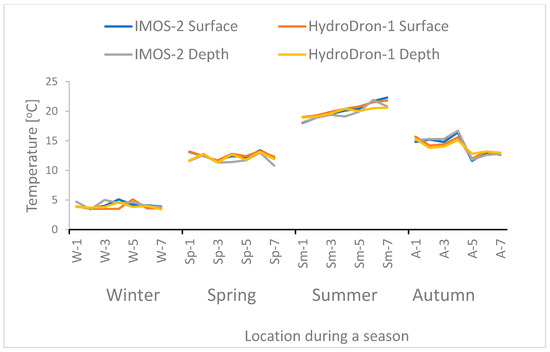
Figure 5.
Results of temperature (°C) in surface and bottom water samples collected by HydroDron-1 and the IMOS-2 boat during four campaigns.
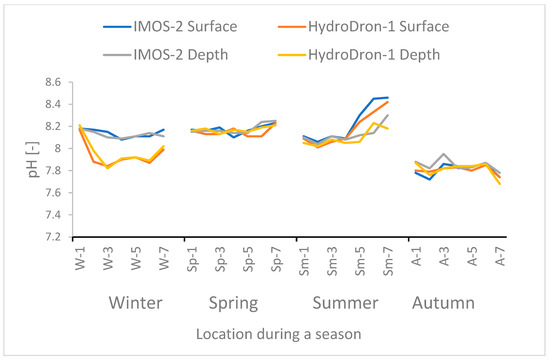
Figure 6.
Results of pH in surface and bottom water samples collected by HydroDron-1 and the IMOS-2 boat during four campaigns.
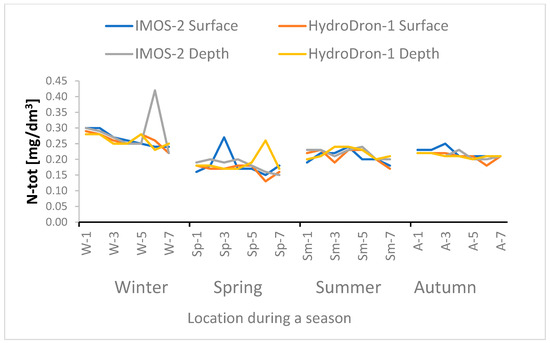
Figure 7.
Results of N-total (mg/dm3) in surface and bottom water samples collected by HydroDron-1 and the IMOS-2 boat during four campaigns.
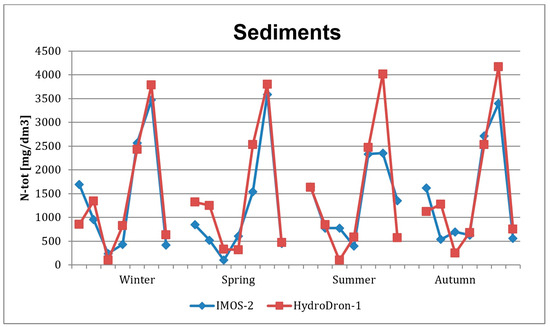
Figure 8.
Results of N-total in sediment samples collected by HydroDron-1 and the IMROS-2 boat during four campaigns.
Figure 5 clearly shows that in the first campaign, the response measured by the HydroDron-1 instrument underestimates the pH values (both surface and bottom). During the second campaign, measurements were carried out in parallel with GMU staff from Marine Technology. The reason for the irregularity was incorrect calibration of the HydroDron-1 measuring equipment. The HydroDron-1 operator made a mistake by not waiting for the result to stabilize and removing the electrode too early. At each depth, the sensors typically require a minimum of 2 min to stabilize. We have avoided this mistake in subsequent campaigns. The average total nitrogen concentration in water samples collected in the port of Gdynia was similar throughout the monitoring period [33]. The highest concentrations of total nitrogen were observed during the winter campaign. This is probably due to an increase in organic matter. Individual results deviating from this parameter, independent of the sampling method, are related to site specificity. They may be related to increased vessel traffic and marina activities (Figure 7).
The obtained test results for total nitrogen in sediments are at a similar level regardless of the collection method. The only exception is the point located in the marina area (Figure 8).
3.3. Spatial Interpolation of Measured Values
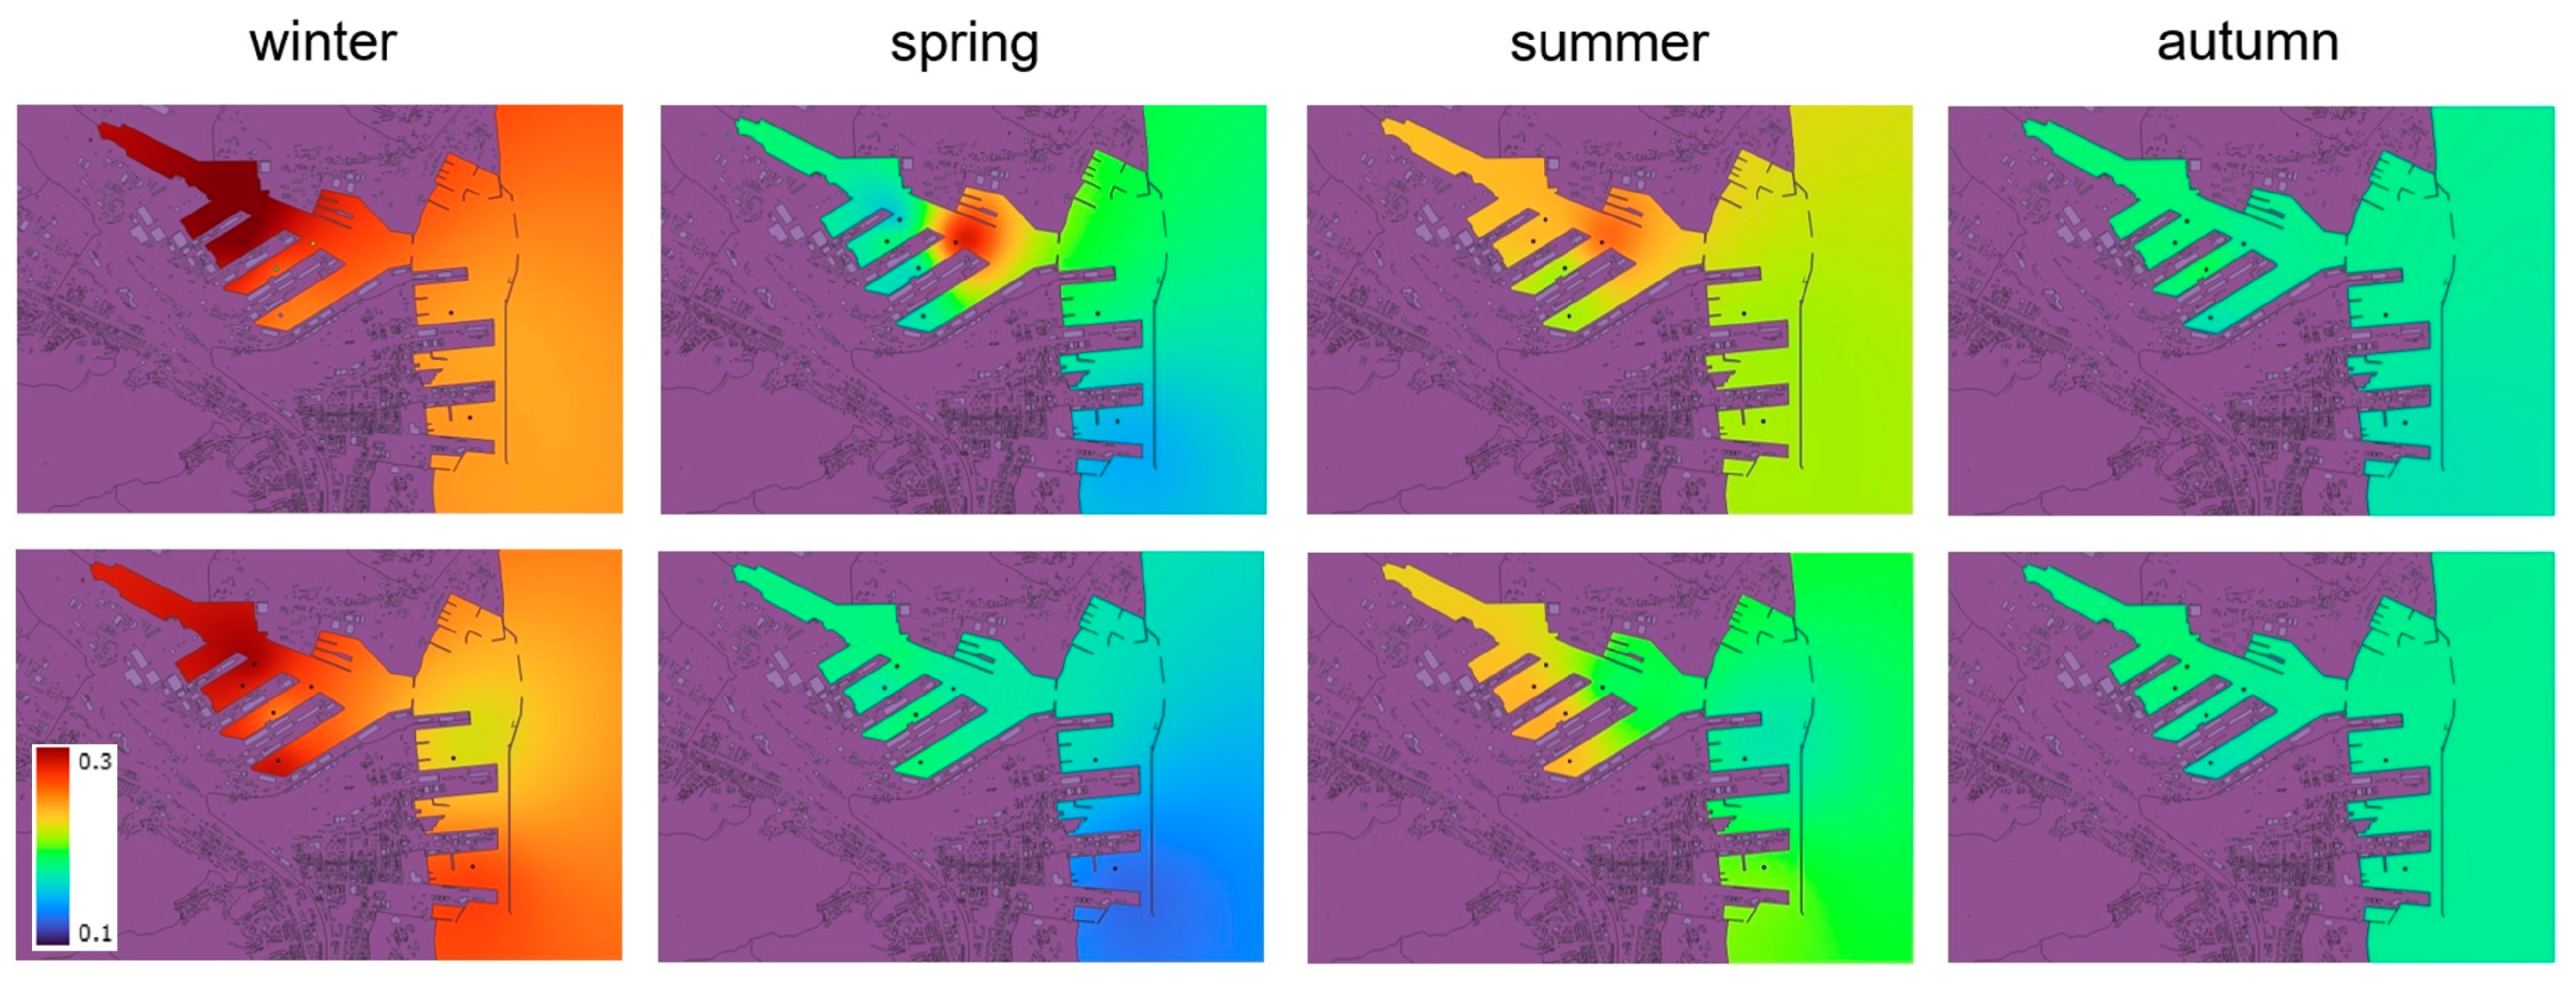
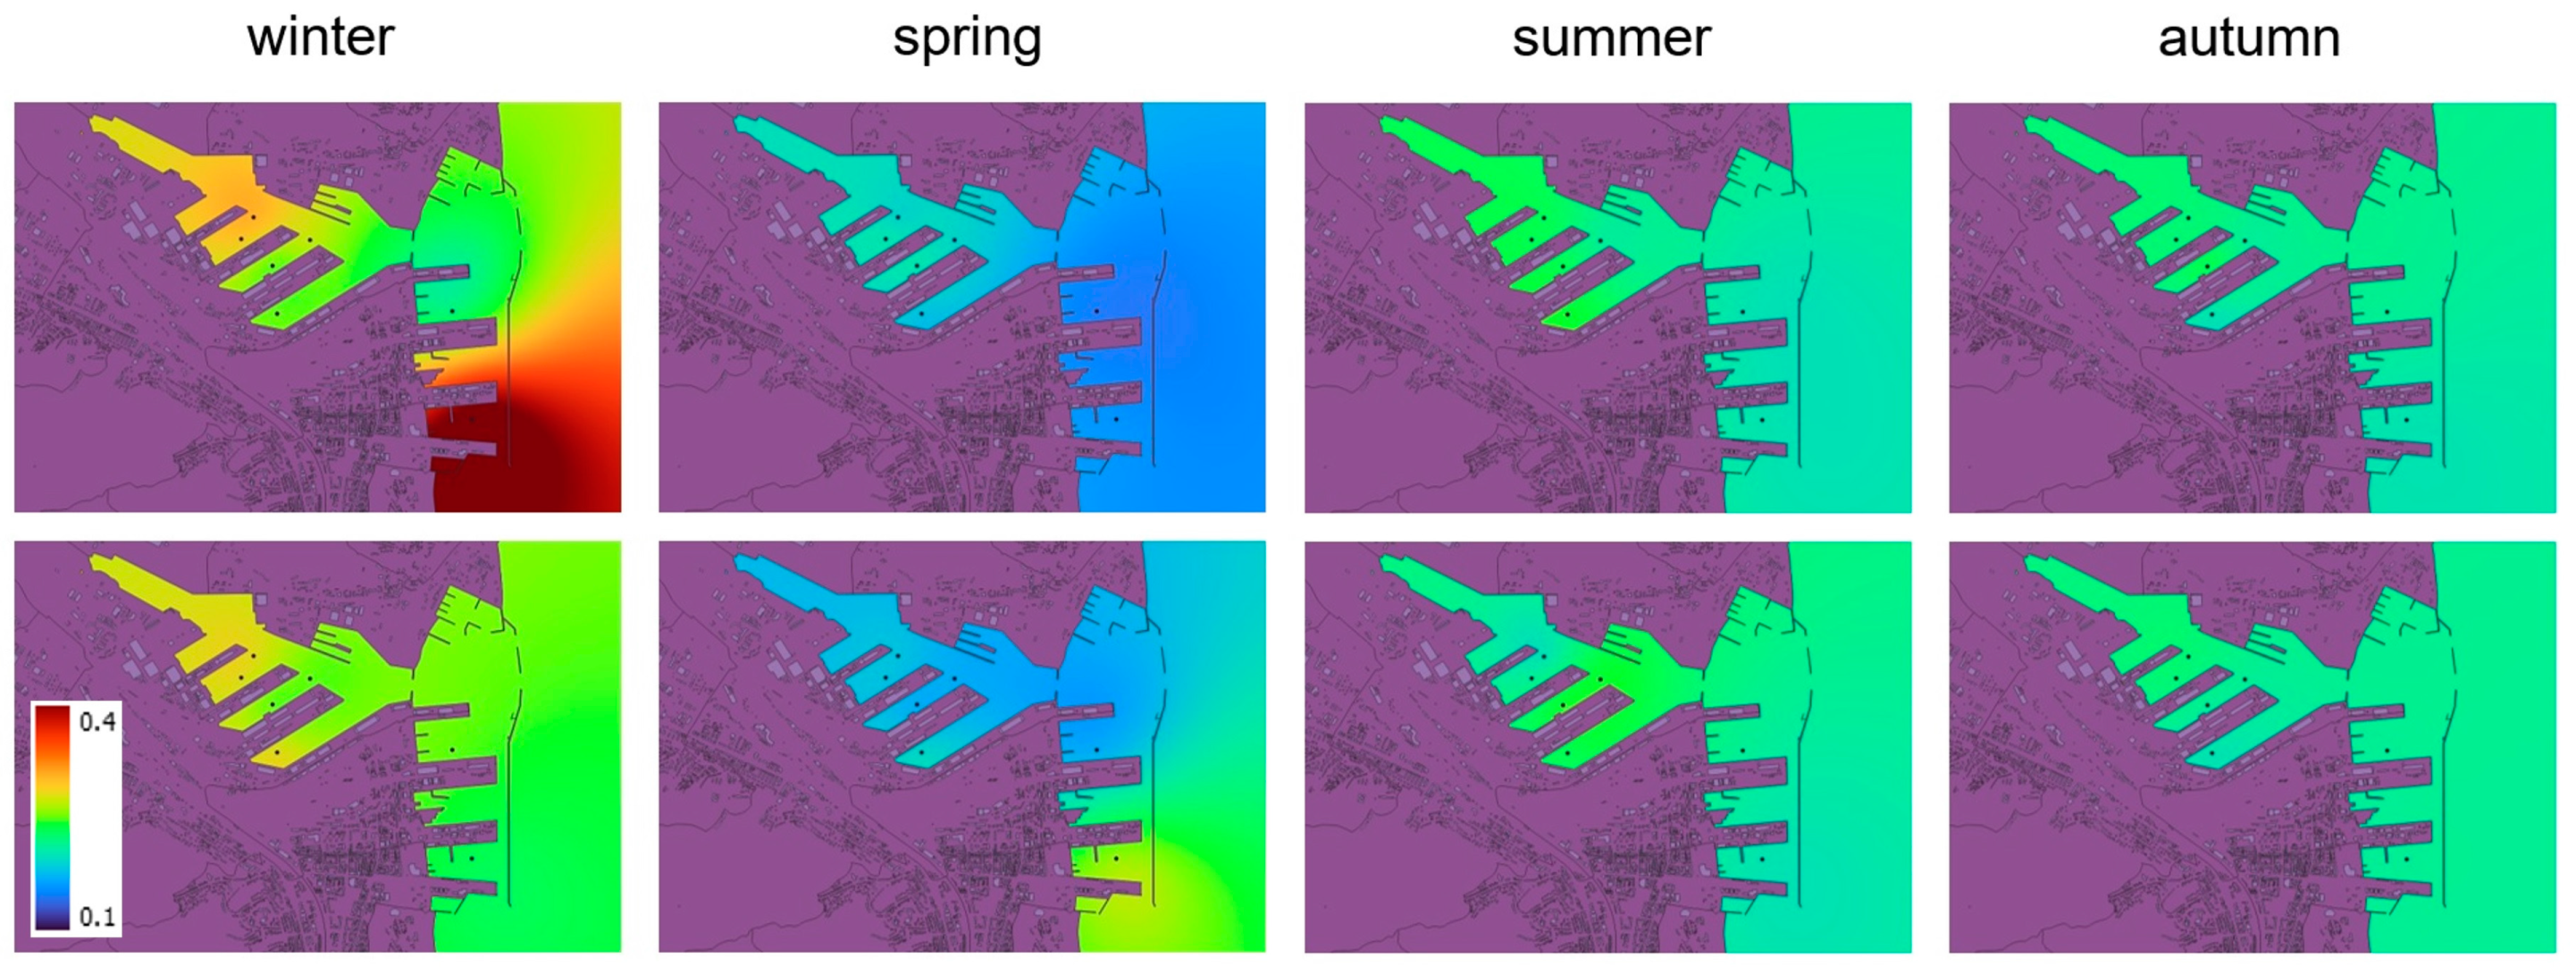
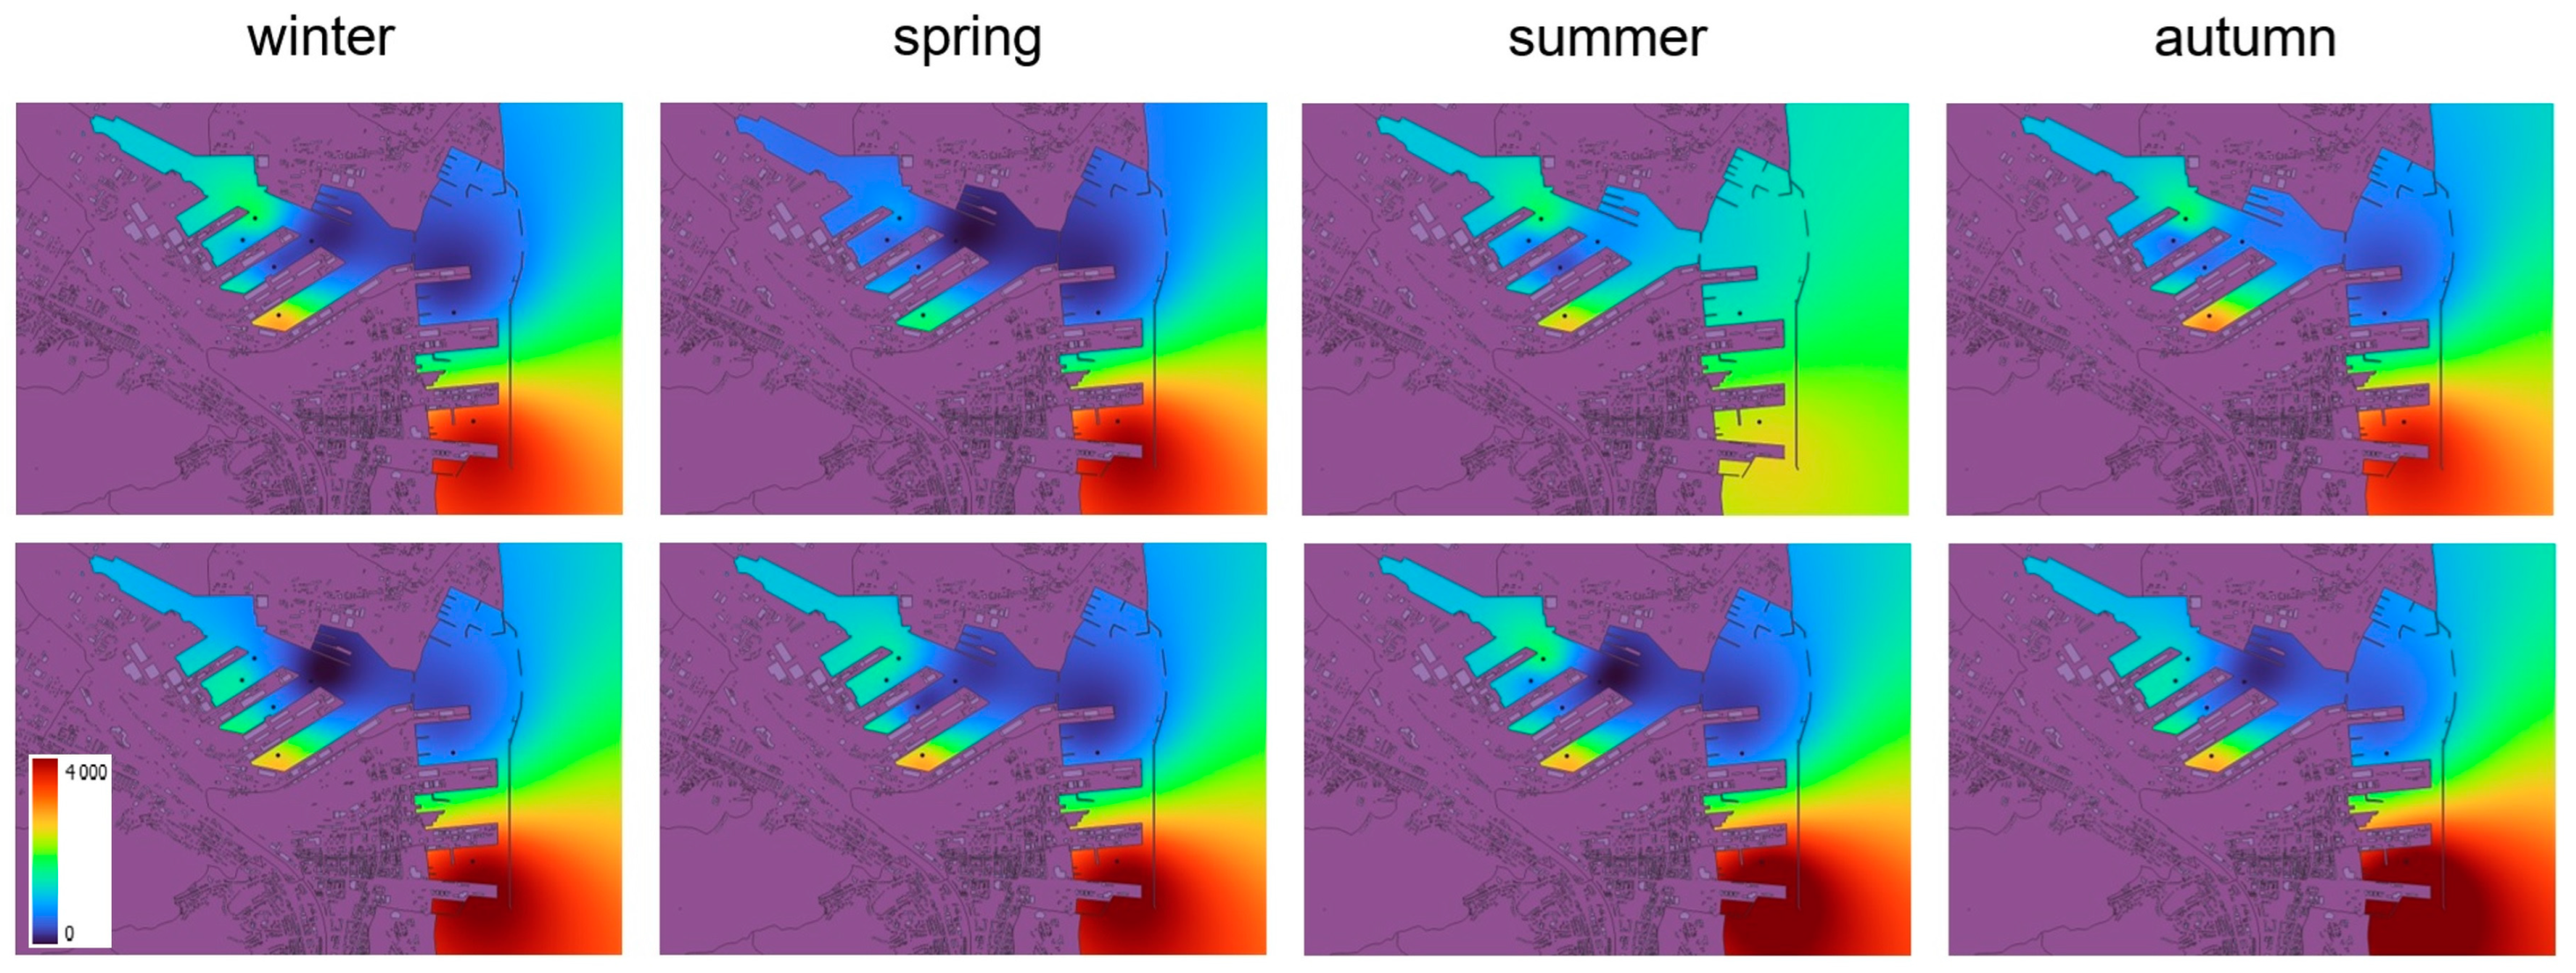
In addition, with an aid of QGIS v. 3.22.11 [34] and SAGA-GIS v. 7.8.2 [35] open software, spatial interpolations of the parameters presented above obtained for seven locations has been performed along with their approximation for the entire target area containing the water zone of the port. As an example, the results obtained for N-total, for both HydroDron-1 and IMOS-2 boat and for four campaigns, are presented in the form of maps in Figure 9 (surface water samples), Figure 10 (bottom water samples) and Figure 11 (sediment samples). The multilevel B-spline interpolation algorithm was used [36].
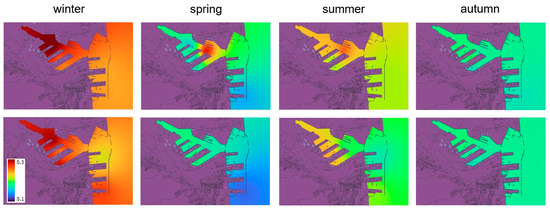
Figure 9.
N-total (mg/dm3) surface interpolation maps for the Port of Gdynia for 4 seasons: winter, spring, summer, and autumn. Top: IMOS-2 measurements, bottom: HydroDron-1 measurements.
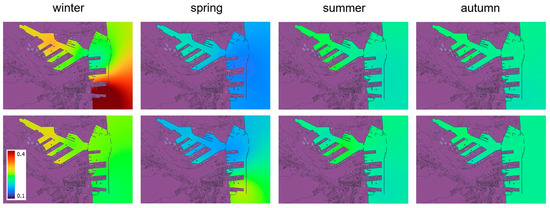
Figure 10.
N-total (mg/dm3) bottom interpolation maps for the Port of Gdynia for 4 seasons: winter, spring, summer, and autumn. Top: IMOS-2 measurements, bottom: HydroDron-1 measurements.
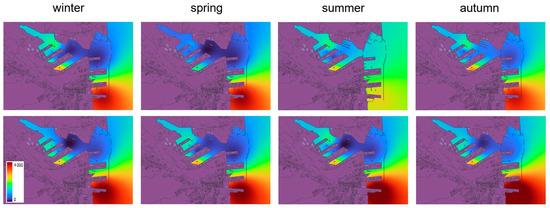
Figure 11.
N-total (mg/dm3) sediments interpolation maps for the Port of Gdynia for 4 seasons: winter, spring, summer, and autumn. Top: IMOS-2 measurements, bottom: HydroDron-1 measurements.
It may be noted that spatial interpolation allows the results to be presented in a clearer way and enables a broader interpretation of the obtained data. For both water and sediment, the results from both collection methods were at a similar level. However, as a result of the use of spatial interpolation, seasonal changes and outliers become more visible.
3.4. Pairwise Comparison of Values
Analysis of samples using two methods provides a number of pairs of results. To determine whether two methods are significantly different, we can look at the differences in the results within each pair. These differences within pairs will either be due to the presence of random errors only or will indicate a systematic error in one of the methods. Comparison of the data was performed using a statistical significance test: pairwise comparison of values [32]. The null hypothesis of this test is that two methods do not differ significantly in the value of intermediate precision of the determinations. The null hypothesis is rejected when the critical value of the t critical parameter (±95% confidence limits) is not less than the t experimental value. The test results are shown in Table 4.

Table 4.
Test results, pairwise comparison of values. A—acceptable (when texperimental < tcritical), UA—unacceptable (when texperimental > tcritical).
In the study carried out using the test method, it was found that the results of the analyses were not significantly different for the two sampling methods. Exceptions are parameters such as pH and dissolved oxygen in the bottom layer and total phosphorus in the surface layer. The failure to comply may be explained by the fact that all these parameters are characterized by temporal and spatial variability, sensitivity to temperature and seasonality. Seawater pH and dissolved oxygen decrease with depth, an effect which is linked to photosynthetic processes. There is therefore a correlation between oxygen concentration and pH. The occurrence of random errors is very likely due to the fact that some of the parameters determined were measured in situ and some were measured after the sample was brought ashore.
3.5. Sampling Uncertainty
The characteristics of samples collected manually and from an unmanned platform are comparable, and the uncertainty of the sampling process remains without significant differences at the maximum level for the most variable parameter: for sea waters—20% (nitrogen compounds), and for surface bottom sediments—30% (phosphorus compounds) (Table 5). The composite uncertainty of the sampling process was calculated by analyzing the differences between the results of measurements made using different techniques by different people for different parameters in an experiment involving sample replication. Conclusions are drawn based on analysis of variance (ANOVA).

Table 5.
Uncertainty of sampling for sea waters and bottom sediments.
4. Discussion
4.1. Methods for Estimating Sampling Uncertainty
Choosing the method for determining the main sources of sampling uncertainty leads to different methods for estimating them. Uncertainty estimation can be of two types: experimental and modelling. The experimental method involves multiple repetitions of the whole measurement, allowing the uncertainty of the final measurement to be estimated. The experimental conclusions are presented based on the results of the analysis of variance (ANOVA) [15,19,20,31]. Our project involved different people collecting samples from a site using different sampling techniques. To eliminate the effect of analytical bias between participants, all chemical analyses were performed within one laboratory. The sources of variation include temporal variation, spatial variation and variation between samplers. This represents the variability likely to be encountered in routine sampling. The known precision and uncertainty of the results of the determinations we obtained shall be used for the evaluation of the quality of the sampling procedure. Based on the experimental results, we performed a one-way ANOVA to determine the sampling uncertainty of HydroDron-1. Sampling uncertainty calculated by ANOVA at the maximum level for the most variable parameter is as follows: for marine waters—20%, and for surface bottom sediments—30%. A similar experiment was carried out as part of the German Marine Monitoring Programme for the North Sea and the Baltic Sea. In these studies, test ANOVA was also performed, and the combined sampling and analytical uncertainties accounted for up to 15% of the total variance [37]. However, it should be borne in mind that these calculations are based on the results of one research campaign and one season. Some of the parameters they considered were characterized by seasonal variability and some were stable over time, which affects the sampling uncertainty. Similar studies using the Matrice-HydraSleeve and boat-based methods were carried out on water samples collected from the Dillon Reservoir in Colorado, USA. Matrice-HydraSleeve connects an unmanned aircraft system to a commercial water sampler. There was less than 20% relative difference for Ca, Na, K, HCO3, SO4, Cl and Zn. In this case, the variability between parallel samples was also satisfactory [5]. However, the uncertainty of the download was not calculated in this example.
4.2. Others Unmanned Surface Vehicle
New technologies need to be developed to sample the water and sediment. Remotely operated water samplers on an unmanned surface vehicle (USV) are used to collect samples at multiple locations and depths. Traditional water sampling is correct but time consuming and dangerous [8,38,39]. USVs can take samples in remote locations, operate out of sight and collect samples without human intervention [40]. The results in that publication suggest that the two methods used to collect the data give comparable results. Other drones that came with the download were also tested successfully. In a freshwater lake in Virginia, USA, a remotely operated water sampling system on board a USV was used to collect and characterize microbes [41]. The Surveying Coastal Ocean Autonomous Profiler (SCOAP) is a large catamaran Marine Autonomous Surface Craft (MASC) for unattended, week-long, spatially explicit, multidisciplinary oceanographic water column profiling in coastal/estuarine waters. A first SCOAP trial at the Narragansett Bay estuary achieved success [42]. The University of South Florida’s unmanned surface vehicle with an underwater mass spectrometer was originally developed as an alternative for testing and deploying environmental and oceanographic instruments [9]. The prototype USV was also tested to perform unmanned water quality measurements using the re-inputted route, which showed good results in navigating and transmitting data. The USV can be used in stand-alone mode on bodies of still water such as lakes and rivers [43]. The growth in acceptance of unmanned systems has opened up the field for the use of USVs as a tool for environmental and ocean science. To improve our understanding of ecosystem change and the accuracy of our long-term predictions, such operations are needed in aquatic environments.
5. Conclusions
This paper discusses a water and sediment sampling method by HydroDron-1 that improves safety by eliminating the need for humans to access the water surface sample. Concentrations of different types of pollutants in water and sediments and physical water parameters were measured during sampling campaigns. Samples were collected by HydroDron-1 and the traditional boat of the IMOS-2 sampling. This body of work demonstrated that drone sampling can be used to collect surface water samples with a quality similar to those contained using boat-based sampling methods for lower cost and higher safety, mainly when applied in remote locations. It should be remembered that the need for human control of the operation of the sensors mounted on the platform and their systematic calibration is a limitation of automated methods.
Supplementary Materials
The following supporting information can be downloaded at: https://www.mdpi.com/article/10.3390/w16020252/s1, spreadsheets: water_sampling_data.xlsx and sediment_sampling_data.xlsx containing original measurement data on water sampling and sediment sampling respectively.
Author Contributions
Conceptualization, A.B., K.G.-T., A.F., A.C. (Andrzej Chybicki) and Z.Ł.; data curation, A.B., K.G.-T. and A.F.; formal analysis, A.B., J.K., D.O. and A.C. (Agnieszka Cichowska); funding acquisition, A.C. (Andrzej Chybicki) and Z.Ł.; investigation, A.B., J.K., D.O. and A.C. (Agnieszka Cichowska); methodology, A.B., K.G.-T., A.F. and Z.Ł.; project administration, A.B. and A.C. (Andrzej Chybicki); software, A.C. (Andrzej Chybicki); supervision, K.G.-T., A.F. and A.C. (Andrzej Chybicki); validation, A.B., K.G.-T. and A.F.; visualization, A.B. and Z.Ł.; writing—original draft, A.B., K.G.-T. and Z.Ł.; writing—review and editing, A.B., K.G.-T., A.F., A.C. (Andrzej Chybicki) and Z.Ł. All authors have read and agreed to the published version of the manuscript.
Funding
The project was implemented as a part of the POLNOR 2019 Call program, announced by Polish National Center for Research and Development (NCRD): “Marine port surveillance and observation system using mobile unmanned research units” NOR/POLNOR/MPSS/0037/2019.
Data Availability Statement
Data are contained within the article and the Supplementary Materials.
Conflicts of Interest
The authors declare no conflicts of interest.
References
- Popek, M.; Dereszewska, A.; Dembska, G.; Pazikowska-Sapota, G. The Impact of Transport on the Quality of Water in the Port of Gdynia. TransNav Int. J. Mar. Navig. Saf. Sea Transp. 2022, 16, 167–173. [Google Scholar] [CrossRef]
- Filipkowska, A.; Kowalewska, G.; Pavoni, B.; Łȩczyński, L. Organotin compounds in surface sediments from seaports on the Gulf of Gdańsk (southern Baltic coast). Environ. Monit. Assess. 2011, 182, 455–466. [Google Scholar] [CrossRef] [PubMed]
- Höglund, A.; Meier, H.E.M. Environmentally safe areas and routes in the Baltic proper using Eulerian tracers. Mar. Pollut. Bull. 2012, 64, 1375–1385. [Google Scholar] [CrossRef] [PubMed]
- Haseler, M.; Balciunas, A.; Hauk, R.; Sabaliauskaite, V.; Chubarenko, I.; Ershova, A.; Schernewski, G. Marine Litter Pollution in Baltic Sea Beaches—Application of the Sand Rake Method. Front. Environ. Sci. 2020, 8, 238. [Google Scholar] [CrossRef]
- Castendyk, D.; Voorhis, J.; Kucera, B. A Validated Method for Pit Lake Water Sampling Using Aerial Drones and Sampling Devices. Mine Water Environ. 2020, 39, 440–454. [Google Scholar] [CrossRef]
- Stateczny, A.; Burdziakowski, P. Universal Autonomous Control and Management. Pol. Marit. Res. 2019, 26, 30–39. [Google Scholar] [CrossRef]
- Du, Z.; Wen, Y.; Xiao, C.; Zhang, F.; Huang, L.; Zhou, C. Motion planning for Unmanned Surface Vehicle based on Trajectory Unit. Ocean Eng. 2018, 151, 46–56. [Google Scholar] [CrossRef]
- Yuan, S.; Li, Y.; Bao, F.; Xu, H.; Yang, Y.; Yan, Q.; Zhong, S.; Yin, H.; Xu, J.; Huang, Z.; et al. Marine environmental monitoring with unmanned vehicle platforms: Present applications and future prospects. Sci. Total Environ. 2023, 858, 159741. [Google Scholar] [CrossRef]
- Steimle, E.T.; Hall, M.L. Unmanned Surface Vehicles as Environmental Monitoring and Assessment Tools. In Proceedings of the OCEANS 2006, Boston, MA, USA, 18–21 September 2006. [Google Scholar] [CrossRef]
- Verfuss, U.K.; Sofia, A.; Harris, D.V.; Gillespie, D.; Fielding, S.; Jiménez, G.; Johnston, P.; Sinclair, R.R.; Sivertsen, A.; Solbø, S.A.; et al. A review of unmanned vehicles for the detection and monitoring of marine fauna. Mar. Pollut. Bull. 2019, 140, 17–29. [Google Scholar] [CrossRef]
- Bernabeu, A.M.; Plaza-Morlote, M.; Rey, D.; Almeida, M.; Dias, A.; Mucha, A.P. Improving the preparedness against an oil spill: Evaluation of the influence of environmental parameters on the operability of unmanned vehicles. Mar. Pollut. Bull. 2021, 172, 112791. [Google Scholar] [CrossRef]
- Stateczny, A.; Gierski, W. The concept of anti-collision system of autonomous surface vehicle. E3S Web Conf. 2018, 63, 00012. [Google Scholar] [CrossRef]
- Romano, A.; Duranti, P. Autonomous Unmanned Surface Vessels for Hydrographic Measurement and Environmental Monitoring. In Proceedings of the FIG Working Week, Rome, Italy, 6–10 May 2012. [Google Scholar]
- Polvara, R.; Sharma, S.; Sutton, R.; Wan, J.; Manning, A. Obstacle Avoidance Approaches for Autonomous Navigation of Unmanned Surface Vehicles. J. Navig. 2017, 71, 241–256. [Google Scholar] [CrossRef]
- Bodnar, M.; Konieczka, P.; Namieśnik, J. Sampling. In Analytical Separation Science; Anderson, J.L., Berthod, A., Pino, V., Stalcup, A.M., Eds.; Viley-VCH: Weinheim, Germany, 2016; Volume 5, pp. 1385–1400. [Google Scholar] [CrossRef]
- Giercuszkiewicz-Bajtlik, M.; Gworek, B. Experimental Methods of Evaluating Measurement Uncertainty Resulting from Sample Collection and Preparation for Analysis in Chemical Laboratories. Environ. Prot. Nat. Resour. 2014, 25, 21–25. [Google Scholar] [CrossRef][Green Version]
- Thompson, M. Uncertainty of sampling in chemical analysis. Accredit. Qual. Assur. 1998, 3, 117–121. [Google Scholar] [CrossRef]
- Ramsey, M.H.; Thompson, M. Uncertainty from sampling, in the context of fitness for purpose. Accredit. Qual. Assur. 2007, 12, 503–513. [Google Scholar] [CrossRef]
- Bruggeman, M.; Sneyers, L.; Gijsbrechts, W.; Loots, H.; Braekers, D.; Lecomte, M. Uncertainty due to primary sampling of 222Rn in analyses of water. Appl. Radiat. Isot. 2023, 196, 110741. [Google Scholar] [CrossRef]
- Glavič-Cindro, D.; Bruggeman, M.; Črnič, B.; Nečemer, M.; Petrovič, T.; Prem, P.; Vodenik, B.; Zorko, B. Comparison of different approaches of soil sampling uncertainty determination. Appl. Radiat. Isot. 2023, 194, 110676. [Google Scholar] [CrossRef] [PubMed]
- Ramsey, M.; Ellison, S.L.R.; Rostron, P. (Eds.) Eurachem/Eurolab/CITAC/Nordtest/AMC Guide: Measurement Uncertainty Arising from Sampling: A Guide to Methods and Approaches, 2nd ed.; Eurachem: Gembloux, Belgium, 2019. [Google Scholar]
- PN-EN ISO 5667-9:2005; Jakość Wody–Pobieranie Próbek–Część 9: Wytyczne Dotyczące Pobierania Próbek Wód Morskich. 2005. Available online: https://sklep.pkn.pl/pn-iso-5667-9-2005p.html (accessed on 6 January 2024).
- PN-EN ISO 10523:2012; Water Quality-Determination of pH (ISO 10523:2008). Available online: https://standards.iteh.ai/catalog/standards/cen/8e85ce30-e43b-4af1-a586-386403da6b56/en-iso-10523-2012 (accessed on 6 January 2024).
- PN-EN 27888:1999; Water Quality-Determination of Electrical Conductivity (ISO 7888:1985). Available online: https://infostore.saiglobal.com/en-au/standards/pn-en-27888-1999-922966_saig_pkn_pkn_2178929/ (accessed on 6 January 2024).
- PN-EN 1484:1999; Water Analysis-Guidelines for the Determination of Total Organic Carbon (TOC) and Dissolved Organic Carbon (DOC). Available online: https://standards.iteh.ai/catalog/standards/cen/7d0a16de-63ee-4536-a6f4-9ec990809a08/en-1484-1997 (accessed on 6 January 2024).
- ISO 17289:2014; Specifies an Optical Method for the Determination of Dissolved Oxygen in Water Using a Sensor Working on the Basis of Fluorescence Quenching. Available online: https://standards.iteh.ai/catalog/standards/iso/b79b1825-a85f-4d88-a351-10f34c61c803/iso-17289-2014 (accessed on 6 January 2024).
- PN-EN ISO 9377–2:2003; Jakość Wody-Oznaczanie Indeksu Oleju Mineralnego-Część 2: Metoda z Zastosowaniem Ekstrakcji Rozpuszczalnikiem i Chromatografii Gazowej. Available online: https://sklep.pkn.pl/pn-en-iso-9377-2-2003p.html (accessed on 6 January 2024).
- PN-EN ISO 5667-19:2006; Jakość Wody–Pobieranie Próbek–Część 19: Wytyczne Dotyczące Pobierania Próbek Osadów Morskich. 2006. Available online: https://sklep.pkn.pl/pn-en-iso-5667-19-2006p.html (accessed on 6 January 2024).
- PN-ISO 11261:2002; Jakość Qleby. Oznaczenie Azotu Ogólnego. Zmodyfikowana Metoda Kjeldahla. Available online: https://sklep.pkn.pl/pn-iso-11261-2002p.html (accessed on 6 January 2024).
- PN-EN ISO 16703:2011; Jakość Gleby-Oznaczanie Zawartości Węglowodorów w Zakresie od C10 do C40 Metodą Chromatografii Gazowej. Available online: https://sklep.pkn.pl/pn-en-iso-16703-2011e.html (accessed on 6 January 2024).
- Horricks, R.A.; Bannister, C.; Lewis-McCrea, L.M.; Hicks, J.; Watson, K.; Reid, G.K. Comparison of drone and vessel-based collection of microbiological water samples in marine environments. Environ. Monit. Assess 2022, 194, 439. [Google Scholar] [CrossRef]
- Hyk, W.; Stojek, Z. Analiza Statystyczna w Laboratorium Badawczym; Wydawnictwo Naukowe PWN: Warszawa, Poland, 2019. (In Polish) [Google Scholar]
- Badanie Wód Portowych. Available online: https://www.port.gdynia.pl/monitoring-srodowiska/badanie-wod-portowych/ (accessed on 29 November 2023). (In Polish).
- A Free and Open Source Geographic Information System. Available online: https://qgis.org/en/site/ (accessed on 29 November 2023).
- SAGA—System for Automated Geoscientific Analyses. Available online: https://saga-gis.sourceforge.io/en/index.html (accessed on 29 November 2023).
- Lee, S.; Wolberg, G.; Shin, S.Y. Scattered Data Interpolation with Multilevel B-Splines. IEEE Trans. Vis. Comput. Graph. 1997, 3, 228–244. [Google Scholar] [CrossRef]
- Gluschke, M. Collaborative sampling trial in the context of quality assurance in the German marine monitoring programme for the North Sea and the Baltic Sea. Accredit. Qual. Assur. 2008, 13, 101–107. [Google Scholar] [CrossRef]
- Stangl, M.J. An electrofishing raft for sampling intermediate-size waters with restricted boat access. N. Am. J. Fish. Manag. 2001, 21, 679–682. [Google Scholar] [CrossRef]
- Barrera, C.; Padrón Armas, I.; Luis, F.; Llinas, O.; Marichal Plasencia, G.N. Trends and Challenges in Unmanned Surface Vehi-cles (USV): From Survey to Shipping. TransNav Int. J. Mar. Navig. Saf. Sea Transp. 2021, 15, 135–142. [Google Scholar] [CrossRef]
- Powers, C.; Hanlon, R.; Schmale, D.G. Remote collection of microorganisms at two depths in a freshwater lake using an unmanned surface vehicle (USV). PeerJ 2018, 1, e4290. [Google Scholar] [CrossRef] [PubMed]
- Baker, D.G.L.; Eddy, T.D.; McIver, R.; Schmidt, A.L.; Thériault, M.H.; Boudreau, M.; Courtenay, S.C.; Lotze, H.K. Comparative analysis of different survey methods for monitoring fish assemblages in coastal habitats. PeerJ 2016, 4, e1832. [Google Scholar] [CrossRef]
- Codiga, D.L. A marine autonomous surface craft for long-duration, spatially explicit, multidisciplinary water column sampling in coastal and estuarine systems. J. Atmos. Ocean. Technol. 2015, 32, 627–641. [Google Scholar] [CrossRef]
- Demetillo, A.T.; Taboada, E.B. Real-Time Water Quality Monitoring For Small Aquatic Area Using Unmanned Surface Vehicle. Eng. Technol. Appl. Sci. Res. 2019, 9, 3959–3964. [Google Scholar] [CrossRef]
Disclaimer/Publisher’s Note: The statements, opinions and data contained in all publications are solely those of the individual author(s) and contributor(s) and not of MDPI and/or the editor(s). MDPI and/or the editor(s) disclaim responsibility for any injury to people or property resulting from any ideas, methods, instructions or products referred to in the content. |
© 2024 by the authors. Licensee MDPI, Basel, Switzerland. This article is an open access article distributed under the terms and conditions of the Creative Commons Attribution (CC BY) license (https://creativecommons.org/licenses/by/4.0/).

