Abstract
Spatio-temporal distribution and leachability of some trace elements (TE) were investigated in sediments of the Xiangjiang River, tributary of the Yangtze River. Based on data collected during 2015–2017, a literature review and geoaccumulation indexes, the pollution level was the highest for Cd, Sb and Hg (Igeo > 3). Over the period reviewed, the TE contamination level displayed almost no temporal variation but an obvious spatial distribution. The most upstream contamination hotspot (Cd > Cr > As, Cu, Pb, Zn > Hg, Sb) was the Songbai section. This hotspot did not spread further downstream. The second hotspot identified was the Zhuzhou–Xiangtan section, impacted by Cd > Hg, Pb, Zn > Cu, with the Zhuzhou area being particularly highly impacted by Pb and Zn. A 30-day leaching experimental protocol under aerobic and anaerobic conditions was carried out to access TE mobility. Low percentages of TE released were calculated, showing that the TE fate mostly depends on the stability of bearing phases under specific physicochemical and microbial conditions. In this case, the studied sediments can be an important sink for these TE. However, some environmental issues have to be considered as some leachate concentrations of contaminants (As, Cr, Cu and U) released into water exceed freshwater aquatic life criteria.
1. Introduction
Contamination by trace elements (TE) has received considerable attention in recent decades due to their ubiquitous distribution, persistence and toxicity in all reservoirs such as water, soil, sediment, dust, crops and plants [1,2]. As the major sink for TE, sediments are generally studied to assess the record of historical contamination [3]. They also act as potential secondary pollution sources through physical disturbance (e.g., sediment management and reworking), mineral transformation, and seasonal changes through biological activity, pH and redox variations [4,5,6,7]. Therefore, at a basin scale, sediments play a significant role, controlling the fate of TE throughout their geochemical cycle.
In the Yangtze River basin (Figure 1a), the largest drainage basin in China with a population of more than 400 million [8], its second largest tributary in terms of surface runoff is the Xiangjiang River [1,9,10], located in the middle of the Yangtze basin and connected to the Dongting Lake (Figure 1b). Due to the abundance of ore deposits, the Xiangjiang River basin hosts numerous mining, smelting, metallurgical and manufacturing activities and the entire region has suffered from severe heavy metal contamination for decades [1]. From 1996 to 2000, the watershed received about 12 t Hg, 96 t Cd, 881 t Pb and 630 t As from industrial wastewater, representing around 98%, 80%, 90% and 91% of the provincial discharge, respectively [11]. Between 2001 and 2006, the Xiangjiang River surface water was contaminated by As, Cd, Hg and Cr6+, ammonia-nitrogen, and total phosphorus [12]. During this period, ecological problems increased in this river basin, including “blood lead” and “cadmium rice” [13,14]. Considerable and strict controls for industrial inputs into the Xiangjiang River have been undertaken by the government over the last 10 years and these have significantly improved the air and water quality in the basin [15,16]. However, as TE are mainly trapped in sediments after entering the aquatic environment, how the contamination patterns in sediments will develop is poorly understood, especially regarding the spatio-temporal aspects and transfer into water.
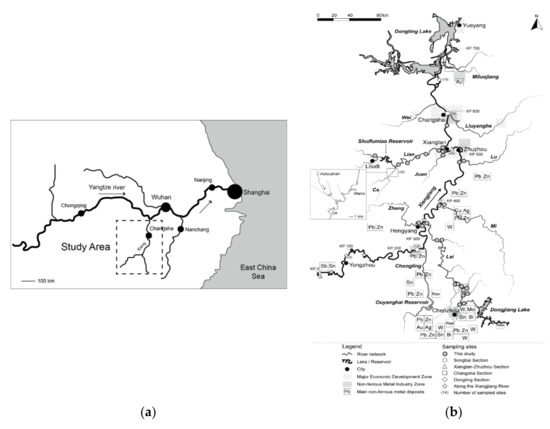
Figure 1.
Study area in the Yangtze river basin (a) and sample localization (b) in this study and from the literature review used in this study. KP = kilometric point. Ferrous metals refer to Cr, Fe, Mn, Ti, V and their alloys, such as steel, pig iron, ferroalloys. Nonferrous metals refer to Al, Bi, Cd, Co, Cu, Hg, Ni, Pb, Sb, Sn, Zn. Localization information is detailed in Table S1a,b.
Numerous spatial studies (Table S1a) have been conducted to evaluate the sediment quality of the Xiangjiang River. This study is, however, the first review of all the available datasets and has two aims: (1) to assess the spatial changes in TE enrichment in the Xiangjiang River basin sediments from up- to downstream over the last decade and (2) to evaluate the mobility of some TE from sediments sampled in the identified contamination hotspot based on a 30-day leaching experiment under aerobic and anaerobic conditions.
2. Materials and Methods
2.1. Study Area
The Xiangjiang River, which is 948 km long with a catchment area of 94,721 km2 [15,17], is one of the major tributaries of the Yangtze River in terms of surface runoff [1,9,10,18] (Figure 1a). Mostly located in Hunan province, it flows from south to north through several main cities such as Yongzhou, Hengyang, Zhuzhou, Xiangtan and Changsha, and finally runs into Dongting Lake and the Yangtze River (Figure 1b). The area has a typical subtropical monsoon climate with an average temperature of 16–18 °C and mean annual precipitation of 1200–1700 mm [19], leading to a distinct flood season from April to September. The annual runoff of the river is above 60–70 × 109 m3/y with strong weathering and erosion [20,21,22] and an average annual suspended sediment concentration ranging between 100 and 170 mg/L [23,24]. The composition of the surface water is mainly Ca2+-HCO3−, mostly oxidized and neutral (river water pH is around 7.0–7.6) [22].
The geology of the upper Xiangjiang River basin is dominated by Devonian sandy shales and Devonian-Carboniferous limestones. The middle and lower reaches (up to Zhuzhou) of the basin are mainly composed of granite and Mesozoic-Cenozoic sandstone; and downstream of Zhuzhou, thick Quaternary sediments dominate [25]. This geological diversity contributes to the variety and richness of ore deposits in Hunan province (Figure 1b). Hunan has a long mineral exploration and utilization history over the past 2500 years [26,27] and it is still one of the largest non-ferrous metal mining, processing and production regions in China [28]. In 2015, the provincial coal production was 36.5 million tons, 90% of which was mined in the Xiangjiang River watershed [29]. In 2017, over 4000 mining companies each had annual sales of more than 20 million yuan. Activities of these mining companies, including mineral mining, dressing, smelting, processing and manufacturing, correspond to 25% of the Hunan industrial output [30]. The production of pig iron, crude steel and rolled steel were about 20 million tons each while the nonferrous metal production (Cu, Al, Pb, Zn, Ni, Sn, Sb, Hg) reached 2 million tons [30].
As a densely populated and economically developed area in the province, the Xiangjiang River watershed has 17 national development zones (shown as major economic development zones in Figure 1b) and currently 11 nonferrous metal industry zones [31,32], mostly located along the mainstream of the river (Figure 1b). Since the 1950s, the province has developed a variety of intensive but mostly small-scale industrial companies with a lack of pollution treatment. In 2011, in Hunan the amount of major heavy metals discharged through wastewater was estimated to be almost 150 tons of As, Cd, Cr, Hg, and Pb [33]. Moreover, the basin is one of the major agricultural areas in Hunan [34], one of China’s largest rice-producing provinces. Fertilizers used in the basin amounted to 120 million tons for the 1952 to 2016 period [35], with an increase in pesticide application, maintained above 100,000 tons every year after 2004 [36,37,38].
2.2. Sample Collection and Analytical Methods
A total of 37 sediment samples were collected in the Xiangjiang basin during the dry season between 2015 and 2017. The sampling survey covered typical sections of the basin (Figure 1b): the first covered specific mining areas, mainly in the Lian sub-basin, to characterize sediment composition influenced by coal, Pb-Zn and gypsum mining activities; the second was selected up- and downstream of cities and major tributary confluences on the mainstream of the Xiangjiang for industry- and urban-influenced sediments; the third survey was carried out in the most upstream tributary of the basin, the Lei River, to investigate sediment quality potentially impacted by different mining inputs (mostly coal, Bi, Sb and W) [39,40]. For each survey, the top-10 cm surface sediments were collected at each site from the bank by an Uwitec coring device and stored in polyethylene plastic bags at 4 °C in the dark. Once in the laboratory, samples were air-dried for 2 days. Particle size analyses were performed on fresh sediment aliquots after a 1-min ultrasonic step with a Malvern Mastersizer 2000 laser diffraction microgranulometer. Samples with a cumulative volumetric percentage of clays and silts (fraction < 63 µm) below 80% were sieved through < 63 µm disposable Nylon mesh. The chemical composition was then determined either on the silty bulk fraction or on the < 63 µm fraction in order to limit grain-size and mineralogy effects on TE concentrations and to compare site-to-site chemical composition. About 0.5 g of sediment was digested in a Teflon beaker in a tunnel oven with LiBO2–Li2B4O7 according to the protocols of the French national research facility SARM-CRPG (helium.crpg.crpg-nancy.fr/SARM). The resulting solutions were dried, and the residues were completely re-dissolved in HNO3 acid. The total contents of major and minor elements were analyzed using ICP-AES (Jobin-Yvon 70), and trace elements using ICP-MS (Perkin Elmer 5000), except for Hg, which was analyzed using cold vapor AAS (Perkin Elmer 5100). All the analyses were quality-checked with one reference sample out of every ten and internal reference materials. The accuracy was within 5% of the certified values. Among the trace elements studied, uncertainties were as follows according to the range of sample concentrations: ±20–30% for As; ±5–15% for Cd; ±5–10% for Cr, ±5% for Cu, Co, Ni and U; ±10% for Pb; ±25% for Zn. Total carbon (TC), total organic carbon (TOC) and total sulfur (TS) were analyzed by O2 flow combustion at 1450 °C using a LECO SC 144 DR.
2.3. Leaching Experiments
To quantify TE mobility, two series of batch experiments were conducted over 30 days under agitation (100 rpm) to mimic river leaching dynamics. They were designed with a sediment/deionized water ratio of 1:10 at room temperature (20 °C to 23 °C) in open glass beakers for aerobic conditions and O2-free tubes for anaerobic conditions. For the latter, dissolved O2 was removed, by flushing with deionized water and N2 for 12 h. At different time steps (1 h, 6 h, 12 h, 24 h, 10 d, 20 d and 30 d), pH, electrical conductivity (EC) and temperature were recorded in the corresponding leachate for each series; one blank was also run to assess TE-free leaching conditions, and was treated and analyzed as a 30-day sample.
At each step, leachate was filtrated through a 0.45 µm cellulose acetate membrane and the filtrate kept at 4 °C until analysis. For anaerobic conditions, each experimental step was carried out under an N2 atmosphere in a glove box. Nitrate, chloride and sulfate concentrations were measured just after the filtration using ionic chromatography with uncertainties of about ±1 × 10⁻⁶, ± 4 × 10⁻⁶, and ± 2 × 10⁻⁵ mol L−1, respectively. Dissolved organic carbon (DOC) was determined on a Shimadzu TOC/TN analyzer via non-purgeable organic carbon (NPOC) measurement that involves acidification, sparging (inorganic carbon removal) and combustion of the sample at 680 °C. The standard solution used as a calibration preparation was potassium hydrogenophtalate. The accuracy of DOC concentration measurements was ±0.5–1 mg L−1 estimated on blank samples. To estimate the total dissolved organic nitrogen (DON) content, total dissolved nitrogen (TDN) was measured in filtered solution using the total nitrogen unit. The DON was calculated as the difference between total dissolved nitrogen (TDN) and nitrogen-nitrate (N-NO3−) concentrations.
Other major element concentrations were determined using ICP-OES and TE concentrations by ICP-MS at the French national research facility SARM (helium.crpg.crpg-nancy.fr/SARM). International geostandard SLRS-5 and internal references were used to check the accuracy and reproducibility of the results. Typical measurement uncertainties were ±5% for Si, Mn, Mg and Na; ±2–5% for K and Ca; ±15% for Fe and Al. Analytical uncertainties were in the same range as for sediment protocol.
3. Results and Discussion
3.1. Spatial and Temporal Trends of Trace Element Enrichment in Surface Sediments
Concentrations of major and trace elements of surface sediments of the Xiangjiang River and its tributaries are listed in Table 1. In the Xiangjiang mainstream, all the sampled sediments are mainly Si-Al rich sediments (SiO2: 60.4–68.7%; Al2O3: 10.2–18.8%), with very low carbonate content (total inorganic carbon TIC < 0.6%), and low organic matter and sulfur contents (TOC < 1.2%, TS < 0.07%). In addition to this 2015–2017 survey, sediment TE composition was reviewed with validated literature data (Table S1a) in order to (i) evaluate the spatial distribution of TE enrichment and identify TE hotspots, and (ii) assess temporal changes in these identified hotspots along the mainstream of the Xiangjiang River. Trace elements were all compared to local background concentrations. Background values in the Xiangjiang River sediments and soil were mainly investigated in the 1980s [20,21,22,41,42,43]. Most of the background values used in this study were referenced from the archives of the Hunan government (Hunan Record: Construction record—Environmental protection [44]) or from medians calculated from data in the literature [24,42,43,45,46,47]. All these values were in the same order of magnitude (Table 1 and Table S2). The geo-accumulation index Igeo [48] was calculated as follows to compare the contamination level of heavy metals using datasets from different surveys with various information about sedimentary matrixes (mineralogy, grain-size and major elements):
with Cn the measured concentration of TE in the sample and Bn the local background value (Table 1. Trace elements with an Igeo value over 1 can be considered potentially enriched, with regard to the geochemical background. It was calculated for the dataset collected in this study and the review data in the literature (n = 90; Table S1a) for the most and the least regularly surveyed TE: (As, Cd, Cr, Cu, Pb and Zn) and (Co, Hg, Ni, V, Sb and U), respectively.
Igeo = log2 (Cn/1.5Bn)

Table 1.
Major (%wt) and trace element (mg/kg except Hg in ng/kg) concentrations in the Xiangjiang surface sediments during the 2015–2017 survey.
According to the data for the period 2004–2016 reviewed (Figure 2 and Table S3), among all the available TE, the Xiangjiang River sediments were mostly impacted by Cd with more than 50% of Igeo values over 4. The hotspots for Cd were localized in the Songbai section (downstream from the confluence with the Chongling River to KP 300) and between KP 500 and 650, the Zhuzhou–Xiangtan–Changsha section (Figure 2). The second most enriched TE over this period were Sb and Hg. Igeo values of Sb mostly ranged between 1 and 3 and, among all the data available, the most Sb enriched area was around KP 300 with 3 < Igeo < 5. Mercury was enriched throughout the length of the Xiangjiang River with 3 < Igeo < 5 and a significant Hg hotspot could be identified between KP 500 and 650, like for Cd (Igeo > 5).
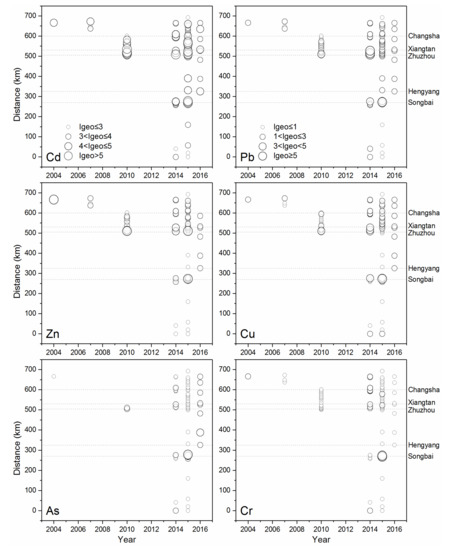
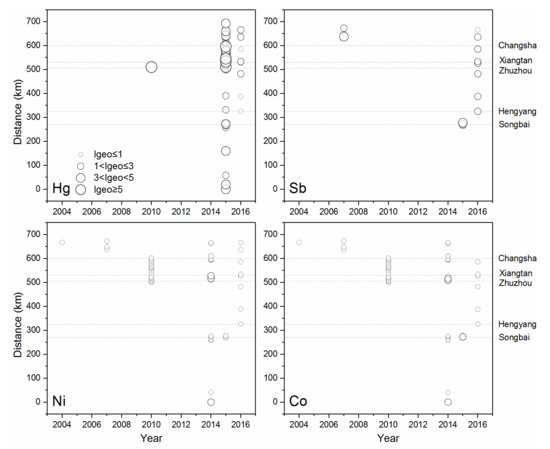
Figure 2.
Spatial and temporal distribution of geo-accumulation indexes Igeo for some selected trace elements in the mainstream sediments of the Xiangjiang River, based on this study and a literature review (Table S1). All the elements use a geochemical background level, defined locally (Table S2). Igeo scale is the same except for Cd. Songbai: KP 270, Hengyang: KP 325, Zhuzhou: KP 505, Xiangtan: KP 530, Changsha: KP 600.
For As, Cr, Cu, Pb and Zn, about 50% of Igeo values were below 1 and the other half were in classes [1,2,3]. Two major hotspots with Igeo values greater than 5 were located at KP 300 for all these TE and between KP 500 and 550, the Zhuzhou–Xiangtan section, for all except As.
The Igeo values of Co, Cr, Ni, U and V were below 1. The mainstream of the Xiangjiang river was not impacted by these TE, except for Cr, for which a hotspot could be clearly identified at KP 300.
The heavy metal contamination in the Xiangjiang mainstream thus displayed an obvious spatial distribution (Figure 2). The most upstream contamination hotspot was the Songbai section, affected by all of the TE studied (Cd > Cr > As, Cu, Pb, Zn > Hg, Sb). This hotspot was highly localized to this area and did not spread further downstream, probably in relation with the presence of a large hydropower dam further downstream. The second hotspot identified was the Zhuzhou–Xiangtan section, impacted by Cd > Hg, Pb, Zn > Cu and, in particular, the Zhuzhou area strongly impacted by Pb and Zn. This hotspot spread downstream to Changsha for Cd and Hg. No enrichment for As or Sb was identified in this section. The major types of industry in the Zhuzhou–Xiangtan section are metallurgy, chemical and production of building materials, with a series of industries in development including electric power, coal, textile, electronics and leather [49]. This area is one of the largest Pb-Zn smelting industry centers in China [50]. In particular, in 2005 the Zhuzhou smelter in the city produced 0.327 million tons of Zn and 0.096 million tons of Pb; in the early 2000s, it emitted around 30 tons of contaminant metals annually, constituting over 90% of the total emission in the city of Zhuzhou [28].
Over the 2004–2016 period reviewed, Igeo values were widely scattered and any temporal trend is difficult to highlight (Figure 2). The rapid development in Hunan province mostly relied on heavy industries like mining and smelting, mineral exploitation and utilization [26]. By 2015, there were over 6900 active mines in the province with an annual quantity of solid ore mining reaching 232 million tons [27]. This development period can be linked to an environmental impact that was uncontrolled at the province scale despite considerable measures being undertaken to limit heavy metal emissions in recent decades. It is worth noting that the contamination of sediments by Cd remained high over the 2004–2016 period. The main contamination hotspot in the Zhuzhou–Xiangtan section for Cd, Cu, Hg, Pb and Zn was already present in 2010 and it seemed to decline slightly according to the 2015–2016 Igeo values. Further studies are required in the Songbai and the Zhuzhou–Xiangtan sections to clearly quantify the temporal changes in sediment quality in the near future in relation to these many management actions.
3.2. Identifying the Main Activities Influencing Sediment Quality
Mining, smelting and industrial activities (Table S1) have been established along the Xiangjiang River and its tributaries since the 1950s. They have been very important to the local economy and usually contributed to the development of urban zones (Figure 1). In this paper, we determined the influence of these anthropogenic activities on surface sediment quality by chemically characterizing different anthropogenic outputs from samples originating from areas dedicated to specific activities (this study), and also from a review of data in the literature.
Data were divided into 10 categories according to local features of representative areas (Table 2). Detrital inputs (n = 8) were associated with background values of the basin [1,2,45,46,47,51,52,53,54]. The agricultural activity category (n = 11) [1,2,46,47,55,56] was linked to sediments collected in the most downstream part of the Xiangjiang River basin around the inlet mouth of Dongting Lake where there is a distinctive agricultural area (Figure 1). Samples from the Loudi section (n = 4) [57] were categorized as smelting activities because the Fe-smelting plant is still the major industry in the city of Loudi, which has been operating for about 60 years [57,58]. Similarly, samples from the Zhuzhou (n = 16) [1,45,47,54,59,60] and Songbai sections (n = 26) [1,47,55,61,62] were also categorized as smelting activities as these two cities are the biggest typical mining–smelting regions of the basin. The Ce river basin has been home to a cluster of lead, zinc and gypsum mining districts since the 1950s [26] and thus sediment samples collected downstream of Pb-Zn mining sites of the Ce basin were used to represent mining activities (n = 7). Samples belonging to the urban category were those collected near cities (mainly Changsha and Xiangtan) [1,45,47,51,54,55], receiving pollution from both domestic and industrial activities (n = 32). Sediments of Xiangjiang river and its tributaries were not categorized as their chemical compositions reflect several and various anthropogenic influences.
Table 2.
Chemical categorization of sediment composition representative of potential anthropogenic activities and natural inputs in the Xiangjiang River basin associated with samples from this study and literature references (n = 149).
Based on this sample categorization for each type of major activity, a principal component analysis was first performed with all samples available (n = 149) in the Xiangjiang River basin (this study, [1,47,55]). Information about As, Hg, V and Sb could not be included as a lot of data was missing and not replaced by any other data. As shown in Table 3, the first three principal components explained 87% of the variation in the variables. The first principal component (PC1) with 52% variance had positive loadings on all TE except for Cr, indicating that Cd, Cu, Pb, Zn may come from common anthropogenic activities. The second principal component (PC2) explained almost 20% of the total variance, with a positive loading on Cr, confirming that Cr had a different origin to the other TE group (Cd, Cu, Pb, Zn). The third principal component (PC3) with 15% of the variance was characterized by the positive loadings on Pb and Zn (weak) and negative loadings on Cd and Cu. This indicates that these two clusters (Pb, Zn) and (Cd, Cu) may be related to different anthropogenic sources. According to these PC analyses combined with scatter plots (Figure 3), it can be concluded that Pb and Zn concentrations in the Xiangjiang sediments are largely influenced by mining activities (the most concentrated samples) and smelting activities, both in Zhuzhou and Songbai. They are represented with a Zn/Pb ratio higher than 1. The behavior of Cr, highlighted alone, shows that its enrichment in sediments is mainly associated with smelting activities in Songbai. Sources of Cd and Cu are mainly related to smelting activities in Zhuzhou and in Songbai, with a Pb/Cd ratio close to 10 and a Zn/Cu ratio close to 5, and it is clear that mining activities do not influence the Cd or Cu sediment quality. Categories such as agricultural activities, urban and detrital inputs do not appear to contribute significantly to sediment quality, at least for the TE investigated here.
Table 3.
Principal component analysis for Cd. Cr. Cu. Pb and Zn in the sediments from the Xiangjiang River basin (n = 149).
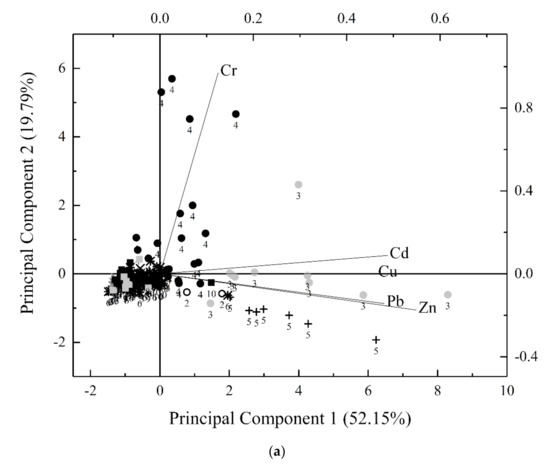
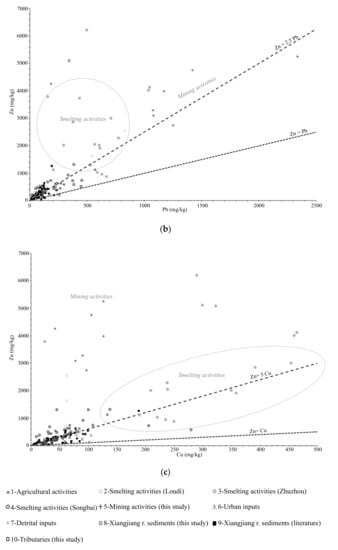
Figure 3.
Principal component analysis biplot (a), Pb-Zn (b) and Cu-Zn scatterplots (c) for surface sediments from the Xiangjiang River basin (n = 149). Same legends for Figure 3a–c. See text for sample category definition and Table S1a,b for sample details.
Large numbers of companies that discharge into the environment are located along the rivers in the Xiangjiang River basin [63]. Intensive (Pb/Zn) mining and smelting activities of nonferrous metals dominate as one of the main industries and are still very active, typically leading to Pb and Zn pollution, accompanied by Cd, Cu, As, Hg, Sb, depending on the parent materials, technology and products [64]. The complex processes and huge production scale of iron and steel production also have a severe impact on the local environment by emitting certain TE (e.g., Fe, Mn, Cd, Cu, Pb, Zn, As, Sb, Cr and Ni [65]). A variety of TE in coal and coal byproducts can also be released into the environment during coal production and utilization [66,67]. Although heavy metal emission inventories have improved over the last decade, the heavy metal pollution from mining and smelting activities in the basin is still an ecological challenge for the local environment [15].
3.3. Trace Element Release from Sediments to Surface Water
Quantifying the release of TE from surface sediments is one way to predict the potential impact on surface water and associated living biota when sediment storage conditions vary. Batch leaching experiments over 30 days under aerobic and anaerobic conditions were performed on studied sediments to assess the short-term leachability of TE. Leaching experiments were performed on representative sediment of the studied basin, namely the XIA-1 sample, one of the most TE-enriched, particularly for Cd (Table 1).
The pH conditions remained alkaline for both aerobic and anaerobic conditions. The pH values were originally 7.8 and 8.0, respectively. Under aerobic conditions, pH increased and stabilized at around 8.2, while it decreased slightly by 0.5 to stabilize at 7.8 by the end of the anaerobic experiment. For both conditions, EC started at around 190 μS/cm and followed the same pattern, increasing up to 377 and 354 μS/cm, respectively, by the end of the experiments. Some mechanisms such as organic matter degradation and mineral alteration occurred to explain the changes of these two parameters over time. Hence, organic matter degradation can release DOC and total dissolved nitrogen (TDN = NO3 + DON). DOC values ranged between 25 and 50 mg/L for both experiments, showing no clearly defined increase except at the end of the anaerobic experiment, rising to 80 mg/L (Table 4). TDN values clearly increased, evidencing this organic matter degradation. This mechanism can also release some sulfate and its concentration increased under both conditions. However, sulfate variations were not considered as a proxy for organic matter degradation as, in relation to the Xiangjiang basin geology, part of the sulfate released could originate from gypsum dissolution and/or from sulfide oxidation, especially under these aerobic conditions [41,68,69]. No data was available to distinguish the three sources of sulfate in this study.
Table 4.
Changes over time of the chemical composition of the leachate during (a) aerobic and (b) anaerobic batch experiments of a representative surface sediment of the Xiangjiang River basin.
Temporal trends of major and trace element release can highlight the fate of different types of TE-bearing phases and the potential release or trapping of these TE. Firstly, under both leaching conditions, released Si, Na and K concentrations were significantly correlated with each other, but very poorly correlated with Al (Figure 4a). Dissolved Si, Na and K concentrations all increased by at least a factor of two during the experiments, probably related to the degradation of silicates and/or clays. They were also significantly correlated with dissolved As, Cr and V, or Cr and U released under aerobic or anaerobic conditions, respectively. The Ca and Mg behavior was associated with these major elements, but only during anaerobic experiments as their dissolved concentrations were very low and stable under aerobic conditions (Figure 4b). During anaerobic experiments, Ca and Mg concentrations increased like no other element and they were strongly correlated with Si and SO42− variations (r2 > 0.973, n = 7; p ≤ 0.05). Released Cr and U were also significantly associated with these two major elements-Ca and Mg. This could be explained by the degradation of (As, Cr, V, U)-bearing phases and/or TE desorption from these surfaces, but further investigations are required to confirm this. Under oxic leaching conditions, some reactive (As, Cr and V)-rich clays and silicates may be degraded. Under anoxic conditions, reactive (Cr, U)-bearing phases could be both clays and silicates. They could also be associated with some Ca-Mg bearing phases such as gypsum but also calcite, dolomite and/or magnesian calcite as Ca-TIC correlation was highly significant in sediments. While dissolving under anaerobic conditions, they released Cr and U that could have previously been sorbed and/or co-precipitated on these minerals.
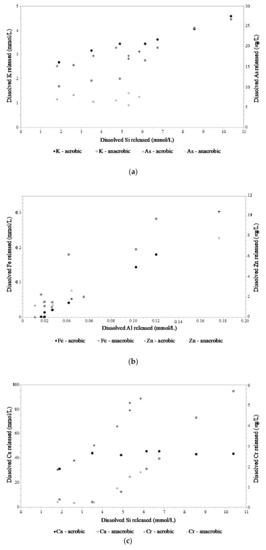
Figure 4.
Temporal evolution of major (black symbol) and trace (grey symbol) elements released in the leachate during aerobic (circles) and anaerobic (crosses) leaching experiments for (a) Si, K and As; (b) Si, Ca and Cr; (c) Al, Fe and Zn.
Moreover, even if the percentage of As, Cr, U and V released remained low in comparison to sediment contents, concentrations of As, U (for both conditions) and Cr (only for aerobic) released into water have to be considered for environmental issues. These concentrations of released As are higher than the dissolved As concentrations in surface water at Hengyang, where the leached sediment was sampled, under oxic conditions, while they are within the same concentration range under anoxic conditions (Table 4). When compared to water quality key standards (applicable in France, China or US), leachate concentrations of As, Cr and U greatly exceed the French INERIS standards applicable for pelagic freshwater organisms to protect against chronic ecotoxicity (Table 4). They are lower than Chinese and US standards as these are one order of magnitude higher for As and three times higher for Cr than the French levels and no limit was suggested for U. There is no potential impact for the amounts of V released.
Regarding Al and Fe, their dissolved concentrations rose sharply during the first hour of leaching under both aerobic and anaerobic conditions. They then decreased to below detection limits except for the highest value at the 480-h and 240-h step for oxic and anaerobic conditions, respectively (Table 4). Here, surprisingly, Al and Fe-bearing phases such as oxyhydroxides were not very reactive under any condition except for two steps (480 h and 240 h, depending on conditions), which may be linked to some specific microbial activity. These Al and Fe trends were associated significantly with those of Cd, Co, Cu, Ni, Pb and Zn (Figure 4b). All these TE could be controlled by sorption to and/or co-precipitation with Al- and Fe-oxyhydroxides under alkaline conditions [70]. Of all these TE, only concentrations of released Cu were 10 times higher than the French INERIS standards (but lower than Chinese standards) and released Cd and Cu concentrations were similar to those in surface water at Hengyang (Table 4). For Cd, Co, Ni, Pb and Zn, their dissolved concentrations were of the same order of magnitude or lower than the selected standards, although sediments were highly enriched in these TE (Table 4).
Therefore, in this study, even though the sediment used for the leaching experiments was highly contaminated by several TE (Table 1), the amount of TE released represents a low percentage of the total amount in sediments. The release of As, Cr, Cu and U inputs have to be considered as an environmental risk because leachate concentrations were above the French key-standards and released As, Cd or Cu concentrations were in the same range or higher than concentrations in Xiangjiang surface water. Since the late 1970s, water from the Xiangjiang River s has been identified as some of the most contaminated river water in China and the Xiangjiang was listed in the first-to-be-treated rivers in China at the end of the 1970s [44]. In the 1980s and 1990s, the water quality from Hengyang to Changsha was Grade IV and even V, which was the lowest quality level according to Environmental quality standards for surface water (GB 3838–2002) [71] while sediments in the mainstream were contaminated by As, Cd, Pb, Zn [21]. In the 2000s, surface water from the Xiangjiang River was still contaminated by As, Cd, Hg and Cr, although many schemes and control measures had been implemented throughout the basin [12]. The potential TE release actually depends on the stability of the TE-bearing phase in sediments under conditions of pH and dissolved O2. A next step in this work could be to evaluate the role of microbial activity under these neutral–alkaline conditions.
4. Conclusions
To assess sediment quality of the Xiangjiang River basin and potential sources of TE, the top-10 cm of surface sediments were sampled along the river and its tributaries during the dry season (2015–2017). Concentrations of selected TE were also reviewed in the literature for the past 15 years to visualize a longer-term change in sediment quality. This study showed that despite a series of governmental controls on industrial outputs, the basin still suffers from high TE contamination levels in sediments as their concentrations exceeded their background reference, especially regarding Cd, Sb and Hg, in all the sites studied. The TE contamination in the mainstream of the Xiangjiang River displayed almost no temporal decline but an obvious spatial distribution.
Among all the referenced sites, the Songbai (KP 300) and the Zhuzhou–Xiangtan sections (KP 500–550) were the two most impacted areas of the basin for all the TE studied. The upstream hotspot stayed highly localized and did not spread further downstream, although the second hotspot identified influenced downstream to Changsha. The activities having the greatest impact on sediment quality of the Xiangjiang River were mining activities, especially for Pb and Zn, and smelting activities of ferrous and nonferrous metals in different isolated areas and/or tributaries of the basin (in Zhuzhou for Cdn Cu, Pb and Zn, in Songbai for these TE and also Cr).
Besides the high level of TE enrichment in these surface sediments, the 30-day leaching experiment showed a low percentage of TE released into waters when compared to the composition of Xiangjiang River sediments. The assessment of TE release should consider the stability of TE-bearing phases under tested physical–chemical conditions (neutral–alkaline pH, oxic and anoxic) and microbial activity more than total concentrations or enrichments. It has been evidenced that As, Cr and V were released under oxic conditions due to destabilization of (Na, K, Si)-bearing phases (clays and silicates, whose exact minerology remains to be identified). Chromium and U were released only under anaerobic conditions by silicate degradation, and gypsum and/or carbonate dissolution. Cadmium, Co, Cu, Ni, Pb and Zn were poorly released, under aerobic or anaerobic conditions, as they were probably sorbed on (Al; Fe; Mn)-oxyhydroxides. Environmental issues need to be considered as concentrations of some TE released, including As, Cr, Cu and U, can exceed some key standards for water quality. Further work is required to clearly identify the TE-bearing-phases and to evaluate the role of microbial activity on TE release under these neutral–alkaline conditions.
Supplementary Materials
The following are available online at https://www.mdpi.com/2073-4441/13/3/271/s1.
Author Contributions
Conceptualization, C.G. and M.D.; Methodology, C.G., M.Z. and N.G.; Sampling, C.G., M.D., M.Z., Q.P., J.Z., L.L., F.Z. and F.B.; Investigation, C.G., M.Z. and N.G.; Writing—original draft, C.G. and M.Z.; Supervision, M.D.; Writing—review and editing, M.D., N.G., F.Z. and F.B.; Funding, Q.P., J.Z., L.L. and F.B.; Acquisition, Q.P., J.Z., L.L. and F.B. All authors have read and agreed to the published version of the manuscript.
Funding
This research program was funding by APR-2017 by Région Val de Loire (France). The authors greatly appreciated the high quality of chemical analyses of SARM-CRPG (Nancy, France). X-ray diffraction was carried out at the UMR 7347 GREMAN lab (University of Tours).
Acknowledgments
The authors greatly appreciated the high quality of chemical analyses of SARM-CRPG (Nancy, France). X-ray diffraction was carried out at the UMR 7347 GREMAN lab (University of Tours). The authors would also like to thank M. Shumskhikh for carrying leaching experiments with M. Zhang, Susan Edrich (Interconnect LC) for the English revision, spelling and grammar checked for this manuscript.
Conflicts of Interest
The authors declare no conflict of interest.
References
- Liu, J.; Xu, Y.; Cheng, Y.; Zhao, Y.; Pan, Y.; Fu, Y.; Dai, Y. Occurrence and risk assessment of heavy metals in sediments of the Xiangjiang River, China. Environ. Sci. Pollut. Res. 2017, 24, 2711–2723. [Google Scholar] [CrossRef] [PubMed]
- Liang, J.; Liu, J.; Yuan, X.; Zeng, G.; Lai, X.; Li, X.; Wu, H.; Yuan, Y.; Li, F. Spatial and temporal variation of heavy metal risk and source in sediments of Dongting Lake Wetland, mid-south China. J. Environ. Sci. Health Part A 2015, 50, 100–108. [Google Scholar] [CrossRef] [PubMed]
- Grosbois, C.; Meybeck, M.; Lestel, L.; Lefevre, I.; Moatar, F. Severe and contrasted polymetallic contamination patterns (1900–2009) in the Loire River sediments (France). Sci. Total Environ. 2012, 435–436, 290–305. [Google Scholar] [CrossRef] [PubMed]
- Grosbois, C.; Courtin-Nomade, A.; Martin, F.; Bril, H. Transportation and evolution of trace element bearing phases in stream sediments in a mining—influenced basin (upper Isle River, France). Appl. Geochem. 2007, 22, 2362–2374. [Google Scholar] [CrossRef]
- Grosbois, C.; Courtin-Nomade, A.; Robin, E.; Bril, H.; Tamura, N.; Schafer, J.; Blanc, G. Fate of arsenic-bearing phases during the suspended transport in a gold mining district (Isle River basin, France). Sci. Total Environ. 2011, 409, 4986–4999. [Google Scholar] [CrossRef]
- Courtin-Nomade, A.; Waltzing, T.; Evrard, C.; Soubrand, M.; Lenain, J.F.; Ducloux, E.; Ghorbel, S.; Grosbois, C.; Bril, H. Arsenic and lead mobility: From tailing materials to the aqueous compartment. Appl. Geochem. 2016, 64, 10–21. [Google Scholar] [CrossRef]
- Bossy, A.; Grosbois, C.; Hendershot, W.; Beauchemin, S.; Crouzet, C.; Bril, H. Contributions of natural arsenic sources to surface waters on a high grade arsenic-geochemical anomaly (French Massif Central). Sci. Total Environ. 2012, 432, 257–268. [Google Scholar] [CrossRef]
- Liu, Y.; Deng, B.; Du, J.; Zhang, G.; Hou, L. Nutrient burial and environmental changes in the Yangtze Delta in response to recent river basin human activities. Environ. Pollut. 2019, 249, 225–235. [Google Scholar] [CrossRef]
- Chen, X.; Strokal, M.; Kroeze, C.; Ma, L.; Shen, Z.; Wu, J.; Chen, X.; Shi, X. Seasonality in river export of nitrogen: A modelling approach for the Yangtze River. Sci. Total Environ. 2019, 671, 1282–1292. [Google Scholar] [CrossRef]
- Song, Y.; Ji, J.; Mao, C.; Yang, Z.; Yuan, X.; Ayoko, G.A.; Frost, R.L. Heavy metal contamination in suspended solids of Changjiang River—Environmental implications. Geoderma 2010, 159, 286–295. [Google Scholar] [CrossRef]
- Chen, Y.; Wu, F.; Lu, H.; Yao, C. Analysis on the water quality changes in the Xiangjiang River from 1981 to 2000. Resour. Environ. Yangtze Basin 2004, 13, 508–512. (In Chinese) [Google Scholar]
- Hunan Water Resources Bulletin (2001–2006). Available online: http://slt.hunan.gov.cn/slt/xxgk/tjgb/index_2.html; http://slt.hunan.gov.cn/slt/xxgk/tjgb/index.html; (accessed on 7 May 2019). (In Chinese)
- Shi, T.; Ma, J.; Zhang, Y.; Liu, C.; Hu, Y.; Gong, Y.; Wu, X.; Ju, T.; Hou, H.; Zhao, L. Status of lead accumulation in agricultural soils across China (1979–2016). Environ. Int. 2019, 129, 35–41. [Google Scholar] [CrossRef] [PubMed]
- Mu, T.; Wu, T.; Zhou, T.; Li, Z.; Ouyang, Y.; Jiang, J.; Zhu, D.; Hou, J.; Wang, Z.; Luo, Y.; et al. Geographical variation in arsenic, cadmium, and lead of soils and rice in the major rice producing regions of China. Sci. Total Environ. 2019, 677, 373–381. [Google Scholar] [CrossRef] [PubMed]
- Scientific Development Overall Plan of The Xiangjiang River Basin. Available online: http://www.hunan.gov.cn/xxgk/fzgh/201403/t20140304_4902771.html (accessed on 19 December 2017). (In Chinese)
- The “Water Pollution Prevention and Control Action Plan” Implementation Plan (2016–2020) was Implemented by Hunan Province. Available online: http://www.hunan.gov.cn/xxgk/fzgh/201602/t20160222_4902819.html (accessed on 19 December 2017).
- Liu, D. Why Does the Source of the Xiangjiang River Misrepresent for Thousand Years? Available online: https://hnrb.voc.com.cn/hnrb_epaper/html/2013-05/22/content_666007.htm?div=0 (accessed on 22 December 2017).
- Natural Resources of Hunan Province. Available online: http://www.hunan.gov.cn/hnszf/jxxx/hngk/zrdl/201803/t20180322_4977107.html (accessed on 23 April 2019). (In Chinese)
- Where is Hunan. Available online: http://www.enghunan.gov.cn/AboutHunan/HunanFacts/WhereisHunan/201507/t20150707_1792258.html (accessed on 23 April 2019).
- Liu, H. A study on the pollution of the Xiangjiang River geological and mineral resources. J. Central South Inst. Min. Metall. 1981, 3, 98–105. (In Chinese) [Google Scholar]
- Zeng, B.; Pan, Y.; Huang, Z. Preliminary assessment of sediment pollution in the Xiangjiang River. Environ. Chem. 1982, 1, 352–358. (In Chinese) [Google Scholar]
- Zhang, L.; Dong, W.; Zheng, J.; Zhao, G. The metalform and form factors of heavy metals in the Xiangjiang River sediments. Acta Geogr. Sinica 1983, 38, 55–64. (In Chinese) [Google Scholar] [CrossRef]
- Jiang, Z. Study of Xiangjiang River. Available online: http://hnrb.voc.com.cn/hnrb_epaper/html/2012-10/17/content_573333.htm?div=-1 (accessed on 17 December 2017). (In Chinese).
- Wang, X. Research on Representativenes of Estuarine Sediment Sampling; China University of Geosciences: Beijing, China, 2006. (In Chinese) [Google Scholar]
- Tang, X.; Peng, B.; Yu, C.; Hu, D.; Pang, X.; Yang, G.; Yin, C. Environmental—Geochemical characteristics of heavy metals in sediments from the Xiang river. Yunnan Geogr. Environ. Res. 2008, 20, 26–32. (In Chinese) [Google Scholar]
- Hunan Provincial Committee for the Compilation of Local Chronicles. Hunan Record: Industrial Mineral Record—Metallurgical Industry; Hunan Press: Changsha, China, 1991. (In Chinese) [Google Scholar]
- People’s Government of Hunan Province. Hunan Province Mineral Resources Master Plan (2016–2020); People’s Government of Hunan Province: Changsha, China, 2016. (In Chinese)
- Li, Z.; Feng, X.; Li, G.; Bi, X.; Sun, G.; Zhu, J.; Qin, H.; Wang, J. Mercury and other metal and metalloid soil contamination near a Pb/Zn smelter in East Hunan Province, China. Appl. Geochem. 2011, 26, 160–166. [Google Scholar] [CrossRef]
- Hunan Development and Reform Commission. 13th Five-Year Plan (2016–2020) for Hunan Coal Industry of Hunan Province; Hunan Development and Reform Commission: Changsha, China, 2016. (In Chinese) [Google Scholar]
- Hunan Provincial Bureau of Statistics. Hunan Statistical Yearbook (2018); China Statistics Press: Changsha, China, 2019. (In Chinese) [Google Scholar]
- People’s Government of Hunan Province. 13th Five-Year Plan (2016–2020) for National Economic and Social Development of Hunan Province; People’s Government of Hunan Province: Changsha, China, 2016. (In Chinese)
- Nonferrous Metals Administration of Hunan Province. 13th Five-Year Plan (2016–2020) for Nonferrous Metals Industry of Hunan Province; Nonferrous Metals Administration of Hunan Province: Changsha, China, 2016. (In Chinese) [Google Scholar]
- National Bureau of Statistics of China. China Statistical Yearbook (2011); China Statistics Press: Beijing, China, 2012. (In Chinese) [Google Scholar]
- Li, H. The Research of Land Use Efficiency in Different Regions in Hunan Province; Hunan Agricultural University: Changsha, China, 2010. [Google Scholar]
- Hunan Provincial Bureau of Statistics. Hunan Statistical Yearbook (2017); Hunan Press: Changsha, China, 2018. (In Chinese) [Google Scholar]
- Hunan Provincial Bureau of Statistics. Hunan Statistical Yearbook (1982); Hunan Press: Changsha, China, 1984. (In Chinese) [Google Scholar]
- National Bureau of Statistics of China. Compilation of Agricultural Statistics in the Thirty Years of Reform and Opening-Up (1978–2007); China Statistics Press: Beijing, China, 2009. (In Chinese) [Google Scholar]
- National Bureau of Statistics of China. China Statistical Yearbook on Environment (2007–2017); China Statistics Press: Beijing, China, 2008–2018. (In Chinese) [Google Scholar]
- Leiyang City Chronicle Compilation Committee. Leiyang City Record; China Society Press: Beijing, China, 1993. (In Chinese) [Google Scholar]
- Hunan Leiyang City Chronicle Compilation Committee. Leiyang City Record 1986–2005; Local Records Publishing House: Beijing, China, 2011. (In Chinese) [Google Scholar]
- Liu, H.; Li, Y. Background values of some metals in rocks, soil and water in Xiang Jiang basin. Acta Sci. Circumstantiae Huanjing Kexue Xuebao 1984, 4, 17–32. (In Chinese) [Google Scholar]
- Li, J.; Zeng, B.; Yao, Y.; Zhang, L.; Qiu, C.; Qian, X. Studies on environmental background levels in waters of Dongting Lake system. J. Environ. Sci. 1986, 7, 62–68. (In Chinese) [Google Scholar]
- Qian, X.; Li, X. Geochemical background values of Dongting lake sediments. Chin. Sci. Bull. 1988, 6, 458–462. (In Chinese) [Google Scholar]
- Hunan Provincial Committee for the Compilation of Local Chronicles. Hunan Record: Construction Record—Environmental Protection; China Intercontinental Press: Beijing, China, 2001. (In Chinese) [Google Scholar]
- Mao, L.; Mo, D.; Guo, Y.; Fu, Q.; Yang, J.; Jia, Y. Multivariate analysis of heavy metals in surface sediments from lower reaches of the Xiangjiang River, southern China. Environ. Earth Sci. 2013, 69, 765–771. [Google Scholar] [CrossRef]
- Peng, B.; Tang, X.; Yu, C.; Tan, C.; Yin, C.; Yang, G.; Liu, Q.; Yang, K.; Tu, X. Geochemistry of trace metals and Pb isotopes of sediments from the lowermost Xiangjiang River, Hunan Province (P.R. China): Implications on sources of trace metals. Environ. Earth Sci. 2011, 64, 1455–1473. [Google Scholar] [CrossRef]
- Chai, L.; Li, H.; Yang, Z.; Min, X.; Liao, Q.; Liu, Y.; Men, S.; Yan, Y.; Xu, J. Heavy metals and metalloids in the surface sediments of the Xiangjiang River, Hunan, China: Distribution, contamination, and ecological risk assessment. Environ. Sci. Pollut. Res. 2017, 24, 874–885. [Google Scholar] [CrossRef]
- Muller, G. Index of geoaccumulation in sediments of the Rhine River. Geojournal 1969, 2, 108–118. [Google Scholar]
- Wang, H. Assessment and prediction of overall environmental quality of Zhuzhou city, Hunan Province, China. J. Environ. Manag. 2002, 66, 329–340. [Google Scholar]
- Lyu, Y.; Zhang, K.; Chai, F.; Cheng, T.; Yang, Q.; Zheng, Z.; Li, X. Atmospheric size-resolved trace elements in a city affected by non-ferrous metal smelting: Indications of respiratory deposition and health risk. Environ. Pollut. 2017, 224, 559–571. [Google Scholar] [CrossRef]
- Qian, Y.; Zheng, M.; Gao, L.; Zhang, B.; Liu, W.; Jiao, W.; Zhao, X.; Xiao, K. Heavy metal contamination and its environmental risk assessment in surface sediments from Lake Dongting, People’s Republic of China. Bull. Environ. Contam. Toxicol. 2005, 75, 204–210. [Google Scholar] [CrossRef]
- Jiang, M.; Zeng, G.; Zhang, C.; Ma, X.; Chen, M.; Zhang, J.; Lu, L.; Yu, Q.; Hu, L.; Liu, L. Assessment of Heavy Metal Contamination in the Surrounding Soils and Surface Sediments in Xiawangang River, Qingshuitang District. PLoS ONE 2013, 8, e71176. [Google Scholar] [CrossRef]
- Li, F.; Huang, J.-H.; Zeng, G.; Yuan, X.; Li, X.; Liang, J.; Wang, X.; Tang, X.; Bai, B. Spatial risk assessment and sources identification of heavy metals in surface sediments from the Dongting Lake, Middle China. J. Geochem. Explor. 2013, 132, 75–83. [Google Scholar] [CrossRef]
- Mao, L.; Mo, D.; Yang, J.; Jia, Y.; Guo, Y. Concentration and pollution assessment of hazardous metal elements in sediments of the Xiangjiang River, China. J. Radioanal. Nucl. Chem. 2013, 295, 513–521. [Google Scholar] [CrossRef]
- Liu, H.; Zhang, K.; Chai, L. A Comparative Evaluation of Different Sediment Quality Guidelines for Metal and Metalloid Pollution in the Xiangjiang River, Hunan, China. Arch. Environ. Contam. Toxicol. 2017, 73, 593–606. [Google Scholar] [CrossRef] [PubMed]
- Xie, Y.; Ouyang, M.; Huang, D.; Ou, F. Pollution characteristics, sources and ecological rish of heavy metals in sediments from Dongting Lake and its lake inlets. Environ. Chem. 2017, 36, 2253–2264. (In Chinese) [Google Scholar]
- Zhang, C.; Qiao, Q.; Piper, J.D.; Huang, B. Assessment of heavy metal pollution from a Fe-smelting plant in urban river sediments using environmental magnetic and geochemical methods. Environ. Pollut. 2011, 159, 3057–3070. [Google Scholar] [CrossRef] [PubMed]
- Zhang, C.; Appel, E.; Qiao, Q. Heavy metal pollution in farmland irrigated with river water near a steel plant-magnetic and geochemical signature. Geophys. J. Int. 2012, 192, 963–974. [Google Scholar] [CrossRef]
- Zhu, J.; Zhang, J.; Li, Q.; Han, T.; Xie, J.; Hu, Y.; Chai, L. Phylogenetic analysis of bacterial community composition in sediment contaminated with multiple heavy metals from the Xiangjiang River in China. Mar. Pollut. Bull. 2013, 70, 134–139. [Google Scholar] [CrossRef] [PubMed]
- Jie, S.; Li, M.; Gan, M.; Zhu, J.; Yin, H.; Liu, X. Microbial functional genes enriched in the Xiangjiang River sediments with heavy metal contamination. BMC Microbiol. 2016, 16, 179. [Google Scholar] [CrossRef]
- Li, H.; Chai, L.; Yang, Z.; Liao, Q.; Liu, Y.; Ouyang, B. Seasonal and spatial contamination statuses and ecological risk of sediment cores highly contaminated by heavy metals and metalloids in the Xiangjiang River. Env. Geochem. Health 2019, 41, 1617–1633. [Google Scholar] [CrossRef]
- Li, H.; Yang, J.; Ye, B.; Jiang, D. Pollution characteristics and ecological risk assessment of 11 unheeded metals in sediments of the Chinese Xiangjiang River. Environ. Geochem. Health 2019, 41, 1459–1472. [Google Scholar] [CrossRef]
- Qin, Z.; Shi, H.; Wang, M.; Bai, Z. Spatial distribution and correlation of soil cadmium contamination in Xiangjiang River tributary basin of China. Res. Environ. Sci. 2018, 31, 1399–1406. (In Chinese) [Google Scholar]
- Ettler, V. Soil contamination near non-ferrous metal smelters: A review. Appl. Geochem. 2016, 64, 56–74. [Google Scholar] [CrossRef]
- Almeida, S.M.; Lage, J.; Fernández, B.; Garcia, S.; Reis, M.A.; Chaves, P.C. Chemical characterization of atmospheric particles and source apportionment in the vicinity of a steelmaking industry. Sci. Total Environ. 2015, 521–522, 411–420. [Google Scholar] [CrossRef] [PubMed]
- Wright, I.A.; McCarthy, B.; Belmer, N.; Price, P. Subsidence from an underground coal mine and mine wastewater discharge causing water pollution and degradation of aquatic ecosystems. Water Air Soil Pollut. 2015, 226, 348. [Google Scholar] [CrossRef]
- Chen, G.; Sun, Y.; Wang, Q.; Yan, B.; Cheng, Z.; Ma, W. Partitioning of trace elements in coal combustion products: A comparative study of different applications in China. Fuel 2019, 240, 31–39. [Google Scholar] [CrossRef]
- Lors, C.; Tiffreau, C.; Laboudigue, A. Effects of bacterial activities on the release of heavy metals from contaminated dredged sediments. Chemosphere 2004, 56, 619–630. [Google Scholar] [CrossRef]
- Cappuyns, V.; Swennen, R.; Devivier, A. Influence of ripening on phstat leaching behaviour of heavy metals from dredged sediments. J. Environ. Monit. JEM 2004, 6, 774–781. [Google Scholar] [CrossRef]
- Štyriaková, I.; Štyriak, I.; Balestrazzi, A.; Calvio, C.; Faè, M.; Štyriaková, D. Metal leaching and reductive dissolution of iron from contaminated soil and sediment samples by indigenous bacteria andbacillusisolates. Soil Sediment Contam. Int. J. 2016, 25, 519–535. [Google Scholar] [CrossRef]
- Environmental Quality Standards for Surface Water (GB 3838–2002). Available online: http://www.mee.gov.cn/ywgz/fgbz/bz/bzwb/shjbh/shjzlbz/200206/t20020601_66497.shtml (accessed on 7 March 2018).
- Jiang, D.; Wang, Y.; Liao, Q.; Long, Z.; Zhou, S. Assessment of water quality and safety based on multi-statistical analyses of nutrients, biochemical indexes and heavy metals. J. Cent. South Univ. 2020, 27, 1211–1223. [Google Scholar] [CrossRef]


Publisher’s Note: MDPI stays neutral with regard to jurisdictional claims in published maps and institutional affiliations. |
© 2021 by the authors. Licensee MDPI, Basel, Switzerland. This article is an open access article distributed under the terms and conditions of the Creative Commons Attribution (CC BY) license (http://creativecommons.org/licenses/by/4.0/).