Abstract
In Abu Dhabi, one of the most arid regions in the world, in recent decades, desalinated water has been identified as a prime solution in solving the water demand issues. In this study, a three-dimensional coupled density-dependent flow and solute transport model was set up in order to study the effect of the artificial recharge using desalinated water and the influence of nonconventional water with a salt concentration in the range 0.1–2 g/L The results confirm that this region demands the adoption of a more rational use of irrigation water or additional usage of desalinated water and recycled water together with optimizing groundwater pumping at locations that are vulnerable to further quality degradation and depletion. The long-term storage of desalinated freshwater with a maximum radial distance of 653 m in the dune surface is ensured with the formation of the transition zone, and change in the groundwater head up to 5 km. The maximum recovery obtained by immediate recovery is 70%. The study expresses the long-term feasibility of desalinated freshwater storage and the need for further management practices in quantifying the contribution of desalinated and recycled water for agriculture activities which might have improved groundwater quality and increased hydraulic head at some locations.
1. Introduction
Groundwater is declared as a major component for the development of any country [1,2]. In arid climatic zones, inflow to the aquifer by precipitation recharge is very limited and the available freshwater resources are synthetically impacted by climate and anthropogenic activities particularly by overexploitation of groundwater [3]. Thus climate change, land use change, and population growth are posing a variety of threats to aquifers in arid regions thereby impacting both water quantity and quality.
In Abu Dhabi, to support the domestic and industrial activities, and especially to increase the green GDP, groundwater from this bowl of sedimentary formation has been heavily exploited for the past five decades [4,5,6]. The development of this region has been very rapid since the 1970s when oil extraction began and groundwater was the most reliable source of water supply for all the development activities [7]. An increased volume of groundwater pumping in the successive years had reshaped the native resources of groundwater. The volume of groundwater of desirable quality is diminished vastly, and several shallow wells and springs became dry due to the decline in groundwater head [8,9,10,11,12].
In recent decades, the exposure of surficial aquifer to natural and anthropogenic impacts such as overpumping, limited rainfall, increased evaporation, use of fertilizers, waterlogging, leakage of water and oil from the pipelines, urban sewage, higher rate of evaporation, leachate of salts from the soil profile has worsened the quality of the freshwater resource by making it more saline [13,14,15,16,17,18,19,20,21,22].
The use of groundwater management practices is an immediate need to protect the freshwater resources in this region and by which the sustainability of the aquifer could be enhanced for future use.
In general, the sustainable management of aquifer is achieved either by reducing the groundwater extraction below the volume of recharge or by enhancing the groundwater recharge by natural and/or artificial means against the volume of groundwater requirement [23]. In both cases, improving the quality of groundwater or avoiding further deterioration of groundwater quality is targeted as the main concern. The methods and benefits of management practices are site-specific and based on several hydrological and hydrogeological factors [24]. Aquifer response to the recharge sources, long-term behavior of the aquifer, suitability, and benefits of techniques to be adopted, water demand, and uncertainties in different paths are likely to be the deciding factors of management practices.
In the case of recharge enhancement, dam construction across the river channel is widely employed in countries with plenty of availability of surface water resources. In Abu Dhabi and the adjacent arid region, the feasibility and success rate of dams in recharge enhancement is good only to a particular extent because of scanty rainfall and evaporation that cause non-perennial behavior of rivers and ponds. The fulfillment of water demand and aquifer management is of national importance for this rapidly developing region. Abu Dhabi tends to depend on nonconventional water resources like desalination of seawater and brackish groundwater, and recycling of wastewater for the purpose of domestic, agriculture, and industrial development. Gradual replacement of nonconventional water has been helping to reduce groundwater pumping. Presently, domestic pumping is completely stopped. However, only 36% of water demand is managed by nonconventional sources [25]. The agriculture sector, a dominant consumer of groundwater is pumping groundwater at several folds higher than the annual renewable volume. It is expected that desalinated water contribution to the agriculture sector will help to reduce the volume of groundwater pumping. Also, to avoid failure in the water supply during any emergency situation, the subsurface storage, which is the world’s largest artificial recharge, was started in the year 2015 using Strategic Aquifer Storage and Recovery (SASR) structure at the dune surface. The efficiency was investigated by a pilot study during the years 2003–2004 and 2008–2014 and by developing a small-scale model [26,27]. A recent review by Parimalarenganayaki (2020) [28] on the efficiency of various artificial recharge methods in arid regions reported that the subsurface storage at a suitable aquifer medium is beneficial because of the neglected effect of evaporation. Presently, the first cycle of recharge with a volume of 21.8 MCM (million cubic meter) was completed in the year 2017.
Besides having subsurface storage, an increased contribution of nonconventional water to domestic, agriculture, and industrial sector, etc., the aquifer shows a wide range of decline in the groundwater head by a maximum of 93 m as because of unsafe yield and at the same time, an increase in the groundwater head by a maximum of 60 m is also noticed in selective locations due to the mixed action of management practices such as reduced pumping, recharge of groundwater by infiltration of water from nonconventional sources into the aquifer through agriculture and gardening activities [5,29]. UNESCO (2015) [29] reported that to increase sustainable use of nonconventional water, there is an urgent need to reconsider the management approach to reduce irrational water use in all the sectors.
Some researchers have analyzed the feasibility, cost-effectivity, and performances of applying ASR for the storage of surplus water in aquifers.
Sathish et al. (2018) [5] investigated the performance of two existing groundwater artificial recharge sites and a new ASR location to ensure a stable water supply in Abu Dhabi, UAE using the MODFLOW simulator model. The results showed that even with 100% recovery, the groundwater level does not reach the initial level during the aquifer balancing period.
Other similar studies with the same objectives have been conducted by [30,31] in almost all of which strategies for ASR such as surface recharge of the aquifer, withdrawal reduction, and increasing irrigation efficiency were introduced.
Khezri (2010) [32] has evaluated the efficiency of the ASR system in the Liwa area, UAE under various operational schemes.
Hussain et al. (2016) [33] developed and calibrated a three-dimensional density-dependent model on the Wadi Ham aquifer in the UAE to study the transient responses of SWI over 10-year planning to repeated cycles of artificial recharge, storage, and recovery using an additional set of wells defined in the model. The results show that ASR is a reliable method in controlling SWI in coastal aquifer systems besides its conventional role in subsurface water banking.
Studying the aquifer at a regional scale using various hydrogeological components with applicable external stress will be useful for a policymaker. In this way, the zone in which the agriculture field demands more or reduced water supply from the nonconventional source could be identified. Understanding the behavior of the regional groundwater flow system along with the salinity distribution is significantly important to identify the mixing of less saline nonconventional water to high saline ambient groundwater which is widely happening in the Abu Dhabi region.
The present study aims at investigating the long-term artificial storage of surplus desalinated water in the unconfined aquifer and the response of groundwater salinity at agriculture fields by introducing the nonconventional water into agriculture fields at various scales and degrees of salinity. The study is intended to answer the impacts of (i) reported volume of groundwater pumping (ii) gradual reduction in the groundwater pumping assumed by entering of nonconventional water into the agriculture sector (iii) concentration of groundwater salinity at a selective rate of pumping (iv) mixing of less saline nonconventional water to high saline native groundwater at SASR location and its long term efficiency of storage. The difference in the spatial and vertical concentration of solute might causes variation in the density of the fluid and thus it is necessary to take into account the effect of density as well while simulating artificial recharge and mixing of less saline water into the high saline groundwater aquifer. A coupled density-dependent flow and solute transport model is developed in the present study to enhance the groundwater management practices in the Abu Dhabi aquifer at a regional scale.
2. Materials
2.1. Geology and Hydrogeology of the Study Area
Abu Dhabi is classified among arid (Köppen–Geiger climate classification) and hyper-arid region [1] located between Persian sea and Hajar Mountain chains. The natural renewable water resource per capita is reduced to 16 m3year−1 [34]. The climate was wetter in the past during the year 5500 BP when the rainfall was reported as 200 ± 50 mm [35].
The study area is located around the Southern part of the Persian Gulf (Figure 1). The area is characterized by arid conditions and experiences a tropical hot and dry climate, having a maximum daily temperature of 50 °C during summer (June–August) and a minimum daily temperature of 17 °C during winter (December–February) (IPCC 2007). The humidity varies between 25% in the eastern part and 90% in the coastal boundary. The annual pan evaporation ranges between 3400 mmyr−1 and 4400 mmyr−1 [36,37] and evapotranspiration is 62.05 mmyr−1 [38].

Figure 1.
(a) Location of the study area, agriculture activities (a major groundwater consuming sector), spatial geological setting and location of monitoring well, desalination plant and TSE plant; (b) geological cross-section of the study area.
The elevation varies from 0 m above mean sea level (AMSL) at the coastal boundary to 1163 m AMSL at the Jabal Hafit Mountain located at the eastern sector. The spatial variation in the annual mean precipitation is highly variable from the western to the eastern part from 50 mmyr−1 to 100 mmyr−1 respectively and 80% of the precipitation occurs during winter [39,40]. The maximum elevated precipitation values in the east are due to the presence of Hajar Mountain bordering the eastern boundary at different distances. The Jabal Haift Mountain is an anticlinal outcrop falling within the area of study and oriented towards the N–S direction which is parallel to Hajar Mountain.
The Piedmont plain occupies a large portion of the eastern part and is characterized by twelve non-perennial Wadies which drain water from Hajar Mountain during the period of rainfall. The central part of the area is occupied by linear and traverse dunes of varying size and height and is predominantly made up of sand and gravel. The maximum elevation of the dune is 259 m and occupies the central part of the area. Besides the sand dunes on the Southern side, several inland silty deposits are present.
The Abu Dhabi region is constituted of three major landforms of sedimentary origin namely Piedmont in the east, dune surface in the central part, and coastal flats. The whole study area was formed by the action of continental uplift and sequence of sedimentary deposits of various ages. The geological units are originated from a series of episodes of marine transgressions in various ages. Later on, the surface of the marine sediments was eroded and altered by fluvial dynamics and alluvial deposits in the east and north-west sectors. Presently, the top geological layer is composed of sand, gravel, silt, clay, conglomerate, evaporites, marl, mudstone, limestone, and chert with an average thickness of 50 m in the eastern part and 60 m in the western part.
The eastern part of the top layer is followed by upper fars of 900 m thick composed of mudstone. The upper fars and portion of the top layer in the western part is underlined by lower fars composed of evaporites having a thickness from 160 m to 200 m. The lower fars, a low conductive formation, act as a confining unit that forms the base of the aquifer. The depth of bedrock is not delineated. The anticlinal outcrop falling in the eastern part is composed of a weathered calcareous formation and evaporates. There are several discontinuous outcrops at various heights trending towards the N–S direction with the same composition.
Abu Dhabi aquifer is a typical transboundary aquifer shared by Saudi Arabia in the south and south-west and by Oman in the east. Dense settlements and industrial activities are available along the coastal region but the coastal aquifer has nil freshwater as opposite to the coastal aquifers in many other countries which are having plenty of freshwater in the coastal region [25]. The surficial aquifer consists of sand, gravel, silt, clay, conglomerate, evaporites, marl, mudstone, limestone, and chert. The upper fars and lower fars are composed of mudstone and evaporites respectively. The groundwater is withdrawn from the surficial aquifer and upper fars. Many wells in the eastern part penetrate both the surficial aquifer and upper fars for water supply. In some places, the surficial aquifer thickness is nil, and groundwater is directly served from the upper fars. Similarly, in the western part, the upper fars is absent and the surficial aquifer is directly followed by lower fars. The values of thickness and horizon of these three geological units can be found from the data published by [39,41].
The recharge of groundwater occurs significantly in the eastern part where rainfall is comparatively higher than the central and western part and is the driving force of the flow vector. Therefore the regional flow of groundwater is from the eastern part where recharge occurs into the coastal boundary. Moreover, recharge by lateral subsurface and drainage transmission loss (loss of surface runoff) occurs from the Hajar Mountain in Oman [42,43]. Thermal springs at the valley of Jabal Hafit Mountain introduce deeper groundwater into the surficial aquifer at the rate of 2.5 × 10⁶ m3yr−1 [44]. A wetland ecology near the coastal boundary is maintained by an artificial supply of recycled water from TSE at the rate of 8000 m3d−1 during winter to 22,000 m3d−1 during summer [45].
The top layer thickness is declining towards the coastal part and is dominated by the Sabkha formation. The word ‘sabkha’ describes a topographically flat area composed of variable mixtures of silt, sand, or clay with an overlying crust of salt. From the geological point of view, sabkha is commonly associated with flat topographic areas near the coast that have specific mineralogical characteristics like algal and dolomitic crusts underlain by a layer of anhydrite (CaSO4). Halite crusts (NaCl) could also occur extensively on the surface, but these are relatively thin crusts that redissolve after winter precipitation events. This mineralogical sequence characterizes only the top layer of the coastal sabkhas. This less conductive formation is bordering the coastal strip at several ranges of distance (2–20 km) from NE to SE. The lower intertidal-to-shallow subtidal zone of the coastal sabkha of Abu Dhabi area is dominated by carbonate sands, which locally experience early cementation to form giant polygons [46]. A typical stratigraphic section is reported in [47].
The Sabkha formation at the inland has a considerable thickness and covers the sand of the surficial aquifer. Due to its low hydraulic conductivity, the Sabkha formation acts as a confining/semiconfining unit and reduces the discharge of groundwater into the sea [39]. However, seepage of water occurs from the deeper high conductive zone. As a result, the surface is capped with evaporates that constitutes a typical source of salinity in the groundwater. The inland Sabkha dominantly occurs in the SW part of the study, a leeward side of the Barchan sand dune.
Detailed hydrogeological investigations conducted by the National Drilling Company (NDC), Groundwater Assessment Project (GWA) U.S. Geological Survey [4,48] reported that the hydraulic conductivity varies between 2.74 × 10⁻⁸ md−1 in the sabkha formations to 266 md−1 in calcareous formation. The lowest value of hydraulic conductivity reported by [48] for the less conductive Sabkha in the coast is between 0.06 to 7.5 md−1.
Additionally, heterogeneity and anisotropy are also common factors that make a huge difference in the horizontal and vertical hydraulic conductivity. A huge contrast in the hydraulic conductivity between the surficial aquifer and the confining unit allows significant flow of groundwater predominantly in the horizontal direction rather than the vertical direction. Along the coastal region, due to lower hydraulic conductivity in the sabkha, the ratio of anisotropy between horizontal and vertical flow is higher than the rest of the area.
The specific yield is 0.25 (-) in the central part and 0.31 which is the highest value in the calcareous outcrops.
The groundwater head varies from 400 m AMSL easterly (Al Ain) to 0 m AMSL at the coastal boundary which allows the regional flow of groundwater from east to the coastal boundary. The groundwater table at the dune surface was 128 m but reduced to 100 m now because of natural and anthropogenic impacts. The fluctuation of the groundwater table varies from 0.15 m in the western part to 1.5 m in the eastern part due to a considerable quantity of rainfall (up to 108 mmyr−1).
In the eastern area of the Abu Dhabi region, values of groundwater salinity less than 1 gL−1 are detected due to higher renewability of groundwater by means of recharge from rainfall and from Hajar Mountain Chains. Also, groundwater in the dune surface (central part) shows a concentration of salinity equivalent to 1 gL−1 which is declared as a non-renewable resource formed in ancient times when the climate was wet. Presently, the study area is left with a considerable quantity of freshwater lens of palaeo-origin in the dune surface and a considerable quantity of freshwater in the Piedmont region (eastern part) with a possible chance of replenishment from the Hajar Mountain. The freshwater originated by rainfall and by runoff from the Hajar Mountain and Jabal Hafit forms the freshwater zone on top of dense saline groundwater in the saturated medium.
In some other areas of the Abu Dhabi region, shallow groundwater head, seepage of groundwater from the deeper aquifer, and higher rate of evaporation causes accumulation of salts on the ground surface and dissolving of the same to the groundwater occurs simultaneously.
As a result, the salinity (a concentration of total dissolved solids) of groundwater in the Sabkha region is reported up to 150 gL−1 which is more than three times higher than the salinity of seawater in the Persian Gulf (42 gL−1) and several times higher than the salinity of groundwater from the deeper aquifer (83 gL−1) (Stanford and Wood 2001). Moving to the inland: dune surface and piedmont region, the availability of groundwater under desirable quality is less than 2.97% [38].
From the literature, it is also reported that the salinity of groundwater from the surficial aquifer is higher than the salinity of groundwater from the deepest formation along the coast and waterlogged areas [48]. It is reported that the freshwater is already replaced by brackish water in several parts and continuation of groundwater pumping at the present rate will turn this regional aquifer completely brackish and saline in the near future [4,38].
2.2. Strategic Aquifer Storage and Recovery Potential
The rate of success in subsurface storage and recovery is depending on several collective factors: aquifer setup, flow velocity, operational setup, ambient groundwater salinity, potentiometric surface, density, and rock water interaction [49,50,51].
The present study is the case of an unconfined aquifer and so the thickness, shape, and size of the injected water is defined by the density and smoothness of groundwater gradient. The chances of external influence to injected water and loss of recovery may be high because of the absence of any physical and potentiometric control likely in confined aquifers. However, the aquifer is in the dune surface holding a freshwater lens of palaeo origin which is one of the promising factors for the site suitability to store a freshwater of nonconventional origin. The pilot study conducted by Schlumberger Water Services (2011), forward and reversed chemical models developed by [27] confirmed that the recovery range could be between 60–88%. Especially in the latter study, it was also reported the occurrence of native groundwater mixing during the period of storage. The results of the large-scale flow model highlighted that the groundwater head did not return to its original position even after a 100% of recovery because of the effect of regional influence [5]. Hence, the scale of regional groundwater mixing with stored water bodies is one of the deciding factors in the rate of SASR success.
2.3. Non-Conventional Water in Agriculture Field
With limited freshwater availability, green GDP can be generated mostly by approaching salt tolerant crops. The largest volume of outflow and inflow to the aquifer occurs because of agriculture activities and irrigation return flow at 39 agriculture fields (Figure 1) that are using 41341 active wells in the year 2019. The total area of agricultural land and number of active wells shows slight variation year by year among each location and total area is always higher in the east and northeast part. The volume of groundwater pumping, yearly contribution of water from nonconventional sources and yearly area of agricultural land reported by the Statistical Centre of Abu Dhabi (SCAD) [40] is used for the estimation of groundwater pumping and irrigation return flow (Rir) per each km2 of agriculture land (Table 1). The volume of irrigation return flow is purely based on the method of irrigation followed by particular concern and estimated using
where Qir is gross irrigation water demand (m3 yr−1) known from the contribution of groundwater and nonconventional water; Ec and Ea are coefficients of conveyance loss and application loss respectively.
Rir = (1 − EcEa)Qir

Table 1.
Estimation rate of groundwater pumping and irrigation return flow (Rir) [40].
The method of irrigation followed by Abu Dhabi is a micro irrigation system (92% of green GDP) reason that the conveyance loss and application loss is minimal. Average groundwater pumping as per the size of the agriculture field estimated from the rate of groundwater pumping given by SCAD is 3.29 MCMYr−1 per km2 in the north and Piedmont area and 3.95 MCMYr−1 per km2 in the sand dune and sabkha region. The irrigation return flow using nationwide coefficients of conveyance loss (0.95) and application loss (0.9) in Equation (1) is 14.5% of gross agriculture water demand as shown in Table 1.
As the volume of nonconventional water is increasing year by year, the contribution in terms of irrigation return flow is also increased considerably year by year and continuing as a major source of aquifer recharge than any other kind of inflow to the aquifer. However, detection of the rate of groundwater extraction is not significant due to increased area of agriculture activities. The groundwater pumping for the activities other than agriculture are domestic (only in the east), industrial, and feed to brackish desalination plants located inland (SW) are limited to 59 MCMYr−1. The excess water demand in the prior two sectors are contributed by nonconventional water since the past decade. It is necessary to predict the groundwater using the current trend of groundwater extraction and the contribution of nonconventional water to see the influence of present groundwater management practices.
3. Methods
3.1. Numerical Code
SEAWAT [52,53], a finite difference numerical code is used in this study to simulate the variable density groundwater flow and solute transport. The principal formulation of variable density flow (VDF) in SEAWAT is similar to MODFLOW [53] that simulates groundwater flow using a constant density. And the solute transport is compiled by integrated MT3DMS [54] using aquifer transport properties, head, and reference fluid density defined by solute species. The salinity concentration (gL−1) is used as solute species for the reference fluid density calculation by run engine and slope value (DRHODC) is estimated using the concentration of salinity in the Persian sea and freshwater.
3.2. Model Geometry
A finite difference mesh in SEAWAT was used to discretize the mainland of Abu Dhabi. The model domain covers an area of 67,340 km2. In order to have a reasonable computational cost, it is discretized by a regularly spaced grid of 154 columns and 92 rows with cell size of 9 km2. After the model calibration, a grid refinement with cell size of 0.09 km2 at the SASR site has been made in order to simulate the pond recharge.
The topographic elevation is extracted from SRTM DEM with a resolution of 90 m which is accurate enough for the grid size used in the model domain. Vertically, the model consists of three geological units namely: surficial aquifer, upper fars, and lower fars. The collective thickness of three geological unities varies from 155 m in the coastal boundary to 1163 m in the eastern part. A nine-layer model is developed in which the top four layers represent the surficial aquifer and upper fars. The saturated thickness of the surficial aquifer and upper fars is equally distributed among the four layers for successful convergence during groundwater pumping. The thickness of layers varies from 0.1 m at the coast to 306 m at Jabal Hafit Mountain. In the lower fars less conductive evaporites are present from layers five to nine.
3.3. Boundary Conditions
A set of boundary conditions were implemented based on the physical nature of the aquifer, flow vectors, and salinity gradient across the model domain (Figure 2). The aquifer is a transboundary aquifer with one well-defined physical boundary on the coast. The recharge occurs on the eastern side and discharge occurs on all the remaining N, S, and S–W sides acting as outflow face based on groundwater elevation difference between inside and outside of the model domain. A zero-level constant head boundary condition is assumed along the coastal boundary. For the rest of the sides, a Constant Head condition in the east and General Head condition along N, S, and S–W is used with respective values of groundwater head at each cell. The rainfall recharge is estimated using known groundwater fluctuation against the total volume of rainfall at selective locations. The estimated precipitation recharge of 2% at the dune surface and 5% at the Piedmont and northern part of the dune surface, and evapotranspiration at the rate of 62.05 mmyr−1 with the extinction depth of 2 m are assigned using RCH and EVT packages [5]. Due to nil infiltration and the absence of groundwater fluctuation, rainfall recharge is not applicable at Sabkha. Groundwater exploitation is represented in the model using well (municipality wells) and multi-node well (MNW) (agriculture wells) packages.

Figure 2.
Conceptualized hydrogeological model of Abu Dhabi aquifer.
3.4. Model Parameters
Several soil tests and pumping tests were conducted as part of the GWRP project between the years 1988 and 1995 at more than a hundred locations [4]. The aquifer properties were extracted from the above report published by [4,38]. In a particular way, the hydraulic conductivity assigned in the top four layers ranges from 2.74 × 10⁻⁸ md−1 to 266 md−1. The maximum hydraulic conductivity value is assigned in the calcareous outcrops in the eastern part of the model domain. The specific yield varies from 0.019 to 0.31 (-). The highest value is assigned for the calcareous outcrops in the east followed by 0.25 (-) in the sand dunes. Where confined conditions occur, the storativity is given between 1 × 10⁻⁵ (-) in the western part and a maximum of 0.007 (-)in the eastern part. The presence of anisotropy has been taken into account in that the horizontal conductivity is significantly higher than the vertical conductivity. The anisotropy is calibrated as 0.1, 0.3, and 0.5 in the eastern part, dune surface, and coastal sabkha of the first four layers and 0.1 is assigned in the deeper five layers.
The rate of evaporation was set to 1.7 × 10⁻⁴ md−1 with an extinction depth of 2 m. A recharge factor and its hydrodynamic response is considered. The fluctuation of groundwater table up to 1.5 m is assigned for the annual cycle along half of the northern boundary and the fluctuation of 0.15 m is assigned for the annual cycle along S and S–W using general head condition with the same value of conductance. Due to the nature of the rainfall recharge and drainage transmission loss from the Hajar Mountain chain, a recharge boundary condition using multi-node wells is assigned with a high range of variation of 593 m3d−1 to 1410 m3d−1 in the N–E to 40 m3d−1 in the center part of the eastern boundary. The bottom five layers from 5 to 9 were assigned with no flow boundary as a representation of low hydraulic conductive formation. The model was simulated with the given rate of groundwater pumping.
Due to the presence of a freshwater lens of palaeo-origin in the dune surface, the source sink package was activated to introduce the solute boundary condition. Using constant head boundary condition (CHD), the salinity of 42 (gL−1) is assigned along the coast of Abu Dhabi which is the reported salinity in the Persian sea. Groundwater recharge by areal and lateral means is assumed as freshwater and 1.0 gL−1 salinity is introduced for four layers at the top. By considering the formation time of deeper layers and the recent increase in the concentration of salinity in the Persian Gulf, the universally accepted seawater salinity concentration of 35 gL−1 is assigned for the rest of the deeper layers. The slope value in the variable density package is site-specific. Hence, the value of 0.7523 substitutes the default value of 0.7143 owing to increased concentration of salinity in the Persian sea.
The advection, dispersivity, and molecular diffusion are activated simultaneously for the given mass transport under the calculated density variation. The schemes of advection strongly impact the process of mass transport simulation. A third-order total variation diminishing (TVD) numerical scheme is used in advection processes [55].
In order to obtain the best match between spatially observed and simulated values of salinity, several attempts were made by adjusting the solute transport properties. By keeping the constant value of slope between seawater and freshwater, parameters such as longitudinal dispersivity and vertical transverse dispersivity are adjusted to 2500 m and 750 m. The molecular diffusion is fixed as 10−5 m2d−1. The attempt was made without affecting the calibrated groundwater flow parameters.
3.5. Model Calibration
The distribution of groundwater head and salinity measured at 68 monitoring wells during January 2000 is used for the purpose of calibration.
The coupled flow and transport model is simulated using monthly stress periods, with daily time steps and 0.5 day transport steps, and the simulated heads and salinity were compared with observed groundwater head and salinity until a quasi-steady-state condition occurs. In order words, as long as the flow and mass budget for the whole domain remains almost constant over time.
The final estimated aquifer parameters are obtained by targeting the least difference between the observed and simulated groundwater head. The calibrated groundwater head from known well points is obtained with R2 value of 0.98 (Figure 3a). The comparison of relative salinity obtained from the variable density flow model with hydrodynamic stresses confirms that the developed model is responding well in order to represent the existing condition of the aquifer under given hydrodynamic stresses (Figure 3b).

Figure 3.
(a) Comparison of observed and simulated groundwater head (m); (b) comparison between observed and simulated relative salinity (gL−1) at pseudo steady-state conditions.
The spatial distribution of salinity obeys the morphology of the regional aquifer. The model simulates the formation of the freshwater lens in the dune surface, high saline groundwater in the flat and shallow groundwater areas, and salinity concentration that trending from freshwater concentration to high saline concentration in the eastern part as an effect of recharge from Hajar mountain (Figure 4). The localized changes in the groundwater flow, upconing of deep saline water, and density stratification of groundwater are also noticed in the calibrated model.

Figure 4.
Spatial salinity of the calibrated model under quasi steady state condition.
After successful calibration of groundwater head and salinity distribution under quasi-steady-state conditions, the simulation was extended to calibrate the model under transient conditions for the period of 6 years from January 2000 to December 2005 (Figure 5).
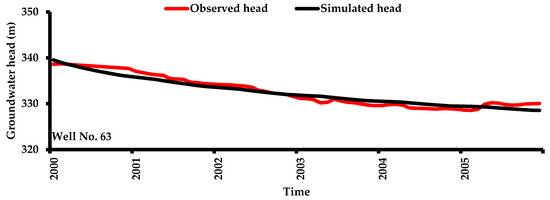
Figure 5.
Transient calibration of groundwater head at well No. 63.
Table 2 shows the final calibrated and estimated parameters derived from quasi-steady-state and transient calibration.
Table 2.
Calibrated flow and solute transport parameters.
To represent the transboundary conditions of the aquifer, the budgeting of flow across the border of Saudi Arabia (S and S–W) and Dubai Emirate (N) (Table 3) is achieved by using the conductance value of 2.32 m2d−1 and 3.45 m2d−1. The volume of coastal discharge into the Persian sea is obtained as 0.58 million cubic meter (MCM) for the year 2017, a 0.67% to evapotranspiration and 1.5% of eastern recharge assigned in the model domain. The volume of discharge is several times less than eastern recharge because of the flat coastal groundwater head and less conductive formation. Compared to the model developed by Eggleston et al. (2020), the coastal discharge and evapotranspiration were increased due to the bigger size of model domain in this case. Additionally, the 2% to 5% of rainfall used as recharge was calculated by the method of groundwater fluctuation and it is higher than the percentage of rainfall used by [38].
Table 3.
Comparison of reported and simulated water budget components in the year 2017 [25,43].
3.6. Implementation of SASR Structure
The SASR site is located at the central part of the dune surface (Figure 1). The elevation of groundwater head is 100 m AMSL with 44.5 m unsaturated zone above the groundwater head top. The concentration of salinity is 1.5 gL−1 and a steep concentration gradient towards all the directions may compensate for the absence of physical control. The SASR site has three infiltration ponds of 2600 m2 size facing at the angle of 90 degrees each one resembling a shape of an equilateral triangle. The infiltration pond serves a better rate of recharge with nil forced convection. To implement the pond recharge in the model domain, the grid size at the SASR site is redistributed at all the layers and net recharge is assigned in the appropriate grid to a size of 0.09 km2. The recharge was introduced from May 2015 at the rate of 26,500 m3d−1 and continued to the following 27 months. The threshold salinity concentration of source water was planned to maintain less than 0.25 gL−1. The quality of desalinated water in the year 2014 is given in Table 4 and shows that the salinity is not beyond 0.25 gL−1.
Table 4.
Desalinated water quality in the year 2014 [27].
4. Result and Discussion
4.1. Impact and Efficiency of SASR Structure
4.1.1. Storage Simulations
The simulation at the given rate of recharge results in a groundwater head increase by a maximum of 36.96 m at the end of 27 months (823 days). Similarly, the concentration of salinity is reduced to 0.44 gL−1 from the ambient groundwater salinity of 1.5 gL−1 (Figure 6).
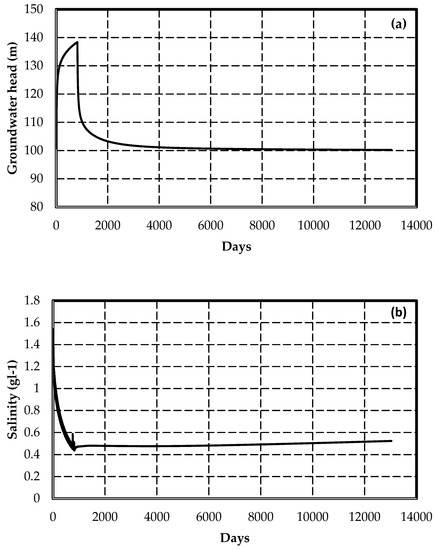
Figure 6.
Numerical results during the period of recharge (from May 2015) and long-term storage (up to 2050). (a) Elevation of groundwater head; (b) concentration of salinity (gL−1).
The regional influence in the groundwater head is noticed up to a distance of 5 km on all the sides symmetrically due to the presence of flat and gentle topography and groundwater gradient. Given the same recharge, the freshwater lens is also symmetrically formed with a radial distance (r) of 556.2 m at the end of 27 months (Figure 7). The area of freshwater lens is less than the area of regional increase in the groundwater head because of density contrast and formation of a transition zone between the freshwater and ambient groundwater. Keeping the storage undisturbed, a steep decline in the groundwater head is noticed for a short period of time (38 days) after the recharge cutoff. It is followed by a moderate and nil decline in the groundwater head.
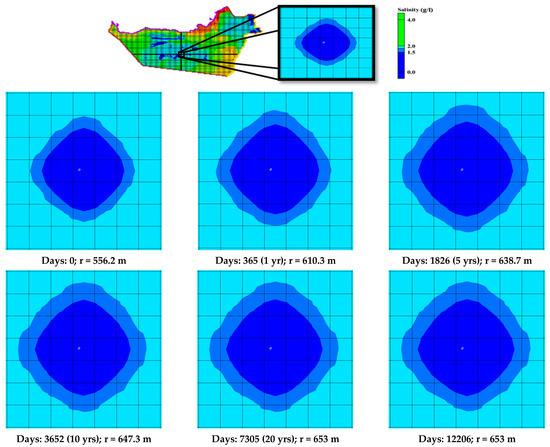
Figure 7.
Formation of freshwater lens during the period of recharge and long-term storage.
The elevated groundwater head lasts up to a period of 6642 days (July 2033) that reaches the groundwater head at the initial stage. In the case of groundwater salinity, the increase in the concentration after the recharge cutoff is not prominent. The maximum increase in the concentration of salinity is in second order (0.08 gL−1) up to the end of the year 2050. During the period of storage, the radial spreading of the freshwater lens is observed from the initial radial distance (r) of 556.2 m to 610.3 m, 621.7 m, 630.2 m, 638.7 m, 647.3 m, 650.1 m, and 653 m at the maximum during 0, 1, 5, 10, 20 and 33 years of storage (Figure 7). The observed spreading of the freshwater lens is varying from 54.1 m per annum during the first year of storage to 0.58 m per annum after fifteen years of storage. The spreading has become absent after twenty years of storage when it reaches the radial distance (r) of 653 m from the recharge pond. It is the same lasting period of elevated groundwater head. The thickness of the transition zone is increasing when the duration of storage increases. The transition zone with the salinity concentration of 1.8 gL−1 is increased from 152.6 m to 220.9 m at the maximum.
4.1.2. Recovery Simulations
By approaching several ranges of recovery (Figure 8) using net discharge from the total area of 0.81 km2 that includes the enclosing peripheral grids where recharge is assigned, 70% of recovery is obtained at the maximum with the drawdown of 46.7 m from the ambient groundwater head.

Figure 8.
Numerical results at various rates of recovery. Fluctuation of groundwater head (a); concentration of salinity (b).
After the period of recovery, it is noticed that the salinity is increasing up to 2.41 gL−1 which is higher than the ambient groundwater salinity of 1.5 gL−1. The recovery of salinity to preoperational conditions is not achieved until the end of the year 2050 in this case. The salinity is under permissible limit during the period of recovery but the drawdown of 46.7 m allows upconing of deeper groundwater and lateral mixing of native groundwater from the periphery of the recovery zone. It is understood that an increase in the salinity after the period of recovery may end up with the permanent loss of preexisting freshwater zone in the site. Additionally, it will enhance the formation of the thicker transition zone and reduce the efficiency of successive cycles of storage and recovery. The model simulation with 50% of recovery allows drawdown of 26.7 m from the ambient groundwater head and leaves the post-recovery salinity equivalent to ambient groundwater salinity. In the case of 70% recovery, in addition to monitoring the concentration of salinity during the period of recovery, maintaining the groundwater head near the level of ambient groundwater head will be recommended. The mixing of ambient groundwater salinity can be minimized in this way. It is also possible to minimize the drawdown using extended area of recovery and uneven rate of recovery from the lower rate at the outer to higher rate at the center of the pond. This investigation in detail is supposed to be carried out using more data and development of density model at a local scale.
4.2. Impact of Non-Conventional Water in Agriculture Field
The model simulation from the year 2021 to 2050 with appropriate recharge, evaporation, current rate of groundwater pumping at each sector, and irrigation return flow per each km2 of agriculture field predicts both the increasing and decreasing trend of groundwater head and concentration of salinity. The predicted change in the groundwater head and concentration of salinity is less significant in the majority of wells located in the sand dune area. In the north of sand dune area and piedmont region (eastern part), the overall groundwater quality is improved by detection in the concentration of salinity by 0.260 gL−1, and groundwater head is increased by 0.69 m on average. The maximum increase in the groundwater head is noticed at well no. 54 by 5.16 m with detection in the concentration of salinity by 0.28 gL−1 (Figure 9a). It is followed by 3.84 m and 2.77 m increase in the groundwater head at well no. 60 and 49. The dilution of salinity concentration noticed in these locations is 0.51 gL−1 and 0.63 gL−1. The increase in the groundwater head at various magnitudes with an improvement in the groundwater quality confirms the recovery of groundwater head caused by the contribution of nonconventional water and irrigation return flow. The decline in the groundwater head with quality deterioration is predicted at some of the locations where it demands reduction in the groundwater pumping and additional contribution of nonconventional water. The maximum decline in the groundwater head is noticed at well no 50 which is present in the area of groundwater depression. The zone of groundwater depression was previously developed due to the pumping of groundwater for many decades in the agriculture fields at Remah, Bedafare, and adjoining areas. At the present rate of groundwater pumping, a further decline in the groundwater head by 6.71 m is noticed with the deterioration of groundwater quality by 0.86 gL−1. Next, the groundwater head decline of 6.48 m is noticed in well no. 58 and 59 which are located around the agriculture field, Al Hayer. The water derived from the hot spring located in the valley of Jabal Hafit is improving groundwater head in the adjacent areas. The impact of hot water spring is noticed up to well no. 62 located at a distance of 18 km. It shows an increase in the groundwater head by 0.35 m with an improvement in the groundwater salinity by 0.45 m (Figure 9e). The improvement of groundwater head is high as 12.07 m with improvement in the concentration of groundwater salinity by 0.09 gL−1 is measured in the model grid adjacent to the hot water spring (Figure 9f). In the sand dune area, the concentration of salinity is increased by 0.260 gL−1 on average and the groundwater head remains unchanged in most of the wells and gives an average change of −0.025 m. The maximum predicted changes in the groundwater head is varying from −2.44 m to 1 m and changes in the concentration of salinity between 0.03 and −1.62 gL−1 in the well no. 11 and 40. The well with quality deterioration is present at the northern downstream side of the agriculture field at Liwa. Along the coastal region, the groundwater is reaching the ground surface with a maximum increase in the salinity by 1 gL−1 in the northern coast. Increasing the contribution of nonconventional water to agriculture activities may lead to a further increase in the area of groundwater seepage. Other locations that are having groundwater heads close to the ground surface are downstream of the hot spring and at well no. 47. The reported volume of subsurface flow from Wadi Dank and barrier effect ahead towards flow direction due to the presence of groundwater mound at dune surface may be responsible for an increase in the groundwater head at well no. 47.
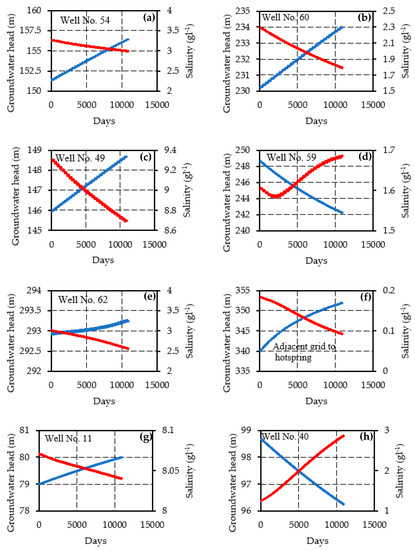
Figure 9.
Predicted change in groundwater head and concentration of salinity from the year 2021 to 2050 using the current rate of groundwater pumping and irrigation return flow in correspondence of: (a) Well No. 54; (b) Well No. 60; (c) Well No. 49; (d) Well No. 59; (e) Well No. 62; (f) Adjacent grid to hotspring; (g) Wll No. 11; (h)Well No. 40.
The present rate of nonconventional water and irrigation return flow serves mainly to avoid over-pumping of groundwater and considerable recovery of groundwater at some locations. However, it is also obvious that the concentration of irrigation return flow may vary from place to place due to the consumption of fertilizers, pesticides, interaction with root zone and soil matrix in the agriculture field. The model simulation using the same volume of irrigation return flow at each location with several ranges of concentration shows a considerable increase in the concentration of groundwater in the north and Piedmont region by a maximum of 0.1 gL−1 under maximum simulated concentration of 2 gL−1 (Table 5). In the sand dune area, the predicted change is in fourth order and considered as nil. It is due to fewer and sparse agriculture activities on the dune surface. There is nil change in the predicted groundwater head in all the attempts with several ranges of concentration. Even the changes predicted in the north and Piedmont region are also very limited due to less volume of irrigation return flow than the total volume of groundwater pumping in comparison.
Table 5.
Impact of irrigation return flow concentration and an additional contribution of nonconventional water.
The estimated contribution of nonconventional sources is increased from 5% in the year 2000 to 13.6% in the recent year (2019). Further increase in the volume of contribution might be possible in the coming years. The model simulated with an additional contribution of nonconventional water at the rate of 1% of the total volume of groundwater pumping per annum to 3% of the total volume of groundwater pumping per annum at each agriculture field results in an increase in the groundwater head by a maximum of 5.35 m in the north and piedmont region and 1.12 m in the sand dune area (Table 5). The concentration of salinity is reduced by a maximum of 0.71 gL−1 and 0.1 gL−1 respectively.
Potential and Limitation of the Regional Model
The conducted numerical simulation at a regional scale tested the practicability of the use of desalinated and recycled water as a strategy to improve the water budget and water quality of the Abu Dhabi surficial aquifer. Despite the apparent simplicity of the application of the SASR and non-conventional water for Agricultural Water Management Strategies, the complexity of site-specific hydrogeological conditions and the processes involving various spatial and temporal scales may affect the success and failure of the interventions.
The regional model is used for a prior selection and evaluation of a potential site for the application of SASR and non-conventional water for Agricultural Water Management Strategies. Therefore, the proposed methodology represents a first approach to the problem where important features such as clogging, geochemical processes, and aquifer heterogeneities at local scale have not been considered. Besides, the implemented model represents a valuable tool for a preliminary assessment, strongly recommended prior to pilot field experiments. Once the promising site has been screened and evaluated, further field investigations and more complex models at a local scale are needed in order to evaluate the feasibility of aquifer recharge interventions.
For a better assessment of Aquifer Storage and Recovery Feasibility, the proposed regional model could be combined with a groundwater quality and land use evaluation by means of advanced geostatistical techniques in order to determine the ASR suitability and its applicability to regional water management.
A combination of criteria among hydrogeologic properties, operational considerations, and regulatory influences established by the user’s purpose for ASR will determine an ASR suitability index (SI) together with a set of potential ASR well locations, based on the assumption of maximizing ASR effectiveness while minimizing any impacts.
A further step forward could be to develop ASR site scoring systems to qualitatively assess both regional and local suitability of ASR, which will take into account the spatial variability at a local scale.
This will also provide current limitations and/or potential benefits of developing ASR systems at the local scale with the aim of assisting local water managers in developing strategies for long-term water supply planning.
5. Conclusions
A regional-scale coupled flow and solute transport model of the Abu Dhabi aquifer is successfully developed using reported values of inflow and outflow. In this case study, irrigation return flow is playing a major source of aquifer recharge. The use of nonconventional water contributions such as desalinated and recycled water for agriculture activities are inducing recovery of groundwater heads at selective locations. The average recovery of groundwater head and groundwater salinity is 0.69 m and 0.26 gL−1 in the north of the sand dune and Piedmont region. The maximum occurrence of changes in the groundwater head is noticed as 6.71 m to 5.15 m and 0.63 gL−1 to 0.86 gL−1 in the north of the sand dune area and Piedmont region. In the dune surface, the predicted change is negligible while the maximum decline of groundwater head is noticed up to 2.45 m in the downstream side of the agriculture field at Liwa. The groundwater decline in the north of sand dune and Piedmont region is predicted at Al Hayer, Remah, and Bedafare. Along the coastal region, an increase in the salinity is noticed by a maximum of 1 gL−1 in the north. The water discharge from the hot spring increases groundwater head in the adjacent area by 12.07 m with a considerable dilution of groundwater salinity.
The model simulation using estimated irrigation return flow with increased concentration of salinity up to 2 gL−1 predicts a considerable deterioration of groundwater quality on average. Further increased nonconventional water from 1 to 3% per year to agriculture field induces recovery of groundwater head by a maximum of 5.35 m with a reduction in the salinity concentration by a maximum of 0.71 gL−1.
The investigation of long-term nonconventional water storage using SASR structure confirms prior feasibility of long-term storage in correspondence of the paleo freshwater lens. In addition to monitoring the groundwater salinity, it is also recommended to avoid maximum drawdown from the static groundwater head during the period of recovery.
The present study confirms the prior feasibility of long-term freshwater storage at the SASR site and the need for additonal contribution from nonconventional water at selective locations. The study also recommends rational use of nonconventional water especially in the coastal region, downstream of hot springs and Wadi Dank.
Aquifer Storage and Recovery is of increasing importance to water resources management. ASR can be used to buffer against drought and climate changes, as well as to provide water to meet demand growth, by making use of excess surface water supplies and recycled waters.
This study can assist water-resource managers and decision-makers in identifying opportunities to utilize ASR as a water management strategy to achieve a long-term sustainable use of groundwater.
The approach presented in this paper can be adopted as a method in the management of the water resource by which mitigations interventions could be simulated and then implemented on both water quality and quantity. The simulation of different scenarios of interventions will permit to identify promising sites where field investigation and pilot test together with numerical simulation at local scale will permit to estimate the long term feasibility of aquifer recharge and its protection to seawater intrusion.
The proposed approach could also be applied to further studies aimed at mitigating groundwater quality degradation and hydraulic head depletion by using other sources of water like rainwater and therefore reducing the runoff to the sea. This could help relevant policy and decision-makers in adopting strategic actions to ensure a long-term supply of clean water.
Author Contributions
Conceptualization, S.S., C.C. and N.P.; Methodology, S.S., C.C. and N.P.; Validation, S.S., C.C. and N.P.; Resources, S.S. and C.C.; Data Curation, S.S., C.C.; Writing—Original Draft Preparation, S.S. and C.C.; Writing—Review and Editing, C.C., N.P. and D.R.; Supervision, C.C. and C.I.G.; Project Administration, C.C.; Funding Acquisition, C.C. All authors have read and agreed to the published version of the manuscript.
Funding
The fellowship of the present work is funded by The Italian Ministry of Education, Universities and Research.
Institutional Review Board Statement
Not applicable.
Informed Consent Statement
Not applicable.
Acknowledgments
The authors wish to acknowledge MIUR Funds, Department of Excellence LP4—CUP F71G18000210001 for the research grant.
Conflicts of Interest
The authors have no conflict of interest to declare.
References
- United Nations Educational, Scientific and Cultural Organization (UNESCO). Valuing Water. UNESCO World Water Assessment Programme. 2021. Available online: https://unhabitat.org/sites/default/files/2021/07/375724eng_1.pdf (accessed on 9 October 2021).
- UN Water. Managing Water under Uncertainty and Risk—World Water Development Report 4; UNESCO Report; UN Water: Paris, France, 2012; Volume 1. [Google Scholar]
- Huang, F.; Zhang, Y.; Zhang, D.; Chen, X. Environmental groundwater depth for groundwater-dependent terrestrial ecosystems in arid/semiarid regions: A review. Int. J. Environ. Res. Public Health 2019, 16, 763. [Google Scholar] [CrossRef]
- US Geological Survey. Bibliography of National Drilling Company–United States Geological Survey Reports on the Water Resources of Abu Dhabi Emirate; U.S Geological Survey Open File Report; NDC–USGS: Al Ain, United Arab Emirates, 1996.
- Sathish, S.; Mohamed, M.; Klammer, H. Regional groundwater flow model for Abu Dhabi Emirate: Scenario based investigation. Environ. Earth Sci. 2018, 77, 409. [Google Scholar] [CrossRef]
- Dawoud, M.A. Groundwater economics in arid regions: Abu Dhabi Emirate case study. In Proceedings of the 13th Gulf Water Conference Proceedings, Desalination and Water Treatment, Kuwait, 12–14 March 2019; Volume 176. [Google Scholar]
- Hutchinson, C.B. Groundwater Resources of Abu Dhabi Emirate: National Drilling Company—U.S. Geological Survey Administrative Report, Prepared for the National Drilling Company, Abu Dhabi. 2006. Available online: https://pubs.usgs.gov/of/1998/0018/report.pdf (accessed on 10 May 2021).
- Tadros, S.H.; Huneidi, I. Falajes of Al Ain Area. National Drilling Company Administrative Report; Abu Dhabi Emirate; 1994. Available online: https://pubs.usgs.gov/of/1998/0018/report.pdf (accessed on 10 May 2021).
- Rizk, Z.S. Determining the sources of nitrate pollution of the Liwa Quaternary Aquifer in the United Arab Emirates. In Proceedings of the WSTA 11th Gulf Water Conference, Muscat, Oman, 20–22 October 2014; pp. 120–136. Available online: https://wstagcc.org/WSTA-11th-Gulf-Water-Conference/WSTA-11th-Gulf-Water-Conference-Proceedings.pdf (accessed on 10 May 2021).
- Brook, M.; Houqani, H. Current Status of Aflaj in the Al Ain Area, United Arab Emirates: United Arab Emirates, Enviroment Agency Abu Dhabi. 2006, p. 27. Available online: http://enhg.org/resources/articles/al_ain_falaj/Al_%20Ain_Falaj_Report.pdf (accessed on 23 March 2021).
- Murad, A.A.; Nuaimi, H.A.; Hammadi, M.A. Comprehensive assessment of water resources in the United Arab Emirates. Water Resour. Manag. 2007, 21, 1449–1463. [Google Scholar] [CrossRef]
- Sherif, M.; Sefelnasr, A.; Ebraheem, A.A.; Mulla, M.; Alzaabi, M.; Alghafli, K. Spatial and Temporal Changes of Groundwter Storage in the Quarternary Aquifer, UAE. Water 2021, 13, 864. [Google Scholar] [CrossRef]
- Raouf, M.A. Water Issues in the Gulf: Time for Action. The Middle East Institute Policy Brief No. 22. 2009. Available online: https://www.files.ethz.ch/isn/95680/No_22_Water_Issues_in_the_Gulf.pdf (accessed on 23 March 2021).
- Hajeeh, M. Technical note: Water conservation in Kuwait: A fuzzy analysis approach. J. Ind. Eng. Int. 2010, 6, 90–105. [Google Scholar]
- Zarabi, M.; Jalali, M. Leaching of nitrogen from calcareous soils in western Iran: A soil leaching column study. Environ. Monit. Assess. 2012, 184, 7607–7622. [Google Scholar] [CrossRef] [PubMed]
- UNDP Water Governance in the Arab Region, Managing Scarcity and Securing the Future. Regional Bureau for Arab States, United Nations Development Programme, USA. 2013. Available online: https://www.arabdevelopmentportal.com/sites/default/files/publication/800.water_governance_in_the_arab_region_managing_scarcity_and_securing_the_future.pdf (accessed on 25 March 2021).
- Hussain, M.S.; Abd-elhamid, J.A.A. Management of seawater intrusion in coastal aquifers: A review. Water 2019, 11, 2467. [Google Scholar] [CrossRef]
- Hassane, R.B.; Yebdri, D.; Tidjani, A. Climate change and water resources management of Oran region. J. Water Clim. Chang. 2017, 8, 348–361. [Google Scholar] [CrossRef]
- Sathish, S.; Mohamed, M.M. Assessment of aquifer storage and recovery (ASR) feasibility at selected sites in the Emirate of Abu Dhabi, UAE. Environ Earth Sci. 2018, 77, 112. [Google Scholar] [CrossRef]
- Iqbal, J.; Nazzal, Y.; Howari, F.; Xavier, C.; Yousef, A. Hydrochemical processes determining the groundwater quality for irrigation use in an arid environment: The case of Liwa Aquifer, Abu Dhabi, United Arab Emirates. Ground. Sustain. Dev. 2018, 7, 212–219. [Google Scholar] [CrossRef]
- Paleologos, E.K.; Farouk, S.; Al Nahyan, M.T. Water resource management towards a sustainable water budget in the United Arab Emirates. In IOP Conference Series: Earth and Environmental Science, Proceedings of the 4th International Conference on Water Resources and Environment (WRE); IOP Publishing: Bristol, UK, 2018; Volume 191, p. 012007. [Google Scholar]
- Alhumimidi, M.S. An integrated approach for identification of seawater intrusion in coastal region: A case study of northwestern Saudi Arabia. J. King Saud. Univ. Sci. 2020, 3187–3194. [Google Scholar] [CrossRef]
- Sen, Z. (Ed.) Groundwater Management: Practical and Applied Hydrogeology; Elsevier Inc.: Amsterdam, The Netherlands, 2015; pp. 341–397. [Google Scholar]
- White, E.K.; Peterson, T.J.; Costelloe, J.; Western, A.W.; Carrara, E. Can we manage groundwater? A method to determine the quantitative testability of groundwater management plans. Water Resour. Res. 2016, 52, 4863–4882. [Google Scholar] [CrossRef]
- EAD Groundwater Atlas Abu Dhabi Emirate; Environment Agency: Abu Dhabi, United Arab Emirates, 2018; Volume 91.
- Schlumberger Water Services Strategic Aquifer Storage and Recovery (ASR) Project for the Western Region of the Emirate of Abu Dhabi, Liwa Pilot ASR System Final Report: Schlumberger Water Services, Abu Dhabi, United Arab Emirates. 2011. Available online: https://www.waterworld.com/home/article/16202435/aquifer-storage-recovery-in-arid-environments (accessed on 17 July 2021).
- Stuyfzand, P.J.; Smidt, E.; Zuurbier, K.G.; Hartog, N.; Dawoud, M.A. Observations and Prediction of Recovered Quality of Desalinated Seawater in the Strategic ASR Project in Liwa, Abu Dhabi. Water 2017, 9, 177. [Google Scholar] [CrossRef]
- Parimalarenganayaki, S. Managed Aquifer Recharge in the Gulf Countries: A Review and Selection Criteria. Arab. J. Sci. Eng. 2021, 46, 1–15. [Google Scholar] [CrossRef]
- UNESCO. Facing the Challenges: Case Studies and Indicators. UNESCO’s Contribution to The United Nations World Water Development Report, France. 2015. Available online: https://www.pseau.org/outils/ouvrages/unesco_wwdr_2015_case_studies_and_indicators_facing_the_challenges_2015.pdf (accessed on 14 March 2021).
- Khan, M.R.; Voss, C.I.; Yu, W.; Michael, H.A. Water resources management in the Ganges Basin: A comparison of three strategies for conjunctive use of groundwater and surface water. Water. Resour. Manag. 2014, 28, 1235–1250. [Google Scholar] [CrossRef]
- Zhang, K.; Xie, X.; Zhu, B.; Meng, S.; Yao, Y. Unexpected groundwater recovery with decreasing agricultural irrigation in the Yellow River Basin. Agric. Water. Manag. 2019, 213, 858–867. [Google Scholar] [CrossRef]
- Khezri, S. Evaluation of the aquifer storage and recovery pilot project in Liwa Area, Emirate of Abu Dhabi, UAE. Master’s Thesis, The University of Texas at Austin, Austin, TX, USA, 2010. [Google Scholar]
- Hussain, M.S.; Javadi, A.A.; Sherif, M.M.; Naseri-Karim-Vand, R. Control of saltwater intrusion by aquifer storage and recovery. Proc. Inst. Civ. Eng. Eng. Comp. Mech. 2016, 169, 148–155. [Google Scholar] [CrossRef]
- FAO. The State of the World’s Land and Water Resources for Food and Agriculture (SOLAW)—Managing Systems at Risk. Food and Agriculture Organization of the United Nations, Rome and Earthscan, London. 2011. Available online: http://www.fao.org/3/i1688e/i1688e00.htm (accessed on 15 March 2021).
- Wood, W.W.; Imes, J.L. Dating of Holocene ground–water recharge in western part of Abu Dhabi (United Arab Emirates): Constraints on global climate–change models. In Developments in Water Science; Elsevier: Amsterdam, The Netherlands, 2003; Volume 50, pp. 379–385. [Google Scholar]
- Halcrow, S.W. Partners. Report on the Water Resources of the TRUCIAL States. Engineering Report for the Trucial States Council. Water Resources Survey, Ministry of Agriculture and Fisheries, Dubai. 1969. Available online: https://www.agda.ae/en/catalogue/tna/fo/1016/840/n/39 (accessed on 12 March 2021).
- Ministry of Agriculture and Fisheries, Hydrology, Department of Soil and Water, Ministry of Agriculture and Fisheries, United Arab Emirates. 1993, Volume 3, p. 294. Available online: http://faolex.fao.org/docs/html/cam22456.htm (accessed on 12 March 2021).
- Eggleston, J.R.; Mack, T.J.; Imes, J.L.; Kress, W.; Woodward, D.W.; Bright, D.J. Hydrogeologic Framework and Simulation of Predevelopment Groundwater Flow, Eastern Abu Dhabi Emirate, United Arab Emirates. Scientific Investigation Report—USGS, U.S. Geological Survey Scientific Investigations Report; USGS: Reston, Virginia, 2020; p. 5158. Available online: https://pubs.er.usgs.gov/publication/sir20185158 (accessed on 12 March 2021).
- Brook, M. Water Resources of Abu Dhabi Emirate, UAE; Water Resources Department, Environment Agency: Abu Dhabi, United Arab Emirates, 2009; Available online: https://www.researchgate.net/publication/292017241_Water_resources_in_Abu_Dhabi_emirate_United_Arab_Emirates (accessed on 12 March 2021).
- SCAD Statistical Yearbook of Abu Dhabi 2019. Available online: https://www.scad.gov.ae/Release%20Documents/Statistical%20Yearbook%20of%20Abu%20Dhabi_2019_Annual_Yearly_en.pdf (accessed on 15 July 2021).
- GTZ Combined Artificial Recharge and Utilization of the Groundwater Resource in the Greater Liwa Area. Pilot Project Final Technical Report 2005b. Available online: https://www.giz.de/en/worldwide/18540.html (accessed on 9 October 2021).
- Osterkamp, W.R.; Lane, L.J.; Menges, C.M. Techniques of groundwater recharge estimates in arid/semi–arid areas, with examples from Abu Dhabi. J. Arid. Environ. 1995, 31, 349–369. [Google Scholar] [CrossRef]
- MWR Ministry of Water Resources, Sultanate of Oman, Water Attachment Position Paper. 1999. Available online: https://www.mrmwr.gov.om/web/mrmwr (accessed on 6 October 2021).
- Alsharhan, A.S.; Rizk, Z.A.; Nairn, A.E.M.; Bakhit, D.W. Hydrogeology of an Arid Region. The Arabian Gulf and Adjoining Areas; Elsevier: New York, NY, USA, 2001. [Google Scholar]
- Al Dhaheri, S.; Saji, A. Water quality and brine shrimp (Artemia sp.) population in Al Wathba Lake, Al Wathba Wetland Reserve, Abu Dhabi Emirate, UAE. Int. J. Biodivers. Conserv. 2013, 5, 281–288. [Google Scholar] [CrossRef]
- Lokier, S.W. Coastal Sabkha Preservation in the Arabian Gulf. Geoheritage 2013, 5, 11–22. [Google Scholar] [CrossRef]
- Lokier, S.W.; Steuber, T. Large-scale intertidal polygonal features of the Abu Dhabi coastline. Sedimentology 2009, 56, 609–621. [Google Scholar] [CrossRef]
- Stanford, W.E.; Wood, W.W. Hydrology of the coastal sabkhas of Abu Dhabi, United Arab Emirates. Hydrogeol. J. 2001, 9, 358–366. [Google Scholar] [CrossRef]
- Pavelic, P.; Nicholson, B.C.; Dillon, P.J.; Barry, K.E. Fate of disinfection by products in groundwater during aquifer storage and recovery with reclaimed water. J. Contam. Hydrol. 2005, 77, 119–141. [Google Scholar] [CrossRef]
- Lowry, C.S.; Anderson, M.P. An assessment of aquifer storage recovery using ground water flow models. Groundwater 2006, 44, 661–667. [Google Scholar] [CrossRef] [PubMed]
- Missimer, T.M.; Sinha, S.; Ghafour, N. Strategic aquifer storage and recovery of desalinated water to achieve water security in the GCC/MENA region. Int. J. Environ. Sustain. 2012, 1, 87–99. [Google Scholar] [CrossRef]
- Langevin, C.D.; Thome, D.T., Jr.; Dausman, A.M.; Sukop, M.C.; Guo, W. SEAWAT Version 4: A Computer Program for Simulation of Multi–Species Solute and Heat Transport. U.S. Geological Survey Techniques and Methods 6–A22. 2008; Volume 39. Available online: https://pubs.usgs.gov/tm/tm6a22/ (accessed on 12 March 2021).
- Harbaugh, A.W. MODFLOW–2005, the U.S. Geological Survey Modular Ground–Water Model—the Ground–Water Flow Process: U.S. Geological Survey Techniques and Methods 6–A16. 2005. Available online: https://pubs.usgs.gov/tm/2005/tm6A16/ (accessed on 12 March 2021).
- Zheng, C.; Wang, P.P. MT3DMS—A Modular Three–dimensional Multispecies Transport Model for Simulation of Advection, Dispersion and Chemical Reactions of Contaminants in Ground–Water Systems: Documentation and User’s Guide: U.S. Army Corps of Engineers Contract Report SERDP–99–1. 1999. Available online: http://www.geology.wisc.edu/~andy/g727/mt3dmanual.pdf (accessed on 14 March 2021).
- Harten, A. High resolution schemes for hyperbolic conservation laws. J. Comput. Phys. 1983, 43, 357–393. [Google Scholar] [CrossRef]


Publisher’s Note: MDPI stays neutral with regard to jurisdictional claims in published maps and institutional affiliations. |
© 2021 by the authors. Licensee MDPI, Basel, Switzerland. This article is an open access article distributed under the terms and conditions of the Creative Commons Attribution (CC BY) license (https://creativecommons.org/licenses/by/4.0/).