Correction: Hervás-Gámez, Carmen and Delgado-Ramos, Fernando. Are the Modern Drought Management Plans Modern Enough? The Guadalquivir River Basin Case in Spain. Water 2020, 12, 49


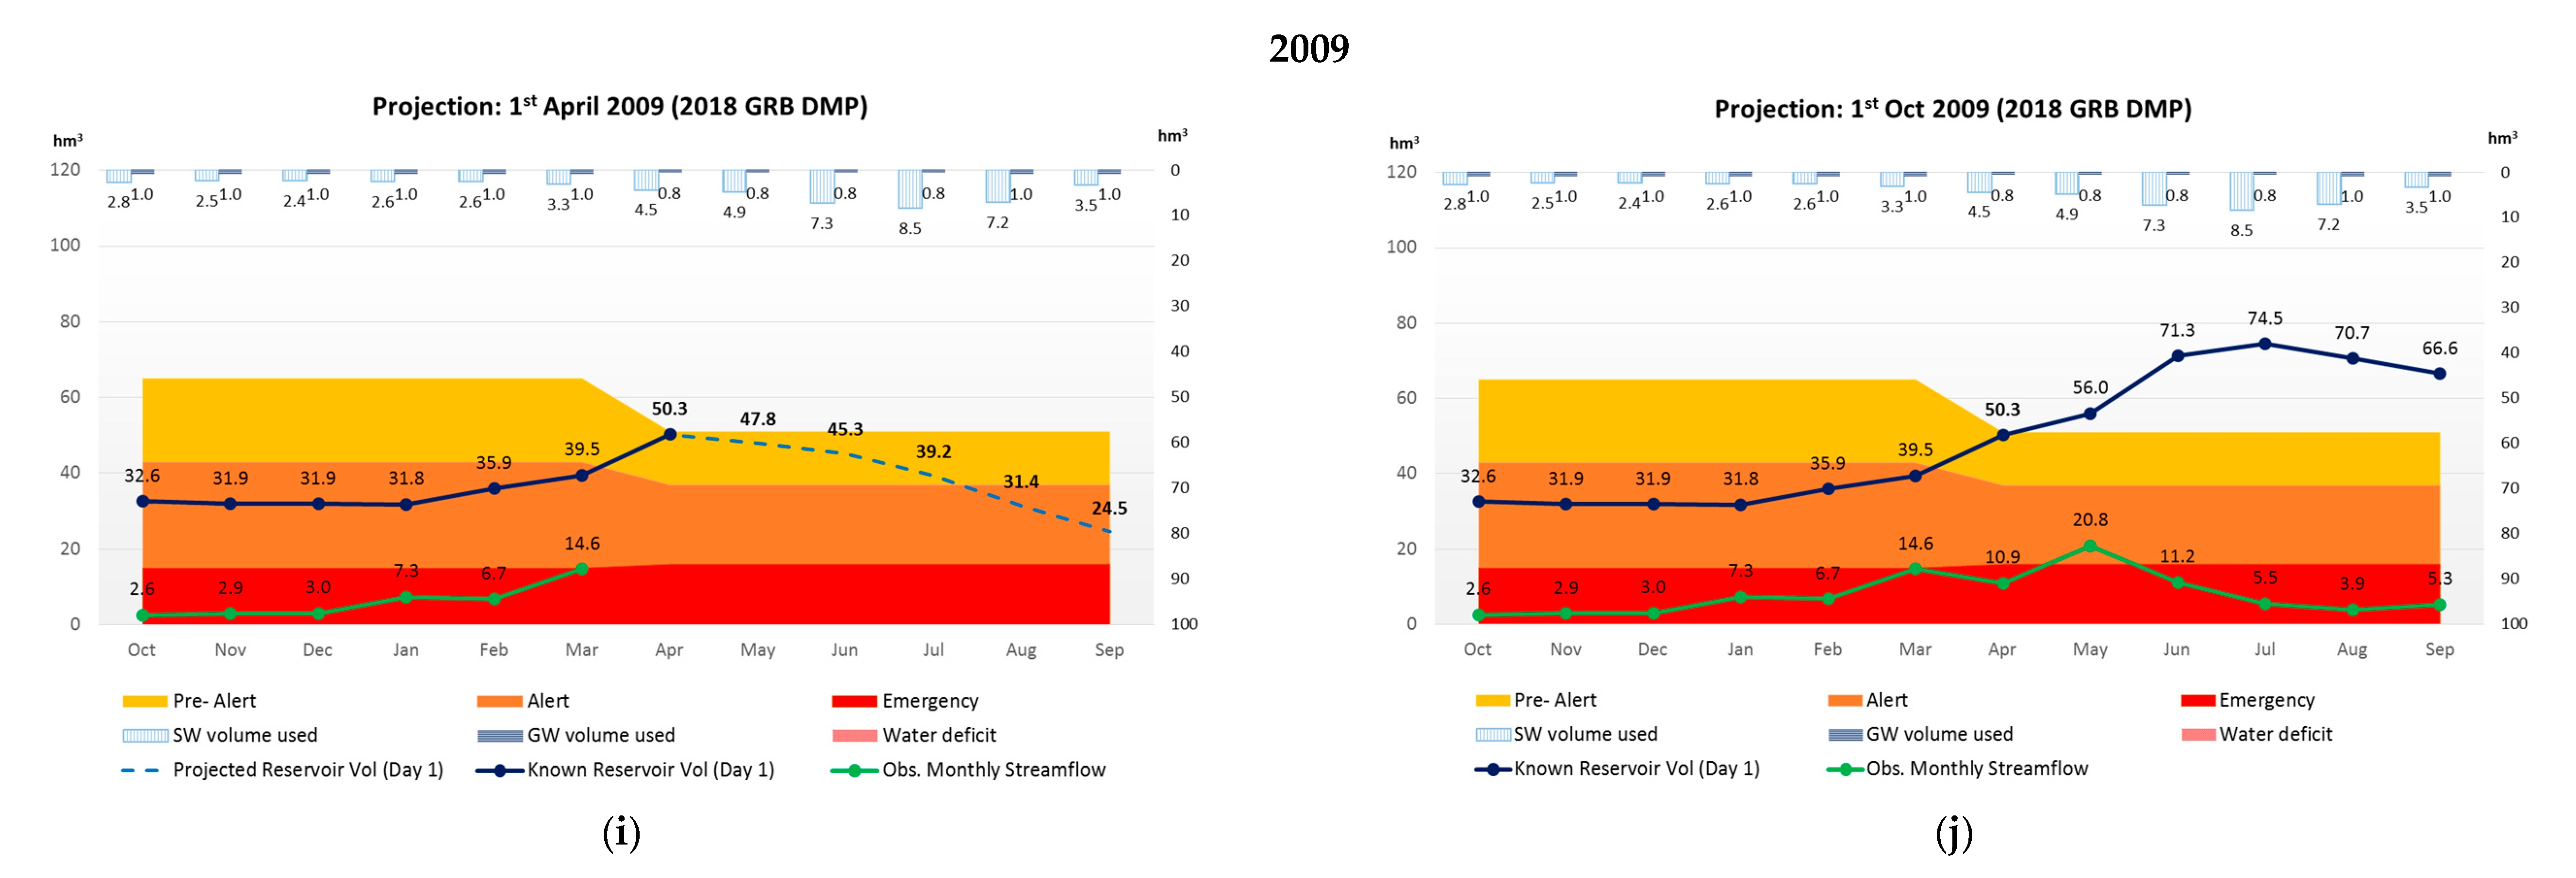
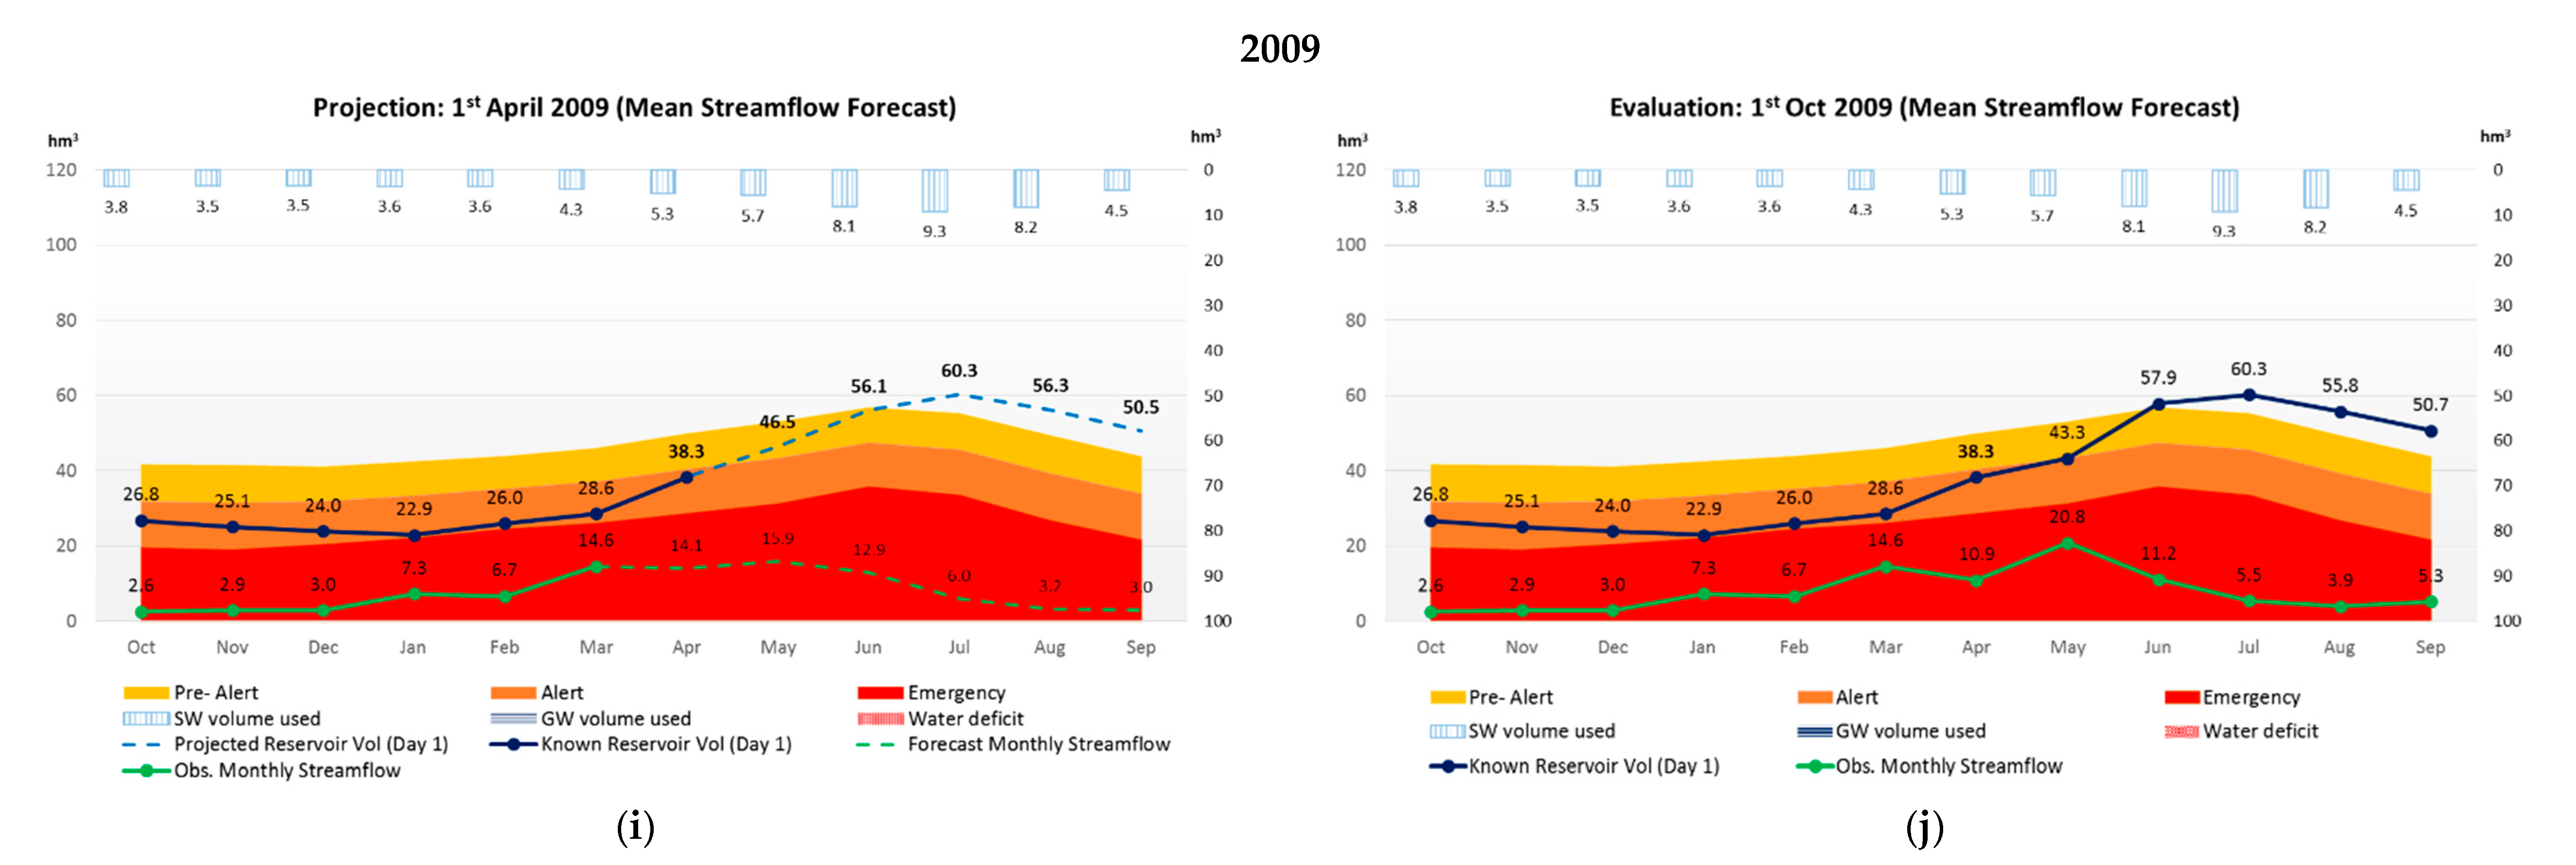
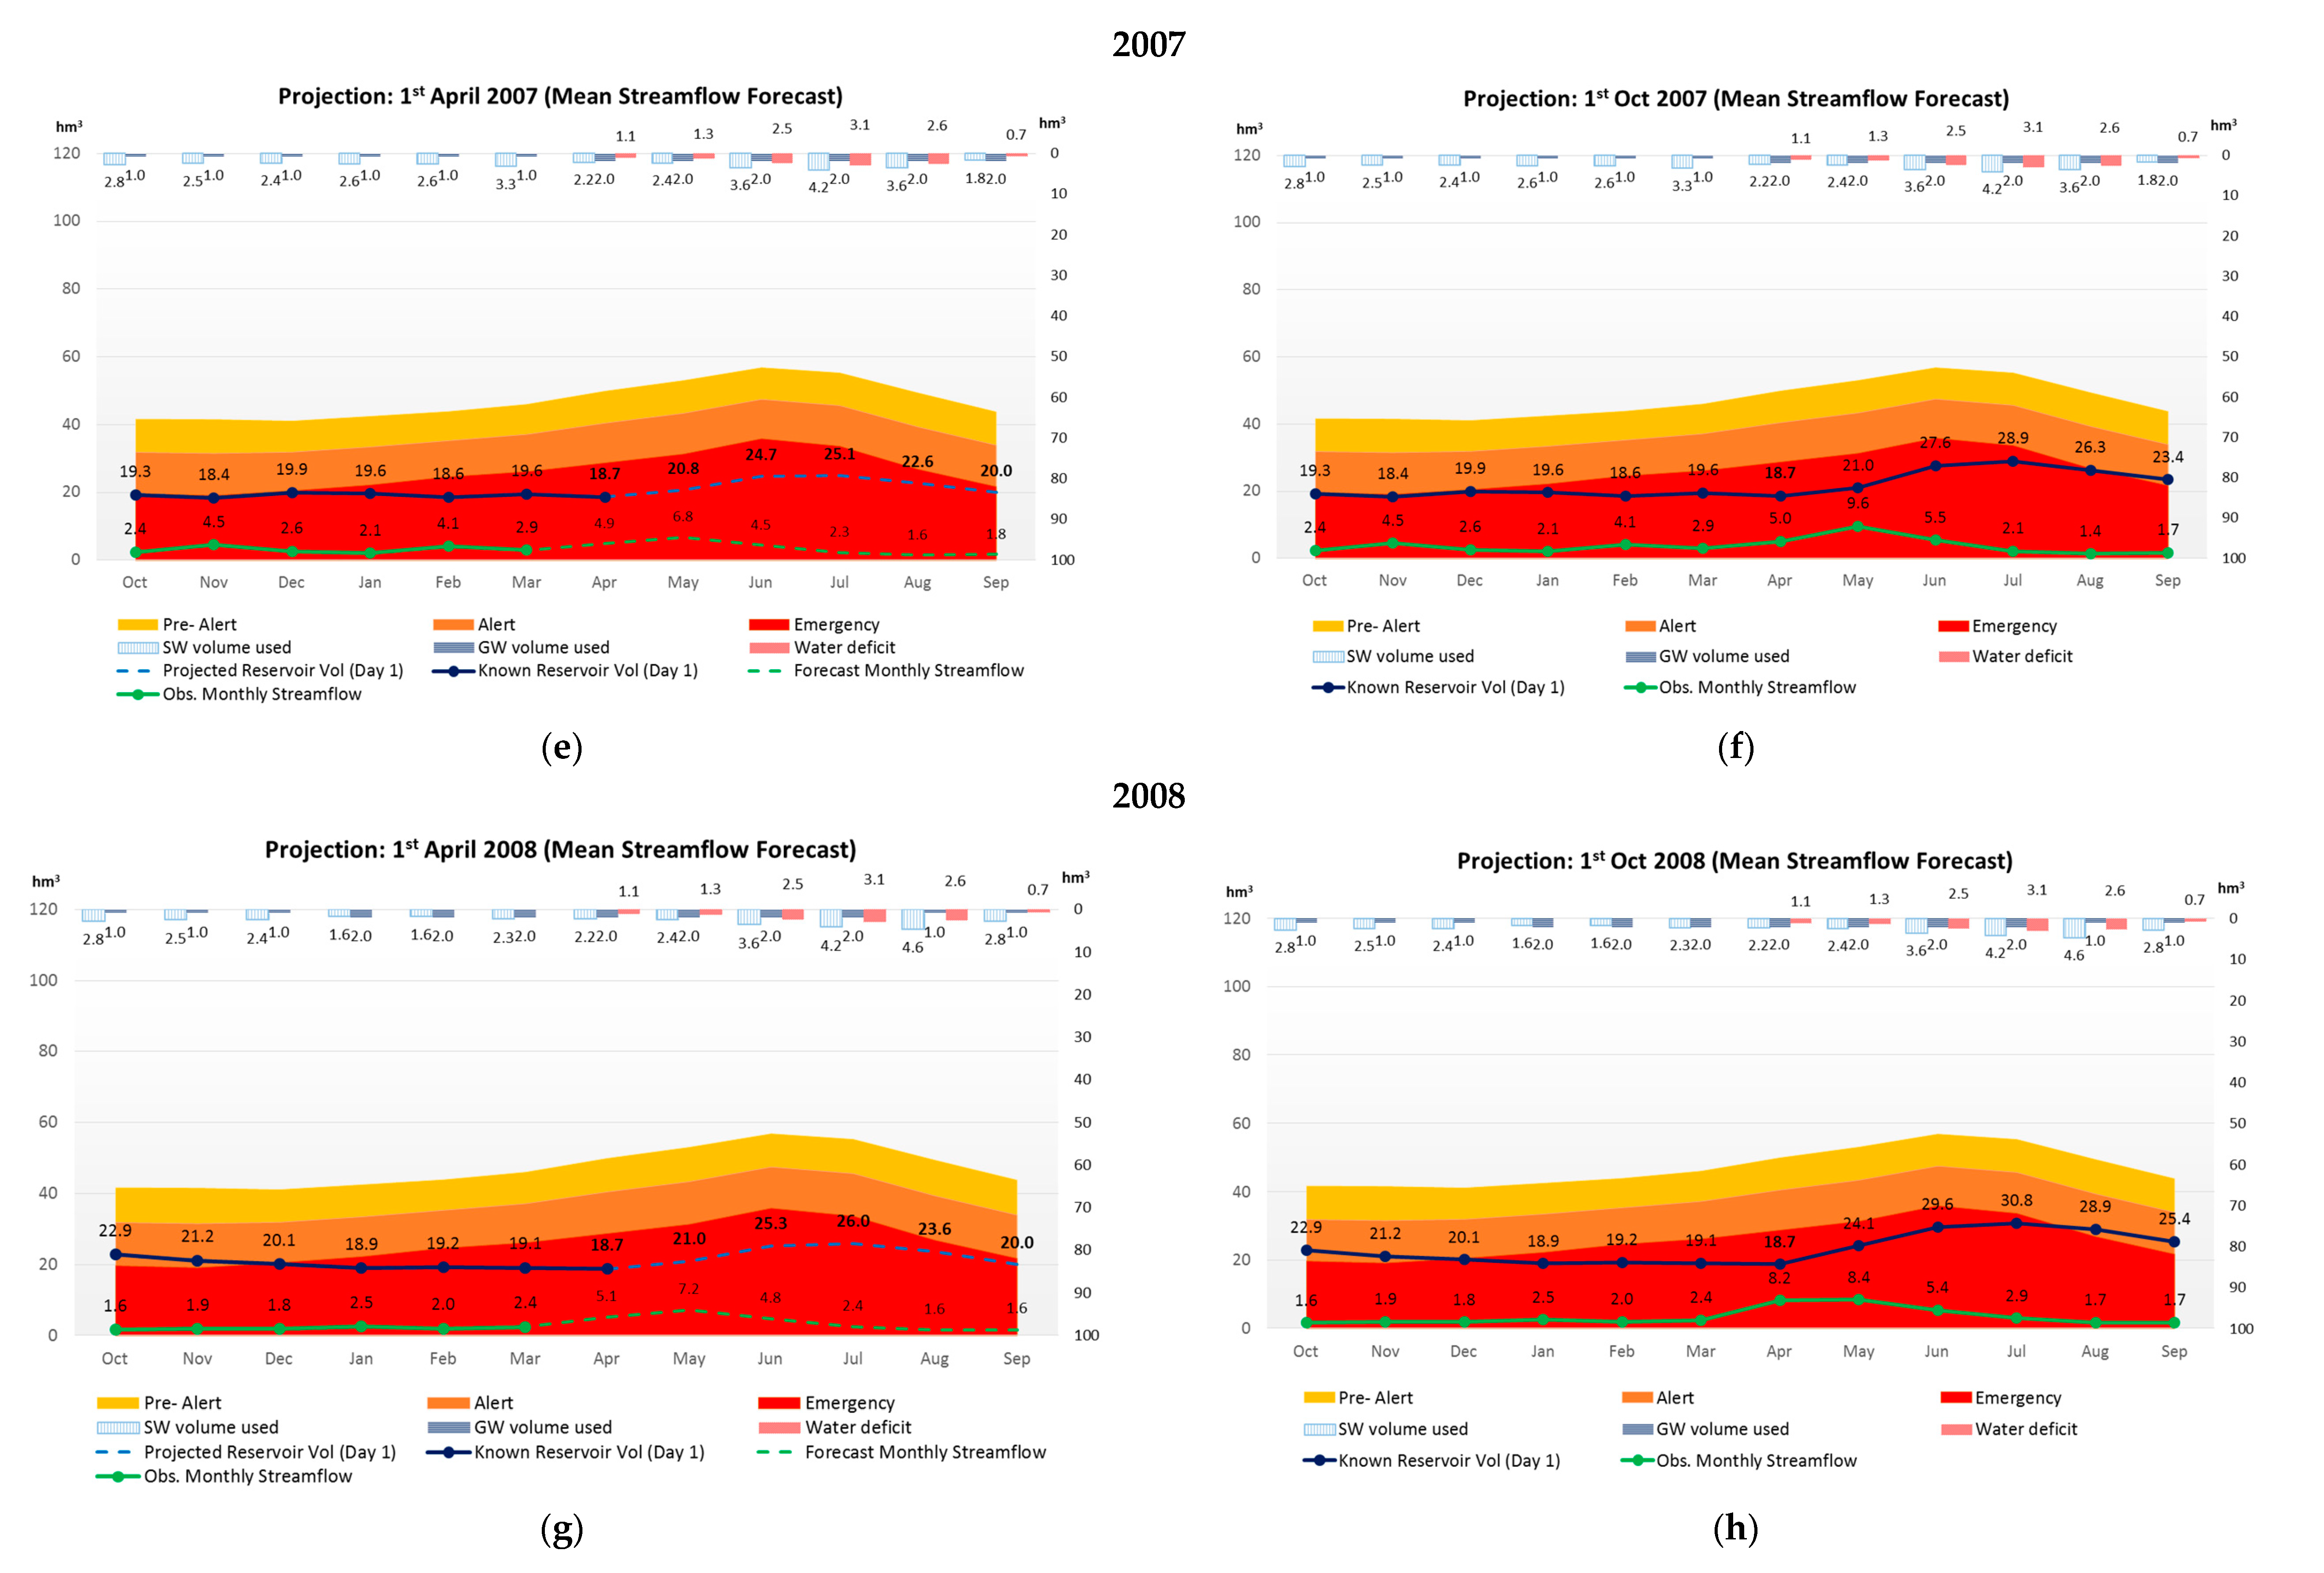
| Hydrological. | S-I: Using the 2018 GRB DMP | S-II: Using AQUAFOR (Mean Streamflow Forecast) | ||||||||||
|---|---|---|---|---|---|---|---|---|---|---|---|---|
| Year | UWSD | IWD | UWSD | IWD | ||||||||
| SW | GW | Total | Deficit | SW | Deficit | SW | GW | Total | Deficit | SW | Deficit | |
| 2004/05 | 35.46 | 2.06 | 37.52 | 0 | 25.90 | 0 | 37.52 | 0 | 37.52 | 0 | 25.90 | 0 |
| 2005/06 | 25.14 | 12.38 | 37.52 | 0 | 9.16 | 16.74 | 22.14 | 15.38 | 37.52 | 0 | 25.90 | 0 |
| 2006/07 | 24.14 | 13.38 | 37.52 | 0 | 19.21 | 6.70 | 25.27 | 12.26 | 37.52 | 0 | 23.67 | 2.23 |
| 2007/08 | 25.14 | 12.38 | 37.52 | 0 | 10.28 | 15.63 | 17.14 | 20.39 | 37.52 | 0 | 14.74 | 11.16 |
| 2008/09 | 25.14 | 12.38 | 37.52 | 0 | 25.90 | 0 | 37.52 | 0 | 37.52 | 0 | 25.90 | 0 |
| Total | 135.02 | 52.60 | 187.62 | 0 | 90.45 | 39.06 | 139.59 | 48.03 | 187.62 | 0 | 116.13 | 13.39 |
| Mean | 27.00 | 10.52 | 37.52 | 0 | 18.09 | 7.81 30% * | 27.92 | 9.61 | 37.52 | 0 | 23.23 | 2.68 10% * |
| Comparison B/A (%) | 3% | −9% | 0% | 28% | −66% | |||||||
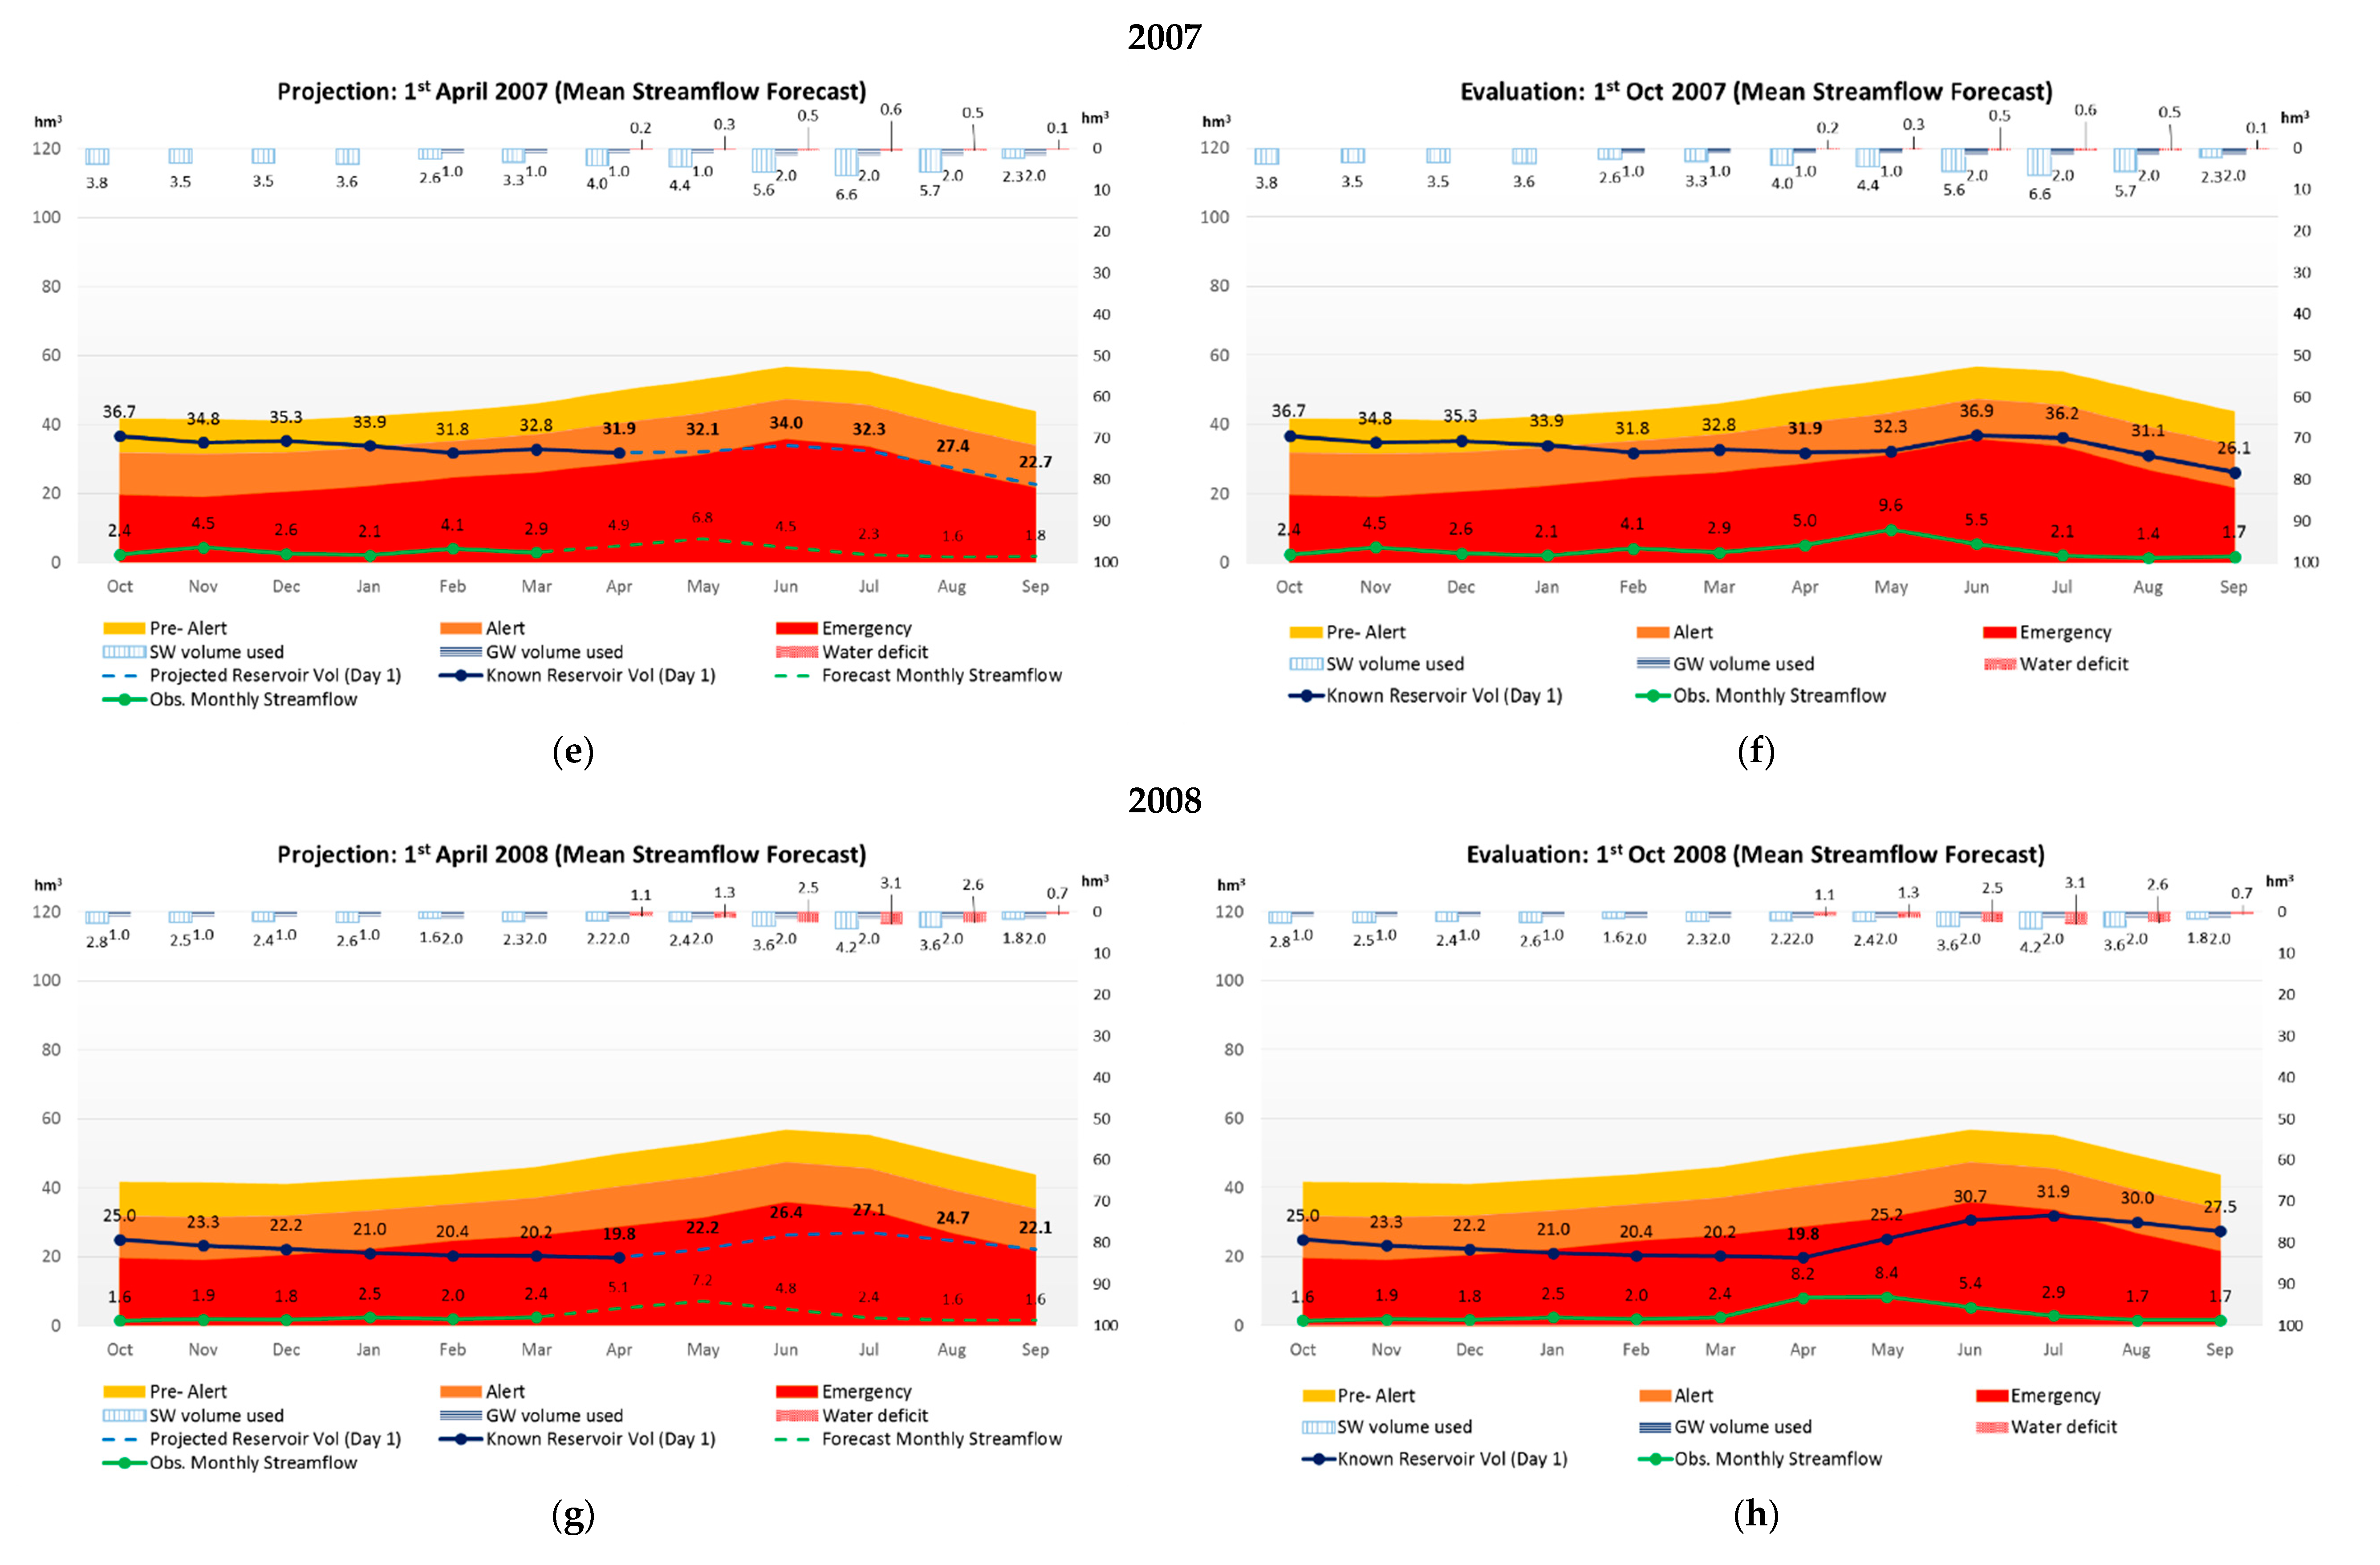
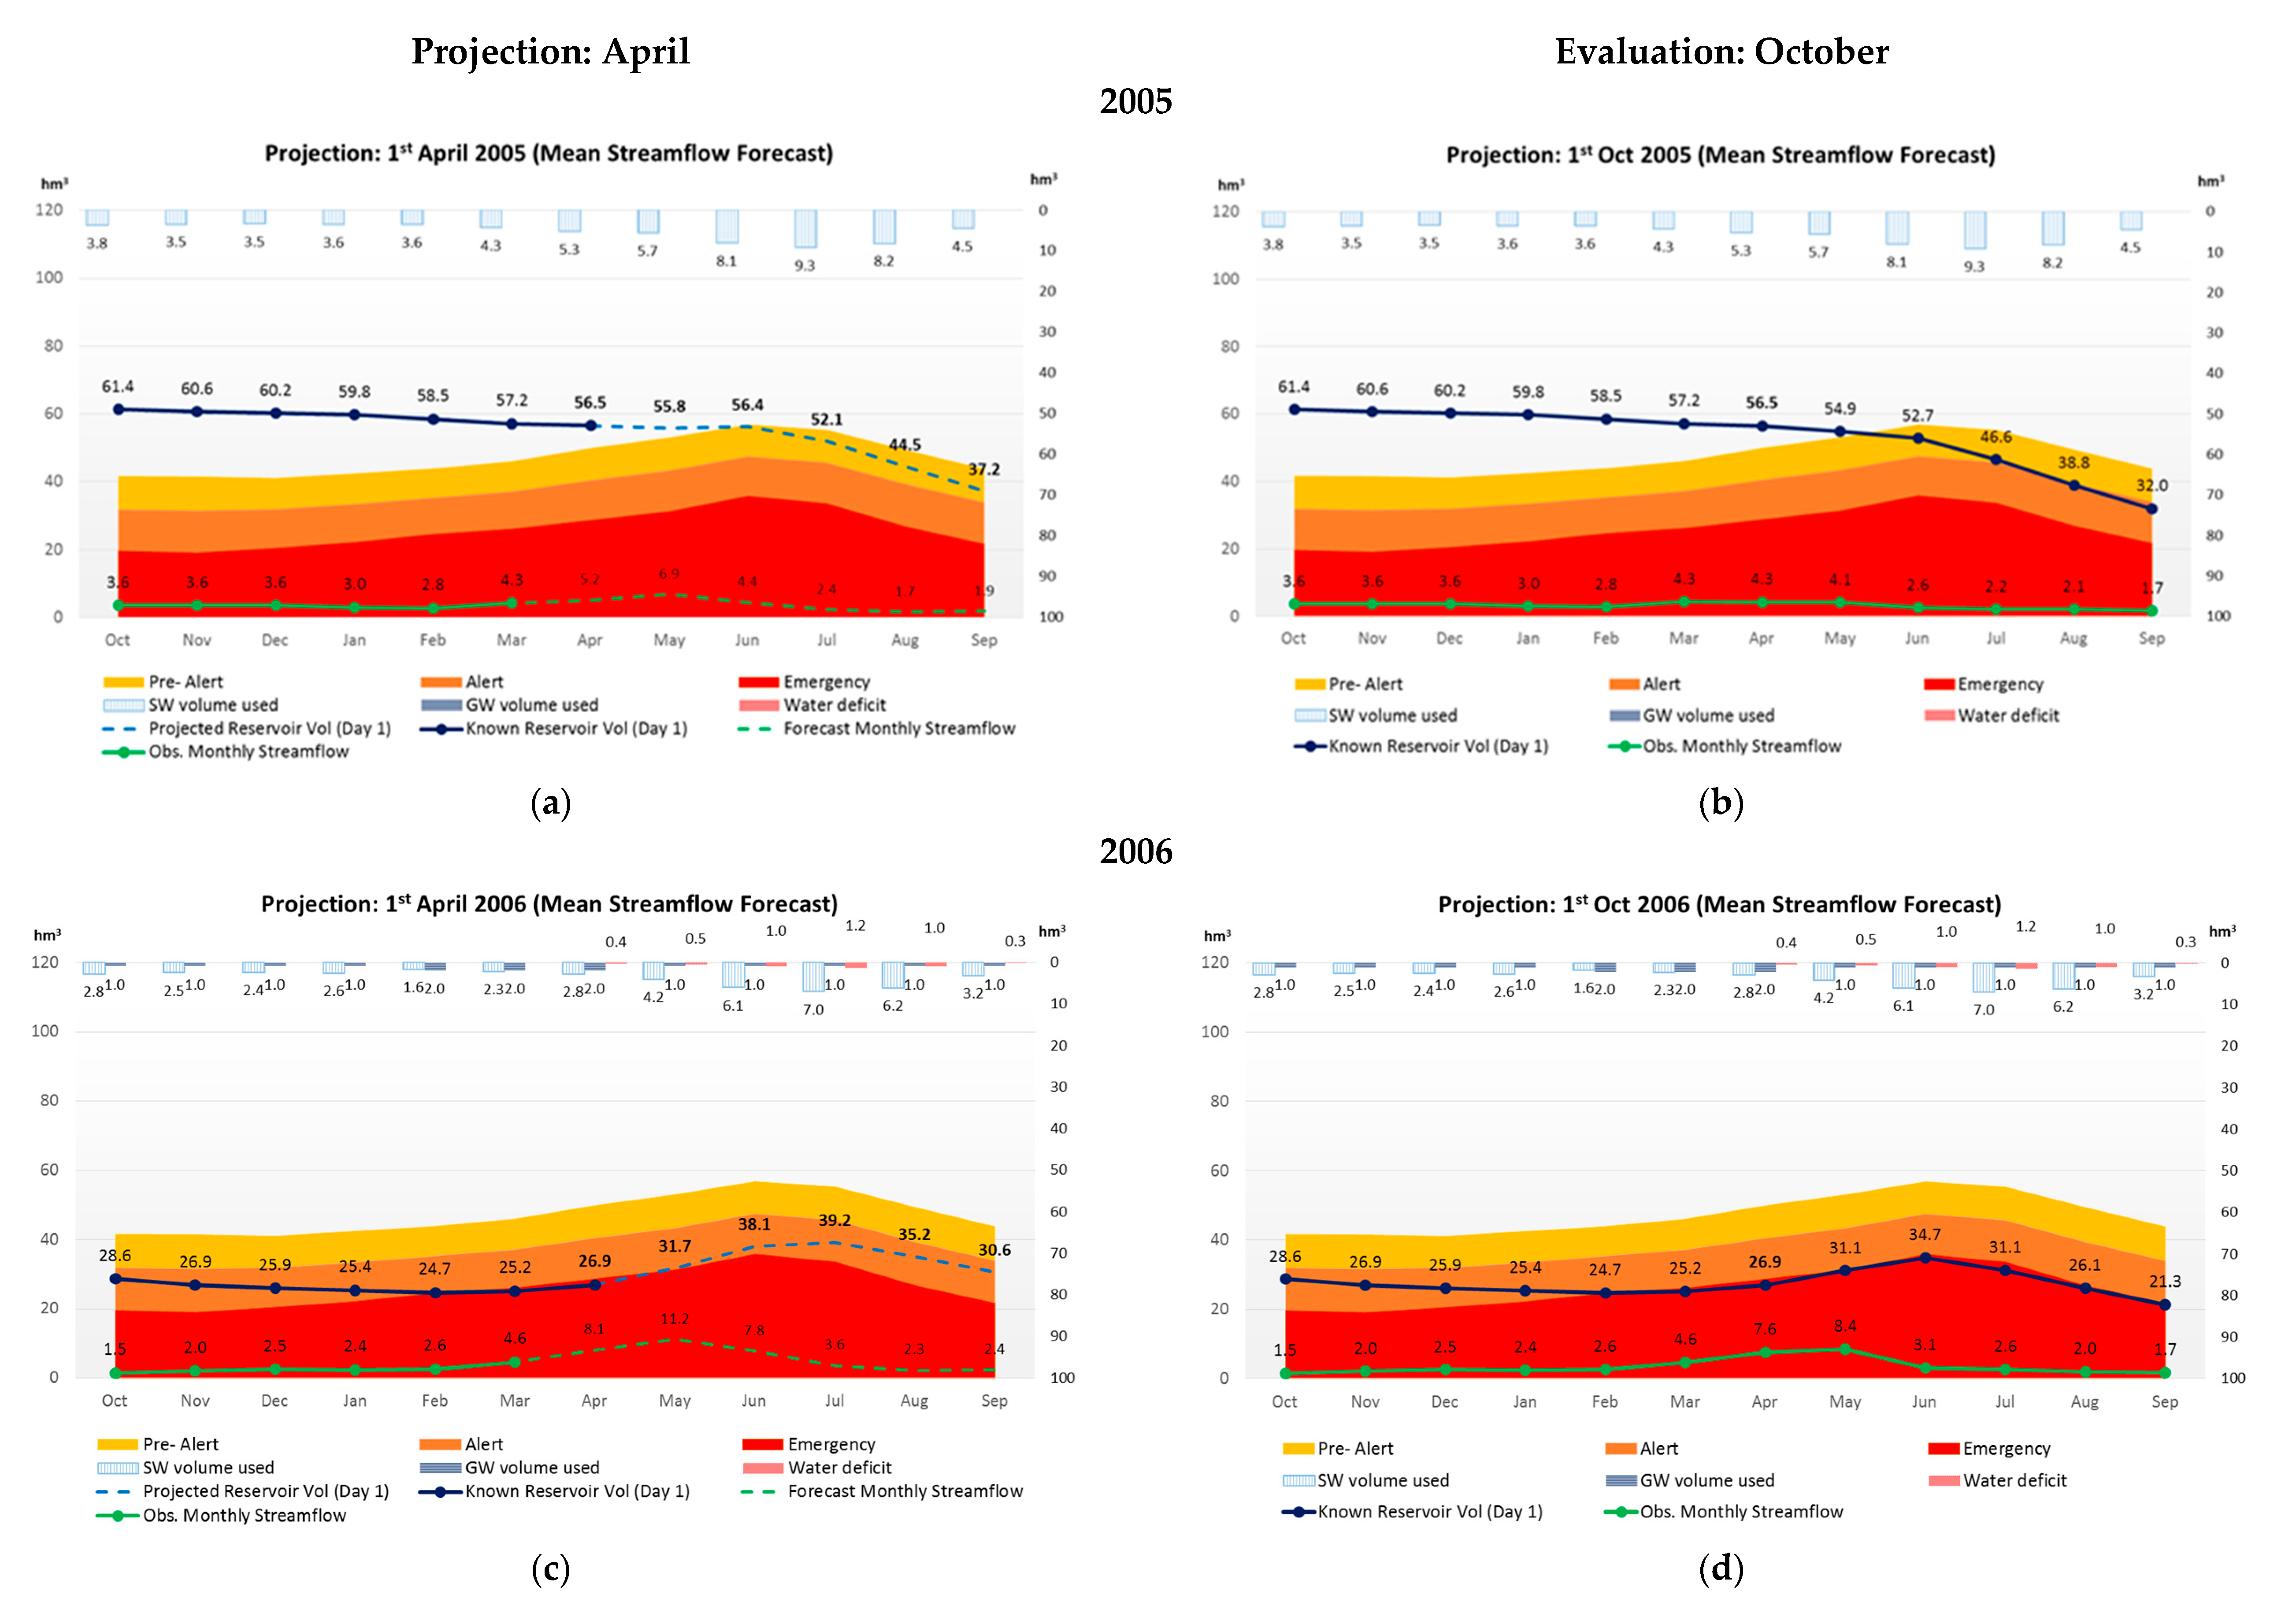
| Hydrological | S-I: Using the 2018 GRB DMP | S-II: Using AQUAFOR (Mean Streamflow Forecast) | ||||||||||
|---|---|---|---|---|---|---|---|---|---|---|---|---|
| Year | UWSD | IWD | UWSD | IWD | ||||||||
| SW | GW | Total | Deficit | SW | Deficit | SW | GW | Total | Deficit | SW | Deficit | |
| 2004/05 | 35.46 | 2.06 | 37.52 | 0 | 25.90 | 0.00 | 37.52 | 0.00 | 37.52 | 0 | 25.90 | 0.00 |
| 2005/06 | 25.14 | 12.38 | 37.52 | 0 | 9.16 | 16.74 | 22.14 | 15.38 | 37.52 | 0 | 21.44 | 4.46 |
| 2006/07 | 23.14 | 14.38 | 37.52 | 0 | 14.88 | 11.02 | 19.14 | 18.39 | 37.52 | 0 | 14.74 | 11.16 |
| 2007/08 | 19.14 | 18.39 | 37.52 | 0 | 11.39 | 14.51 | 18.14 | 19.39 | 37.52 | 0 | 14.74 | 11.16 |
| 2008/09 | 26.14 | 11.38 | 37.52 | 0 | 25.90 | 0.00 | 37.52 | 0.00 | 37.52 | 0 | 25.90 | 0.00 |
| Total | 129.02 | 58.60 | 187.62 | 0 | 87.25 | 42.27 | 134.46 | 53.16 | 187.62 | 0 | 102.73 | 26.79 |
| Mean | 25.80 | 11.72 | 37.52 | 0 | 17.45 | 8.45 (33% *) | 26.89 | 10.63 | 37.52 | 0 | 20.55 | 5.36 (21%) * |
| Comparison B/A (%) | 4% | −9% | 0% | 18% | −37% | |||||||


Reference
- Hervás-Gámez, C.; Delgado-Ramos, F. Are the Modern Drought Management Plans Modern Enough? The Guadalquivir River Basin Case in Spain. Water 2020, 12, 49. [Google Scholar] [CrossRef]
© 2020 by the authors. Licensee MDPI, Basel, Switzerland. This article is an open access article distributed under the terms and conditions of the Creative Commons Attribution (CC BY) license (http://creativecommons.org/licenses/by/4.0/).
Share and Cite
Hervás-Gámez, C.; Delgado-Ramos, F. Correction: Hervás-Gámez, Carmen and Delgado-Ramos, Fernando. Are the Modern Drought Management Plans Modern Enough? The Guadalquivir River Basin Case in Spain. Water 2020, 12, 49. Water 2020, 12, 2699. https://doi.org/10.3390/w12102699
Hervás-Gámez C, Delgado-Ramos F. Correction: Hervás-Gámez, Carmen and Delgado-Ramos, Fernando. Are the Modern Drought Management Plans Modern Enough? The Guadalquivir River Basin Case in Spain. Water 2020, 12, 49. Water. 2020; 12(10):2699. https://doi.org/10.3390/w12102699
Chicago/Turabian StyleHervás-Gámez, Carmen, and Fernando Delgado-Ramos. 2020. "Correction: Hervás-Gámez, Carmen and Delgado-Ramos, Fernando. Are the Modern Drought Management Plans Modern Enough? The Guadalquivir River Basin Case in Spain. Water 2020, 12, 49" Water 12, no. 10: 2699. https://doi.org/10.3390/w12102699
APA StyleHervás-Gámez, C., & Delgado-Ramos, F. (2020). Correction: Hervás-Gámez, Carmen and Delgado-Ramos, Fernando. Are the Modern Drought Management Plans Modern Enough? The Guadalquivir River Basin Case in Spain. Water 2020, 12, 49. Water, 12(10), 2699. https://doi.org/10.3390/w12102699