Are the Modern Drought Management Plans Modern Enough? The Guadalquivir River Basin Case in Spain


Abstract
1. Introduction
2. Critical Review of the Key Aspects of the 2018 Guadalquivir River Basin Drought Management Plan
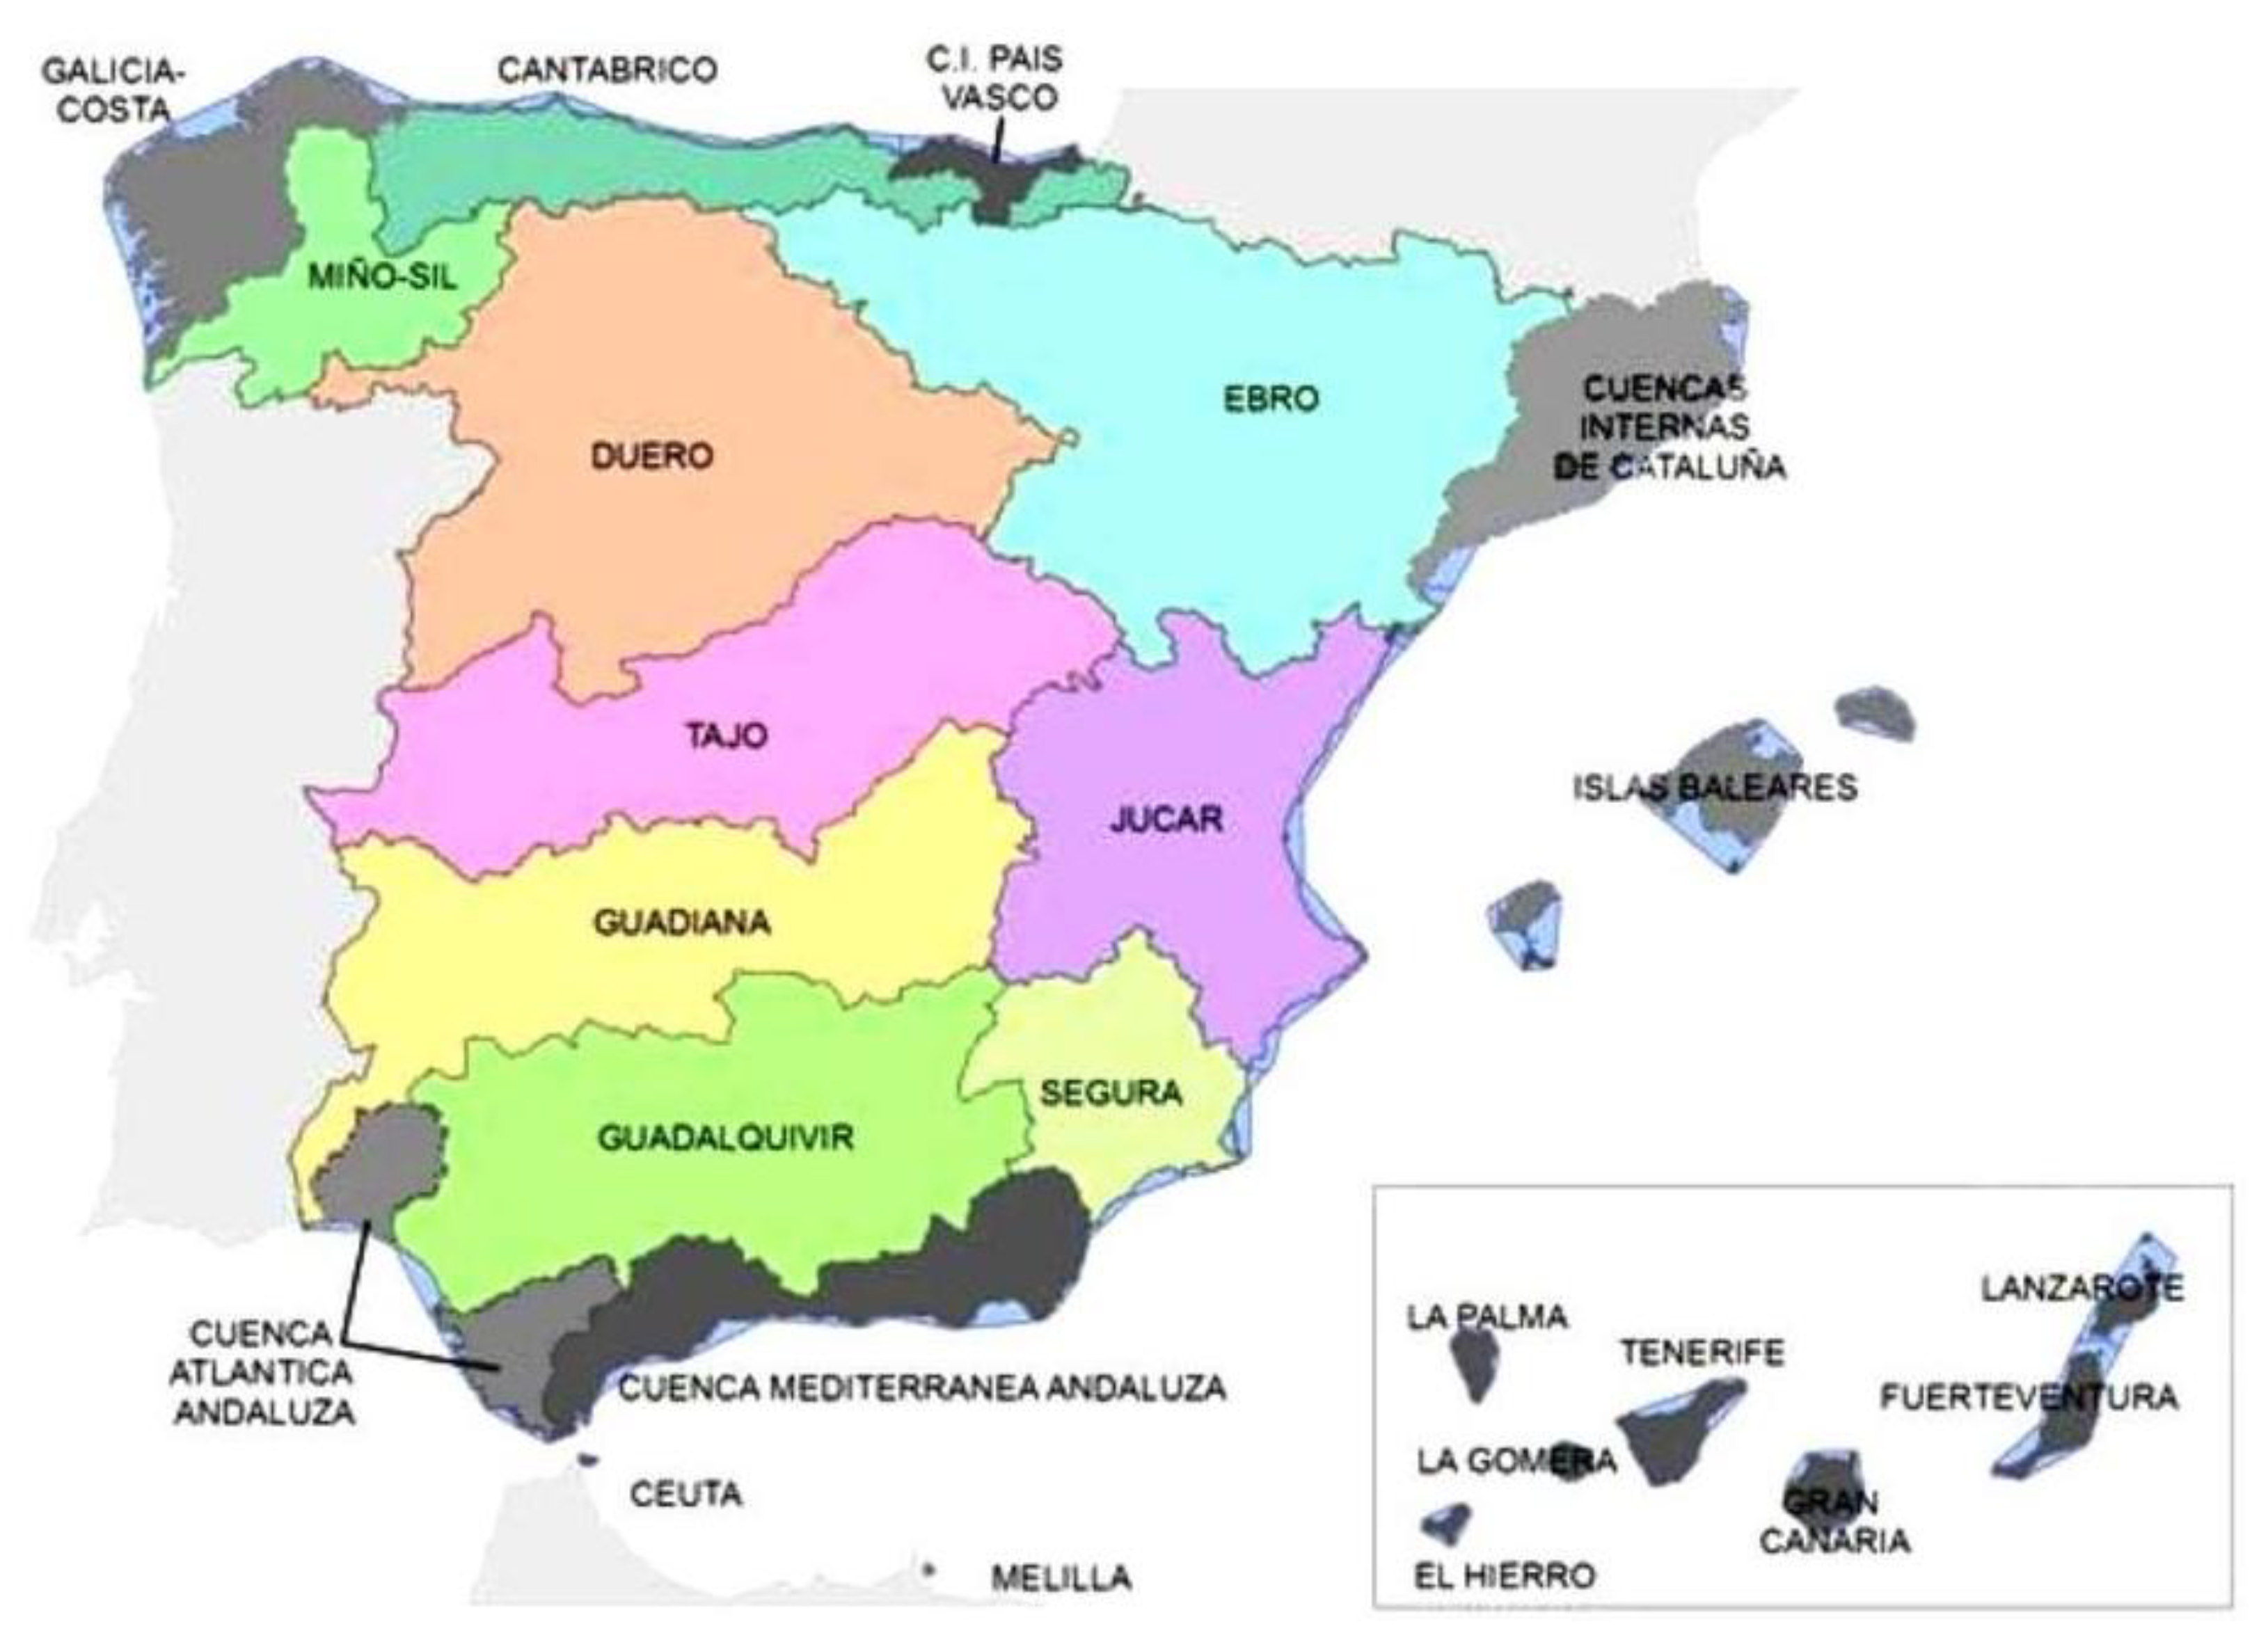
2.1. Study Area Description
2.2. Overview of the 2018 GRB DMP
- (a)
- a diagnosis system, including the definition of territorial units and environmental characterization;
- (b)
- the definition of a common global indicator and thresholds system (establishing onset, ending, and severity levels of the exceptional circumstances);
- (c)
- actions and measures to be taken in each phase; and
- (d)
- organizational framework: monitoring and follow-up system to deal with drought and subsequent revision and updating of the existing DMP.
2.3. Diagnosis System: Definition of Territorial Units and Environmental Characterization
2.4. Definition of a Common Global Hydrological Indicator
- Firstly, the most representative hydrological variable was selected. For example, the precipitation was selected for characterizing the drought events in all “prolonged drought TMU”. One variable (or a combination of them, precipitation, reservoir inflow, reservoir storage, GW level, etc.) was selected for characterizing the water scarcity phenomenon in each “water scarcity TMU”;
- Secondly, the relevant hydrological time series were prepared;
- Thirdly, the indicators were calculated using the sub-basin specific data;
- Finally, the numerical values obtained were then scaled (between 0 and 1), weighted, and validated using the observed historical series.
2.5. Streamflow Forecasting Models
2.6. Reference Period Used
2.7. Climate Change Assessment
2.8. Drought Management Measures: Prolonged Drought
- (i)
- justify a temporary deterioration of the state of water bodies due to exceptional natural causes;
- (ii)
- apply a less stringent ecological flow regime. However, these proposed measures are not “strictly measures” but the consequences of a prolonged drought situation.
2.9. Water Scarcity: Indicator and Thresholds
- Pre-alert: there is available water supply to meet the water demand for the next three years (in compliance with the guarantee criteria established in the RBMP).
- Alert: there is available water supply to meet the water demand for the next two years (in compliance with the guarantee criteria established in the RBMP).
- Emergency: there is available water supply to meet the water demand for the next year (in compliance with the guarantee criteria established in the RBMP).
2.10. Water Scarcity Management: Measures
3. Practical Implications and Limitations When Applying the 2018 GRB DMP. Proposed Improvements
3.1. Overview
- (a)
- Implications of using the short reference period (instead of the long reference period) to calculate the drought indicator system (standardized precipitation index) and water scarcity indicator system.
- (b)
- Limitations of using the 2018 GRB DMP water scarcity thresholds and proposed alternative water scarcity thresholds.
- (c)
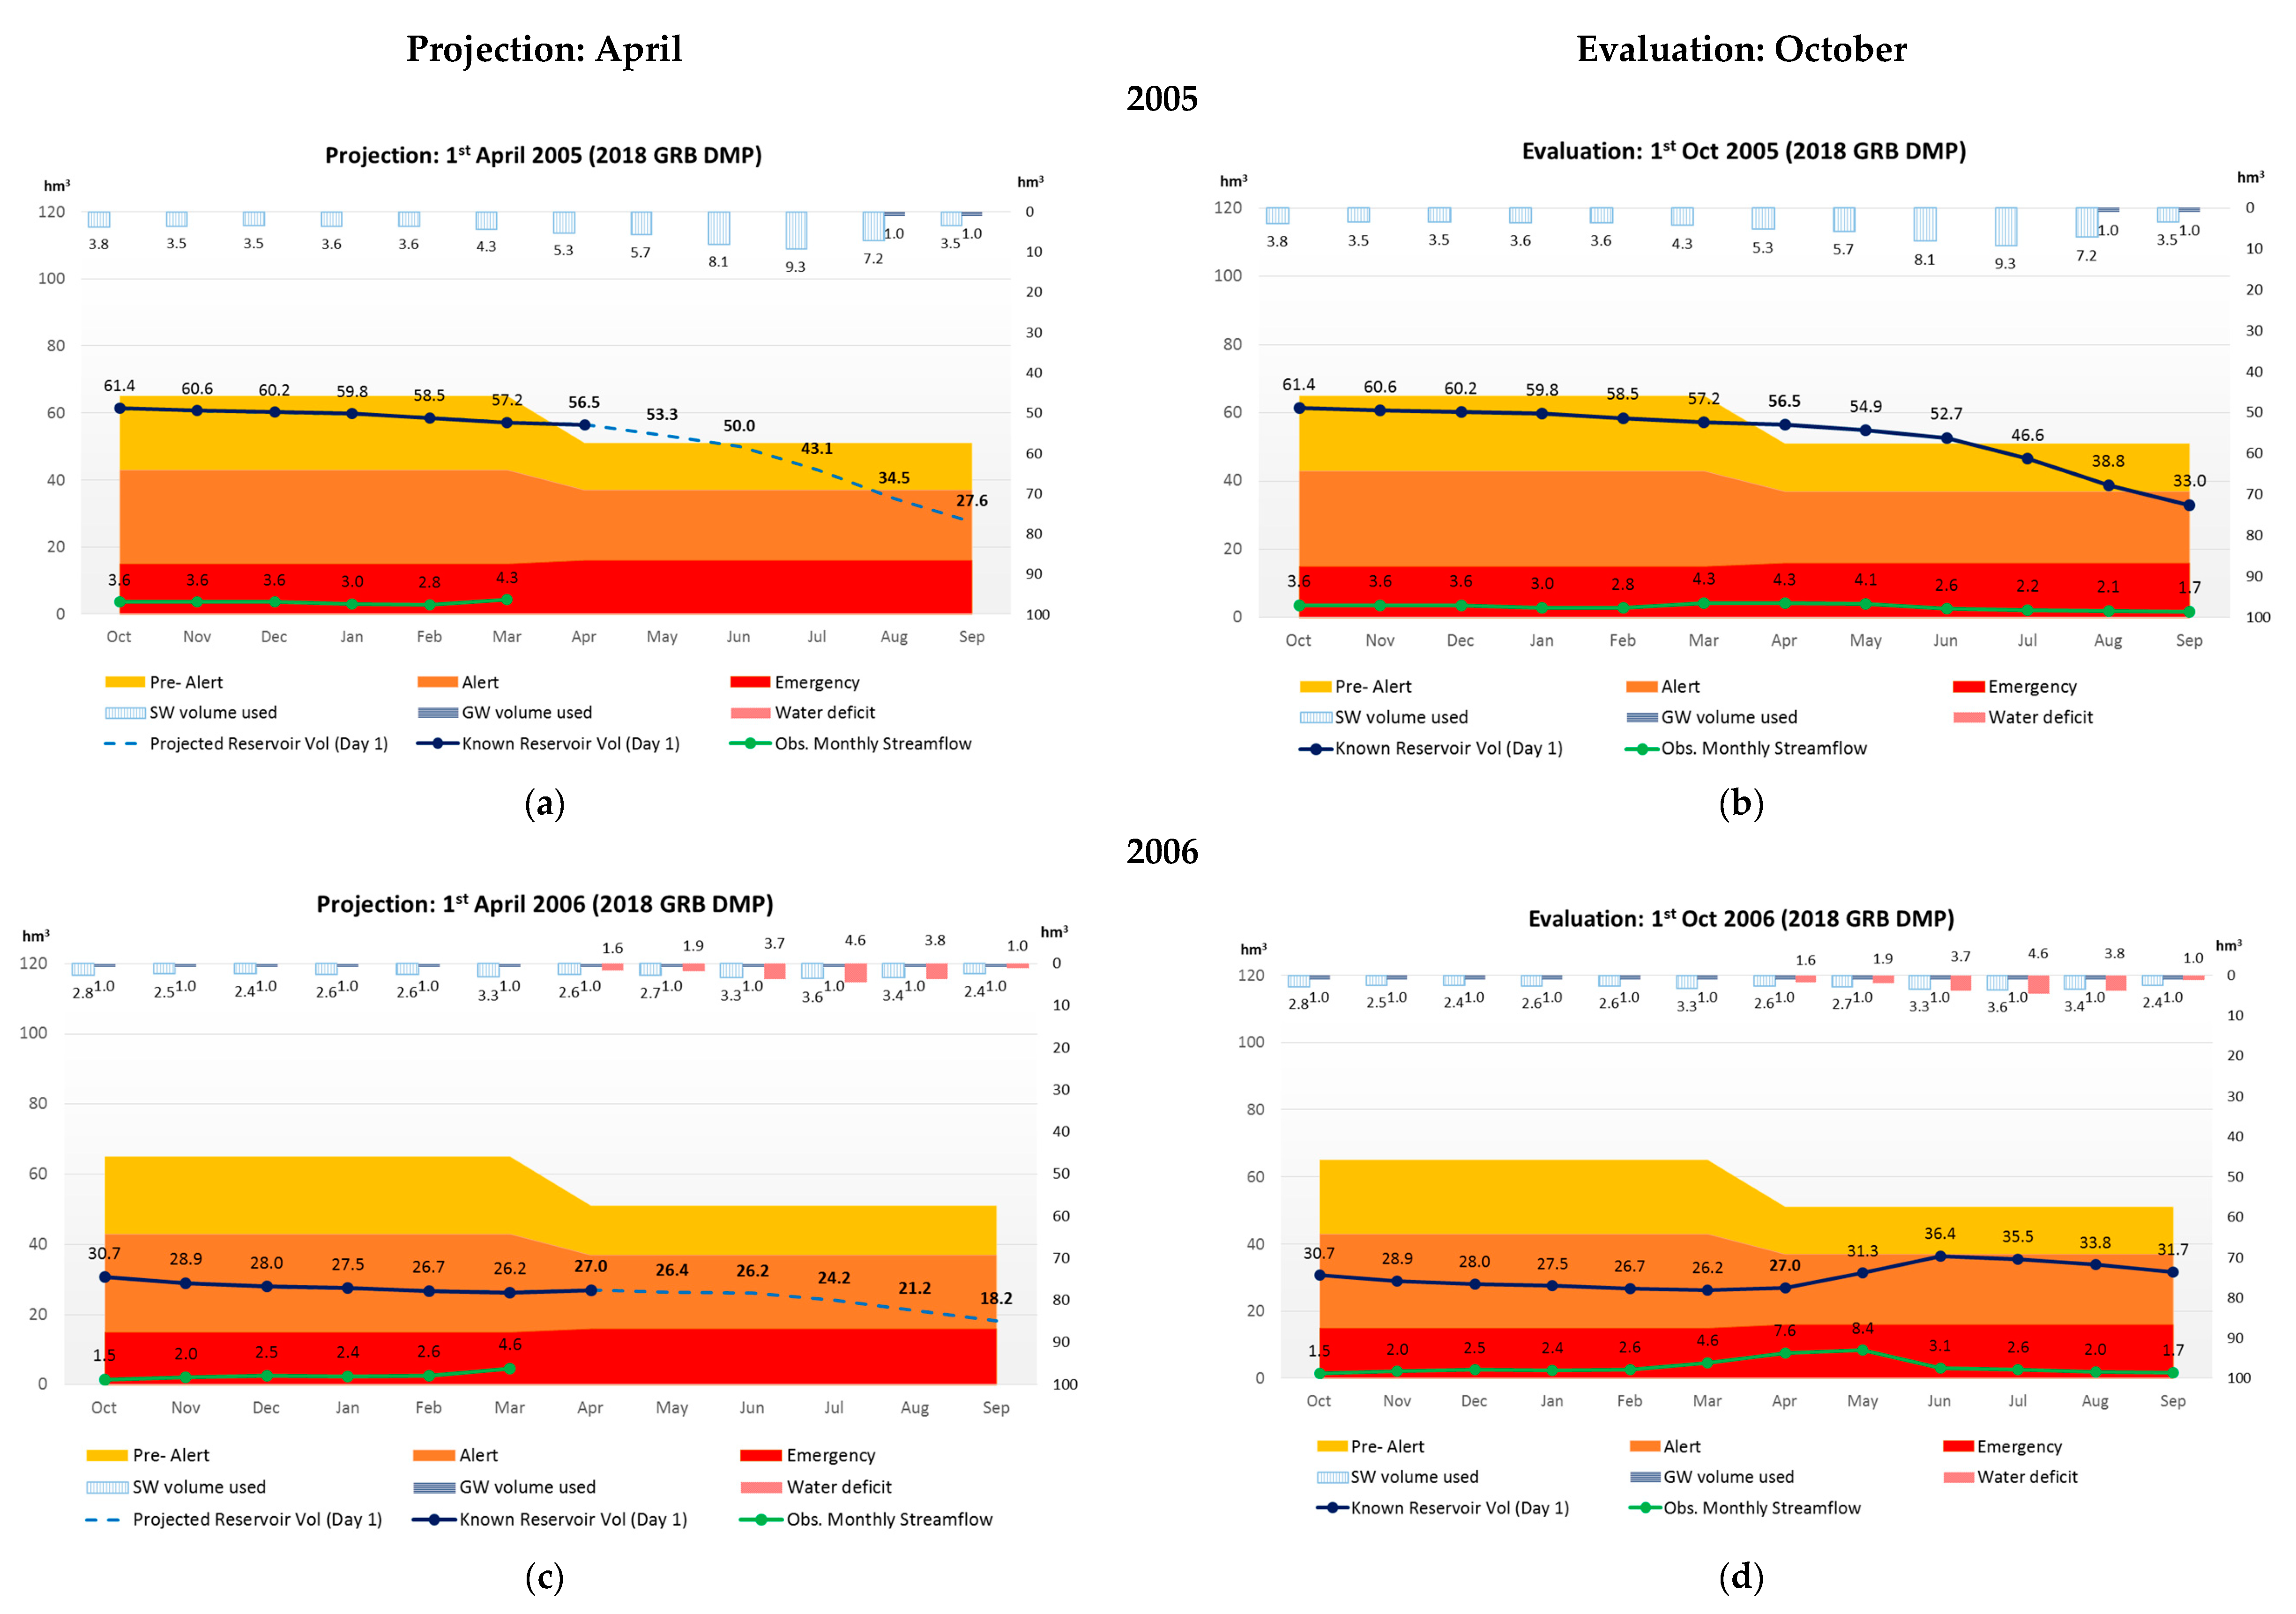
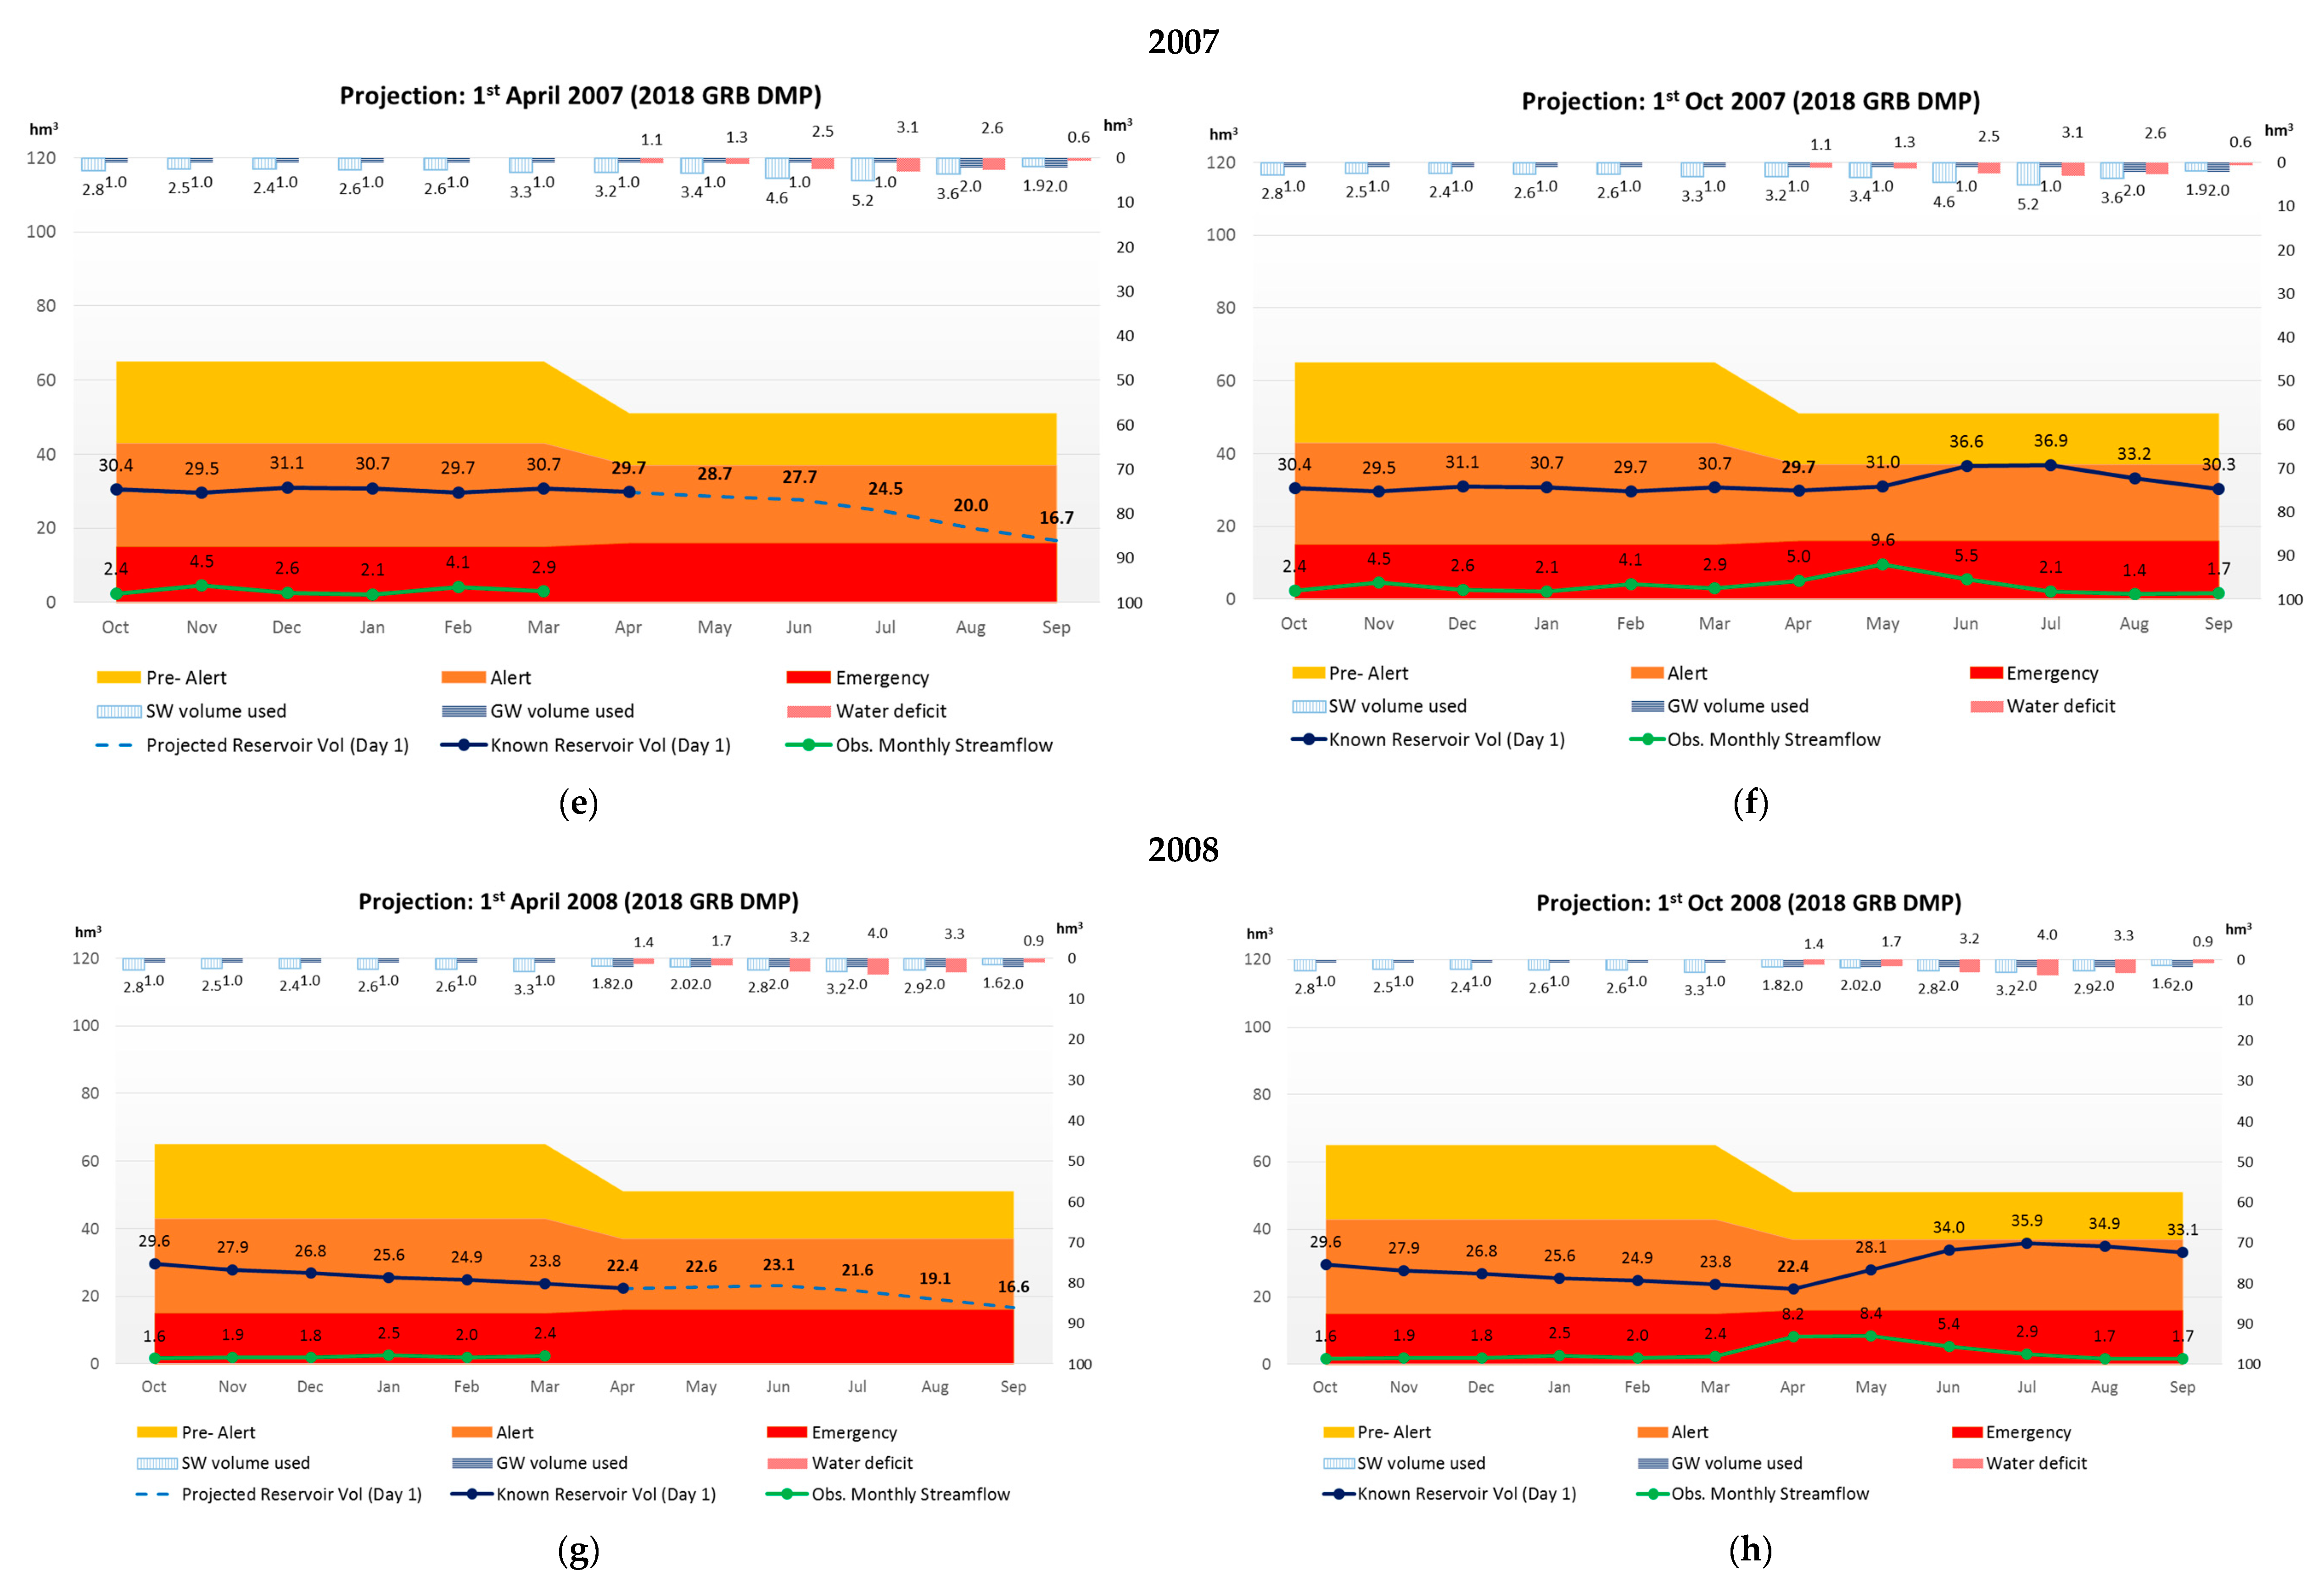
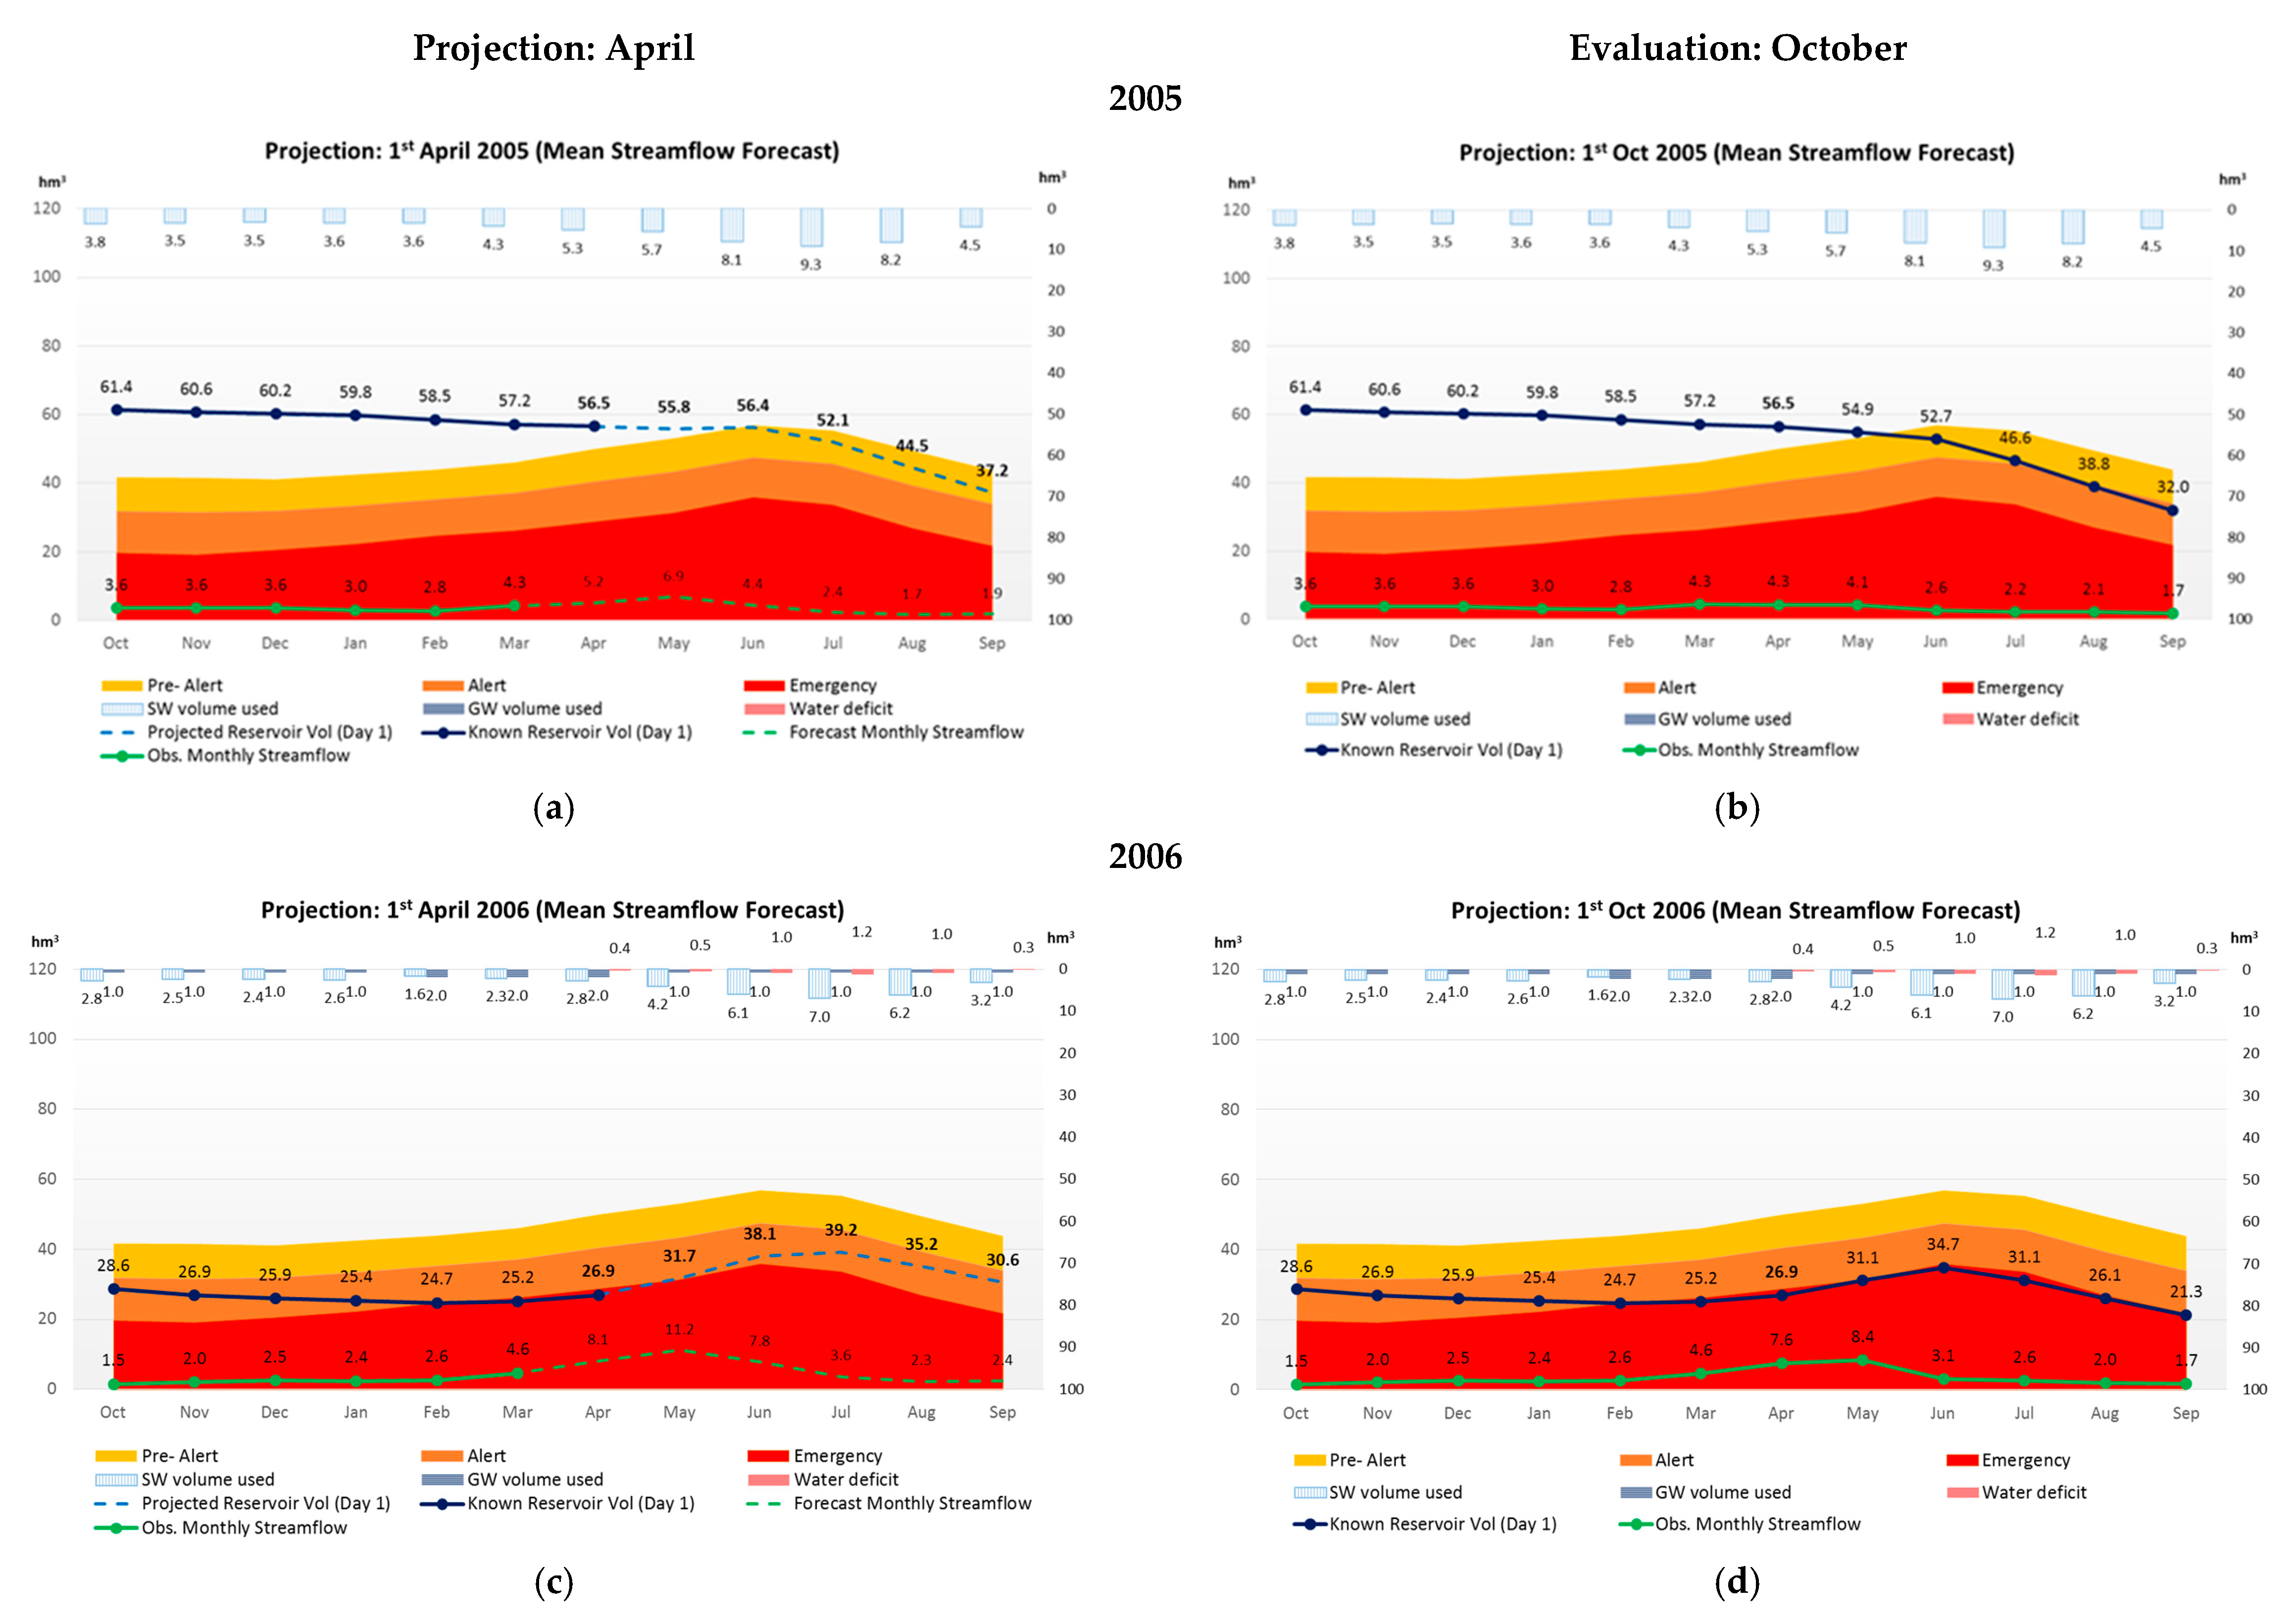
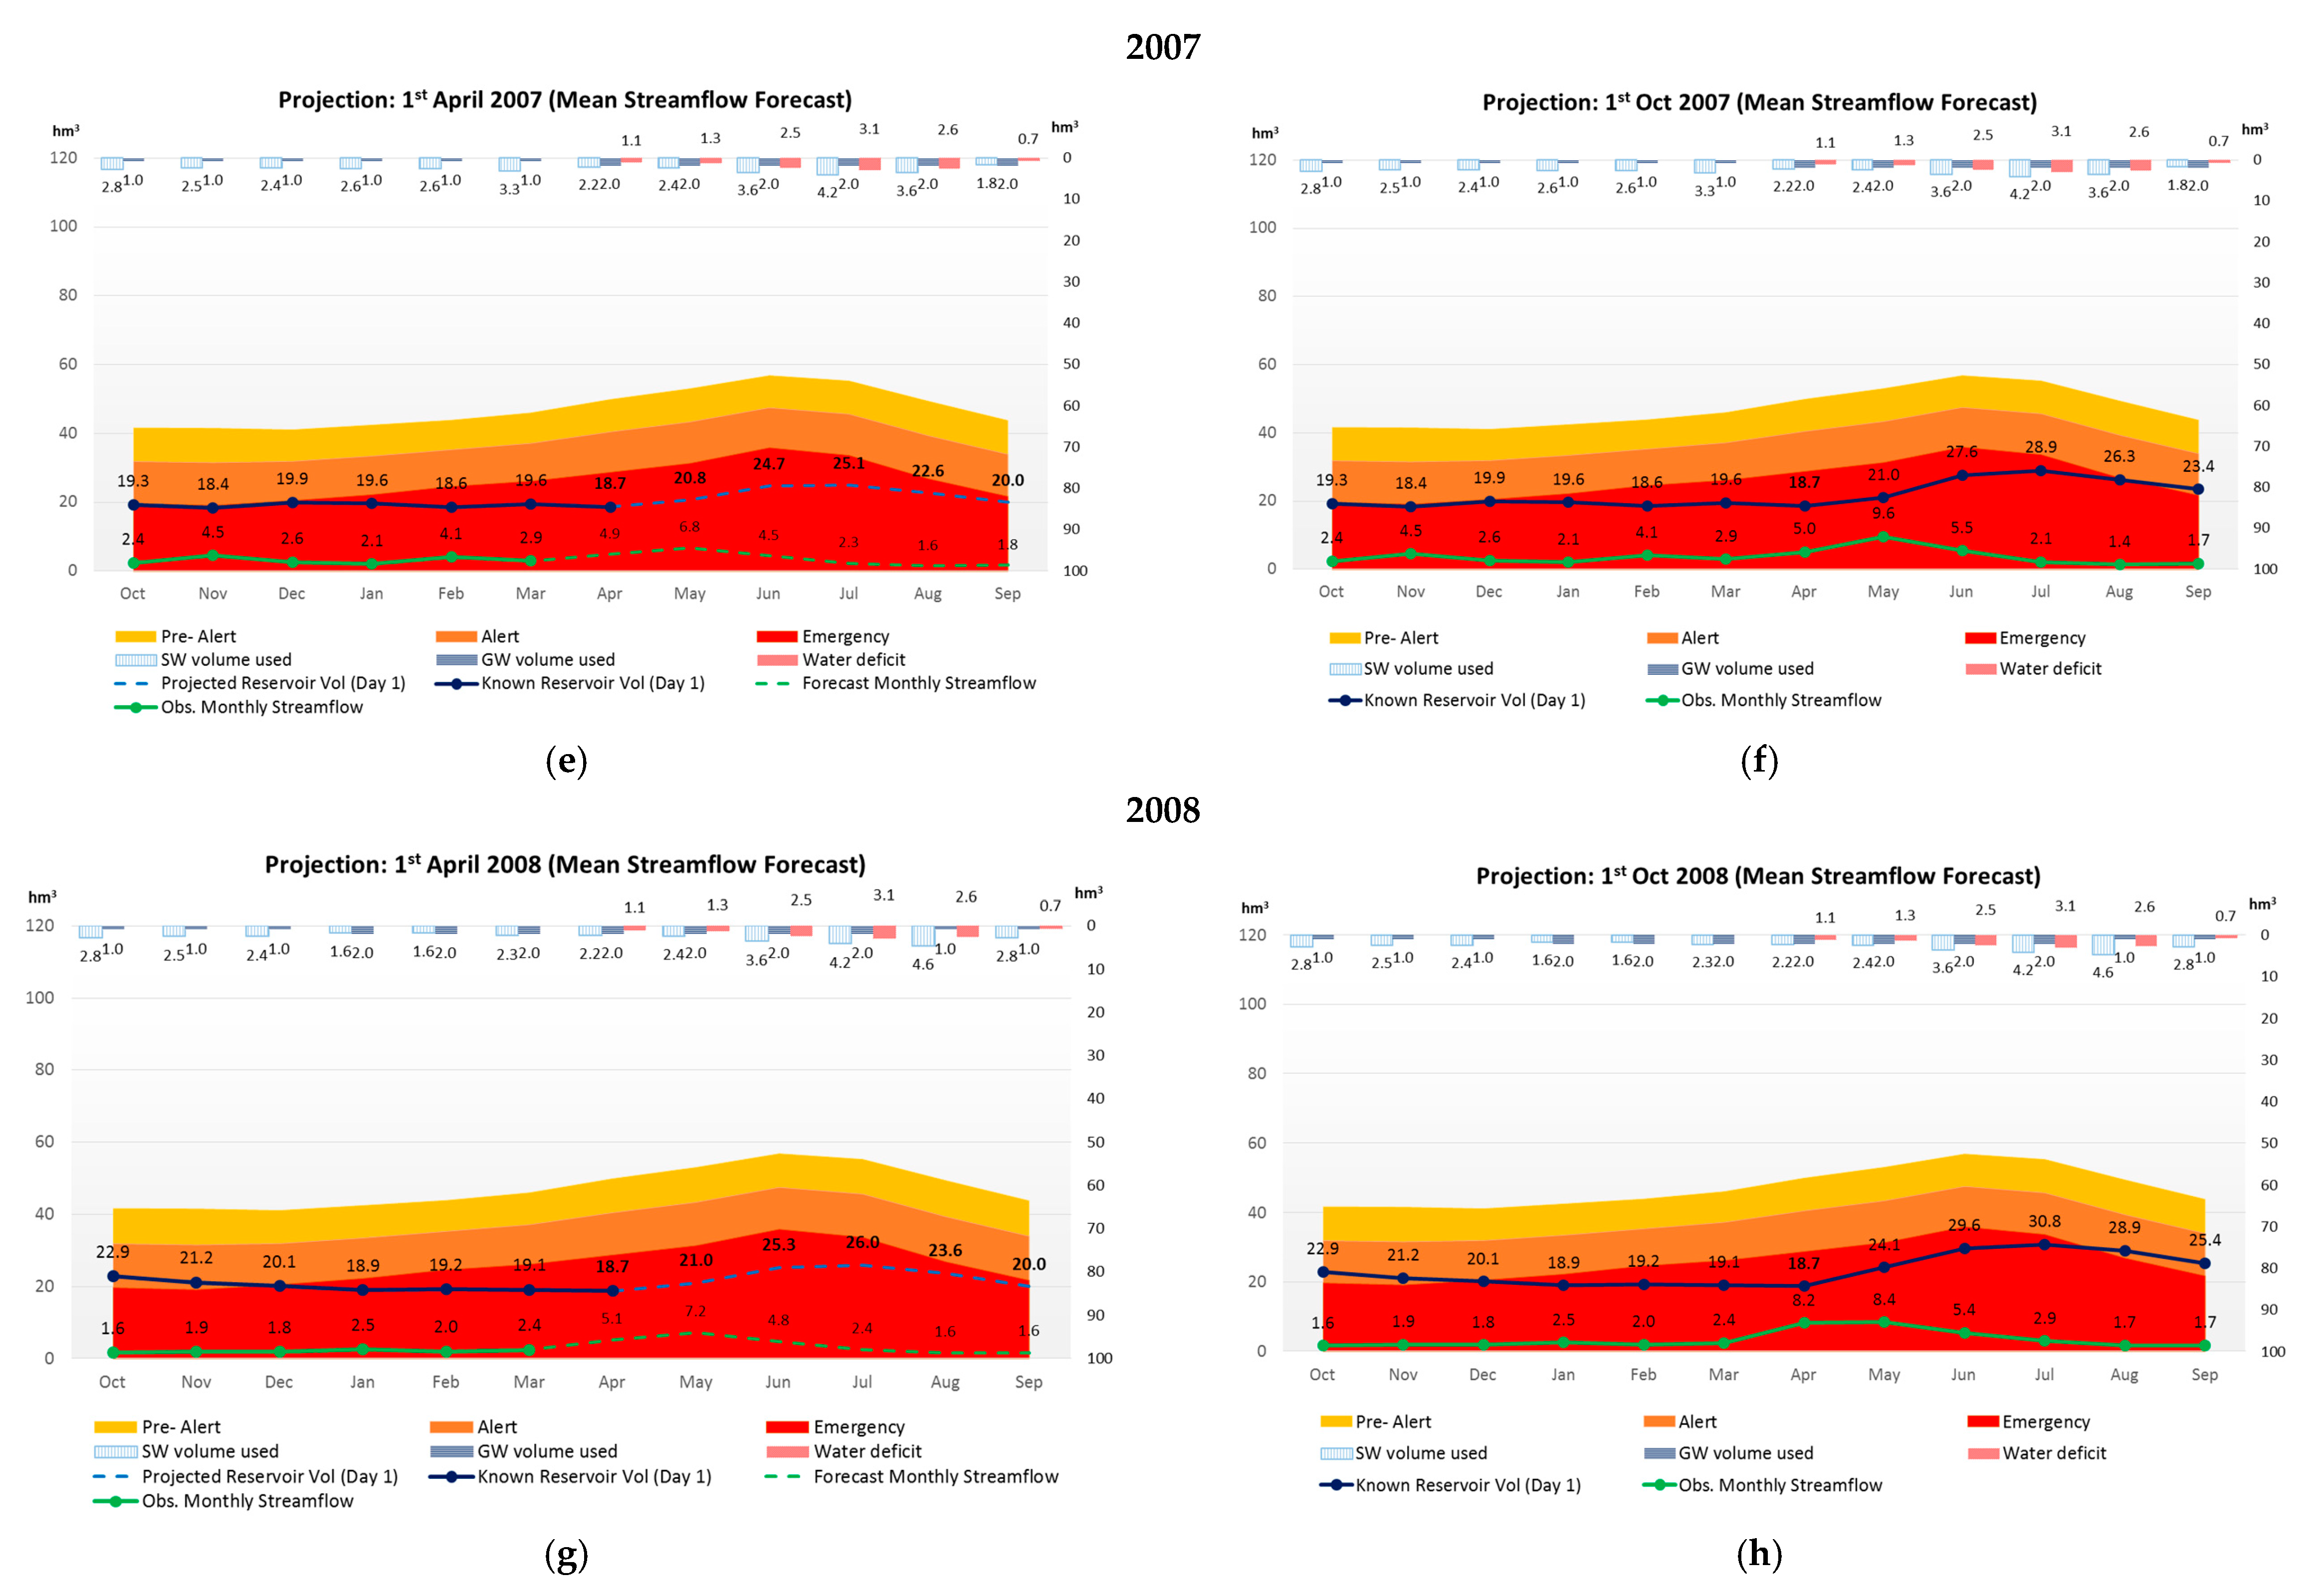
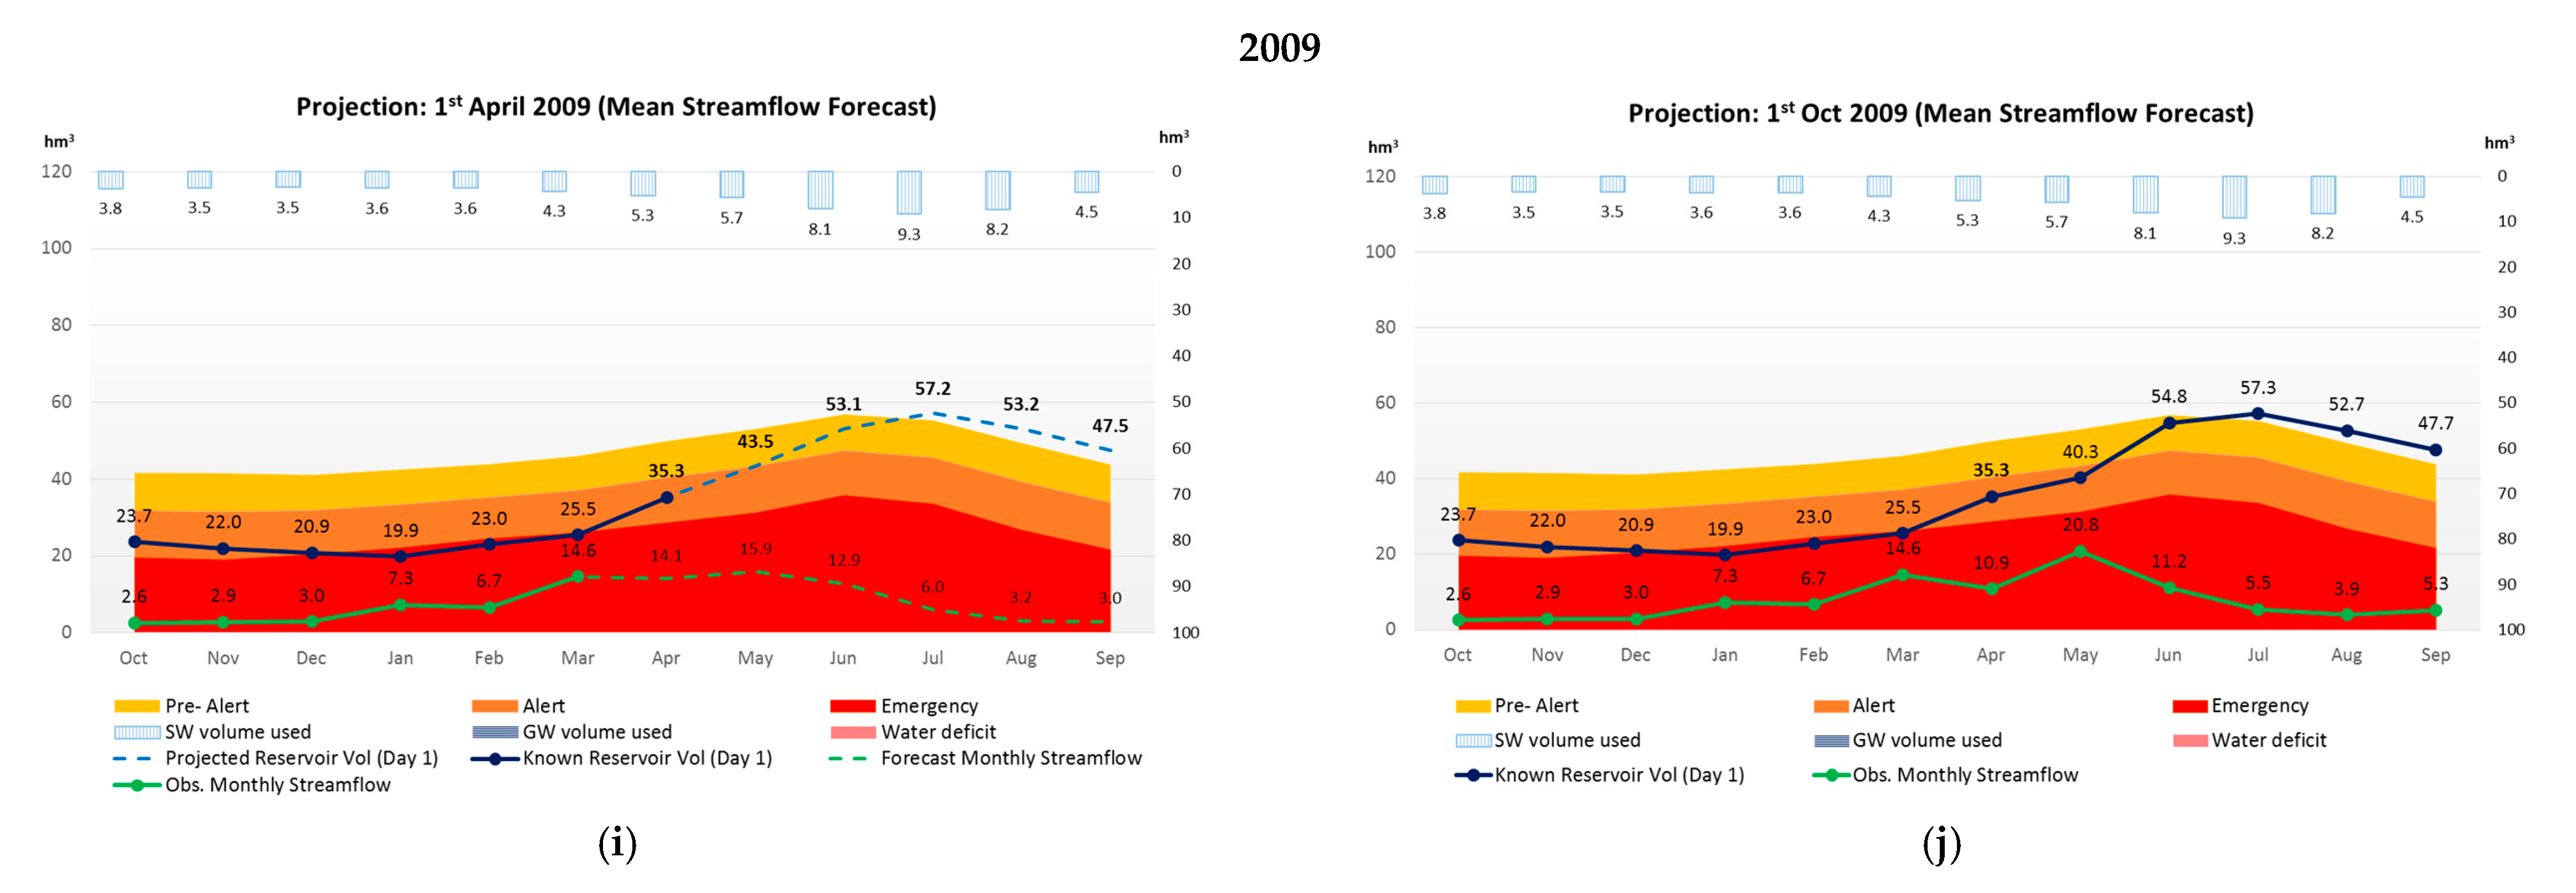
- Use of streamflow forecast models to improve drought management during the current hydrological year. The forecast model used for this assessment is AQUAFOR (a simple and robust monthly and yearly streamflow forecasting model developed by the University of Granada [20]). The results obtained from using AQUAFOR forecast model (in combination with the aforementioned proposed alternative water scarcity thresholds) were compared with the outcomes from managing a drought event following the 2018 GRB DMP protocol of action. The efficiency in optimising the use of the available water resources to meet the existing water demands of the system was compared. The potential cost implications and environmental impacts were also discussed.
3.2. Implications of the Selected Reference Period on the Drought Indicator System (Standardized Precipitation Index)
3.3. Implications of the Selected Reference Period on the Water Scarcity Indicator System
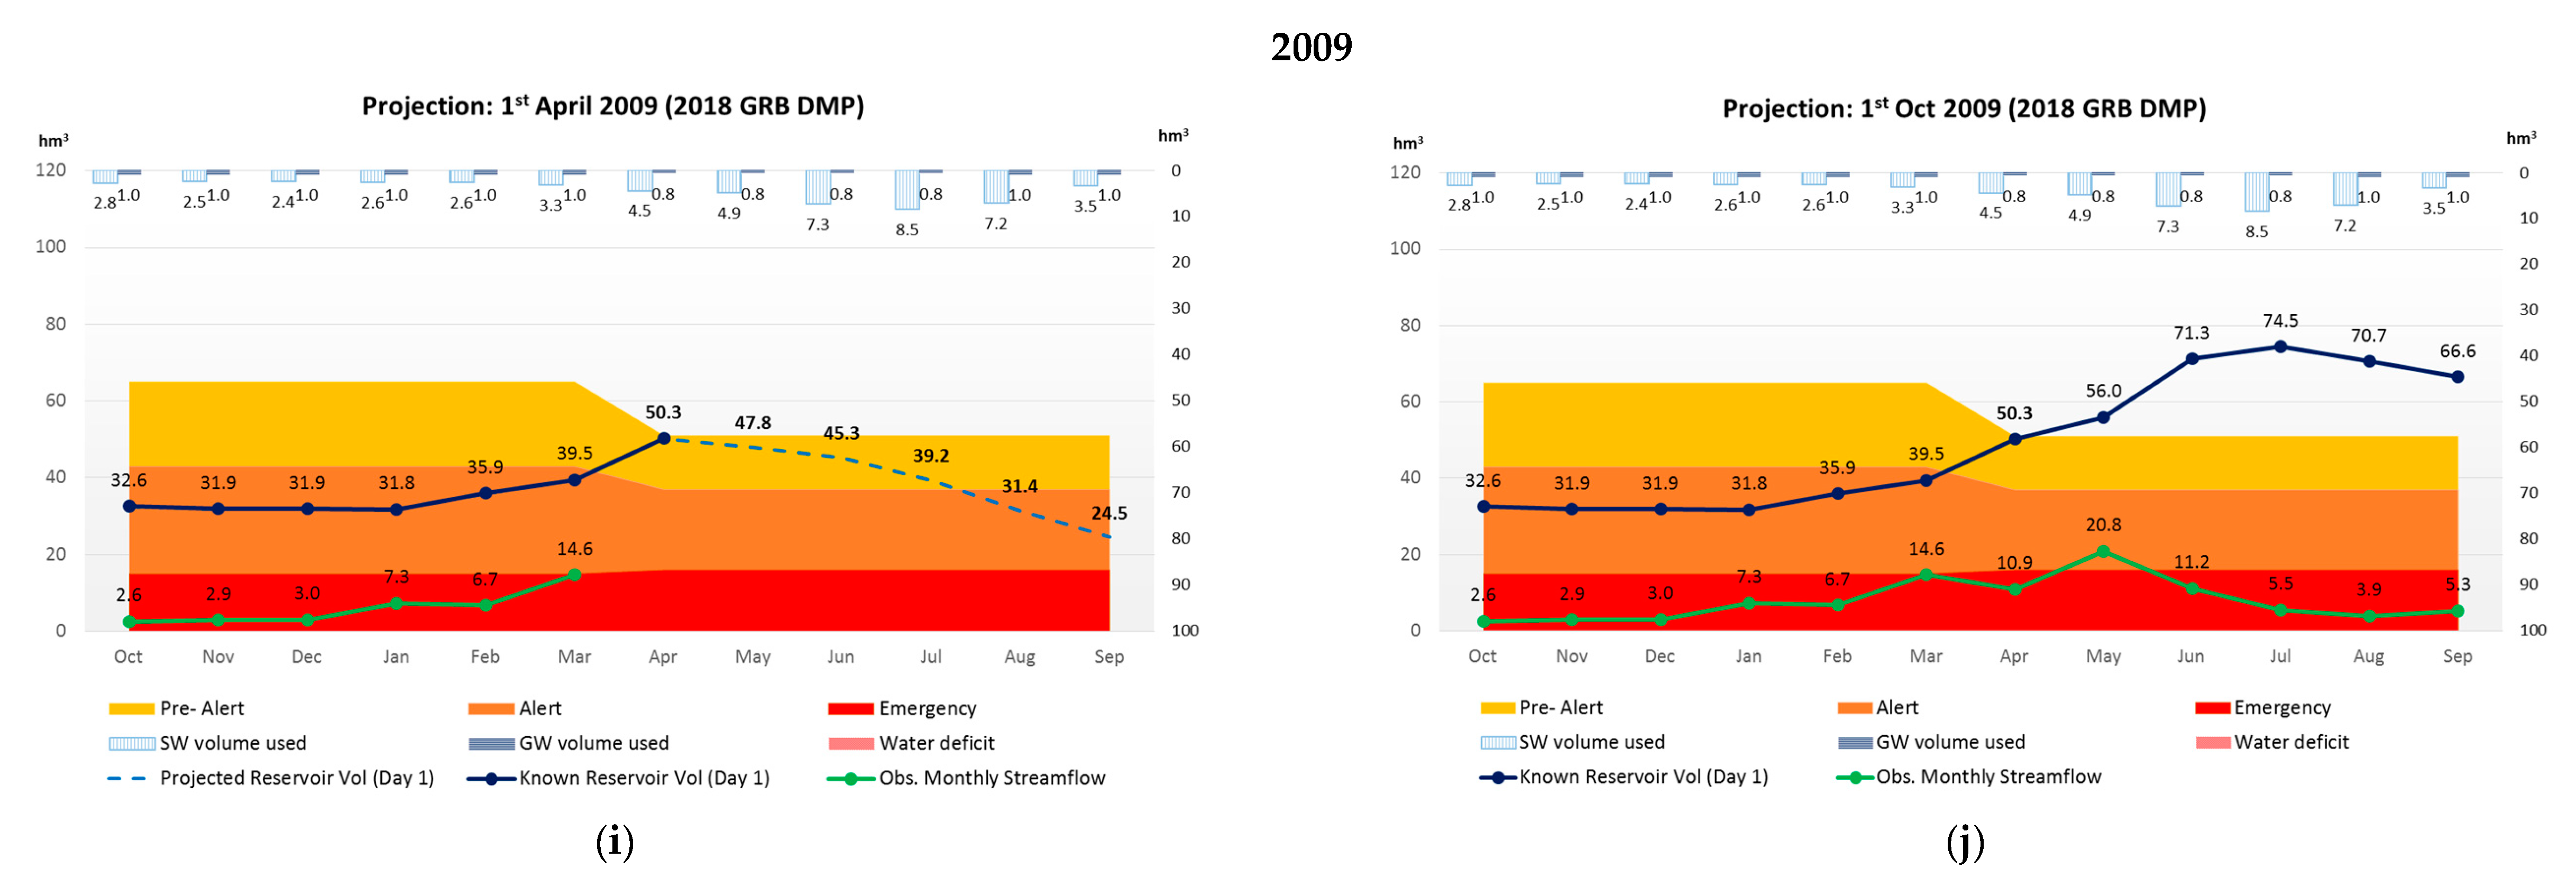
3.4. Limitations of Using the 2018 GRB DMP Water Scarcity Thresholds and Proposed Alternative Water Scarcity Thresholds
- (a)
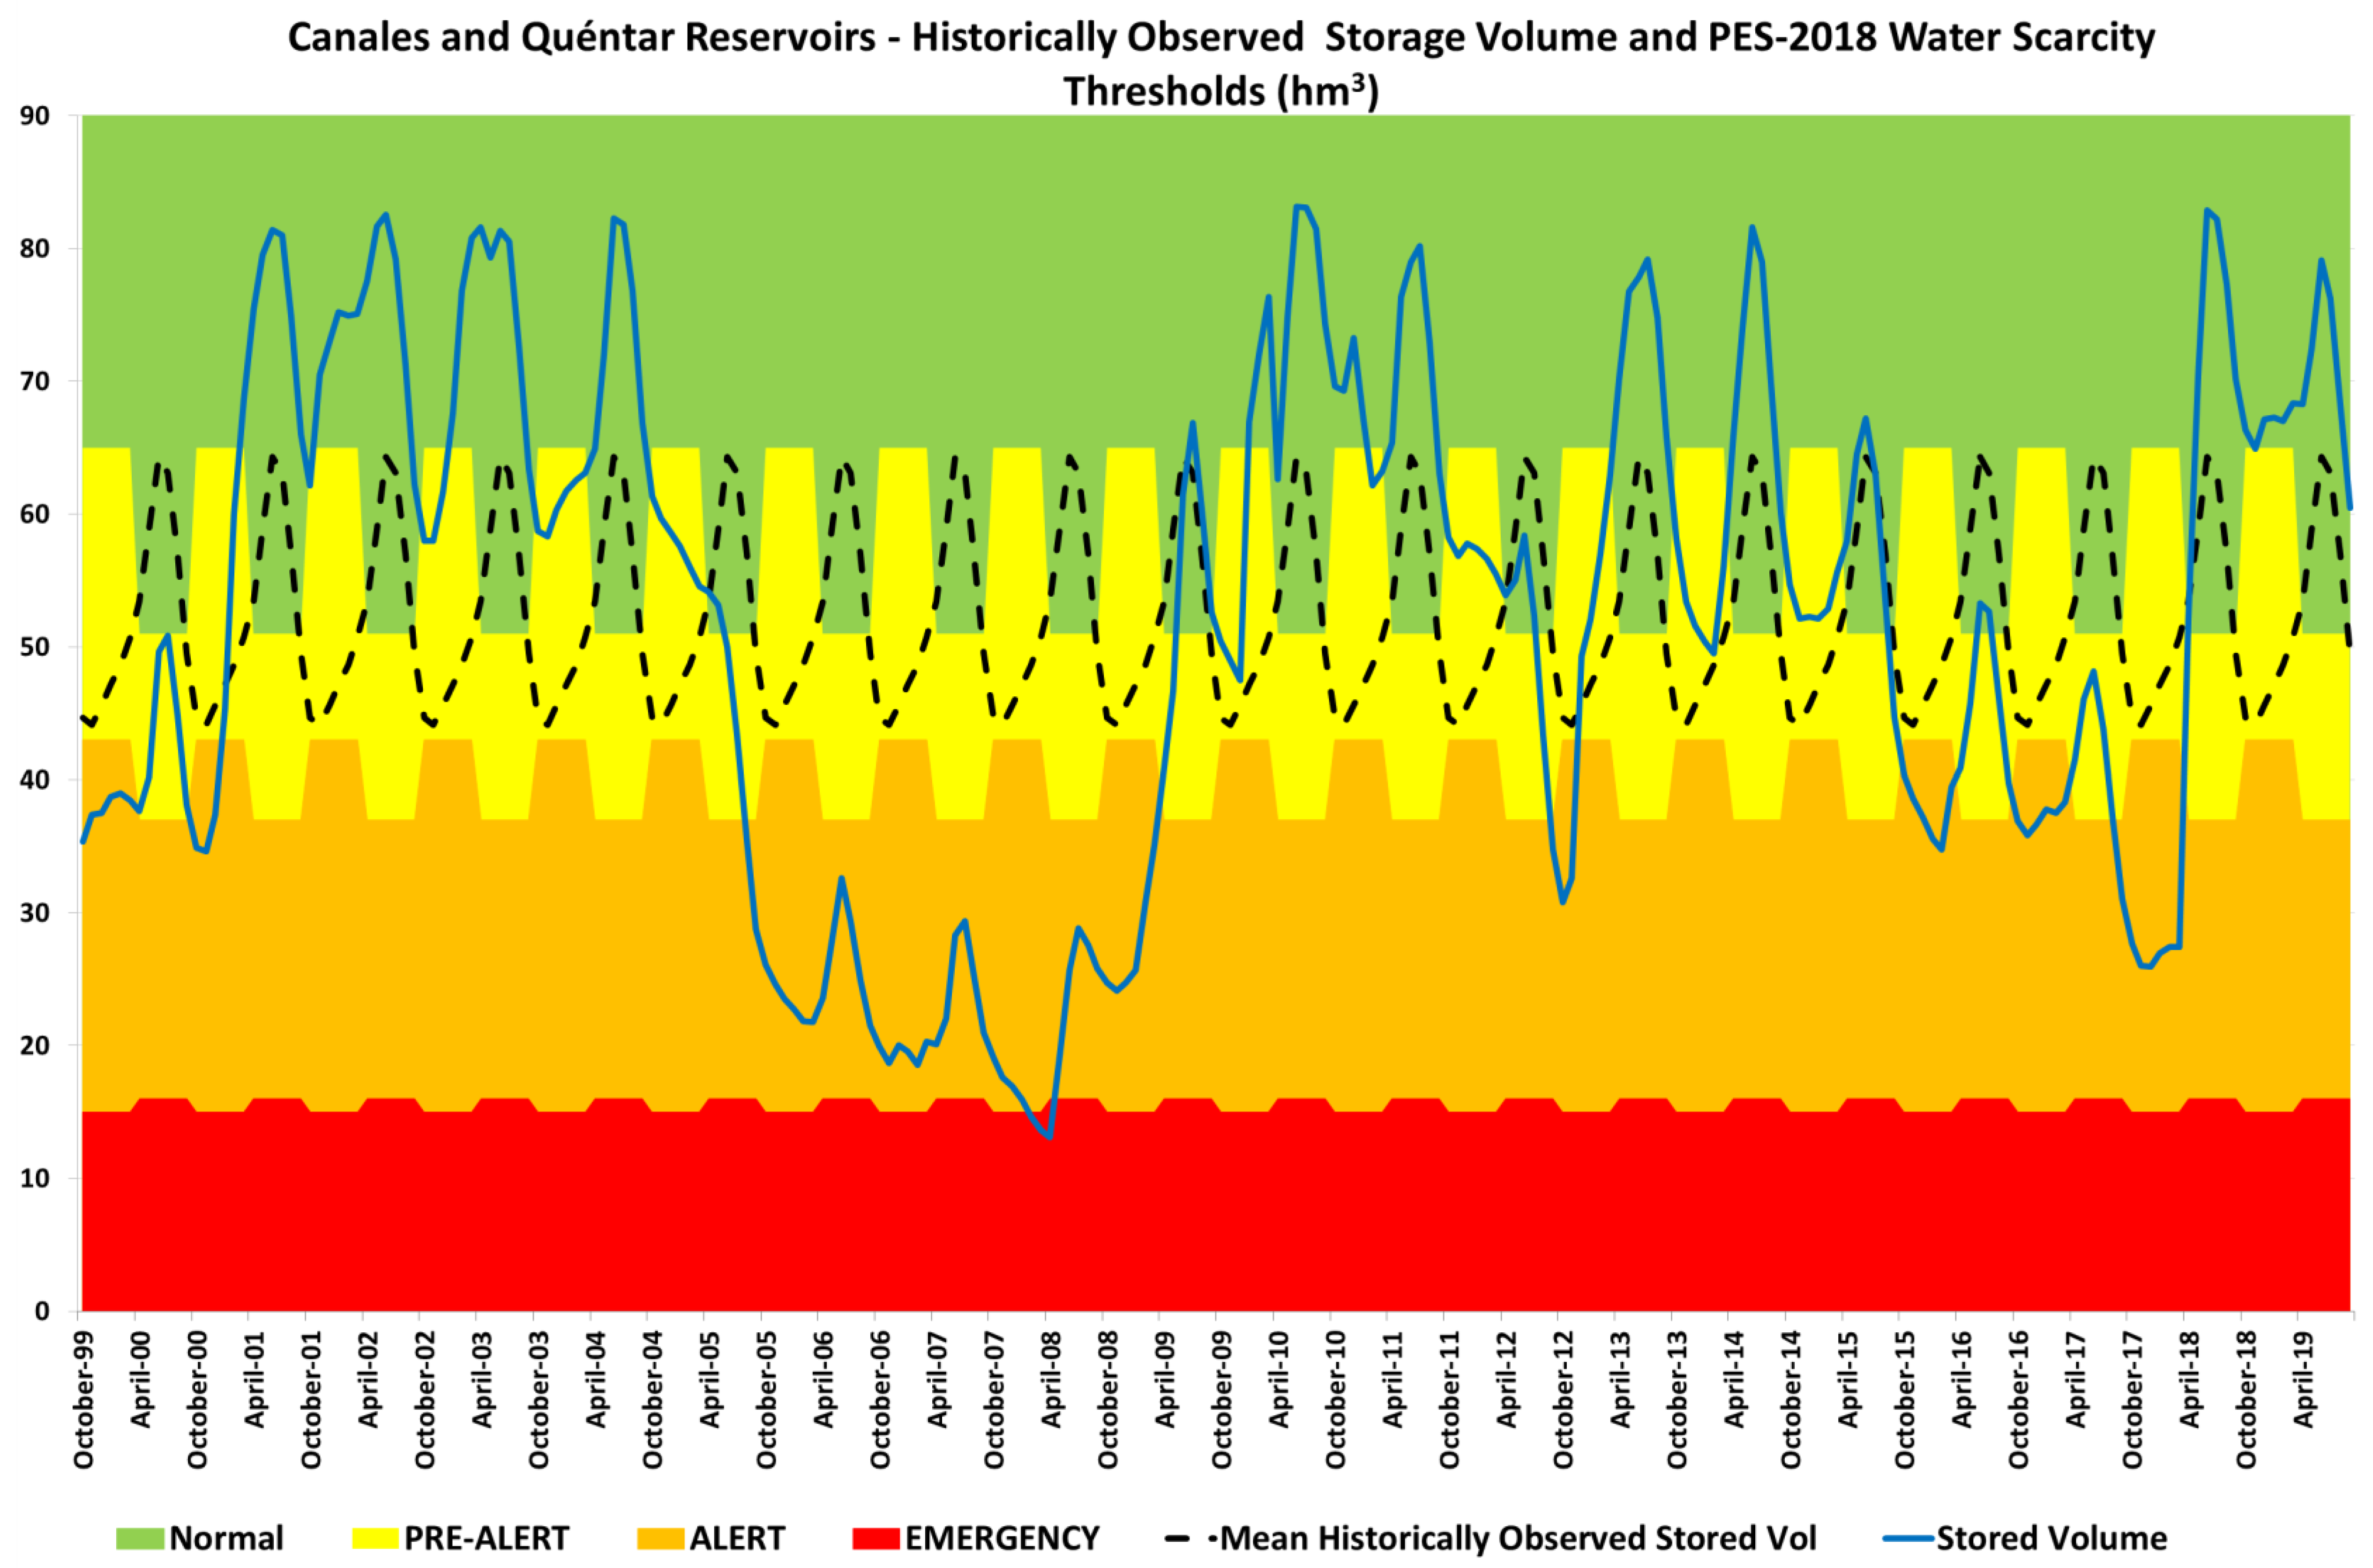
- It is unclear why the thresholds values are constant (from October to March and from April to September). This is not representative of the normal reservoir storage operating curve. The thresholds should vary monthly, depending on the intrinsic characteristics of the system and the stored volume expected for that time of the year.For example, at the beginning of the hydrological year (October–November), the stored volume values are expected to be at their lowest values of the year. After the summer months and the irrigation campaign from the previous hydrological year (April to September), the reservoir is sufficiently empty to provide its water storage and flood protection function for the winter months.
- (b)
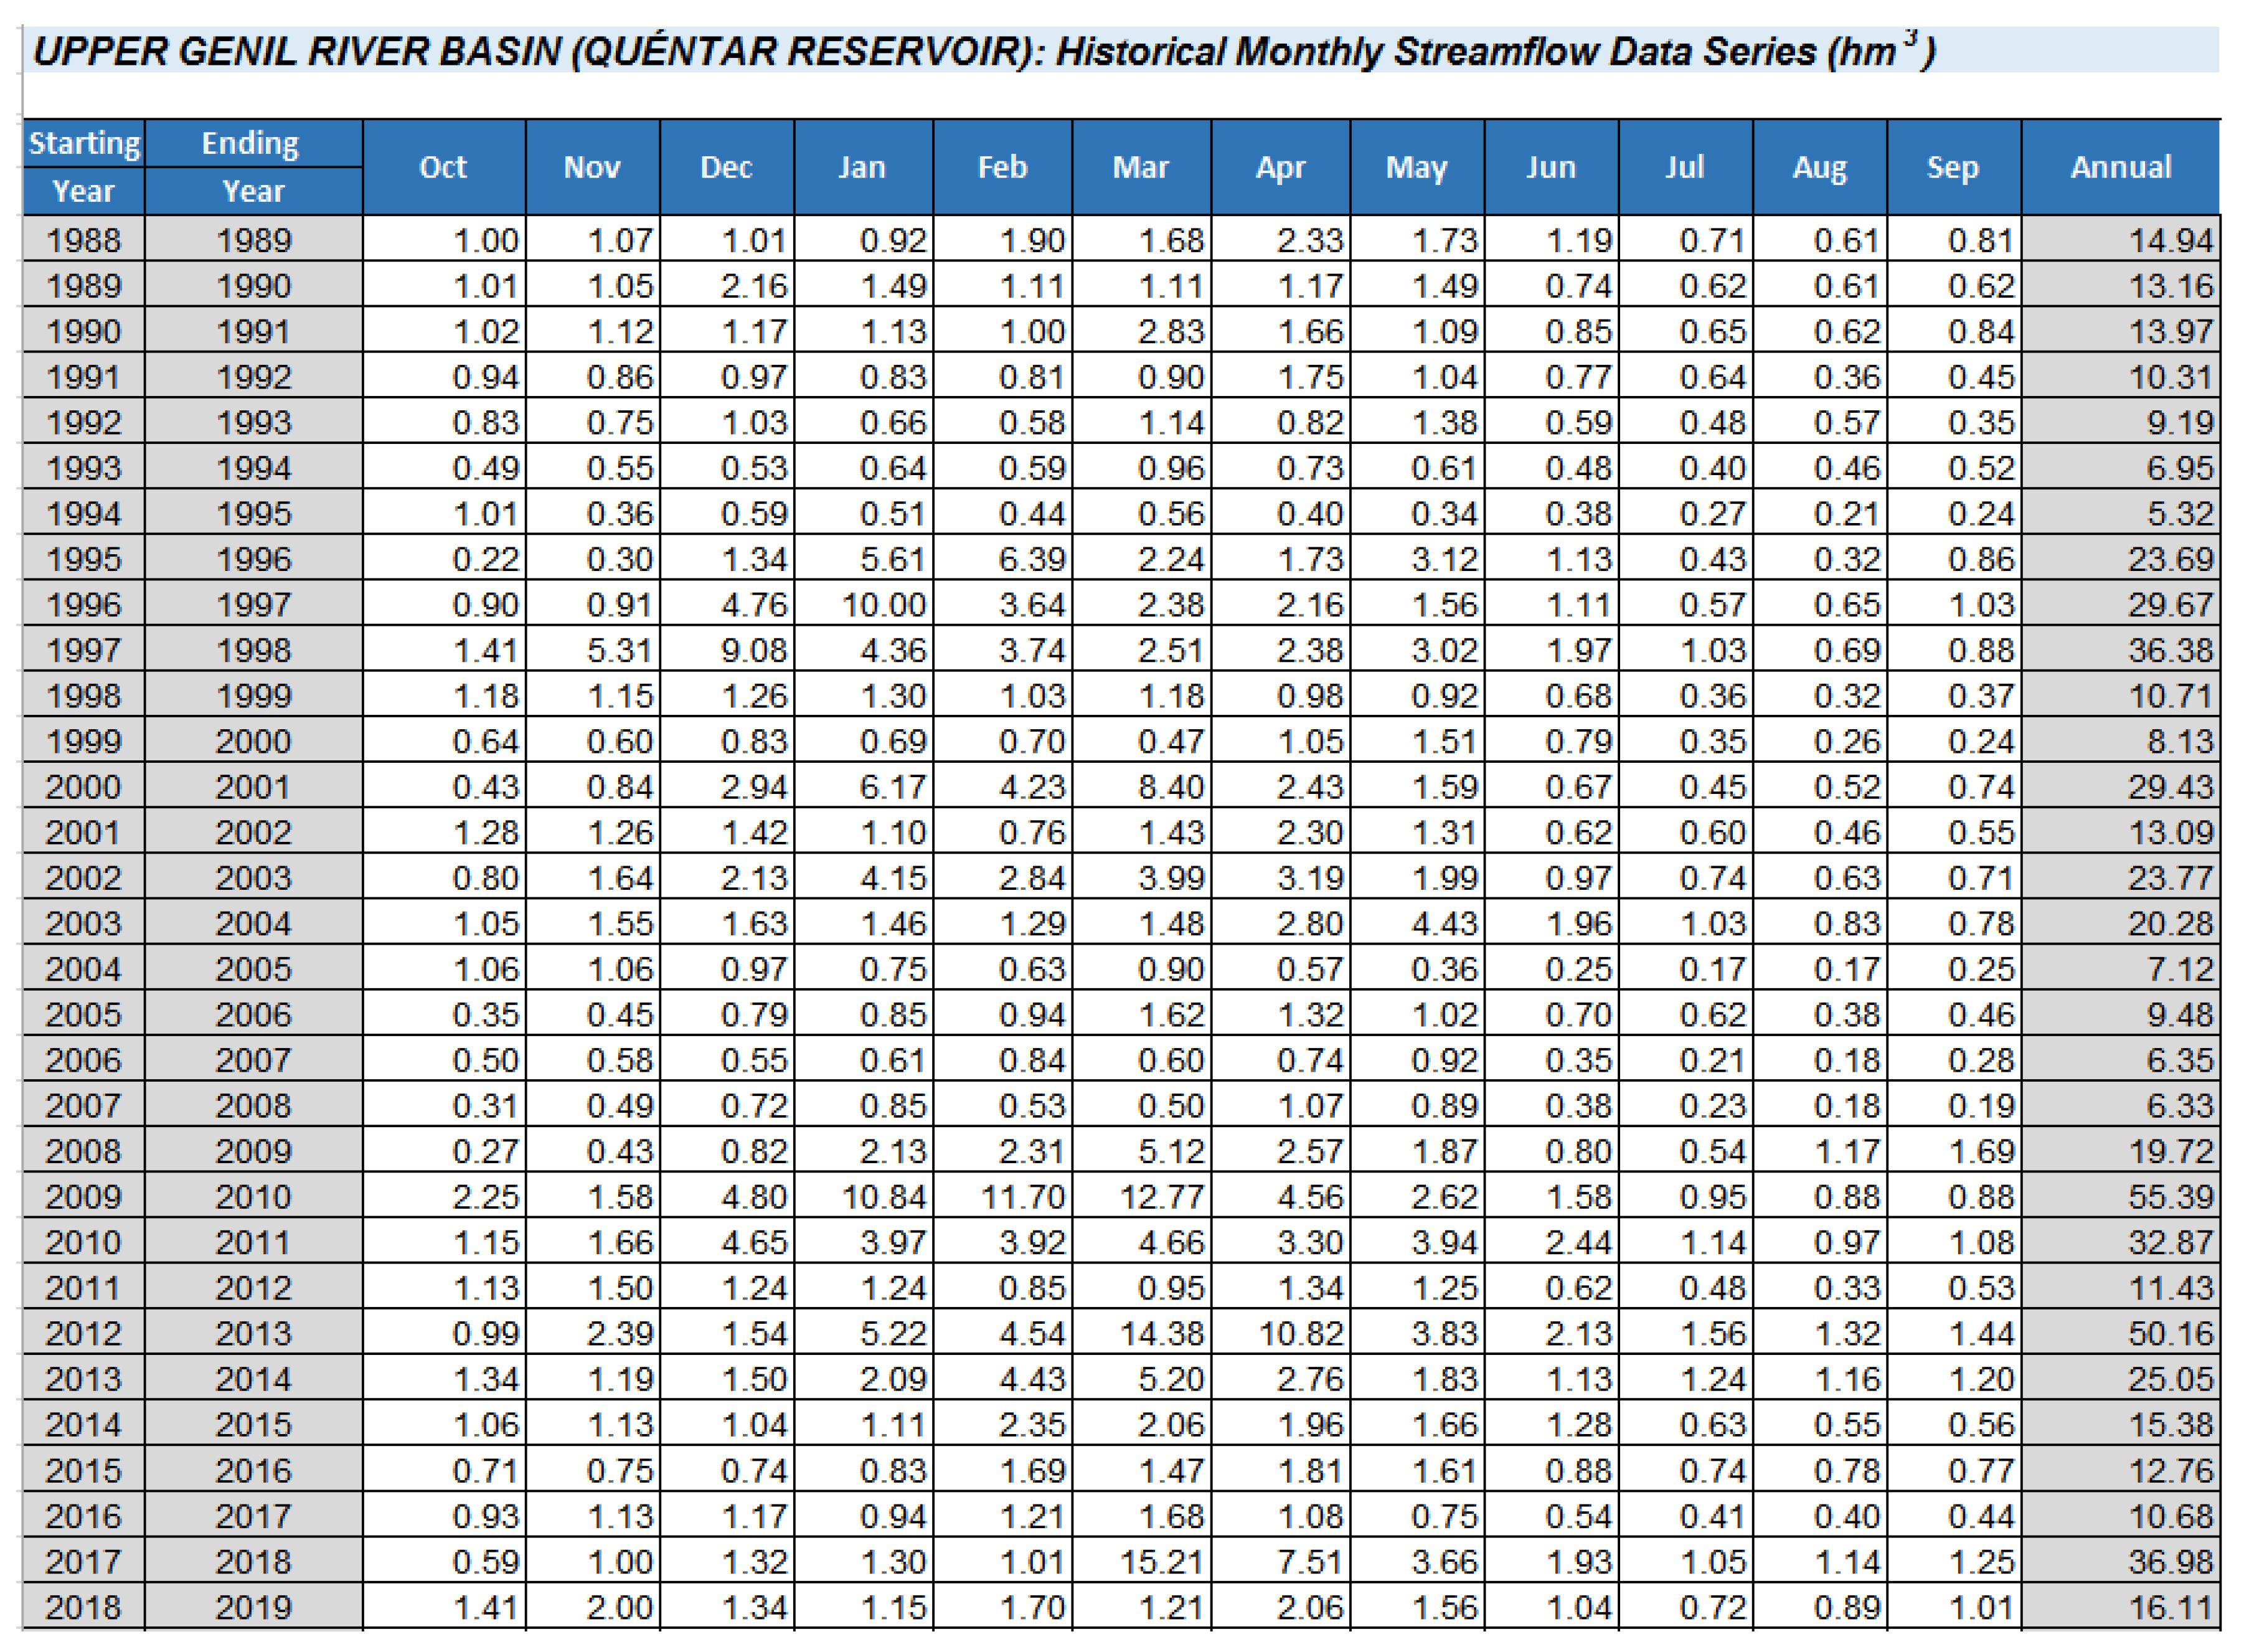
- Pre-alert monthly value of 65 hm3 (from October to March): This value (65 hm3) is relatively high (83.8%) when compared with the total storage capacity of the system (83.5 hm3, 70 hm3 Canales reservoir and 13.5 hm3 Quéntar reservoir). Additionally, this value represents 81% of the average annual streamflow (80.42 hm3 for Canales and Quéntar).Figure 3 shows how, for the historical average year, the system would enter into the pre-alert scenario from October to March (which is not logical). In fact, looking at the historical data set presented in Figure 3, the system is always in pre-alert at the beginning of the year (except in October 2010, when the stored volume was just slightly higher than 65 hm3).One of the measures sets out in the 2018 GRB DMP for the pre-alert scenario is the possibility of mobilizing strategic GW resources. However, if the strategic GW wells are activated and later on these were not actually required, it is important to consider the unnecessary economic and environmental consequences. This is demonstrated in Section 3.5.
- (c)
- Emergency threshold value of 15 hm3 (October–March) and 16 hm3 (April–September): these values are relatively low in comparison with the annual household and irrigation water demands of this this system (37.52 hm3 and 25.90 hm3, respectively as described in Section 2). These values are also relatively low in comparison with the historical minimums recorded in this system. This means that if we face a severe drought situation (similar to the 1991–1995 drought), this would be identified as an “Emergency” situation, considerably late.
- (d)
- The alert and emergency thresholds hardly offer any relevant information, as shown for example during the 2004–2007 drought period.
3.5. Use of Streamflow Forecast Models to Improve Drought Management during the Current Hydrological Year
- (i)
- Scenario I (S-I): Following the 2018 GRB DMP protocol of action;
- (ii)
- Scenario II (S-II): Using a streamflow forecast model in combination with the proposed alternative water scarcity thresholds described in Section 3.4.
- The carbon footprint can be minimized. A decrease in the GW volume consumed would, in principle, imply a reduction in the carbon footprint and economic costs (lower energy consumption due to the pumping requirements from the wells to the potable water treatment plant, as well as lower energy consumption for the potable water treatment requirements).
- Compliance with the ecological flow regime: The S-II model has been set out to satisfy the ecological flows before trying to meet the water demands of the system. Following the 2018 GRB DMP, there is the possibility of justifying a temporal deterioration of the ecological flow regime during a prolonged drought situation (for the particular case of study, this corresponds to the SPI-6month value lower than 1.49). Under this exceptional circumstance, the e-flows could be slightly reduced, and the urban water supply (households) has the highest priority of water use over any other water uses.
- Social consequences and economic losses due to the unnecessary water restrictions to the IWD can be avoided or, at least, considerably minimized.
4. Concluding Remarks
Author Contributions
Funding
Acknowledgments
Conflicts of Interest
Data Availability
Abbreviations
| DMP | Drought Management Plan |
| Emasagra | Local Water and Sewage Company of Granada and metropolitan area |
| EU | European Union |
| GRB | Guadalquivir River Basin |
| GRBA | Guadalquivir River Basin Authority |
| GW | Ground Water |
| hm3 | cubic hectometre (1 hm3 = 106 m3) |
| IWD | Irrigation Water Demand |
| RBA | River Basin Authority |
| RBMP | River Basin Management Plan |
| SW | Surface Water |
| TMU | Territorial Management Unit |
| UWSD | Urban Water Supply Demand |
| WFD | Water Framework Directive (Directive 2000/60/EC) |
Appendix A. Upper Genil River Basin (Guadalquivir River Basin): Modeling Process, Input Data, Sources, and Limitations
Appendix A.1. AQUAFOR: Streamflow Forecast Model
Appendix A.2. AQUASPREAD: Model Simulation Process and Outcomes
Appendix A.3. Input Data
Appendix A.4. Surface Water Resources

Appendix A.5. Groundwater Resources
Appendix A.6. Ecological Flows (e-flows)

| Reservoir | Volume (hm3) | ||||||||||||
|---|---|---|---|---|---|---|---|---|---|---|---|---|---|
| Oct | Nov | Dec | Jan | Feb | Mar | Apr | May | Jun | Jul | Aug | Sep | TOTAL | |
| Canales | 0.308 | 0.298 | 0.388 | 0.388 | 0.351 | 0.388 | 0.376 | 0.295 | 0.285 | 0.295 | 0.295 | 0.285 | 3.952 |
| Quéntar | 0.134 | 0.130 | 0.134 | 0.134 | 0.121 | 0.134 | 0.130 | 0.134 | 0.130 | 0.134 | 0.134 | 0.130 | 1.577 |
Appendix A.7. Established Water Demands (UWSD and IWD)
| Name (from the Guadalquivir RBMP) | Water Demand (hm3) | ||||||||||||
|---|---|---|---|---|---|---|---|---|---|---|---|---|---|
| Oct | Nov | Dec | Jan | Feb | Mar | Apr | May | Jun | Jul | Aug | Sep | TOTAL | |
| UDU 0601 Área Metropolitana de Granada-Genil | 3.127 | 3.127 | 3.127 | 3.127 | 3.127 | 3.127 | 3.127 | 3.127 | 3.127 | 3.127 | 3.127 | 3.127 | 37.524 |
| UDA 06D02. Regadíos Tradicionales Vega Alta río Genil | 0.658 | 0.391 | 0.338 | 0.507 | 0.507 | 1.181 | 2.134 | 2.578 | 4.997 | 6.129 | 5.106 | 1.378 | 25.904 |
Appendix A.8. Minimum and Maximum Storage Volume Reservoirs
| Reservoir | Volume (hm3) | |||||||||||
|---|---|---|---|---|---|---|---|---|---|---|---|---|
| Oct | Nov | Dec | Jan | Feb | Mar | Apr | May | Jun | Jul | Aug | Sep | |
| Canales | 5.00 | 5.00 | 5.00 | 5.00 | 5.00 | 5.00 | 5.00 | 5.00 | 5.00 | 5.00 | 5.00 | 5.00 |
| Quéntar | 2.00 | 2.00 | 2.00 | 2.00 | 2.00 | 2.00 | 2.00 | 2.00 | 2.00 | 2.00 | 2.00 | 2.00 |
| Reservoir | Volume (hm3) | |||||||||||
|---|---|---|---|---|---|---|---|---|---|---|---|---|
| Oct | Nov | Dec | Jan | Feb | Mar | Apr | May | Jun | Jul | Aug | Sep | |
| Canales | 70.0 | 70.0 | 59.4 | 58.6 | 57.9 | 61.5 | 68.6 | 70.0 | 70.0 | 70.0 | 70.0 | 70.0 |
| Quéntar | 13.6 | 13.6 | 11.4 | 11.3 | 11.1 | 11.8 | 13.2 | 13.6 | 13.6 | 13.6 | 13.6 | 13.6 |
Appendix B. 2018 GRB DMP—Proposed Measures to Be Applied to the Upper Genil River Basin
| Water Scarcity Scenario | Type of Measure to Apply | Time | Authority |
|---|---|---|---|
| Normal | Track and monitor the water scarcity index | Monthly | GRB Authority |
| Pre-Alert | Track and monitor the water scarcity index | Any month | GRB Authority |
| Raise awareness campaigns and promote voluntary actions of temporary water savings. | Any month | GRB Authority and Local Water Authority | |
| Inventory, updating and maintenance of specific infrastructures to deal with a potential water scarcity situation. Inspection and adaptation of existing groundwater intakes. | Any month | GRB Authority and Local Water Authority | |
| Assess the possibility of providing up to 8 hm3/year (distributed in at least 6 months) to supply the UWSD from the strategic underground wells. | Any month | GRB Authority and Local Water Authority | |
| Assess the opportunity to advise crops with lower water demands. | October–March | GRB Authority | |
| Alert | Track and monitor the water scarcity index | Any month | GRB Authority |
| Apply water reduction measures to the UWSD (goal: 5%). Activation of water savings plans for large urban consumers and water restrictions on non-essential urban water uses (garden irrigation, street cleaning activities, etc.). | Any month | GRB Authority and Local Water Authority | |
| Activate education and water saving awareness campaigns. | Any month | GRB Authority and Local Water Authority | |
| Verificate that the Alert level of the Operational and Contingency DMPs for urban water supply systems has been activated | Any month | Local Water Authority | |
| Increase the control of the piezometric levels as well as the Deifontes Spring flows | Any month | GRB Authority | |
| Mobilise strategic GW resources: - Up to 12 hm3/year to supply the UWSD - Up to 2.5 hm3/year year to supply the IWD | Any month | GRB Authority and Local Water Authority | |
| Recommendation to the Exploitation Service to assess whether it may be convenient to reduce the water volume allocated to the IWD to face the irrigation campaign. The objective is to schedule the reservoir outflow releases to achieve a minimum reservoir volume at the end of the irrigation campaign of at least 16 hm3 in Quéntar and Canales reservoirs, and of at least 6 hm3 in Cubillas and Colomera reservoirs. | October to March | GRB Authority | |
| Ask the Water Commission and the Exploitation Service to maintain special vigilance for water flow detractions for irrigation. | April to September | GRB Authority | |
| Assess the option to reduce unregulated irrigation water demands and reduce the use of GW resources for irrigation. The objective will be to maintain a strategic groundwater reserve for possible mobilizations if necessary | April to September | GRB Authority | |
| Emergency | Track and monitor the water scarcity index | Any month | GRB Authority |
| Intensify education and water saving awareness campaigns. | Any month | GRB Authority and Local Water Authority | |
| Mobilise strategic GW resources: - Up to 24 hm3/year to supply the UWSD - Up to 5 hm3/year to supply the IWD | Any month | GRB Authority and Local Water Authority | |
| Intensify water reduction measures to the UWSD (minimum 5%, and goal 10%). | Any month | GRB Authority and Local Water Authority | |
| Verificate that the Emergency level of the Operational and Contingency DMPs for urban water supply systems has been activated | Any month | Local Water Authority | |
| Increase the control of the piezometric levels as well as the Deifontes Spring flows | Any month | GRB Authority | |
| Enable the Exploitation Service to reduce the water volume allocated to the IWD to face the irrigation campaign. The objective is to schedule the reservoir outflow releases to achieve a minimum reservoir volume at the end of the irrigation campaign of at least 16 hm3 in Quéntar and Canales reservoirs, and of at least 6 hm3 in Cubillas and Colomera reservoirs. | October to March | GRB Authority | |
| Water restrictions to irrigation, except in exceptional cases, with the objective of reaching a volume greater than 16 hm3 in Quentar and Canales reservoirs, and a volume greater than 6 hm3 in Cubillas and Colomera reservoirs. | April to September | GRB Authority | |
| Ask the Water Commission and the Exploitation Service to maintain special vigilance for water flow detractions for irrigation. | April to September | GRB Authority | |
| Assess the option to reduce unregulated irrigation water demands and reduce the use of GW resources for irrigation. The objective will be to maintain a strategic groundwater reserve for possible mobilizations if necessary | April to September | GRB Authority |
References
- Masson-Delmotte, V.; Zhai, P.; Pörtner, H.-O.; Roberts, D.; Skea, J.; Shukla, P.R.; Pirani, A.; Moufouma-Okia, W.; Péan, C.; Pidcock, R.; et al. IPCC, 2018: Summary for Policymakers. In Global Warming of 1.5 _C; An IPCC Special Report on the Impacts of Global Warming of 1.5 _C above Pre-Industrial Levels and Related Global Greenhouse Gas Emission Pathways, in the Context of Strengthening the Global; Intergovernmental Panel on Climate Change (IPPC): Geneva, Switzerland, 2018; Available online: https://www.ipcc.ch/sr15/chapter/spm/ (accessed on 10 January 2019).
- Schmidt, G.; Benítez, J.J.; Benítez, C. Working Definitions of Water Scarcity and Drought Report; TYPSA Intecsa-Inarsa: Madrid, Spain, 2012. [Google Scholar]
- EC. Water Scarcity and Drought in the European Union-Environment-European Commission 2019. Available online: http://ec.europa.eu/environment/water/quantity/scarcity_en.htm?cookies=disabled (accessed on 15 January 2019).
- EEA. Climate Change, Impacts and Vulerability in Europe 2016. An Indicator-Based Report; European Envitonment Agency: Copenhagen, Denmark, 2016; ISBN 978-92-9213-835-6. [Google Scholar]
- EEA. Climate Change Poses Increasingly Severe Risks for Ecosystems, Human Health and the Economy in Europe; European Envitonment Agency: Copenhagen, Denmark, 2017. [Google Scholar]
- Hervás-Gámez, C.; Delgado-Ramos, F. Drought Management Planning Policy: From Europe to Spain. Sustainability 2019, 11, 1862. [Google Scholar] [CrossRef]
- European Parliament and Council of the European Union. Directive 2000/60/EEC of the European Union and of the Council of 23 October 2000 establishing a framework for community action in the field of water policy. Off. J. Eur. Communities 2000, L327, 2000. [Google Scholar]
- EC. Addressing the Challenge of Water Scarcity and Droughts in the European Union; no. COM (2007) 414, 18.07.07; Environmental Policy Document Catalogue; Commission of the European Communities: Brussels, Belgium, 2007. [Google Scholar]
- EC. First Follow up Report to the Communication on Water Scarcity and Droughts in the European Union COM (2007) 414 Final. Brussels, 19.12.2008 COM (2008) 875 Final; Commission of the European Communities: Brussels, Belgium, 2008. [Google Scholar]
- EC. Second Follow up Report to the Communication on Water Scarcity and Droughts in the European Union 18.5.2010 COM (2010) 228 Final; Commission of the European Communities: Brussels, Belgium, 2010. [Google Scholar]
- EC. Third Follow up Report to the Communication on Water Scarcity and Droughts in the European Union COM (2007) 414 Final SEC(2011) 338 Final; Commission of the European Communities: Brussels, Belgium, 2011. [Google Scholar]
- EC. Commission Communication on the Report on the Review of the European Water Scarcity and Droughts Policy, Adopted together with the Blueprint; COM(2012) 672, 14.11.2012, no. SWD(2012) 380 final EN; Commission of the European Communities: Brussels, Belgium, 2012. [Google Scholar]
- EC. A Blueprint to Safeguard Europe’s Water Resources. Communication from the Commission to the European Parliament, the Council, the European Economic and Social Committee and the Committee of the Regions; Commission of the European Communities: Brussels, Belgium, 2012. [Google Scholar]
- Global Water Partnership Central and Eastern Europe. Guidelines for preparation of the Drought Management Plans. 2015. Available online: http://www.droughtmanagement.info/literature/GWPCEE_Guidelines_Preparation_Drought_Management_Plans_2015.pdf (accessed on 15 February 2019).
- European Commission. Drought Management Plan Report Including Agricultural, Drought Indicators and Climate Change Aspects Water Scarcity and Droughts Expert Network; European Commission: Luxembourg, 2007; Available online: http://www.droughtmanagement.info/literature/GWPCEE_Guidelines_Preparation_Drought_Management_Plans_2015.pdf (accessed on 5 February 2019).
- Spanish Ministry for the Ecological Transition. Planes de Gestión de Sequías. 2019. Available online: https://www.miteco.gob.es/es/agua/temas/observatorio-nacional-de-la-sequia/planificacion-gestion-sequias/ (accessed on 15 January 2019).
- MAPAMA. Ministerio de Agricultura, Pesca y Alimentación. 2007. Available online: https://www.mapa.gob.es/es/ministerio/default.aspx (accessed on 23 March 2019).
- Guadalquivir River Basin Authority. Guadalquivir River Basin-Drought Management Plan. 2018. Available online: http://www.chguadalquivir.es/plan-de-sequia-vigente#PlanesEspecialesdeSequíavigentes (accessed on 15 January 2019).
- Guadalquivir River Basin Authority. General Information Guadalquivir River Basin. 2019. Available online: http://www.chguadalquivir.es/la-demarcacion-hidrografica-del-guadalquivir (accessed on 16 January 2019).
- Delgado-Ramos, F.; Hervas-Gamez, C. Simple and Low-Cost Procedure for Monthly and Yearly Streamflow Forecasts during the Current Hydrological Year. Water 2018, 10, 26. [Google Scholar] [CrossRef]
- CEDEX. Caracterización Hidrológica de Sequías; Ministerio de Agricultura, Alimentación y Medio Ambiente. Secretaría de Estado de Medio Ambiente. Dirección General del Agua. Gobierno de España: Madrid, Spain, 2013; Available online: http://www.cedex.es/CEDEX/LANG_CASTELLANO/ (accessed on 16 January 2019).
- CEDEX. Evaluación del Impacto del Cambio Climático en los Recursos Hídricos y Sequías en España; Ministerio de Agricultura, Alimentación y Medio Ambiente. Secretaría de Estado de Medio Ambiente. Dirección General del Agua. Gobierno de España: Madrid, Spain, 2017; Available online: http://publicacionesoficiales.boe.es/escase (accessed on 16 January 2019).
- Guttman, N.B. On the sensitivity of sample L moments to sample size. J. Clim. 1994, 7, 1026–1029. [Google Scholar] [CrossRef]
- WMO. Standardized Precipitation Index User Guide (WMO-No. 1090); World Meteorological Organization: Geneva, Switzerland, 2012; p. 24. [Google Scholar]
- WMO. Guide to Climatological Practices; World Meteorological Organization: Geneva, Switzerland, 2018. [Google Scholar]
- Tsakiris, G. Drought Risk Assessment and Management. Water Resour. Manag. 2017, 31, 3083–3095. [Google Scholar] [CrossRef]
- Estrela, T.; Sancho, T.A. Drought management policies in Spain and the European Union: From traditional emergency actions to Drought Management Plans. Water Policy 2016, 18, 153–176. [Google Scholar] [CrossRef]
- Mckee, T.B.; Doesken, N.J.; Kleist, J. The Relationship of Drought Frequency and Duration to Time Scales. Available online: https://climate.colostate.edu/pdfs/relationshipofdroughtfrequency.pdf (accessed on 16 January 2019).
- SAIH. Automatic Hydrological Information System (SAIH). Historical hydrological information-Guadalquivir River Basin. 2019. Available online: http://www.chguadalquivir.es/saih/ (accessed on 15 January 2019).
- Bryan, K.; Ward, S.; Barr, S.; Butler, D. Coping with Drought: Perceptions, Intentions and Decision-Stages of South West England Households. Water Resour. Manag. 2019, 33, 1–18. [Google Scholar] [CrossRef]
- Tayyab, M.; Ahmad, I.; Sun, N.; Zhou, J.; Dong, X. Application of Integrated Artificial Neural Networks Based on Decomposition Methods to Predict Streamflow at Upper Indus Basin, Pakistan. Atmosphere 2018, 9, 494. [Google Scholar] [CrossRef]
- Myronidis, D.; Ioannou, K.; Fotakis, D.; Dörflinger, G. Streamflow and Hydrological Drought Trend Analysis and Forecasting in Cyprus. Water Resour. Manag. 2018, 32, 1759–1776. [Google Scholar] [CrossRef]


| Definition | Reduction in precipitation that considerably affects the available natural water resources (surface or groundwater). It does not depend on the existing water demands. | |
| Impacts | It can naturally produce a significant reduction in water quantity and deterioration of water quality. | |
| Indicator | Precipitation and streamflow in natural regime | |
| Global Indicator Value | 0.3–1 | 0–0.3 |
| Scenario | Absence of prolonged drought | Prolonged drought |
| Type of Actions | Control and monitoring. No temporal deterioration. Comply with ecological flow regime. | Possibility of justifying a temporal deterioration and adoption of the ecological flow regime during a prolonged drought situation. |
| Objective of DMP | To limit the temporary deterioration of the water status, as well as less stringent ecological flows (set out in the hydrological plan), to natural situations of prolonged drought only (not related to scarcity problems). | |
| Hydrological Year (from Oct. to Sept.) | Duration | Total Deficit | Mean Annual Deficit | Maximum Annual Deficit | |
|---|---|---|---|---|---|
| Start | End | (Years) | (mm) | (mm) | (mm) |
| 1971/72 | 1976/77 | 6 | 276 | 55 | 101 |
| 1979/80 | 1982/83 | 4 | 591 | 148 | 204 |
| 1985/86 | 1986/87 | 2 | 68 | 34 | 41 |
| 1990/91 | 1994/95 | 5 | 744 | 149 | 270 |
| 1998/99 | 1999/2000 | 2 | 334 | 167 | 280 |
| 2004/05 | 2007/08 | 4 | 81 | 27 | 44 |
| Description | Reduction in available water resources that could risk meeting the existing socio-economic water demands of the specific water system. | |||
| Impact | Socio-economic impacts due to the limitation in available water resources for water use (which could be otherwise addressed in a normal situation). | |||
| Indicator | Storage reservoir volume, reservoir inflow, streamflows, snow storage, groundwater level, etc. | |||
| Global Indicator Value | 1–0.5 Absence | 0.3–0.5 Moderate | 0.15–0.3 Severe | 0–0.15 Extreme |
| Scenario | Normal | Pre-alert | Alert | Emergency |
| Type of Actions and Measures to Be Activated | General planning and monitoring | Public awareness, water-saving, and monitoring | Management (demand/supply), control, and monitoring | Intensify actions already considered in the alert scenario. Possible adoption of extraordinary measures |
| Objective | Progressive establishment of measures in order to delay or avoid the entrance in the most severe phases of scarcity, mitigating their negative consequences on socio-economic uses. | |||
| Scenario | 2018 GRB DMP Water Scarcity Thresholds—Stored Volume Canales and Quéntar Reservoirs (hm3) | |||||||||||
|---|---|---|---|---|---|---|---|---|---|---|---|---|
| Oct | Nov | Dc | Jan | Feb | March | April | May | June | July | August | Sept | |
| Pre-alert | 65 | 65 | 65 | 65 | 65 | 65 | 51 | 51 | 51 | 51 | 51 | 51 |
| Alert | 43 | 43 | 43 | 43 | 43 | 43 | 37 | 37 | 37 | 37 | 37 | 37 |
| Emergency | 15 | 15 | 15 | 15 | 15 | 15 | 16 | 16 | 16 | 16 | 16 | 16 |
| Scenario | Proposed Water Scarcity Thresholds—Stored Volume Canales and Quéntar Reservoirs (hm3) | |||||||||||
|---|---|---|---|---|---|---|---|---|---|---|---|---|
| Oct | Nov | Dc | Jan | Feb | March | April | May | June | July | August | Sept | |
| Pre-alert | 42 | 42 | 41 | 42 | 44 | 46 | 50 | 53 | 57 | 55 | 49 | 44 |
| Alert | 32 | 32 | 32 | 33 | 35 | 37 | 41 | 43 | 48 | 46 | 39 | 34 |
| Emergency | 20 | 19 | 21 | 22 | 25 | 26 | 29 | 31 | 36 | 34 | 27 | 22 |
| Hydrological | S-I: Using the 2018 GRB DMP | S-II: Using AQUAFOR (Mean Streamflow Forecast) | ||||||||||
|---|---|---|---|---|---|---|---|---|---|---|---|---|
| Year | UWSD | IWD | UWSD | IWD | ||||||||
| SW | GW | Total | Deficit | SW | Deficit | SW | GW | Total | Deficit | SW | Deficit | |
| 2004/05 | 35.46 | 2.06 | 37.52 | 0 | 25.90 | 0.00 | 37.52 | 0.00 | 37.52 | 0 | 25.90 | 0.00 |
| 2005/06 | 25.14 | 12.38 | 37.52 | 0 | 9.16 | 16.74 | 22.14 | 15.38 | 37.52 | 0 | 21.44 | 4.46 |
| 2006/07 | 23.14 | 14.38 | 37.52 | 0 | 14.88 | 11.02 | 19.14 | 18.39 | 37.52 | 0 | 14.74 | 11.16 |
| 2007/08 | 19.14 | 18.39 | 37.52 | 0 | 11.39 | 14.51 | 18.14 | 19.39 | 37.52 | 0 | 14.74 | 11.16 |
| 2008/09 | 26.14 | 11.38 | 37.52 | 0 | 25.90 | 0.00 | 37.52 | 0.00 | 37.52 | 0 | 25.90 | 0.00 |
| Total | 129.02 | 58.60 | 187.62 | 0 | 87.25 | 42.27 | 134.46 | 53.16 | 187.62 | 0 | 102.73 | 26.79 |
| Mean | 25.80 | 11.72 | 37.52 | 0 | 17.45 | 8.45 (33% *) | 26.89 | 10.63 | 37.52 | 0 | 20.55 | 5.36 (21%) * |
| Comparison B/A (%) | 4% | −9% | 0% | 18% | −37% | |||||||
© 2019 by the authors. Licensee MDPI, Basel, Switzerland. This article is an open access article distributed under the terms and conditions of the Creative Commons Attribution (CC BY) license (http://creativecommons.org/licenses/by/4.0/).
Share and Cite
Hervás-Gámez, C.; Delgado-Ramos, F. Are the Modern Drought Management Plans Modern Enough? The Guadalquivir River Basin Case in Spain. Water 2020, 12, 49. https://doi.org/10.3390/w12010049
Hervás-Gámez C, Delgado-Ramos F. Are the Modern Drought Management Plans Modern Enough? The Guadalquivir River Basin Case in Spain. Water. 2020; 12(1):49. https://doi.org/10.3390/w12010049
Chicago/Turabian StyleHervás-Gámez, Carmen, and Fernando Delgado-Ramos. 2020. "Are the Modern Drought Management Plans Modern Enough? The Guadalquivir River Basin Case in Spain" Water 12, no. 1: 49. https://doi.org/10.3390/w12010049
APA StyleHervás-Gámez, C., & Delgado-Ramos, F. (2020). Are the Modern Drought Management Plans Modern Enough? The Guadalquivir River Basin Case in Spain. Water, 12(1), 49. https://doi.org/10.3390/w12010049