Article

Spatiotemporal Variations in Seston C:N:P Stoichiometry in a Large Eutrophic Floodplain Lake (Lake Taihu): Do the Sources of Seston Explain Stoichiometric Flexibility?

1
State Key Laboratory of Lake Science and Environment, Nanjing Institute of Geography and Limnology, Chinese Academy of Sciences, Nanjing 210008, China
2
University of Chinese Academy of Sciences, Beijing 100049, China
3
State Key Laboratory of Hydrology-Water Resources and Hydraulic Engineering, Nanjing Hydraulic Research Institute, Nanjing 210029, China
*
Author to whom correspondence should be addressed.
Water 2020, 12(1), 36; https://doi.org/10.3390/w12010036
Submission received: 24 October 2019 / Revised: 12 December 2019 / Accepted: 14 December 2019 / Published: 20 December 2019
(This article belongs to the Special Issue Geochemistry of Water and Sediment)

Abstract

:
Although sources of seston are much more complicated in lakes compared to oceans, the influences of different sources on the spatiotemporal variations in seston stoichiometry are still underexplored, especially in large eutrophic floodplain lakes. Here, we investigated seston stoichiometric ratios across a typical large eutrophic floodplain lake (Lake Taihu, East China) over one year. In addition, we used the n-alkane proxies to examine the influence of the seston source on seston stoichiometry variation. Throughout the study, the average value of the C:N:P ratio of 143:19:1 across Lake Taihu was close to the canonical lake’s ratios (166:20:1). Similar to other eutrophic lakes, seston C:N ratios varied the least across all environments, but C:P and N:P ratios varied widely and showed a strong decreasing trend in ratios of N:P and C:P from growing season to senescence season. This seasonal change was mainly associated with the decreasing contribution from algal-derived materials in seston pools because the non-algal dominated seston exhibited significantly lower ratios than algal-dominated seston. Furthermore, the spatial heterogeneity of stoichiometric ratios was also related to the seston source. During the senescence season, the terrestrial-dominated seston from agricultural watershed exhibited the lowest ratios in estuary sites compared with other areas. Statistically, the predictive power of environmental variables on stoichiometric ratios was strongly improved by adding n-alkanes proxies. Apart from source indicators, particulate phosphorus (PP) contents also partly explained the spatiotemporal variations in stoichiometric ratios. This study, thus, highlights the utility of multiple-combined n-alkane proxies in addition to simple C:N ratios to get more robust source information, which is essential for interpreting the spatiotemporal variations in seston stoichiometric ratios among eutrophic floodplain lakes and other freshwater ecosystems.

1. Introduction

The C:N:P ratio of suspended particulate matters, hereafter “seston”, is closely tied to biogeochemical cycles and food webs in aquatic ecosystems [1,2,3]. Since A. C. Redfield first observed that C:N:P ratios of seston in the offshore surface ocean are similar to the ratios of dissolved nutrients in the deep ocean, the classical Redfield ratio (C:N:P = 106:16:1) is routinely used to interpret and predict ecosystem processes in oceans [4]. However, the general applicability of the classical Redfield ratio has been widely discussed since its introduction, especially among freshwater ecosystems [5,6,7]. Compared to marine ecosystems, lakes exhibit relatively higher stoichiometric ratios (C:N:P = 166:20:1) and show considerable variation in these ratios, especially on a local scale [7]. As these variations have been shown to reflect changes in nutrient limitation, secondary production, and community structure [8,9], the causes of this great local-scale variability in lakes are of considerable interest.
In the majority of studies to date, a long list of various biotic and abiotic causes have been advocated for variable seston C:N:P ratios, including taxonomic composition of phytoplankton, nutrient availability, temperature, light intensity, and seston mass, which drive the variability of seston stoichiometry through directly or indirectly affecting elemental ratios of algal cells [5,7,10,11,12]. However, when taking these factors into account, it is of vital importance to consider the source of seston in advance. There are indications that the terrestrial-derived seston is unignorable in many floodplain lakes where river-lake interactions are intensive and residence times are short [13,14]. Even within some eutrophic floodplain lakes, the terrestrial compartments could dominate seston pools, especially when algal blooming is fading [15,16]. Furthermore, many eutrophic floodplain lakes are partly covered by macrophytes [17], which also provide detrital seston. In these cases, non-algal components dominance may mask algae effects on seston C:N:P ratios [18]. Nevertheless, the systematical consideration of different seston sources is still scarce among eutrophic floodplain lakes.
On the one hand, previous studies preferentially focused on the responses of the algal community, because high algal biomass was expected in eutrophic waterbodies [8,9]. On the other hand, many studies simply identified seston sources based on C:N ratios [19,20,21,22]. However, the suitability of the C:N ratio as a source indicator has been under debate for decades. Its uncertainty has been noted in many works, as it may be confounded by factors such as the incorporation of microbial biomass during biodegradation [23,24] and fixation of inorganic nitrogen on clays [25], both of which could lower the C:N ratio and weaken the divergence between algal and terrestrial origins. Compared to the C:N ratio n-alkane proxies are more robust as tools for identifying sources of seston in lakes because they are source-specific and more resistant to biodegradation [26,27,28,29]. It is widely confirmed that the short-chain (C17–C21) n-alkanes are mainly derived from algal sources, while long-chain (C27–C33) n-alkanes are mainly derived from terrestrial sources [30]. Additionally, middle-chain n-alkanes (C23–C25) are mainly derived from submerged and floating aquatic macrophytes [31]. Depending on the source-specific distribution of n-alkanes, various proxies were designed and applied across diverse habitats, such as odd-to-even carbon preference index (CPI) [32], the ratio of terrigenous to aquatic odd n-alkanes (TARHC) [33], the ratio of C27 to C31(K1) [34], the ratio of emergent macrophytes to higher plants (Pwax) [35], n-alkane average chain length (ACL) [36], and other proxies (summarised in previous reviews [30,37]). These proxies provide a relatively straightforward way to identify the seston source in ecosystems with various sources, such as eutrophic floodplain lakes.
Lake Taihu, located in the Yangtze River floodplain in Eastern China, is a typical large shallow eutrophic freshwater lake. Similar to other large eutrophic floodplain lakes, Lake Taihu is often characterized by serious cyanobacterial blooms, intensive riverine inputs, and great spatial heterogeneity [38]. Due to its high-level eutrophication, the cyanobacterial blooms prevail during the growing season (from late spring to early autumn) and fade away during the senescence season (from late autumn to early spring) [39]. Meanwhile, the majority of riverine input enters the lake mostly via tributaries, which bring higher eutrophic stress and larger amounts of allochthonous particles in the vicinity of western inlets and adjacent lakeshores, than further away [40]. The eastern region of Lake Taihu is partly covered by submerged macrophytes and rarely observed with algal blooms [38]. Additionally, the large size of Lake Taihu can increase the spatial heterogeneity due to incomplete horizontal mixing processes [41]. The frequent wind-induced mixing process in shallow lakes can influence the horizontal and vertical distribution of seston [42]. These topographic and environmental characteristics likely cause great spatiotemporal variation in seston C:N:P ratios on a local scale. While dissolved and total nutrients have been comprehensively studied in Lake Taihu, drivers of variation in particulate nutrients stoichiometry remain underexplored [20].
In this study, the seston C, N, and P concentrations were measured monthly across Lake Taihu over one year, where the environmental data were simultaneously documented. In addition, n-alkane proxies were applied to identify the source of seston in Lake Taihu. Our primary objective was to characterize spatiotemporal variations in seston C:N:P stoichiometry in Lake Taihu and to relate this variation to environmental factors, putting special attention to sources of seston. We hypothesized that seston sources are important factors in shaping the spatiotemporal pattern of seston stoichiometric ratios in Lake Taihu and similar eutrophic floodplain lakes.

2. Materials and Methods
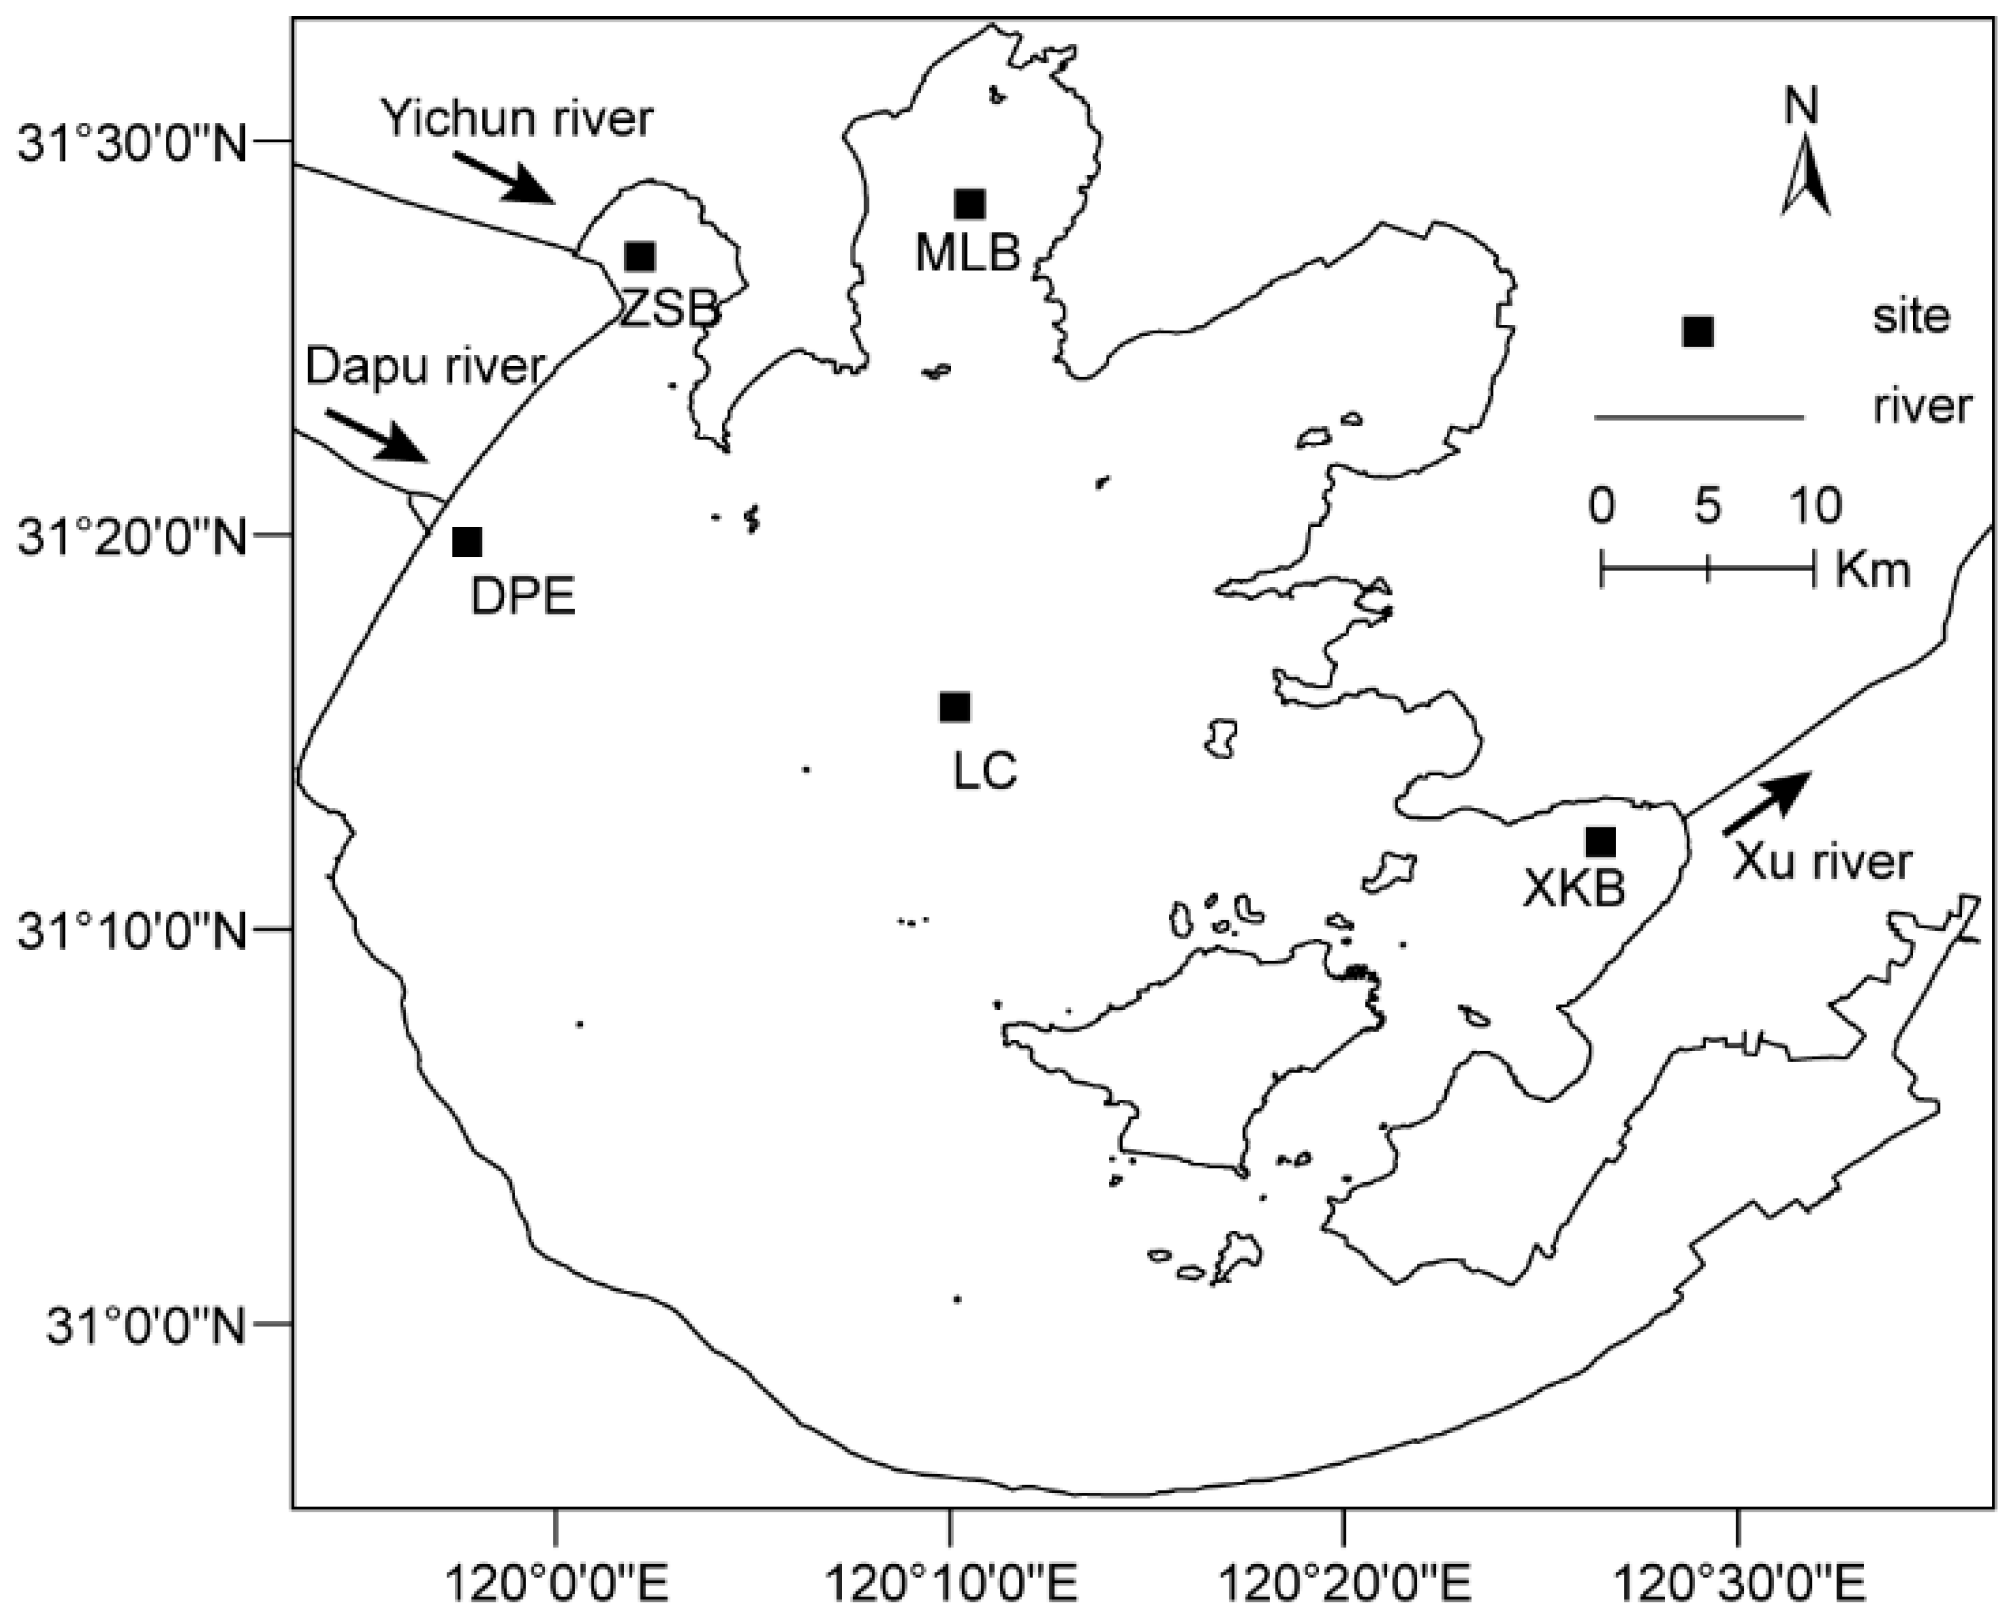
2.1. Study Sites

Samples were collected at five sites (Figure 1) that could be taken as representatives as four main sub-ecotypes of Lake Taihu [43]. Station DPE and ZSB are, respectively, situated on the estuary area of the Dapu river and Yicun river, which are the two greatest inflow rivers of Lake Taihu [38]. Site MLB is located in Meiliang Bay, a region where cyanobacteria bloom is serious and riverine inputs are rigorously constrained. Station LC is located in the center of the open lake, where the water is less enriched with nutrients but exposed to more frequent wind-induced sediment resuspension. Site XKB is located in Xukou Bay, a typical macrophyte zone near the outflow Xu river.

2.2. Fieldwork

Monthly sampling works were carried out between June 2016 and May 2017. Five liters of sub-surface (0.5 m) water was collected from each site using an acid-cleaned plastic sampler. Due to the shallowness (e.g., mean depth is 1.9 m) and intensive wave-induced vertical mixing, the samples from the sub-surface could represent the entire water column [44]. The water temperature (T) was measured in situ using a YSI-6600 handle multiparameter meter (Yellow Springs Instruments, OH USA). All water samples were transferred in acid-washed 5 L bottles and temporally stored at 4 °C before further analysis.

2.3. Sample Processing and Analyses

Using standard methods [45], total suspended solids (TSS) and chlorophyll a (Chl a) were quantified immediately upon return to the Taihu Laboratory for Lake Ecosystem Research (TLLER, http://taihu.niglas.cas.cn/). Water samples for dissolved nutrients were filtered through pre-ashed 0.7 μm glass fiber filters (Whatman GF/F, Sigma-Aldrich, St. Louis, MO, USA), and all GF/F filters for seston stoichiometry and n-alkanes were freeze-dried and stored at −20 °C. Total dissolved phosphorus (TDP), dissolved nitrogen (TDN), ammonium ( NH 4 + ), and phosphate ( PO 4 3 ) concentrations in filtrates were measured according to standard analytical methods [45]. Dissolved organic carbon (DOC) were determined on a TOC analyzer (Shimadzu, Kyoto, Japan). For analyzing particulate organic carbon (POC) and particulate nitrogen (PN) in seston, frozen filters were thawed and dried at 50 °C for 1 h, then weighed and kept at room temperature in a desiccator. In order to remove the carbonate fraction, these filters were fumed with HCl and re-dried in a clean fume hood. The carbon and nitrogen contents were subsequently determined on an NA-1500 elemental analyzer (Fisons Instruments, Glasgow, United Kingdom). Particulate phosphorus (PP) was analyzed on corresponding filters placed in 15 mL distilled water that acidified with H2SO4 and digested with peroxodisulphate at 121 for 1 h [18]. The final phosphate concentration in digested solutions was measured spectrophotometrically as the same protocol as TP and TDP. POC, PN, and PP indicated the mass concentration per unit mass of TSS. ρPOC, ρPN, and ρPP indicated the mass concentration per unit volume. As described in the previous study [46], the n-alkanes were extracted by the microwave method. Concentrations of n-alkanes were quantified on an Agilent 7890 gas chromatography (Agilent Technologies, Santa Clara, CA, USA) with a flame ionized detector. The n-C36 alkane was used as lab standards for peak identification and quantification.

2.4. Calculation of n-Alkane Proxies

Although many n-alkane proxies are designed, some of them have been only applied in specific habitats or studies, such as Pwax and K1. Thus, four classical proxies, which are widely used in lake ecosystems, had been selected and calculated to estimate the origins of seston, including CPI, TARHC, the modified ACL between C16 and C32 [28], and the ratio that reflects the aquatic macrophyte to terrestrial plants (Paq) [31]. The calculation formulas and diagnostic values in the literature of selected proxies were listed in Table 1.

2.5. Statistical Analysis

Before the statistical analysis, raw datasets were log-transformed. The normality and variances’ homogeneity of transformed datasets were confirmed with Shapiro–Wilk’s tests and Levene’s test (data not shown), respectively. Based on previous studies [8,48], the four regular seasons were categorized into two periods: the growing season (from April to September) and senescence season (from October to March). The site, season, and site and season interaction effects were tested by two-way ANOVA analysis. The multiple pairwise-comparisons were performed by Tukey HSD tests. These above statistical analyses were conducted in R program (version 3.5.3) with “agricolae” (version 1.3.1), “car” (version 3.0.5), and “lsmeans” (version 2.30.0) packages. Flexible discriminate analysis based on optimum scoring (FDA) was performed to investigate the discriminate patterns of n-alkane proxies, which was conducted by the “mda” (version 0.4.10) package. Analysis of similarity (ANOSIM) was used to test whether n-alkane proxies of samples were different between seasons in overall Lake Taihu or within each site, which was conducted by the “vegan” (version 2.5.5) package. The correlation between variables and stoichiometric ratios were investigated by Pearson correlation, which was conducted by the “psych” (version 1.8.12) package.
Partial least squares regression (PLSR) was used in order to examine the relative influence (predictive power) of individual environmental variables on each stoichiometric ratio. Compared to multiple linear regression, PLSR is more powerful for confronting possibly correlating and non-normal predictors [49]. The ratios and predictors’ datasets were log-transformed before modeling. The optimum number of components were found using Wold’s R criterion [50]. The k-fold cross-validation (k = 10 segments) was chosen to test validation of models. The performance of each PLSR model was compared using the coefficient of determination (R2), root mean square error (RMSE), and mean bias (Bias). The relative influence of each variable was quantified using variable importance in the projection (VIP) scores where variables >1.0 have strong influences, variables <0.8 have weak influence, and variables in the middle range (0.8–1.0) have moderately influence [41,51]. All these processes were conducted by “mdatools” (version 0.9.4) and “pls” (version 2.7.1) packages.

3. Results

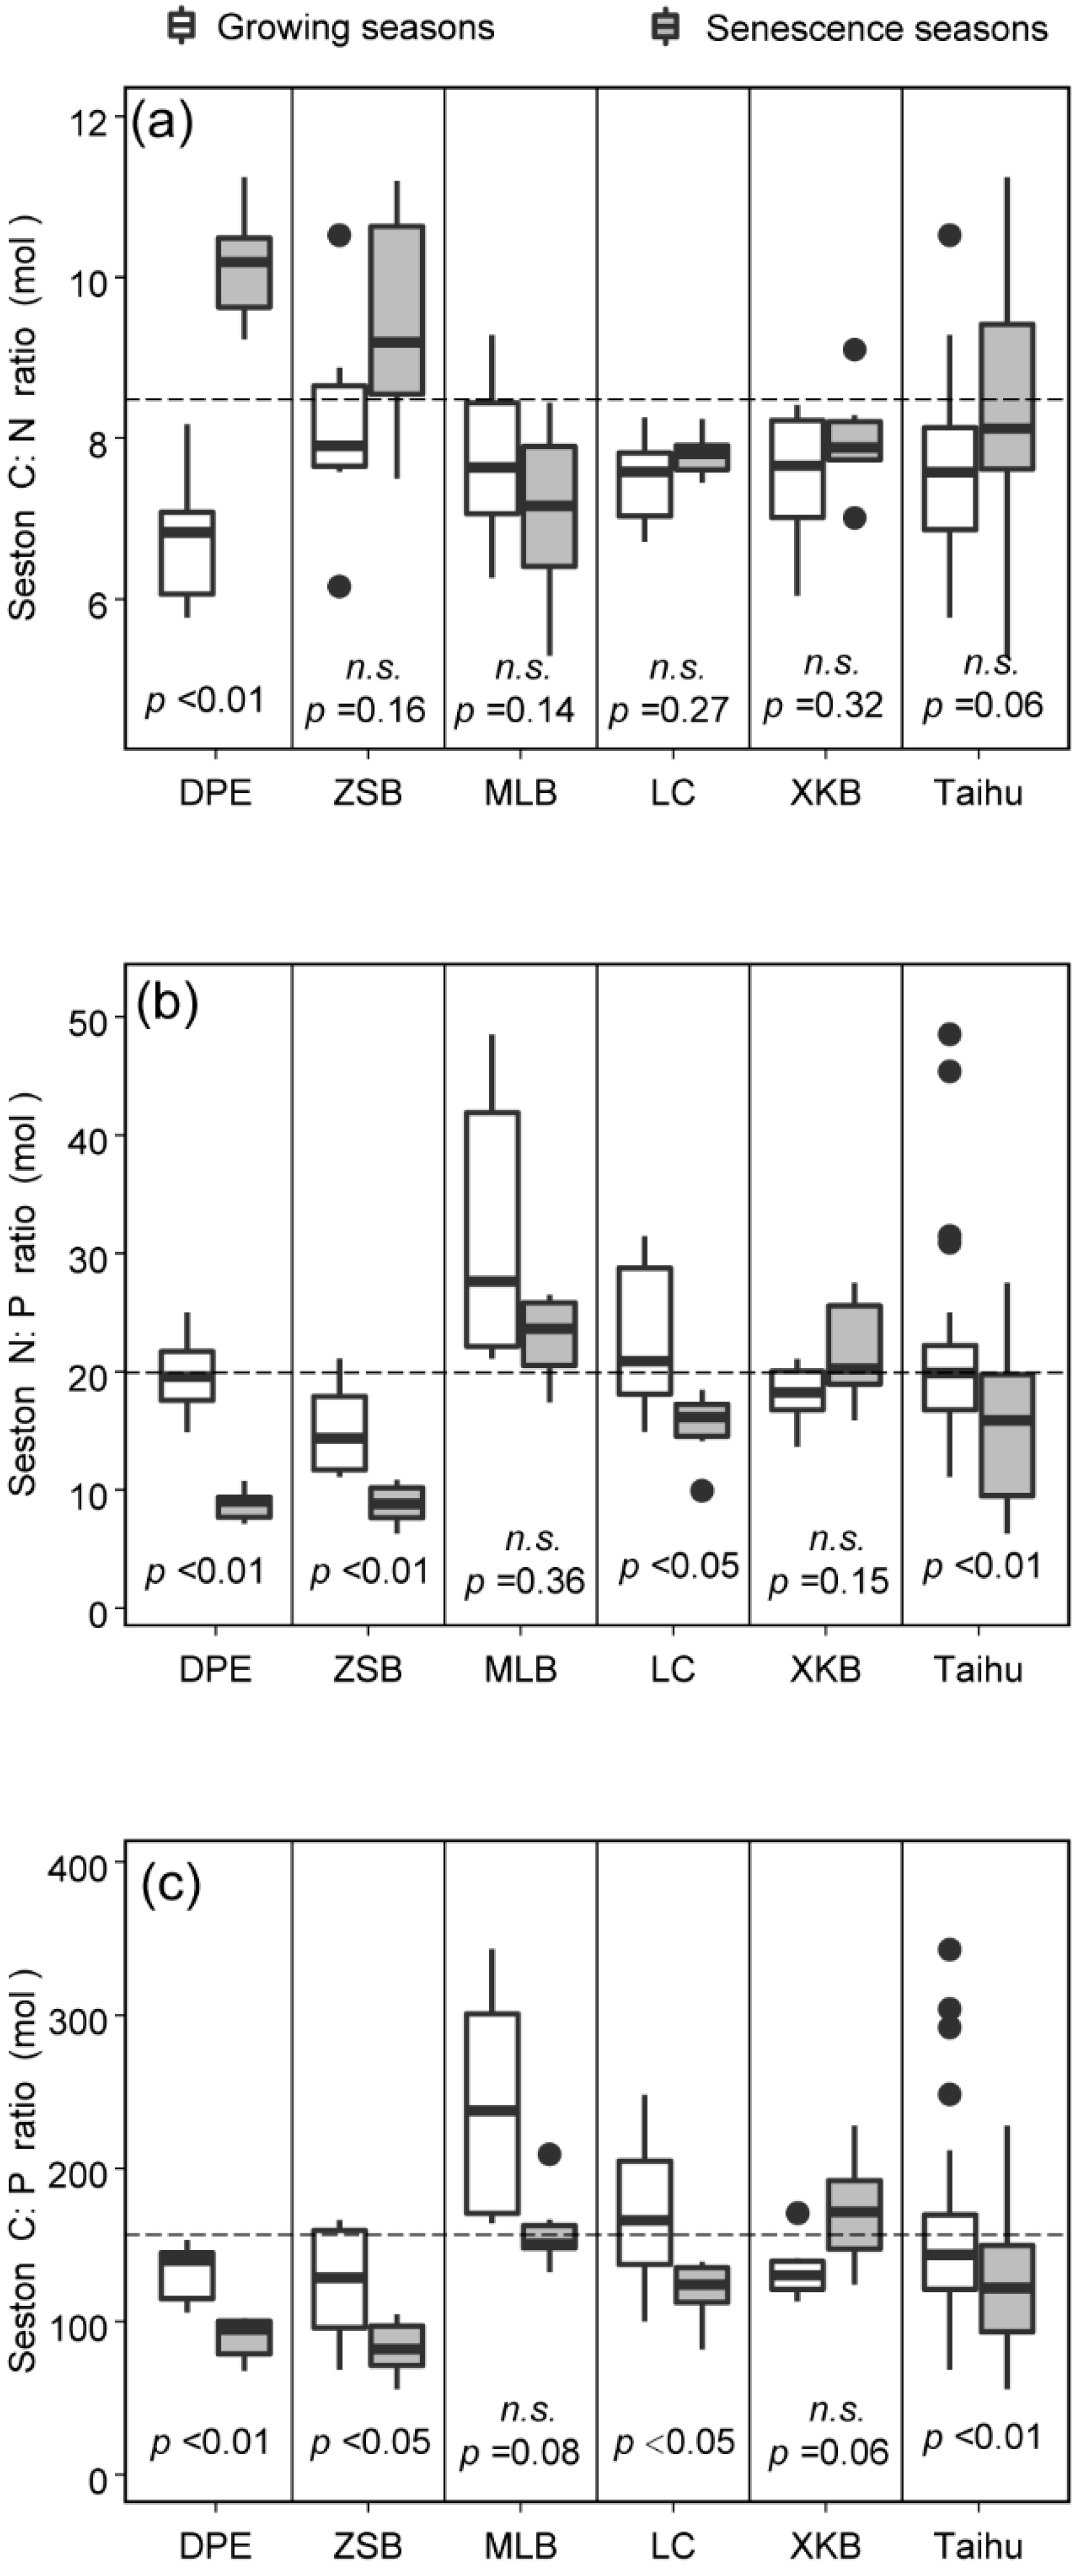
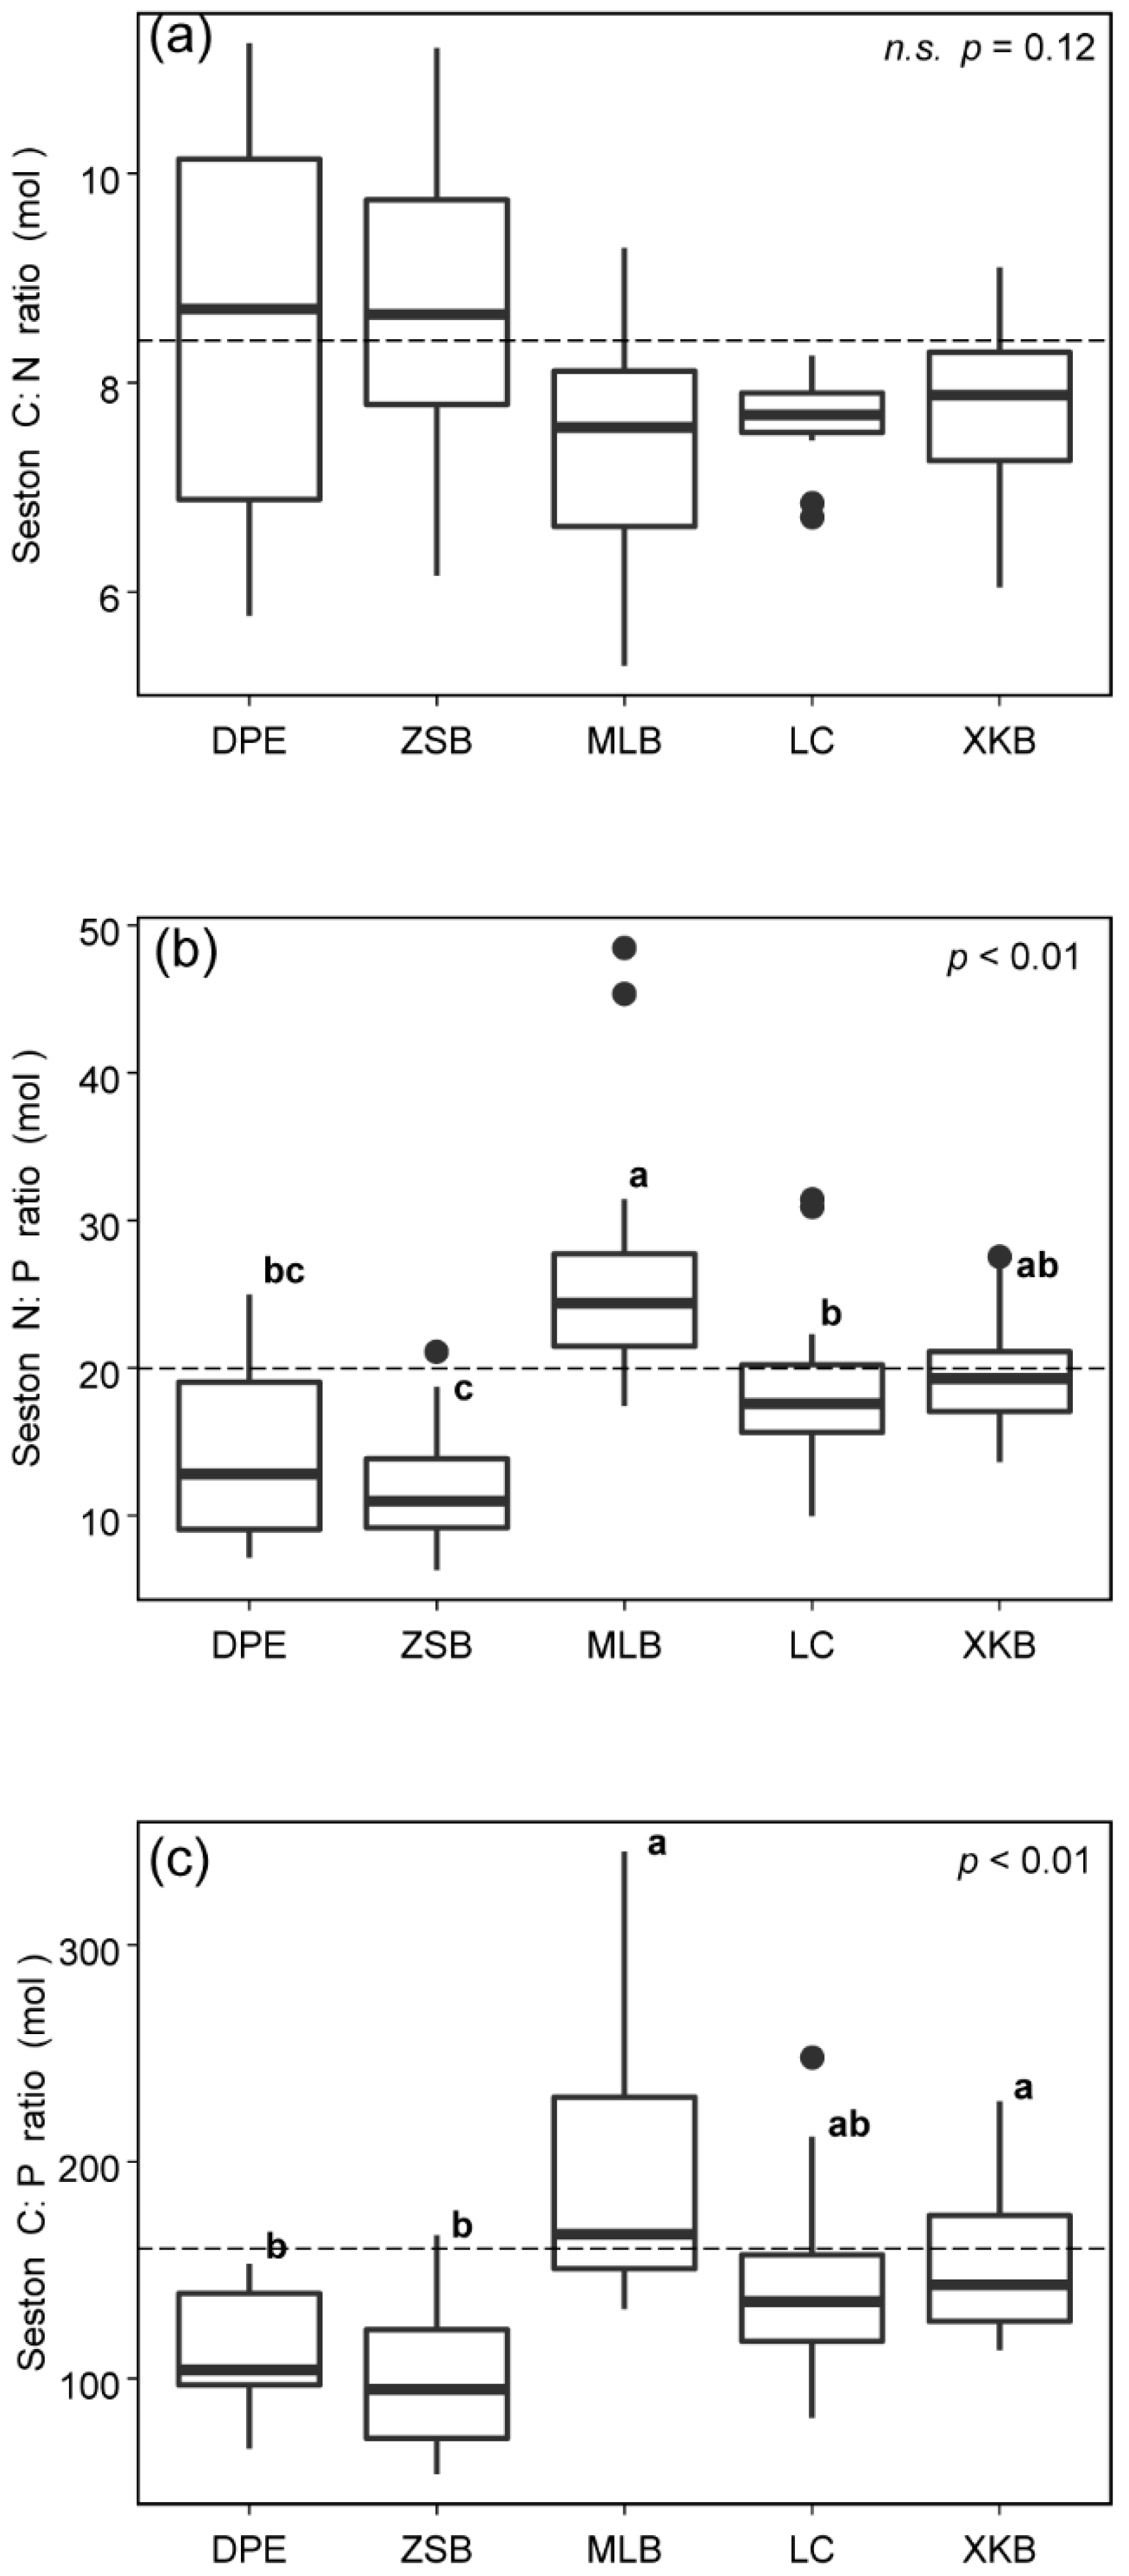
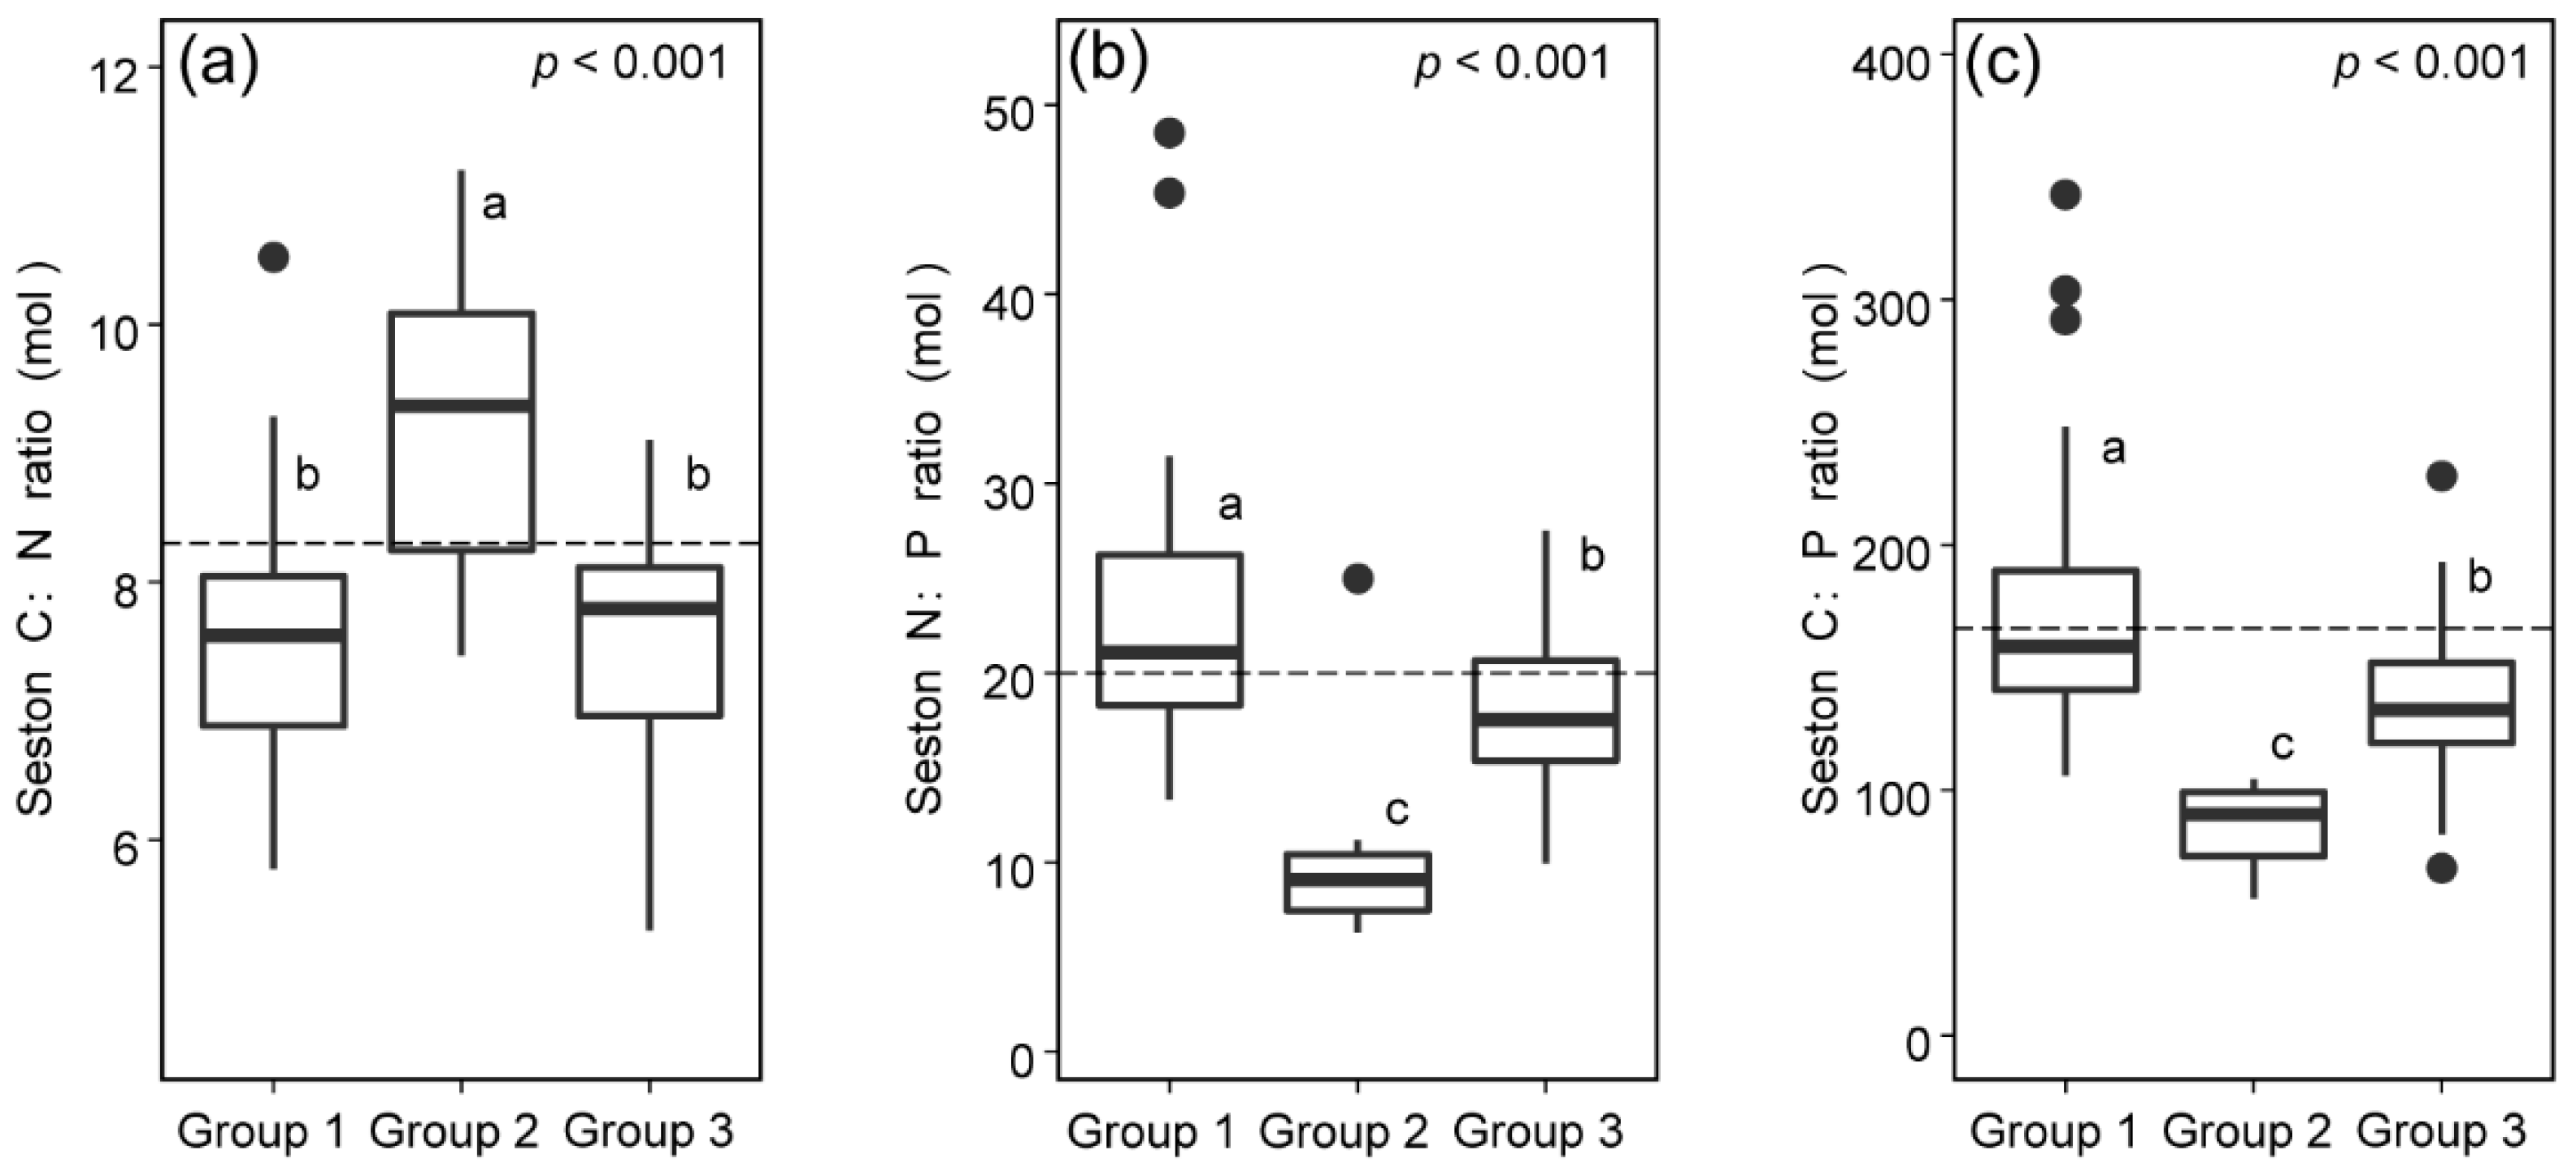
3.1. Spatiotemporal Variations in Seston C:N:P Stoichiometry

The mean value of seston C:N:P ratios is 143:19:1 across Lake Taihu (Figure 2). Seston N:P and C:P ratios ranged widely with a coefficient of variation (CV) of 44% and 40%, respectively, whereas C:N ratios varied the least (CV = 11%) throughout this investigation. Strong effects of season on N:P and C:P ratios were shown across Lake Taihu (Figure 2b,c). Specifically, Seston C:P and N:P ratios in DPE, ZSB, and LC significantly different between season. Their mean ratios were higher in the growing season than the senescence season. Seston C:P and N:P ratios in MLB also showed similar decreasing tendencies but were not statistically different. In contrast, although mean seston C:N ratios in DPE increased significantly from senescence season to growing season, C:N ratios did not differ significantly within other sites or entire lake datasets (Figure 2a).
Spatially, the lowest C:N ratios could be observed in MLB (mean = 7.4), the values did not differ significantly between different locations (Figure 3a). In contrast, the mean N:P and C:P ratios differed systematically across Lake Taihu (Figure 3b,c). Both C:P and N:P ratios were highest at MLB (means = 178.5 and 27.4, respectively) and generally lower at estuary sites. The seston stoichiometric ratios were not significantly different between LC and XKB. Although the lowest C:N ratios could be observed in MLB (mean = 7.4), the values did not differ significantly between different locations. In contrast, the mean N:P and C:P ratios differed systematically across Lake Taihu. Both C:P and N:P ratios were highest at MLB (means = 178.5 and 27.4, respectively) and generally lower at estuary sites. The seston stoichiometric ratios were not significantly different between LC and XKB. Furthermore, ANOVA indicated that the interaction effect of site and season was significant on all three ratios (Table 2). The N:P and C:P ratios in estuary sites were significantly lower than those of other areas during the senescence season (Figure S1). In contrast, the C:N ratios in estuary sites were significantly higher than those of other sites during this period. (Figure S1).

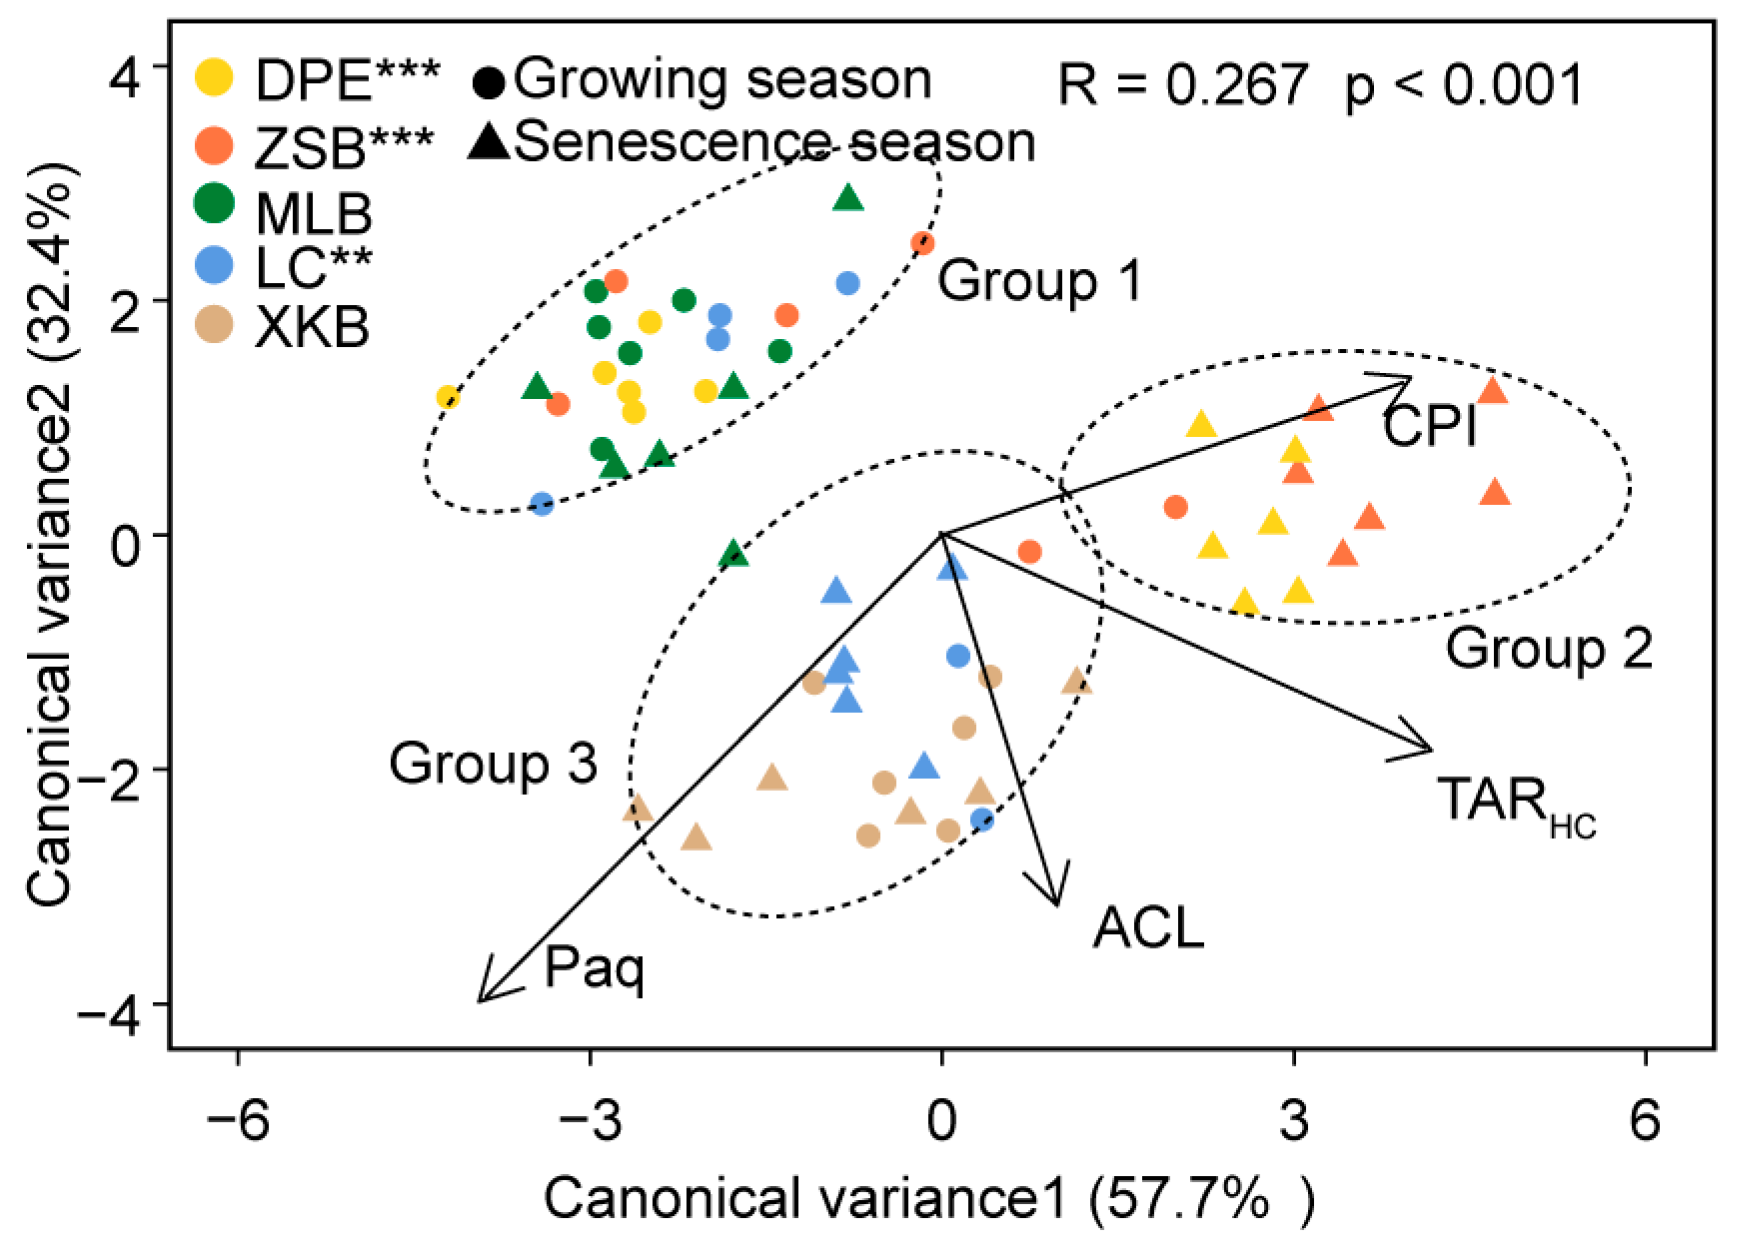
3.2. Discriminate Analysis of n-Alkane Proxies

FDA was conducted to investigate the spatiotemporal patterns of four n-alkane proxies and discriminate different sources. The first two canonical variances could already explain 90.1% of the total variance, and the other canonical variances were not shown (Figure 4). Basing on FDA analysis, the sources of seston in Lake Taihu could be generally classified into three groups. ANOSIM results indicated that the n-alkane proxies significantly differ between each group (Table 3). Group 1 (n = 23) was characterized as the lowest ACL (20.71) and TARHC (0.53), including most samples from MLB, DPE, ZSB, and LC during the growing season. Group 2 (n = 13) was characterized by the highest ACL (27.1), TARHC (11.34), CPI (3.26), and lowest Paq values (0.27), including most samples from DPE and ZSB during the senescence season. Similar to Group 2, Group 3 (n = 24) was also characterized by high ACL (26.5), TARHC (10.2), but its Paq value (0.44) was the highest. All samples from XKB and part of the samples in LC during the senescence season were classified in Group 3. Remarkably, the multivariate n-alkane proxies were significantly different between growing and senescence seasons in Lake Taihu (ANOSIM, R = 0.267, p < 0.001). Furthermore, the seasonal differences were statically significant in DPE, ZSB, and LC (Figure 4). However, the n-alkane proxies did not significantly change between different seasons in MLB and XKB.

3.3. C:N:P Stoichiometric Ratios of Seston from Different Sources

Statistically, C:N, N:P, and C:P ratios are significantly different (Kruskal–Wallis test, p < 0.001) between different potential sources (Figure 5). The mean C:N value (9.03) of Group 2 is significantly higher than Group 1 (7.59) and Group 3 (7.51) (Figure 5a). On the contrary, the mean values of N:P (8.61) and C:P (86.91) ratios from Group 2 are significantly lower than those ratios (N:P = 23.67, C:P = 176.97) of Group 1 and Group 3 (N:P = 18.51, C:P = 138.61), while the differences between Group 1 and Group 3 are also significant (Figure 5b,c). Furthermore, the variations of N:P and C:P ratios from Group 1 (CV = 37% and 35%, respectively) are greater than those of Group 2 (CV = 18% and 18%, respectively) and Group 3 (CV = 24% and 26%, respectively).

3.4. PLSR Analysis

Three PLSR analyses were conducted using only the eight environmental variables sub-datasets, including T, DOC, Chl a, TSS, TDN, TDP, NH 4   + , and PO 4 3   (Table S1) for predicting each stoichiometric ratio (Figure 6a–c). In order to demonstrate the importance of considering the seston source for predicting stoichiometric ratios, another three PLSR models were conducted using the combination of these environmental variables with the n-alkane proxies described above (Figure 6d–f). Table 4 shows the performance produced by these models for both calibration and cross-validation. After adding n-alkane proxies, the accuracies of PLSR models for C:N, N:P, and C:P ratios increased, although the performance of PLSR models for C:N ratios were still low (Table 4). In contrast, the PLSR models based on complete datasets showed high accuracies for N:P and C:P. According to VIP scores, TARHC, ACL, and Paq were important predictors in PLSR models for N:P and C:P ratios (Figure 6). Furthermore, PO 4 3   and TDP concentrations were also important factors in these PLSR models.

4. Discussion

As expected for most inland waters, the average value of the C:N:P ratio of 143:19:1 across Lake Taihu was close to the modified ratio of 166:20:1 from global lakes’ datasets [7]. This ratio was also concomitant with a previous survey [20], which suggested that the seston stoichiometric ratios were interannually stable but interannually variable in Lake Taihu. In general, the seston N:P and C:P ratios varied more widely than C:N ratios, which is a common pattern within freshwater ecosystems [7,9,41]. As we expected, n-alkane proxies indicated that the origins of seston across Lake Taihu were diverse and spatiotemporally changing. These source indicators were important factors for predicting seston stoichiometric ratios in PLSR models. Adding n-alkane proxies increased the predictive power of the PLSR models considerably. These results statistically supported our hypothesis that the seston sources are important factors in shaping the spatiotemporal pattern of the seston stoichiometric ratios in Lake Taihu.

4.1. Application of Multiple n-Alkane Proxies as Complementary Source Indicators

Among stoichiometric studies, n-alkanes are rarely used to identify the seston source. The C:N ratios are widely used to basically distinguish the terrestrial and algal sources because the C:N ratios of algal origin ranged from 5 to 9 and those of terrestrial origins are normally higher than 15 [19]. However, as we mentioned above, these thresholds could be confounded by many factors during the degradation and transportation process of seston [23,24,25]. Overall, the mean value of C:N ratios in Lake Taihu was 7.53, suggesting that algal dominated the seston pool according to the empirical thresholds. Although the C:N ratios were much higher in the estuary sites during the senescence season, the mean value (9.23) was closer to algal signatures than terrestrial signatures in the literature. The homogeneity of C:N ratios has led to an underappreciation of the influence of terrestrial sources on the stoichiometric variation in Lake Taihu and possibly other freshwaters [20].
In this study, the FDA and ANOSIM analyses of n-alkane proxies indicate there are at least three distinct seston groups in Lake Taihu (Figure 4). Group 1 exhibited low ACL and TARHC (Table 2) that fell within ranges reported for algal sources (Table 1). This, along with the known cyanobacteria blooms in Lake Taihu [52], suggested that most of the seston in MLB, DPE, ZSB, and LC during the growing season were dominated by algal-derived materials. The high average Chl a concentrations in these sites (MLB = 264.06 μg/L, DPE = 322.79 μg/L, ZEB = 173.10 μg/L, LC = 46.8 μg/L) during the growing season strongly supported our inference. Noticeably, the majority of the seston pool in MLB were classified into this group even during the senescence season. This result coincides with the persistent cyanobacterial blooms in MLB, even in the winter, when the temperature is below 10 °C [53]. Both Group 2 and Group 3 exhibited high ACL and TARHC, which are strong signals of terrestrial materials. However, the relative higher Paq value in Group 3 indicated alternative sources of middle-chain alkanes, such as macrophytes or phytoplankton [32]. Furthermore, the relatively lower CPI values in Group 3 indicated strong effects of diagenesis process on seston [19]. The intensive wind-wave disturbance in LC could provide sufficient dissolved oxygen, which accelerates the diagenesis process of resuspended sediments. Thus, most of the seston in LC were classified into Group 3 during the senescence season when the algal biomass decreased. However, it is unexpected that samples of XKB were also classified into the same group, as it is known that macrophytes could stabilize the benthic sediments during the growing season. We proposed that the seston in XKB are resuspended sediments, which may be transported from the open-water area. It could also explain the lack of significant seasonal changes in this system. Hence, we suggest that the seston of Group 3 were mixtures of terrestrial, macrophytes, and few algal materials that were formed by the frequent wind-induced mixing process. Although the seston in Group 2 exhibited a low Paq value and high CPI, which indicated they are terrestrial origins, their mean CPI value (3.26) was still lower than the threshold in the literature for typical terrestrial plants (CPI > 5) [37]. This inconsistency suggests that the seston in estuary sites during the senescence season were not fresh materials from terrestrial plants. These sestons have been reworked by microbes and maybe from erosion soils [29]. Yet the precise composition of different sources in the seston pool could not be fully resolved by n-alkane proxies alone. Nevertheless, this study supports the utility of multiple-combined n-alkane proxies in addition to simple C:N ratios to get more robust source information in complicated freshwater ecosystems.

4.2. Spatiotemporal Variations in Stoichiometric Ratios Corresponded with Changes in Seston Sources

Consistent with other eutrophic lakes, there are significant seasonal changes with lower ratios of N:P and C:P during the senescence season and higher ratios in the growing season [20,41]. Apart from the estimation of the source, previous studies used to attribute the pronounced seasonal shifts in seston C:P ratios to a “growth by dilution” hypothesis in eutrophic lakes [8], or some researches explained these shifts by the changes of communities species [20] because diatoms have low cellular C:P ratios than cyanobacteria. However, as illustrated above, these hypotheses only dominate under certain circumstances in which seston is consistently dominated by algal origins. It is clear that there are decreasing trends of algal derived seston from the growing season to senescence season in most sampling sites across Lake Taihu, especially in DPE, ZSB, and LC (Figure 4). This implies the overall seasonal change in stoichiometric ratios may be caused by the synchronous change of seston sources.
The C:P and N:P ratios of algal dominated seston are significantly higher than those of non-algal dominated seston, especially much higher than the terrestrial-dominated seston from estuary sites (Figure 5). These results indicated that the shift from algal materials to non-algal materials likely explained the decreased particulate C:P ratios and N:P ratios from the senescence season to growing season. This hypothesis was supported by significant correlations between these ratios and source indicators (ACL and TARHC) (Figure S2). Similarly, the VIP scores in PLSR models also suggested that ACL and TARHC are important for predicting ratios. Normally, the typical terrestrial stoichiometric ratios tend to be higher than the algal biomass due to a higher content of structural carbohydrates and lignin [6]. However, the C:P ratios and N:P ratios of terrestrial sources in Lake Taihu were lower on average than those of algal sources but fell within ranges reported for urbanized and agricultural watersheds [54,55]. The similar low ratios were also observed in Lake Erie watersheds, where agricultural activities were intensive [41]. The relatively lower C:P ratios and N:P ratios in seston could result from significant inputs of inorganic P associated with erosional soils from agriculture-rich catchments surrounding Lake Taihu [38,56].
The low C:P and N:P ratios of terrestrial-dominated seston were fingerprinted in the seston of LC during the senescence season, resulting in similar seasonal pattern changes in LC to estuary sites. However, the increased contribution of macrophyte-derived materials would also increase the ratios because macrophytes mostly have higher ratios than the agricultural soil [57]. Therefore, the seston from mixed sources exhibited significantly higher ratios than seston dominated by terrestrial materials (Figure 5). Accordingly, the increasing trends in XKB from the growing season to the senescence season indicated that macrophytes’ detritus contributed more during the senescence season when some macrophytes were fading. The positive correlations between Paq with N:P and C:P ratios in the Group 3 seston pool also supported this inference. Moreover, these source-specific ratios also explain why the estuary sites exhibited significantly lower N:P and C:P ratios than other areas during the senescence season (Figure S1).

4.3. The Role of Phosphorus in Influencing the Seston Stoichiometric Ratios

Obviously, there are considerable variations in stoichiometric ratios within each seston source (Figure 5). Particularly, these variations in algal-dominated seston were greater than other seston sources (Figure 5). For example, there are large variations within MLB during the growing season, even though all these sestons were dominated by algal sources (Figure S1). These results imply that other potential factors would influence the spatiotemporal variation in stoichiometric ratios. PLSR models indicated that TDP levels were as important as source indicators for predicting C:P and N:P ratios (Figure 6). Many studies argue that the dynamics of sestonic phosphorus are largely responsible for systematic changes in C:P and N:P ratios and influenced by dissolved phosphorus concentrations [7,18,22,41]. These arguments were supported by significant negative correlations between PP and C:P/N:P ratios (Figure S2), as well as the significantly positive correlations between PP and TDP concentrations in this study (Figure S3).
It is not surprising that algal seston exhibited low PP contents when ambient TDP was relative low (TDP ≈ 0.02 mg/L) (Figure S3), which suggested that the algal growth may be limited by phosphorus [9]. Although there are high dissolved-phosphate concentrations on average in Lake Taihu, the bioavailable phosphorus could be quickly consumed and be deficient during serious algal blooming events. Previous mesocosm bioassays showed phosphorus limitation could appear in different locations in Lake Taihu, even in the hypertrophic northern region (e.g., MLB) [58]. Alternatively, the luxury P-uptake by algal cells may be another reason for the tied correlations between PP and TDP in algal seston. Algal can excessively uptake phosphorus when it is surplus, even though algal cells are not P-limited. Recently, a nutrient addition experiment illustrated significant elevations of algal cellular P contents and synchronous decreases of C:P/N:P ratios when excessive dissolved phosphorus was added into systems [59]. The excessive P-uptake mechanism could also explain the outstanding higher maximum PP concentrations and greater variations in stoichiometric ratios in algal dominated seston than other seston sources.
Interestingly, similar positive relationships were shown between TDP and PP within non-algal dominated seston. Different from algal dominated seston, the adsorption and desorption process of phosphorus on the mineral of terrestrial seston could be one reason for the coupling relationship [60]. However, the maximum adsorption quantities of P to non-algal dominated seston would be limited by the physiochemical characteristics of these particles, especially in those sestons that already contained high P contents and might have been partially P-saturated. This deduction was in accordance with the significant but weaker correlation between TDP and PP in terrestrial-dominated seston directly from agriculture watersheds (Figure S3). Accordingly, the limited P-uptake in these sestons could be partly responsible for the smaller variations in stoichiometric ratios. Furthermore, the attached microbial communities have the capacity to use the seston organic phosphorus as well as inorganic phosphorus, which is partly regulated by the dissolved phosphorus as well [61]. More accurate data on the different fractions of dissolved and particulate phosphorus are needed to distinguish between these mechanisms. Nevertheless, this study highlights that P-uptake processes could play an important role in seston stoichiometry variation, and could, therefore, play an important role in biogeochemical C:N:P processing, which would differ substantially based upon predominant P-sources in different types of lakes.

5. Conclusions

To summarize, this study points out the importance of estimation of seston sources in order to make a correct explanation underlining the spatiotemporal patterns in seston C:N:P ratios. Compared with generally homogenous C:N ratios, the application of multiple-combined n-alkane proxies provide more information on the dynamics of three distinct seston sources in Lake Taihu. Remarkably, our results indicate that the spatiotemporal changes in stoichiometric ratios can also arise due to delivery or resuspension of non-algal dominated organic matter in addition to changes in algal stoichiometry reported in other lakes. In addition, within each seston source, there are distinct P-uptake mechanisms behind the dynamics of sestonic phosphorus, which is also partly responsible for the variations in C:P and N:P ratios. These results highlight, again, that the important role of seston source has been underappreciated in most lakes, which is caused by prior subjective knowledge or applications of insensitive indicators. This study also highly recommends multiple-combined n-alkane proxies as a complementary tool in addition to C:N ratios for source estimation within freshwater ecosystems.

Supplementary Materials

The following are available online at https://www.mdpi.com/2073-4441/12/1/36/s1, Figure S1: Variations in seston stoichiometric ratio of C:N, N:P and C:P across different sites across Lake Taihu during the growing season (a–c) and senescence season (d–f)., Figure S2: Pearson correlation heatmap of variables and stoichiometric ratios in different seston sources. Figure S3: Liner relationship between TDP and PP in different seston sources. Table S1: Annual summary of variables collected across different sites in Lake Taihu.

Author Contributions

J.C. conceived the conceptualization and collected the experiment data; G.G., K.S. and X.T. supervised the research; J.C. and C.B. analyzed the data and draw the figures. J.C. wrote the manuscript. Y.H., X.J. and J.D. helped with the data interpretation. All authors have read and agreed to the published version of the manuscript.

Funding

This study was funded by National Natural Science Foundation of China (No. 41571462), the “One-Three-Five” Strategic Planning of Nanjing Institute of Geography and Limnology, CAS (No. NIGLAS2017GH05), and the Key Research Program of Frontier Sciences, CAS (No. QYZDJ­SSW­DQC008).

Acknowledgments

We thank Jingchen Xue, Yilan Liu, and all the staff from Taihu Laboratory for Lake Ecosystem Research for help with sample collections and analyses. The authors are grateful to the three anonymous reviewers for their constructive comments and suggestions.

Conflicts of Interest

The authors declare that they have no competing interests.

References

  1. Heuer, H.; Smalla, K. Manure and sulfadiazine synergistically increased bacterial antibiotic resistance in soil over at least two months. Environ. Microbiol. 2007, 9, 657–666. [Google Scholar] [CrossRef] [PubMed]
  2. Demi, L.M.; Benstead, J.P.; Rosemond, A.D.; Maerz, J.C. Experimental N and P additions alter stream macroinvertebrate community composition via taxon-level responses to shifts in detrital resource stoichiometry. Funct. Ecol. 2019, 33, 855–867. [Google Scholar] [CrossRef]
  3. He, H.; Han, Y.; Li, Q.; Jeppesen, E.; Li, K.; Yu, J.; Liu, Z. Crucian carp (Carassius carassius) strongly affect C/N/P stoichiometry of suspended particulate matter in shallow warm water eutrophic lakes. Water 2019, 11, 524. [Google Scholar] [CrossRef] [Green Version]
  4. Redfield, A. The biological control of the chemical factors in the enviroment. Am. Sci. 1958, 46, 205–221. [Google Scholar]
  5. Hecky, R.E.; Campbell, P.; Hendzel, L.L. The stoichiometry of carbon, nitrogen, and phosphorus in particulate matter of lakes and oceans. Limnol. Oceanogr. 1993, 38, 709–724. [Google Scholar] [CrossRef]
  6. Elser, J.J.; Fagan, W.F.; Denno, R.F.; Dobberfuhl, D.R.; Folarin, A.; Huberty, A.; Interlandi, S.; Kilham, S.S.; McCauley, E.; Schulz, K.L.; et al. Nutritional constraints in terrestrial and freshwater food webs. Nature 2000, 408, 578–580. [Google Scholar] [CrossRef]
  7. Sterner, R.W.; Andersen, T.; Elser, J.J.; Hessen, D.O.; Hood, J.M.; McCauley, E.; Urabe, J. Scale-dependent carbon:nitrogen:phosphorus seston stoichiometry in marine and freshwaters. Limnol. Oceanogr. 2008, 53, 1169–1180. [Google Scholar] [CrossRef]
  8. Hessen, D.O.; van Donk, E.; Gulati, R. Seasonal seston stoichiometry: Effects on zooplankton in cyanobacteria-dominated lakes. J. Plankton Res. 2005, 27, 449–460. [Google Scholar] [CrossRef]
  9. Hessen, D.O.; Andersen, T.; Brettum, P.; Faafeng, B.A. Phytoplankton contribution to sestonic mass and elemental ratios in lakes: Implications for zooplankton nutrition. Limnol. Oceanogr. 2003, 48, 1289–1296. [Google Scholar] [CrossRef]
  10. Martiny, A.C.; Pham, C.T.A.; Primeau, F.W.; Vrugt, J.A.; Moore, J.K.; Levin, S.A.; Lomas, M.W. Strong latitudinal patterns in the elemental ratios of marine plankton and organic matter. Nat. Geosci. 2013, 6, 279–283. [Google Scholar] [CrossRef]
  11. They, N.H.; Amado, A.M.; Cotner, J.B. Redfield Ratios in Inland Waters: Higher Biological Control of C:N:P Ratios in Tropical Semi-arid High Water Residence Time Lakes. Front. Microbiol. 2017, 8, 1505. [Google Scholar] [CrossRef] [PubMed] [Green Version]
  12. Omta, A.W.; Bruggeman, J.; Kooijman, S.A.L.M.; Dijkstra, H.A. Biological carbon pump revisited: Feedback mechanisms between climate and the Redfield ratio. Geophys. Res. Lett. 2006, 33, L14613. [Google Scholar] [CrossRef] [Green Version]
  13. Wilkinson, G.M.; Pace, M.L.; Cole, J.J. Terrestrial dominance of organic matter in north temperate lakes. Glob. Biogeochem. Cycles 2013, 27, 43–51. [Google Scholar] [CrossRef]
  14. Dong, X.; Anderson, N.J.; Yang, X.; Chen, X.; Shen, J. Carbon burial by shallow lakes on the Yangtze floodplain and its relevance to regional carbon sequestration. Glob. Chang. Biol. 2012, 18, 2205–2217. [Google Scholar] [CrossRef]
  15. Zhou, Y.; Yao, X.; Zhang, Y.; Zhang, Y.; Shi, K.; Tang, X.; Qin, B.; Podgorski, D.C.; Brookes, J.D.; Jeppesen, E. Response of dissolved organic matter optical properties to net inflow runoff in a large fluvial plain lake and the connecting channels. Sci. Total Environ. 2018, 639, 876–887. [Google Scholar] [CrossRef]
  16. Xu, X.; Li, W.; Fujibayashi, M.; Nomura, M.; Nishimura, O.; Li, X. Predominance of terrestrial organic matter in sediments from a cyanobacteria- blooming hypereutrophic lake. Ecol. Indic. 2015, 50, 35–43. [Google Scholar] [CrossRef]
  17. Zhang, Y.; Jeppesen, E.; Liu, X.; Qin, B.; Shi, K.; Zhou, Y.; Thomaz, S.M.; Deng, J. Global loss of aquatic vegetation in lakes. Earth Sci. Rev. 2017, 173, 259–265. [Google Scholar] [CrossRef]
  18. Hessen, D.O. Determinants of seston C:P-ratio in lakes. Freshw. Biol. 2006, 51, 1560–1569. [Google Scholar] [CrossRef]
  19. Meyers, P.A.; Ishiwatari, R. Lacustrine organic geochemistry—An overview of indicators of organic matter sources and diagenesis in lake sediments. Org. Geochem. 1993, 20, 867–900. [Google Scholar] [CrossRef] [Green Version]
  20. Shi, L.; Huang, Y.; Lu, Y.; Chen, F.; Zhang, M.; Yu, Y.; Kong, F. Stocks and dynamics of particulate and dissolved organic matter in a large, shallow eutrophic lake (Taihu, China) with dense cyanobacterial blooms. J. Oceanol. Limnol. 2018, 36, 738–749. [Google Scholar] [CrossRef]
  21. Erga, S.R.; Haugen, S.B.; Bratbak, G.; Egge, J.K.; Heldal, M.; Mork, K.A.; Norland, S. Seasonal variations in C:N:Si:Ca:P:Mg:S:K:Fe relationships of seston from Norwegian coastal water: Impact of extreme offshore forcing during winter-spring 2010. Mar. Chem. 2017, 196, 1–12. [Google Scholar] [CrossRef] [PubMed]
  22. Frigstad, H.; Andersen, T.; Hessen, D.O.; Naustvoll, L.J.; Johnsen, T.M.; Bellerby, R.G.J. Seasonal variation in marine C:N:P stoichiometry: Can the composition of seston explain stable Redfield ratios? Biogeosciences 2011, 8, 2917–2933. [Google Scholar] [CrossRef] [Green Version]
  23. Guo, W.; Ye, F.; Xu, S.; Jia, G. Seasonal variation in sources and processing of particulate organic carbon in the Pearl River estuary, South China. Estuar. Coast. Shelf Sci. 2015, 167, 540–548. [Google Scholar] [CrossRef]
  24. Tipping, E.; Somerville, C.J.; Luster, J. The C:N:P:S stoichiometry of soil organic matter. Biogeochemistry 2016, 130, 117–131. [Google Scholar] [CrossRef] [Green Version]
  25. Müller, P.J. C N ratios in Pacific deep-sea sediments: Effect of inorganic ammonium and organic nitrogen compounds sorbed by clays. Geochim. Cosmochim. Acta 1977, 41, 765–776. [Google Scholar] [CrossRef]
  26. Hesselsoe, M.; Füreder, S.; Schloter, M.; Bodrossy, L.; Iversen, N.; Roslev, P.; Nielsen, P.H.; Wagner, M.; Loy, A. Isotope array analysis of Rhodocyclales uncovers functional redundancy and versatility in an activated sludge. ISME J. 2009, 3, 1349–1364. [Google Scholar] [CrossRef]
  27. Sampei, Y.; Matsumoto, E. C/N ratios in a sediment core from Nakaumi Lagoon, southwest Japan—Usefulness as an organic source indicator—. Geochem. J. 2001, 35, 189–205. [Google Scholar] [CrossRef]
  28. Fang, J.; Wu, F.; Xiong, Y.; Li, F.; Du, X.; An, D.; Wang, L. Source characterization of sedimentary organic matter using molecular and stable carbon isotopic composition of n-alkanes and fatty acids in sediment core from Lake Dianchi, China. Sci. Total Environ. 2014, 473, 410–421. [Google Scholar] [CrossRef]
  29. Xu, F.L.; Yang, C.; He, W.; He, Q.S.; Li, Y.L.; Kang, L.; Liu, W.X.; Xiong, Y.Q.; Xing, B. Bias and association of sediment organic matter source apportionment indicators: A case study in a eutrophic Lake Chaohu, China. Sci. Total Environ. 2017, 581–582, 874–884. [Google Scholar] [CrossRef] [Green Version]
  30. Meyers, P.A. Organic geochemical proxies of paleoceanographic, paleolimnologic, and paleoclimatic processes. Org. Geochem. 1997, 27, 213–250. [Google Scholar] [CrossRef]
  31. Ficken, K.; Li, B.; Swain, D.; Eglinton, G. An n-alkane proxy for the sedimentary input of submerged/floating freshwater aquatic macrophytes. Org. Geochem. 2000, 31, 745–749. [Google Scholar] [CrossRef]
  32. Zhang, Y.; Su, Y.; Liu, Z.; Yu, J.; Jin, M. Lipid biomarker evidence for determining the origin and distribution of organic matter in surface sediments of Lake Taihu, Eastern China. Ecol. Indic. 2017, 77, 397–408. [Google Scholar] [CrossRef]
  33. Silliman, J.E.; Meyers, P.A.; Bourbonniere, R.A. Record of postglacial organic matter delivery and burial in sediments of Lake Ontario. Org. Geochem. 1996, 24, 463–472. [Google Scholar] [CrossRef]
  34. Routh, J.; Hugelius, G.; Kuhry, P.; Filley, T.; Tillman, P.K.; Becher, M.; Crill, P. Multi-proxy study of soil organic matter dynamics in permafrost peat deposits reveal vulnerability to climate change in the European Russian Arctic. Chem. Geol. 2014, 368, 104–117. [Google Scholar] [CrossRef] [Green Version]
  35. Zheng, Y.; Zhou, W.; Meyers, P.A.; Xie, S. Lipid biomarkers in the Zoigê-Hongyuan peat deposit: Indicators of Holocene climate changes in West China. Org. Geochem. 2007, 38, 1927–1940. [Google Scholar] [CrossRef]
  36. Tareq, S.M.; Tanoue, E.; Tsuji, H.; Tanaka, N.; Ohta, K. Hydrocarbon and elemental carbon signatures in a tropical wetland: Biogeochemical evidence of forest fire and vegetation changes. Chemosphere 2005, 59, 1655–1665. [Google Scholar] [CrossRef]
  37. Derrien, M.; Yang, L.; Hur, J. Lipid biomarkers and spectroscopic indices for identifying organic matter sources in aquatic environments: A review. Water Res. 2017, 112, 58–71. [Google Scholar] [CrossRef]
  38. Qin, B.; Xu, P.; Wu, Q.; Luo, L.; Zhang, Y. Environmental issues of Lake Taihu, China. Hydrobiologia 2007, 581, 3–14. [Google Scholar] [CrossRef]
  39. Tang, X.; Krausfeldt, L.E.; Shao, K.; Lecleir, G.R.; Stough, J.M.A.; Gao, G.; Boyer, G.L.; Zhang, Y.; Paerl, H.W.; Qin, B.; et al. Seasonal Gene Expression and the Ecophysiological Implications of Toxic Microcystis aeruginosa Blooms in Lake Taihu. Environ. Sci. Technol. 2018, 52, 11049–11059. [Google Scholar] [CrossRef]
  40. Zhang, Y.; Yao, X.; Qin, B. A critical review of the development, current hotspots, and future directions of Lake Taihu research from the bibliometrics perspective. Environ. Sci. Pollut. Res. 2016, 23, 12811–12821. [Google Scholar] [CrossRef] [Green Version]
  41. Prater, C.; Frost, P.C.; Howell, E.T.; Watson, S.B.; Zastepa, A.; King, S.S.E.; Vogt, R.J.; Xenopoulos, M.A. Variation in particulate C : N : P stoichiometry across the Lake Erie watershed from tributaries to its outflow. Limnol. Oceanogr. 2017, 62, S194–S206. [Google Scholar] [CrossRef] [Green Version]
  42. Zhang, Y.; Shi, K.; Liu, X.; Zhou, Y.; Qin, B. Lake topography and wind waves determining seasonal-spatial dynamics of total suspended matter in turbid Lake Taihu, China: Assessment using long-term high-resolution MERIS data. PLoS ONE 2014, 9, e98055. [Google Scholar] [CrossRef] [PubMed]
  43. Qin, B.; Yang, G.; Ma, J.; Wu, T.; Li, W.; Liu, L.; Deng, J.; Zhou, J. Spatiotemporal Changes of Cyanobacterial Bloom in Large Shallow Eutrophic Lake Taihu, China. Front. Microbiol. 2018, 9, 451. [Google Scholar] [CrossRef] [PubMed]
  44. Cai, J.; Bai, C.; Tang, X.; Dai, J.; Gong, Y.; Hu, Y.; Shao, K.; Zhou, L.; Gao, G. Characterization of bacterial and microbial eukaryotic communities associated with an ephemeral hypoxia event in Taihu Lake, a shallow eutrophic Chinese lake. Environ. Sci. Pollut. Res. 2018, 25, 31543–31557. [Google Scholar] [CrossRef] [PubMed]
  45. Clescerl, L.S.; Greenberg, A.E.; Eaton, A.D. Standard Mehtods for the Examination of Water and Wastewater, 20th ed.; America Public Health Association: Washington, DC, USA, 1999. [Google Scholar]
  46. He, Y.; Zheng, Y.; Pan, A.; Zhao, C.; Sun, Y.; Song, M.; Zheng, Z.; Liu, Z. Biomarker-based reconstructions of Holocene lake-level changes at Lake Gahai on the northeastern Tibetan Plateau. Holocene 2014, 24, 405–412. [Google Scholar] [CrossRef]
  47. Ortiz, J.E.; Moreno, L.; Torres, T.; Vegas, J.; Ruiz-Zapata, B.; García-Cortés, Á.; Galán, L.; Pérez-González, A. A 220 ka palaeoenvironmental reconstruction of the Fuentillejo maar lake record (Central Spain) using biomarker analysis. Org. Geochem. 2013, 55, 85–97. [Google Scholar] [CrossRef]
  48. Gao, G.; Zhu, G.; Qin, B.; Chen, J.; Wang, K. Alkaline phosphatase activity and the phosphorus mineralization rate of Lake Taihu. Sci. China Ser. D Earth Sci. 2006, 49, 176–185. [Google Scholar] [CrossRef]
  49. Mudge, S.M.; Duce, C.E. Identifying the source, transport path and sinks of sewage derived organic matter. Environ. Pollut. 2005, 136, 209–220. [Google Scholar] [CrossRef]
  50. Li, B.; Morris, J.; Martin, E.B. Model selection for partial least squares regression. Chemom. Intell. Lab. Syst. 2002, 64, 79–89. [Google Scholar] [CrossRef]
  51. Chong, I.G.; Jun, C.H. Performance of some variable selection methods when multicollinearity is present. Chemom. Intell. Lab. Syst. 2005, 78, 103–112. [Google Scholar] [CrossRef]
  52. Xu, H.; Paerl, H.W.; Qin, B.; Zhu, G.; Hall, N.S.; Wu, Y. Determining Critical Nutrient Thresholds Needed to Control Harmful Cyanobacterial Blooms in Eutrophic Lake Taihu, China. Environ. Sci. Technol. 2015, 49, 1051–1059. [Google Scholar] [CrossRef] [PubMed]
  53. Ma, J.; Qin, B.; Paerl, H.W.; Brookes, J.D.; Hall, N.S.; Shi, K.; Zhou, Y.; Guo, J.; Li, Z.; Xu, H.; et al. The persistence of cyanobacterial (Microcystis spp.) blooms throughout winter in Lake Taihu, China. Limnol. Oceanogr. 2016, 61, 711–722. [Google Scholar] [CrossRef] [Green Version]
  54. Veldboom, J.A.; Haro, R.J. Stoichiometric relationship between suspension-feeding caddisfly (Trichoptera: Brachycentridae) and seston. Hydrobiologia 2011, 675, 129–141. [Google Scholar] [CrossRef]
  55. Frost, P.C.; Kinsman, L.E.; Johnston, C.A.; Larson, J.H. Watershed discharge modulates relationships between landscape components and nutrient ratios in stream seston. Ecology 2009, 90, 1631–1640. [Google Scholar] [CrossRef] [PubMed]
  56. Wang, M.; Strokal, M.; Burek, P.; Kroeze, C.; Ma, L.; Janssen, A.B.G. Excess nutrient loads to Lake Taihu: Opportunities for nutrient reduction. Sci. Total Environ. 2019, 664, 865–873. [Google Scholar] [CrossRef] [PubMed]
  57. Xing, W.; Wu, H.P.; Hao, B.B.; Liu, G.H. Stoichiometric characteristics and responses of submerged macrophytes to eutrophication in lakes along the middle and lower reaches of the Yangtze River. Ecol. Eng. 2013, 54, 16–21. [Google Scholar] [CrossRef]
  58. Paerl, H.W.; Xu, H.; Hall, N.S.; Rossignol, K.L.; Joyner, A.R.; Zhu, G.; Qin, B. Nutrient limitation dynamics examined on a multi-annual scale in Lake Taihu, China: Implications for controlling eutrophication and harmful algal blooms. J. Freshw. Ecol. 2015, 30, 5–24. [Google Scholar] [CrossRef]
  59. Xu, S.; Wang, Y.; Huang, B.; Wei, Z.B.; Miao, A.J.; Yang, L.Y. Nitrogen and phosphorus limitation of phytoplankton growth in different areas of Lake Taihu, China. J. Freshw. Ecol. 2015, 30, 113–127. [Google Scholar] [CrossRef]
  60. Tang, H.; Zhao, H.; Li, Z.; Yuan, S.; Li, Q.; Ji, F.; Xiao, Y. Phosphorus sorption to suspended sediment in freshwater. Proc. Inst. Civ. Eng. Water Manag. 2017, 170, 231–242. [Google Scholar] [CrossRef]
  61. Güsewell, S.; Gessner, M.O. N:P ratios influence litter decomposition and colonization by fungi and bacteria in microcosms. Funct. Ecol. 2009, 23, 211–219. [Google Scholar] [CrossRef]
Figure 1. The map of Lake Taihu and sampling sites as illustrated.
Water 12 00036 g001
Figure 2. Temporal variations in seston stoichiometric ratio of C:N (a), N:P (b), and C:P (c) within different sub-ecotypes across Lake Taihu. Dashed reference lines show the canonical lake C:N:P ratio. The p values denote significant differences between different seasons within each site and n.s. indicates no significant differences. The boxes span the interquartile range (25% to 75%), and the median is marked by a vertical line inside the box. The whiskers extend to the most extreme data point, which is no more than 1.5 times the length of the box away from the box. The dots at the end of the boxplot represent outliers.
Water 12 00036 g002
Figure 3. Variations in seston stoichiometric ratio of C:N (a), N:P (b), and C:P (c) in different sites across Lake Taihu. Dashed reference lines show the canonical lake C:N:P ratio. Letters denote significant differences between different locations, and n.s. indicates no significant differences. The boxes span the interquartile range (25% to 75%), and the median is marked by a vertical line inside the box. The whiskers extend to the most extreme data point, which is no more than 1.5 times the length of the box away from the box. The dots at the end of the boxplot represent outliers.
Water 12 00036 g003
Figure 4. Flexible discriminate analysis (FDA) plots of n-alkane proxies of each site at different seasons. The analysis of similarity (ANOSIM) statistic R and p values of global comparison between seasons are shown on the top right. In addition, the following ** and *** symbols after each site denote the significant differences (ANOSIM) between the growing season and senescence season within each site, with p values less than 0.01 and 0.001, respectively.
Water 12 00036 g004
Figure 5. Differences and relationships between stoichiometric ratios of seston dominated by different potential sources. Dashed reference lines show the canonical lake C:N:P ratio. The general differences of each ratio between each source are shown at the top right of the corresponding figures in (ac). Letters denote significant differences between different potential sources. The boxes span the interquartile range (25% to 75%), and the median is marked by a vertical line inside the box. The whiskers extend to the most extreme data point, which is no more than 1.5 times the length of the box away from the box. The dots at the end of the boxplot represent outliers.
Water 12 00036 g005
Figure 6. Scatterplots of predictors for spatio-temporal variation of seston stoichiometric ratios in Lake Taihu with (df) and without source indicators (ac). Individual predictor weights are directly proportional to the amount of variance explained for each component. The modeling seston ratios are shown on the top right. Variable importance in the projection (VIP) of each predictor is indicated as: black solid circles (highly important) and grey solid circles (moderately important). Weakly important predictors are not illustrated.
Water 12 00036 g006
Table 1. n-alkane proxies used in this study to distinguish the different sources of seston.
NameFormulaDiagnostic ValuesSource
Assignment
References
CPI 1 2 × [ ( C 25 + C 27 + C 29 + C 31 + C 33 C 24 + C 26 + C 28 + C 30 + C 32 ) + ( C 25 + C 27 + C 29 + C 31 + C 33 C 26 + C 28 + C 30 + C 32 + C 34 ) ] CPI > 5
CPI ≈ 1
Terrestrial
Algal
[32,37]
ACL C i × i C i ACL > 25.1
ACL < 23.0
Terrestrial
Algal
[28,36]
TARHC C 27 + C 29 + C 31 C 15 + C 17 + C 19 TARHC > 4
TARHC < 1
Terrestrial
Algal
[33,47]
Paq C 23 + C 25 C 23 + C 25 + C 29 + C 31 Paq > 0.6
Paq < 0.25
Macrophytes
Terrestrial
[31,32]
Table 2. Effects of sampling sites, season, and their interaction on the stoichiometric ratios variance.
RatiosSiteSeasonSite × Season
FpFpFp
C:N2.820.128.4230.0587.94<0.01
N:P22.81<0.0129.23<0.017.02<0.01
C:P13.72<0.0112.96<0.013.40<0.05
Table 3. n-alkane proxies values and ANOSIM of multiple proxies between each discriminated group.
GroupsProxies ValuesANOSIM
TARHCCPIACLPaqComparisonsStatistic R
Group 10.53 ± 0.231.92 ± 0.6120.71 ± 1.810.39 ± 0.06Group 1 vs. Group 20.556 ***
Group 211.34 ± 4.633.26 ± 0.6527.03 ± 0.310.27 ± 0.04Group 2 vs. Group 30.368 ***
Group 310.22 ± 5.032.10 ± 0.3326.50 ± 0.670.44 ± 0.09Group 3 vs. Group 10.221 ***
*** Indicates the p values are lower than 0.001.
Table 4. Performance of the partial least squares regression (PLSR) models in predicting stoichiometric ratios.
PLSR ModelsNo. of Optimum
Components
CalibrationCross-Validation
R2RMSEBiasR2RMSEBias
Environmental variables
C:N20.270.120.0000.160.160.004
N:P30.380.370.0000.350.390.007
C:P30.350.340.0000.290.36−0.005
Environmental variables andn-alkane proxies
C:N30.380.110.0000.340.120.000
N:P30.620.210.0000.590.23−0.007
C:P40.660.220.0000.600.23−0.004

