Abstract
In this paper, we investigate the performance of a linear array of five semi-immersed, oblate spheroidal heaving Wave Energy Converters (WECs) in front of a bottom-mounted, finite-length, vertical wall under perpendicular to the wall regular waves. The diffraction and radiation problems are solved in the frequency domain by utilizing the conventional boundary integral equation method. Initially, to demonstrate the enhanced absorption ability of this array, we compare results with the ones corresponding to arrays of cylindrical and hemisphere-shaped WECs. Next, we investigate the effect of the array’s distance from the wall and of the length of the wall on the physical quantities describing the array’s performance. The results illustrate that the array’s placement at successively larger distances from the wall, up to three times the WECs’ radius, induces hydrodynamic interactions that improve the array’s hydrodynamic behavior, and thus its power absorption ability. An increase in the length of the wall does not lead to any significant power absorption improvement. Compared to the isolated array, the presence of the wall affects positively the array’s power absorption ability at specific frequency ranges, depending mainly on the array’s distance from the wall. Finally, characteristic diffracted wave field patterns are presented to interpret physically the occurrence of the local minima of the heave exciting forces.
1. Introduction
Wave energy is a vast and powerful renewable energy source. Its sustainable harnessing, directly associated with the European Unions’ energy strategies and priorities for the reduction of greenhouse emissions, can contribute to climate change effects’ mitigation and energy security enhancement, and at the same time it provides the potential for long-term economic growth through the creation of jobs and the generation of export opportunities for both technology and expertise [1,2,3]. As a result, nowadays, the wave energy sector is rapidly developing with the aiming of overcoming existing technological barriers, as well as economic and social implications [3,4], and thus delivering commercially competitive solutions. In this respect, various Wave Energy Converters (WECs) characterized by a different working principle, i.e., mode of power absorption, have been proposed and designed (e.g., [5,6]). Currently, these WECs’ types have reached different technological development stages, with the oscillating water columns and the heaving WECs (point absorbers) representing the most advanced device types [7].
Although the power absorption efficiency of single-unit heaving WECs can be improved by adequately modifying its shape or its Power Take-Off (PTO) mechanism, the need to absorb significant amounts of wave power at a given location requires the deployment of multiple WECs arranged in arrays. These arrays can either be installed and operate in offshore areas, with the potential to exploit waves of higher energy content, or at near-shore locations, where specific drawbacks (e.g., survivability issues) can be overcome. Furthermore, construction, operation, and maintenance costs can be reduced. The integration of WEC technologies with other marine facilities (e.g., [8,9,10]) presents, nowadays, a potential beneficial approach for utilizing WECs, since it facilitates cost reductions through cost sharing. Following this idea, cost-efficient solutions at near-shore areas can also be realized by installing WECs arrays in front of existing coastal structures, such as vertical (wall-type) breakwaters. In these cases, the WECs’ hydrodynamic behavior and thus their power absorption efficiency can be improved by taking advantage of both the incident and the scattered from the wall boundary waves.
The diffraction and radiation problems for the case of a single, free-floating, truncated cylinder in front of a bottom-mounted wall has been examined in the frequency domain by [11] and [12], respectively, while the power absorption of a single heaving WEC in the presence of the wall boundary has been investigated and assessed, also in the frequency domain, by [13]. In the latter study, the analysis was implemented for two different WECs’ shapes (cone and hemispherical cylinder), for various sizes and drafts of the WEC, as well as for different distances of the WEC from the wall, while the action of regular and irregular waves of various wave directions was taken into account. However, it should be noted that, in all the above investigations, the method of images was utilized for taking into account the presence of the wall in the corresponding numerical model. Thus, a completely reflecting boundary of infinite extent was assumed, which although leads to positive in terms of power absorption effects [14], it does not represent adequately the real physical problem. Finally, two-dimensional approximations have been developed in [15] for describing the resonant behavior of a single, free-floating, semi-immersed cylinder in the presence of a vertical rigid wall.
With respect to WECs arrays in front of breakwaters, surge oscillating WECs placed successively in the interior of a series of U-shaped openings (harbours) embedded in a “pure” reflecting wall have been investigated in [16], while all other relevant existing studies so far deal with arrays of cylindrical-shaped heaving WECs, in contrast to the case of isolated WECs arrays, where non-cylindrical heaving devices have been also utilized (e.g., [17,18,19]). Specifically, the power absorption of a linear array of five cylindrical heaving WECs in front of a bottom-mounted vertical wall of infinite length was examined and evaluated in [20] in both frequency and time domain, by also utilizing the method of images. Recently, for an array of five truncated cylinders, Loukogeorgaki and Chatjigeorgiou [21] revealed the limitations of the “infinite wall” concept on the calculation of the cylinders’ exciting forces; moreover, they investigated the effect of the length of the wall on these quantities. The performance of nine cylindrical heaving WECs in the seaward side of a bottom-mounted vertical wall of finite length was examined in the frequency domain by [22], where emphasis was mainly given on the effect of the array’s distance from the wall on the WECs’ heave exciting forces and responses, as well as on the power absorption ability of the array. Alternatively to the existence of a bottom-mounted wall boundary, the case of a box-type truncated breakwater of infinite length behind an array of heaving WECs has been investigated analytically in [23], and the performance of nine cylindrical heaving WECs placed in front of a fixed rectangular pontoon of finite length has been studied in the frequency domain by [24]. In this study, the focus was on the effect of various geometrical parameters (e.g., dimensions of the pontoon, distance of the array from the pontoon, etc.) and the effect of the PTO characteristics on the interaction factors of both the array and the individual WECs. In addition to all the above numerical investigations, two-dimensional experiments have been conducted quite recently by [25] for an array of four cylindrical heaving WECs placed in the seaward side of a pontoon-type breakwater. The corresponding results demonstrate that by appropriately defining important design parameters of the arrangement (i.e., WECs’ draft and distance of the WECs from the breakwater), the existence of the pontoon in the leeward side of the array can significantly improve the array’s performance.
In this paper, we focus on the deployment of heaving WECs with a different shape than that of the widely deployed, so far, cylindrical one, for configuring arrays in front of a wall boundary. More specifically, we numerically investigate the performance (hydrodynamic behaviour and power absorption) of a linear array of five semi-immersed, oblate spheroidal heaving WECs placed in front of a bottom-mounted vertical wall of finite length and of negligible thickness. The WECs are distributed uniformly within the array, and each WEC is assumed to absorb power through a linear PTO mechanism, actuated from its heave motion. The analysis is implemented in the frequency domain considering the action of perpendicular to the wall regular waves. The relevant diffraction and radiation problems, taking into account the hydrodynamic interactions among the WECs and between the wall and the WECs, are solved in the frequency domain by utilizing the conventional Boundary Integral equation (BIE) method. Initially, results are compared with the ones corresponding to arrays of cylindrical and hemisphere-shaped WECs to demonstrate the enhanced absorption ability of the examined array. Next, for the array with the oblate spheroidal WECs, extended results are presented focusing on the effect of the array’s distance from the wall and of the length of the wall on the exciting forces, the WECs’ responses, and the power absorption of the array. In addition, the results are compared with the case of an isolated array to illustrate more clearly the effect of the existence of the wall on the performance of the array. Finally, characteristic diffracted wave field patterns are presented aiming at interpreting physically the occurrence of distinctive local minima of heave exciting forces at specific frequency ranges.
2. Numerical Modeling
A linear array of hydrodynamically interacting, semi-immersed heaving WECs is placed in front of a bottom-mounted vertical wall of finite length, , and of negligible thickness, in a liquid region of constant water depth, , (Figure 1). Each WECj, , of the array has an oblate spheroidal geometry with semi-major and semi-minor axes and , as shown in Figure 1b. In this figure, the PTO mechanism of each WEC is schematically represented as a linear damping system, with damping coefficient , . All WECs are situated at a distance from the wall and they are distributed uniformly with a center-to-center spacing equal to (see Figure 1a). Both the array and the wall are subjected to the action of monochromatic incident waves of circular frequency and linear amplitude , which propagate at an angle relatively to the global horizontal -axis (Figure 1a).
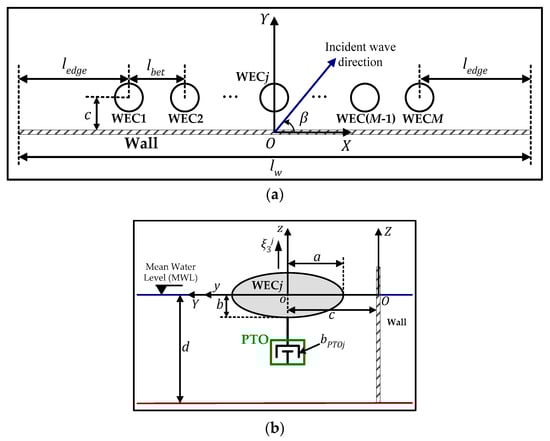
Figure 1.
Geometry of the investigated arrangement and definition of basic quantities: (a) X-Y plane and (b) X-Y plane.
The hydrodynamic analysis of the array in front of the wall, taking into account the hydrodynamic interactions between the WECs and between the wall and the WECs, is performed in the frequency domain and it is based on the BIE method, which is numerically realized using the WAMIT V6.3 © software [26]. The employed methodology relies on the three-dimensional linear potential theory, where the wall is taken fixed at its position, and all WECs are assumed to oscillate freely only along their working direction, i.e., along the vertical axis (Figure 1b). Accordingly, for all WECs, all degrees of freedom, except the one corresponding to heave, are considered ideally restricted. The complex spatial part of the velocity potential is given by [26,27]:
where the incident wave component, , is obtained from:
Furthermore, denotes the diffraction potential, is the scattered potential related to the scattered disturbance of the incident waves from the WECs and the wall, and , , correspond to the radiation potentials, associated with the waves radiated from the WECs due to their forced motion in heave. In that respect, , , denote the complex amplitudes of the heave motions of the WECs. Finally, is the gravitational acceleration, is the wave number, and .
Within the realm of the linear potential theory, the velocity potentials ( or ) should satisfy the Laplace equation and the following linearized boundary conditions:
Equation (3) is the combined kinematic and dynamic free-surface condition, Equation (4) is the bottom boundary condition, and Equations (5) and (6) are the Neumann conditions, which should hold on the wetted surfaces of the bodies. In Equation (6), denotes the normal unit vector of WECj in the vertical direction.
The boundary integral equations for the unknown diffraction and radiation potentials on the boundaries of all bodies (WECs and wall) and of the WECs, respectively, are formed by utilizing the Green’s theorem. Then, the corresponding boundary value problem is solved based on a three-dimensional low-order panel method [26,27]. For modeling the wetted surface of the wall, zero-thickness dipole panels [27] are deployed, given that the thickness of the wall is assumed to be negligible.
Following the solution of the first-order boundary value problem, the heave exciting force, , , applied on each WECi, as well as the added mass, , and the radiation damping, , coefficients are obtained using Equations (7) and (8), respectively, where is the wetted surface of the th WEC and is the water density:
Having calculated the first-order hydrodynamic forcing quantities, the following linear system of equations is solved to obtain the complex amplitudes of the WECs’ heave motions, , :
In Equation (9), are the mass matrix coefficients, represent the damping coefficients originating from the PTO mechanism, and correspond to the hydrostatic-gravitational stiffness coefficients. Given that each WEC is assumed to oscillate only in heave, for , and for are obtained as follows:
Regarding the coefficients , the PTO mechanism for a th WEC of the array is modeled as a linear damping system (Figure 1b), with damping coefficient , actuated from the heave motion of the corresponding WEC. Consequently, in Equation (9), for , while for .
The heave response of each WEC is expressed in terms of the Response Amplitude Operator, Equation (11), where denotes the amplitude of the complex quantity :
The mean power, , absorbed by the whole array at a specific is, then, calculated as:
where ,, is the power absorbed by the th WEC, calculated using Equation (13):
Finally, the non-dimensional wave elevation, , at a given field point situated at , is obtained from
where and correspond to the wave field due to diffracted and radiated waves, respectively, and , or , denote non-dimensional quantities. The values of and are obtained by dividing the corresponding dimensional quantities with and , respectively.
3. Results and Discussion
3.1. General Remarks
The BIE-based numerical model described in Section 2 is applied for an array of identical, semi-immersed oblate spheroidal WECs (Figure 1) with semi-major axis m and non-dimensional semi-minor axis (draft) . These dimensions have been selected based on [28], who demonstrated the enhanced, as compared with other WEC geometries (i.e., cylinder, hemisphere, and prolate spheroid), absorption ability of a corresponding single isolated oblate spheroidal WEC at infinite water depths. All five WECs are considered to have the same PTO characteristics; thus, , . Moreover, the damping coefficient of the PTO is tuned to a constant value, so that maximum energy absorption is achieved at the natural frequency of a single isolated WEC (e.g., [22,29,30,31]). Accordingly and in line with [32], the aforementioned value is taken equal to the heave radiation damping of a single isolated WEC at its heave natural frequency, , i.e., . On the basis of the hydrodynamic analysis of an isolated oblate spheroidal WEC, has been calculated equal to rad/s, resulting in Nm/s.
Initially, relevant results are compared with those corresponding to arrays of semi-immersed cylindrical and hemisphere-shaped WECs (Figure 2) in order to demonstrate the enhanced absorption ability of the aforementioned array. Aiming at comparing WECs that have the same , irrespectively of their geometry, the geometrical characteristics of the cylindrical and the hemisphere-shaped WECs have been defined, so that = 2.4 rad/s for both geometries, as in the case of the oblate spheroidal WECs. These characteristics along with the corresponding values are shown in Table 1, where the notations of Figure 2 are taken into account. For both the cylindrical and the hemisphere-shaped WECs, the values of Table 1, equal to , have been obtained from the hydrodynamic analysis of the corresponding isolated body. This, in turn, leads to the consideration of different values among the examined geometries, due to the existence of different hydrodynamic properties (Figure 3).
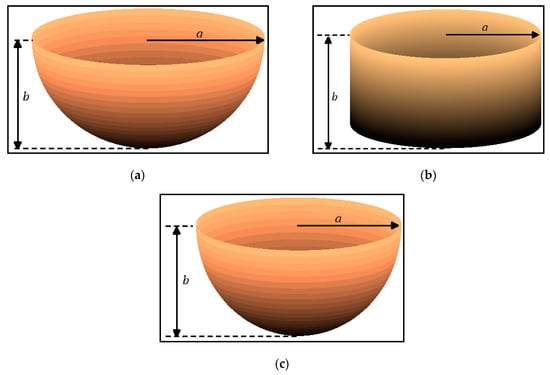
Figure 2.
Schematic representation of the wetted surfaces of the WECs’ geometries: (a) Oblate spheroid, (b) cylinder, and (c) hemisphere.

Table 1.
Geometrical and characteristics of WEC geometries considered.
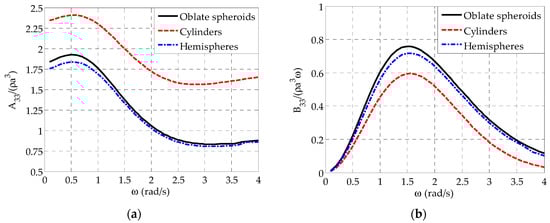
Figure 3.
Variation of non-dimensional hydrodynamic coefficients in heave for the WEC geometries considered (results correspond to single isolated bodies): (a) Added mass and (b) radiation damping.
For each of the three examined arrays, the WECs are placed in front of the wall at a distance of m and they are distributed uniformly within the array with non-dimensional center-to-center spacing equal to . Comparisons are made for two cases of non-dimensional length of the wall, equal to and 72 and and , respectively, with denoting the distance between the centers of the two outer WECs in the array with the corresponding edges of the wall, as shown in Figure 1a. It is noted that for a given WEC geometry, non-dimensional quantities are defined using the corresponding value of , included in Table 1.
Next, we investigate and assess the effect of the ratios and on the hydrodynamic behavior and the power absorption ability of the array of the five, semi-immersed oblate spheroidal WECs. For the first design parameter, six different values of (Table 2) are examined for and , and for the second examined design parameter, three different values of are considered (Table 2) for and . Results for the isolated array (i.e., ) are also cited for illustrating more clearly the effect of the presence of the wall on the performance of the array. It is mentioned that the value of has been chosen based on preliminary tests that revealed adequate energy absorption ability for this center-to-center spacing as compared with other values examined.
Table 2.
Examined cases for the array of the five semi-immersed oblate spheroidal WECs.
In all the above cases, the array and the wall are considered to be situated in a liquid region with m and they are subjected to regular incident waves propagating at angle deg (Figure 1a) with varying between 0.01 and 4.0. The heave exciting forces are given normalized by , while the symmetry of the array with respect to the examined incident wave direction leads to the same exiting forces and responses for WEC1 and WEC5 (outer WECs) and for WEC2 and WEC4 (Figure 1a with ).
3.2. Comparison of Arrays with Different WEC Geometries
In Figure 4, the heave exciting forces, , applied on the semi-immersed oblate spheroidal WECs of the examined five-body array are compared with the corresponding ones applied on the WECs of the arrays that consist of semi-immersed cylindrical and hemisphere-shaped WECs (Figure 2). The results of Figure 4 correspond to the case of , while analogous conclusions can be drawn for . For all the oblate spheroidal WECs, starts its variation from the limiting value of one (at rad/s), as exists in the case of the isolated array (see for example Figure 7 in Section 3.3), and accordingly it increases quite rapidly up to rad/s, where the peak (global maximum) occurs. A rapid decrease follows leading to a local minimum of at rad/s rad/s, and for the remaining examined values, varies quite intensively, having multiple peaks and successive local minima, with successively decreasing values towards higher frequencies. The utilization of hemisphere-shaped WECs does not introduce significant differences in the values and the variation patterns of the heave exciting forces. However, it is worthwhile to note that for the specific WEC geometry the observed global maximum is shifted at a slightly larger as compared with the oblate spheroidal WECs. This shift becomes more pronounced in the case of the cylindrical WECs; moreover, applied on the cylindrical WECs varies more smoothly at rad/s as compared with the oblate spheroidal and the hemisphere-shaped WECs. The above characteristics lead to different values of the cylindrical WECs as compared with the other two examined geometries at specific values (e.g., at rad/s rad/s for WEC2 and WEC4, Figure 4b, at rad/s rad/s for WEC3, Figure 4c).
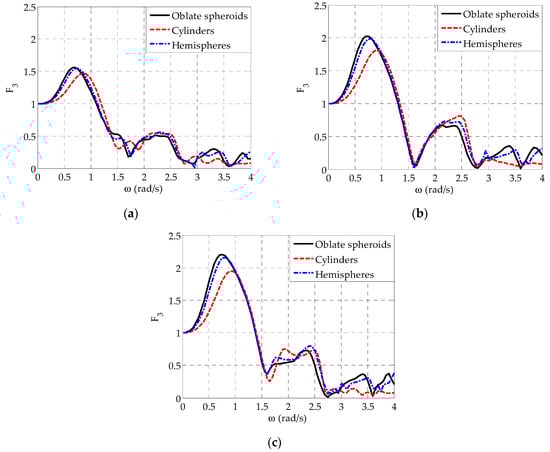
Figure 4.
Comparison of for arrays with different WEC geometries and for , m, : (a) WEC1 and WEC5, (b) WEC2 and WEC4, and (c) WEC3.
Figure 5 shows the comparison of between the three examined WEC geometries. Again, the results correspond to arrays placed in front of a wall with , while similar conclusions can be drawn for the case of . Irrespectively of the WECs’ geometry and the position of the WEC within the array, follows, in general, the variation pattern of the heave exciting forces which is characterized by the occurrence of two distinctive peaks; one at rad/s rad/s as a result of the existence of the peaks in in the concerned frequency range (Figure 4) and a second peak at rad/s rad/s attributed to resonance phenomena. Moreover, a local minimum is observed at rad/s rad/s, in absolute accordance with the variation pattern of the heave exciting forces (Figure 4). Except at rad/s rad/s, the deployment of hemisphere-shaped WECs within the array does not lead to substantial differences of as compared with the case of the oblate spheroidal WECs. In the concerned frequency range, where resonance phenomena occur, the consideration of a smaller value for the hemispheres (Table 1) has a more pronounced effect on , leading, therefore, to slightly larger values for as compared with those of the oblate spheroids. In a similar manner, the utilization of an even smaller value for the examined cylindrical WECs (Table 1) leads to a significant increase of at rad/s rad/s in the case of WECj, and as compared with the corresponding oblate spheroidal and the hemisphere-shaped WECs. The same holds for WEC3 (Figure 5c) at rad/s rad/s, except at rad/s, where of WEC3 shows a local minimum in absolute accordance with the corresponding variation of the heave exciting force (Figure 4c). Finally, for all cylindrical WECs, the existence of different values at specific frequency ranges (e.g., at rad/s rad/s, Figure 4) as compared with the rest examined WEC geometries leads also to different values at these frequency ranges.
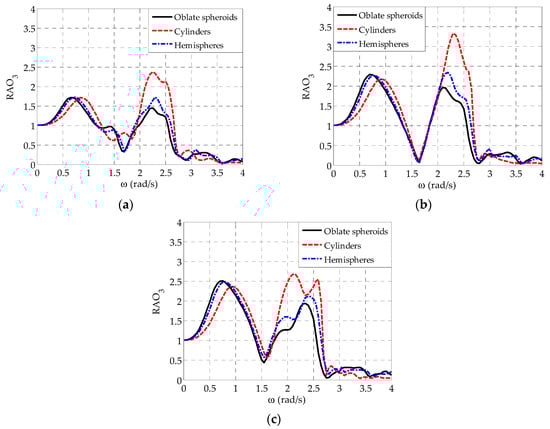
Figure 5.
Comparison of for arrays with different WEC geometries and for , m, : (a) WEC1 and WEC5, (b) WEC2 and WEC4, and (c) WEC3.
As far as the absorbed mean power is concerned, Figure 6 shows the comparison of among the three examined five-body arrays. For both and and for all three arrays, the variation pattern of is characterized by the existence of a first (local) peak at rad/s rad/s and a second (global) peak at rad/s rad/s, in accordance with the variation of , as previously discussed for the case of . Moreover, local minima of occur at specific values as a result of the relevant substantial decrease of . Compared to the cylindrical WECs, the deployment of either the hemisphere-shaped or the oblate spheroidal WECs greatly improves the power absorption ability of the array, since for the latter WEC geometries significantly larger peak values occur, and, additionally, for rad/s the frequency range, where adequate amount of power is absorbed, becomes wider. All the above are attributed to the consideration of a quite smaller value in the case of the cylindrical WECs (Table 1), as a result of their intrinsic hydrodynamic characteristics. Therefore, although this value results in a significant increase of at the frequency range where resonance phenomena occur (Figure 5), it reduces remarkably the power absorption ability of the array. Following a similar rationale, the deployment of hemisphere-shaped WECs within the array leads to slightly smaller peak values as compared with the oblate spheroidal WECs. Consequently, the oblate spheroidal WECs can be considered to have the best power absorption ability among all the three examined WEC geometries.
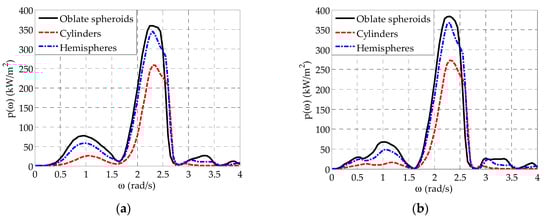
Figure 6.
Comparison of for arrays with different WEC geometries: (a) and (b) ( m, for both cases).
Finally, it is worthwhile to mention that for a given WEC’s geometry, the length of the wall affects at a small degree . Specifically, in the case of (Figure 6a), the existence of more intense wall-edge effects reduces the power absorption ability of the array at rad/s rad/s, leading to slightly smaller peak values in this frequency range as compared with (Figure 6b). However, at smaller frequencies, wall-edge effects seem to have a positive effect on , since at rad/s rad/s slightly larger values are observed for as compared with .
3.3. Effect of WECs’ Distance from the Wall on the Array’s Performance
The effect of the distance of the semi-immersed oblate spheroidal WECs from the wall on the WECs’ heave exciting forces is shown in Figure 7, where the variation of for all WECs in the array as a function of is presented for all values examined, as well as for the isolated array. For WECj, , and (Figure 7a,b) and for , the variation of begins from the limiting value of at rad/s and it is characterized by a rapid increase up to rad/s, where the peak of (global maximum) occurs. Accordingly, decreases quite rapidly up to rad/s, where it obtains its first local minimum, which approaches zero. Finally, is increased resulting in a second peak at rad/s. Analogous variation pattern is observed for all the examined values. However, by successively increasing the array’s distance from the wall, the first local minimum of and, thus, its second peak are successively shifted at smaller frequencies, while the values of the latter peaks are also consecutively increased. The above trends introduce differences on the values of at specific frequency ranges. For example, the increase of leads to larger values at rad/s rad/s, while the opposite holds true at rad/s rad/s. Analogous conclusions can be drawn for the heave exciting forces applied on the middle WEC of the array (Figure 7c). However, of WEC3 obtains one more distinctive peak at rad/s for the two smallest examined WECs’ distances from the wall (i.e., and ).
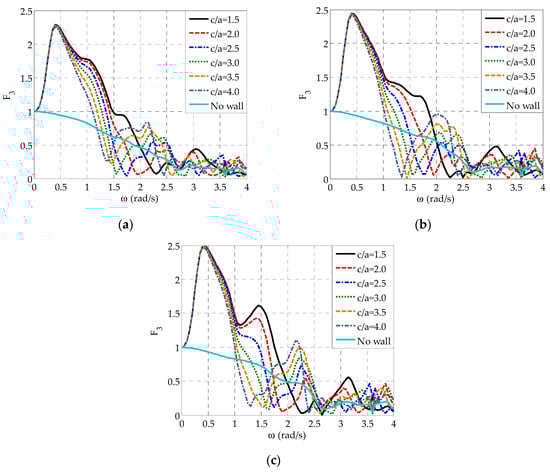
Figure 7.
Effect of on applied on the semi-immersed oblate spheroidal WECs for and : (a) WEC1 and WEC5, (b) WEC2 and WEC4, and (c) WEC3.
The results of Figure 7 demonstrate clearly that the presence of the wall, irrespectively of the distance of the WECs from this boundary, affects significantly the heave exciting forces of all the WECs in the entire examined frequency range, since for all values, does not show the continuous smooth decrease as in the case of the isolated array. Compared to the latter array, the existence of the wall boundary in the leeward side of the WECs at small distances from them (i.e., and ) leads also to a substantial increase of at rad/s rad/s and at very high frequencies ( rad/s rad/s), while the placement of the array at further distances from the wall (i.e., , , , and ) results in a significant increase of at rad/s rad/s, as well as at rad/s rad/s, where resonance phenomena of the bodies are anticipated. From a physical point of view, the above trends can be related to the formation of characteristic patterns of the diffracted wave field around the WECs, as commended in Section 3.5.
Figure 8 shows the effect of on for all the oblate spheroidal WECs. In this figure, results corresponding to the isolated array are also included to demonstrate more clearly the effect of the presence of the wall on. In the case of and for WECj, , and (Figure 8a,b), the variation pattern of is quite intense and it is characterized by three distinctive peaks. The first one (global maximum) and the third one occur at rad/s and rad/s, respectively, as a result of the relevant maximum values (Figure 7), while the second peak is observed at rad/s and it is related to resonance phenomena. Moreover, a characteristic local minimum, following the preceding rapid decrease of , occurs at rad/s, in absolute accordance with the variation of the heave exciting forces (Figure 7). A similar variation pattern is observed for all examined values. However, by successively increasing up to , the aforementioned local minimum and resonance-related peak of are successively shifted at slightly smaller frequencies as compared with the case of , while the values of the latter peaks are increased substantially. Same conclusions can be drawn when is further increased up to; nevertheless, the placement of the WECs at one of the two largest examined distances from the wall does not introduce any significant differences in the peak values of at rad/s rad/s as compared with . It is also worthwhile to note that at rad/s rad/s the increase of leads to a smooth reduction of values, while only the curve of has a distinctive third peak at very high frequencies (i.e., at ) as in the case of . All the above are in absolute accordance with the results of Figure 7. Finally, with regard to WEC3, which is situated in the middle of the array (Figure 8c), conclusions similar to the case of WECj, , and can be drawn. However, for all values examined, obtains one more distinctive peak at rad/s.
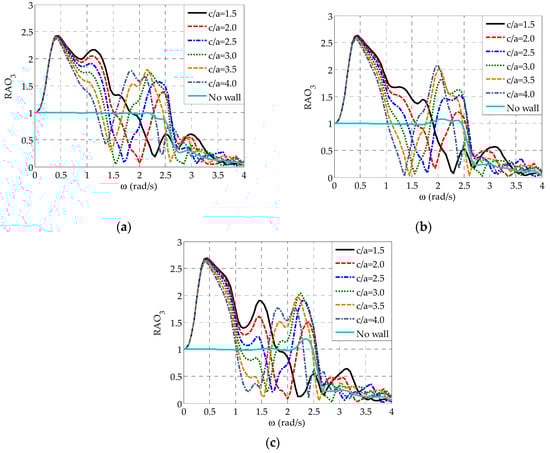
Figure 8.
Effect of on of the semi-immersed oblate spheroidal WECs for and : (a) WEC1 and WEC5, (b) WEC2 and WEC4, and (c) WEC3.
Compared to the isolated array, the results of Figure 8 illustrate that the presence of the wall, has a significant impact on of all the WECs in almost the entire examined frequency range. Specifically, on the one hand, when the array is placed in front of the wall at a small distance from the wall (i.e., and ), the WECs’ heave responses increase significantly mainly at rad/s rad/s, while a great reduction of occurs at rad/s rad/s, especially for . On the other hand, by increasing to values larger than 2, , increases at rad/s rad/s, but, most importantly in the frequency range, where resonance phenomena occur.
Finally, the effect of on the power absorbed by the whole array is shown in Figure 9, where is plotted as a function of for all values examined, as well as for the case of the isolated array. For , a significant amount of power is absorbed at rad/s rad/s, where obtains its maximum value approximately equal to kW/m2. Moreover, additional peaks with smaller values occur at rad/s and rad/s as a result of the relevant peak values (Figure 8). By increasing to , a significant amount of power is absorbed at larger wave frequencies and, more specifically, at rad/s rad/s, where resonance phenomena also occur. Moreover, the power absorption ability of the array is substantially enhanced, since the maximum value of , occurring at rad/s, is approximately equal to kW/m2. Similar behavior is observed for the rest of the examined values. However, the increase of from 2.0 to leads to a successive improvement of the array’s power absorption ability, as global maxima become equal to kW/m2 (at rad/s) and kW/m2 (at rad/s) for and , respectively. Moreover, the frequency range, where a significant amount of power is absorbed, becomes more and more wider (i.e., rad/s rad/s for and rad/s rad/s for ). By further increasing up to , the power absorption ability of the array is successively reduced as compared with the case of ( maxima are approximately equal to kW/m2 and kW/m2 for and , respectively) and it is realized at a slightly smaller frequency ranges (i.e., at rad/s rad/s for and at rad/s rad/s for ). For , adequate power is also absorbed at rad/s, where additional peaks are observed. However, by increasing , the corresponding power absorption ability of the array is successively reduced, and it is bounded at less wide frequency ranges. Taking all the above into consideration, it can be concluded that for a wall with , the placement of the examined five-body array with at a non-dimensional distance from the wall, , equal to 3.0 leads to the best power absorption. Finally, compared to the isolated array, it is clear that the existence of the wall boundary positively affects the power absorption ability of the array leading to a significant increase of at specific frequency ranges, as well as to more than one peak, depending upon the value of .
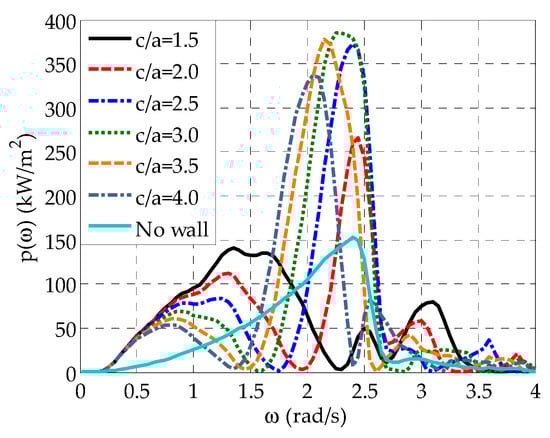
Figure 9.
Effect of on of the array with semi-immersed oblate spheroidal WECs for and .
The results of Figure 9 demonstrate that is a critical design parameter that directly affects the power absorption ability of the examined five-body array. For the smallest examined non-dimensional distance from the wall, the power absorption ability of the array is not driven by resonance phenomena, as significant heave exciting forces and responses, resulting from the hydrodynamic interactions of the WECs with the wall boundary, exist at wave frequencies outside the frequency range ( rad/s rad/s), where resonance phenomena occur. However, the opposite holds true for the rest of the examined values, where maximum values occur at rad/s rad/s, since the presence of the wall boundary does not have a negative effect on the WECs’ heave exciting forces in this frequency range, and thus on the relevant amplification due to resonance. Up to the placement of the array at successively larger distances from the wall induces hydrodynamic interactions between the WECs and the boundary that enhance consecutively the hydrodynamic behavior of the WECs, and thus the array’s power absorption ability. However, a further increase of to values larger than does not enable to exploit in the best possible way the disturbances induced from the wall wave, and thus it leads to arrays with consecutively reduced power absorption ability. Consequently, among the examined values, is considered to be the upper limit of this design parameter, in terms of power absorption enhancement.
3.4. Effect of the Length of the Wall on the Array’s Performance
The effect of the length of the wall on the hydrodynamic behavior of the semi-immersed oblate spheroidal WECs is shown in Figure 10 and Figure 11, where the variations of and for all WECs in the array as a function of are presented, respectively, for , and , as well as well as for the isolated array.
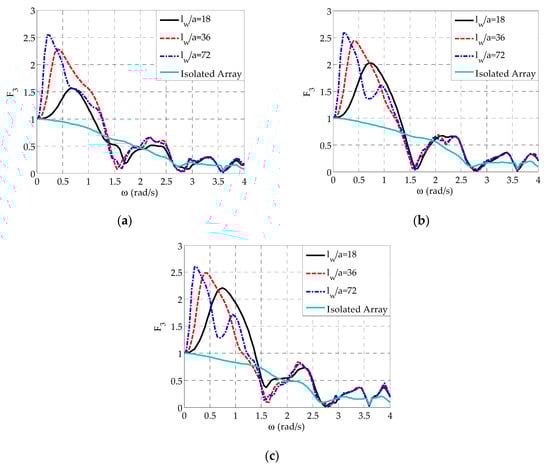
Figure 10.
Effect of on applied on the semi-immersed oblate spheroidal WECs for and : (a) WEC1 and WEC5, (b) WEC2 and WEC4, and (c) WEC3.
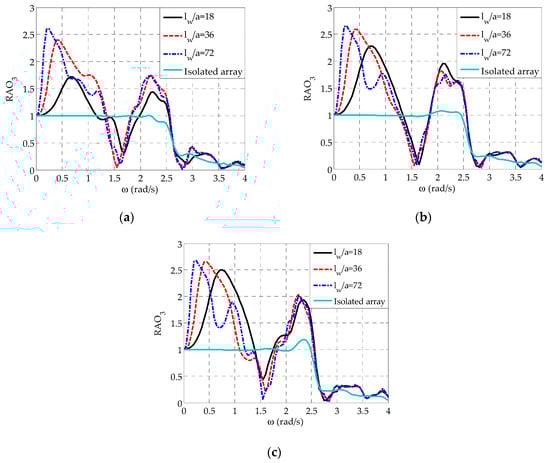
Figure 11.
Effect of on applied on the semi-immersed oblate spheroidal WECs for and : (a) WEC1 and WEC5, (b) WEC2 and WEC4, and (c) WEC3.
Starting with the heave exciting forces (Figure 10), for all WECs and for varies in a similar manner as in the case of and , already described in Section 3.2 and Section 3.3, respectively. However, for this value, a second peak at rad/s occurs for WECj, , and (Figure 10b,c). The increase of leads to a more rapid increase of , from the limiting value of at rad/s, and thus to a shift of the first peaks (global maxima) at smaller wave frequencies. Moreover, it results to larger values of the aforementioned peaks. The above trends introduce differences in the values of at rad/s rad/s in the case of WECj, , and (Figure 10a,c) and at rad/s rad/s in the case of WECj, and (Figure 10b). Compared to the isolated array, it is straightforward that the presence of the wall, irrespectively of its length, affects the WECs’ heave exciting forces in the whole examined frequency range, since for all values examined, does not demonstrate a continuous smooth decrease as in the case of the isolated array. This in turn leads to different values, especially at rad/s rad/s, where for a great increase of the heave exciting forces occurs as compared with the isolated array.
With regards to WECs’ heave responses (Figure 11), for all WECs and for varies in a similar manner as in the case of and already described in Section 3.2 and Section 3.3, respectively. Nevertheless, for WECj, , and (Figure 11b,c) depicts a second peak at rad/s in absolute accordance with the corresponding heave exciting forces. On the one hand, for the outer WECs of the array (Figure 11a), slightly larger values compared to for both and are observed at rad/s rad/s, where resonance phenomena occur, since the corresponding values also become larger at this frequency range (Figure 10a). On the other hand, for all WECs, the increase of leads to larger values at rad/s rad/s, i.e., in the low frequency range, in accordance to the results of Figure 10. Finally, compared to the isolated array, the wall boundary, irrespectively of its length, significantly increases the WECs’ responses at rad/s rad/s and at rad/s rad/s, whereas the opposite holds true at rad/s rad/s.
The effect of on the mean power absorbed by the whole array is shown in Figure 12, where is plotted as a function of for and , as well as for the case of the isolated array. Since for all cases examined, the array is placed at a distance from the wall, the power absorption ability of the array is mainly driven by the WECs’ resonance. Therefore, maximum values occur at rad/s rad/s, where resonance phenomena occur. However, the presence of the wall boundary introduces a second peak in the vicinity of rad/s due to the existence of significant heave exciting forces, and thus large values in the examined low frequency range, as previously described. Compared to , where the maximum value of is approximately equal to kW/m2, the increase of to enhances, to a small extent, the power absorption ability of the array, since the maximum value of becomes equal to kW/m2. A further increase of does not lead to any improvement of the array’s power absorption ability as compared with . As for rad/s rad/s, where the second peak of is observed, the change of has an insignificant effect on the values of . Finally, compared to the isolated array, it is clear that the existence of the wall boundary positively affects the power absorption ability of the array, as it results in a significant increase of , especially in the frequency range, where resonance phenomena occur.
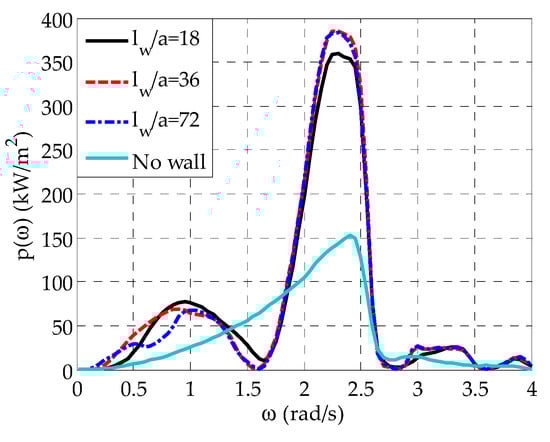
Figure 12.
Effect of on of the array with semi-immersed oblate spheroidal WECs for and .
3.5. Spatial Variation of the Diffracted Wave Field
For physically interpreting the existence of great differences of the heave exciting forces at specific frequency ranges for different distances of the array from the wall (Figure 7), the spatial variation of the non-dimensional wave elevation, , due to only diffracted waves, i.e., first term in Equation (14), is taken into account. Specifically, for the array of the semi-immersed oblate spheroidal WECs with placed in front of a wall of , Figure 13 and Figure 14 show the spatial variation of the diffracted wave field indicatively for and calculated at and for two characteristic values of , equal to rad/s and rad/s, respectively. At rad/s, the WECs’ heave exciting forces for show significant values as compared with , while the opposite holds for rad/s, where, moreover, for all WECs in the case of obtains a characteristic local minimum (Figure 7). For the above two wave frequencies, the diffracted wave field in the seaward side of the wall in the absence of the WECs is also shown in Figure 15, which more clearly demonstrates the wave disturbances induced by the wall itself.
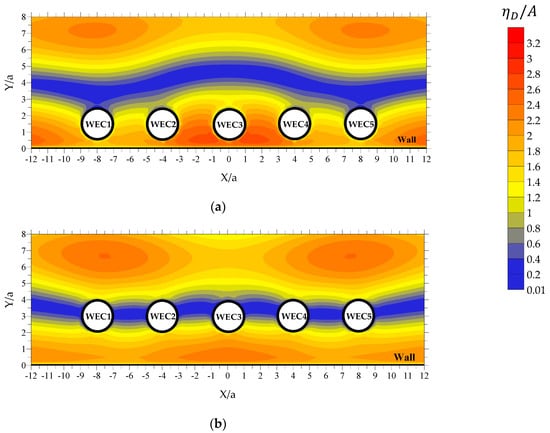
Figure 13.
Spatial variation of at rad/s for the array with semi-immersed oblate spheroidal WECs ( and ): (a) and (b) .
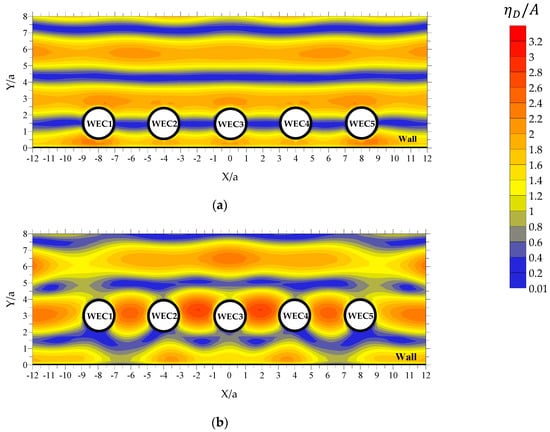
Figure 14.
Spatial variation of at rad/s for the array with semi-immersed oblate spheroidal WECs ( and ): (a) and (b) .
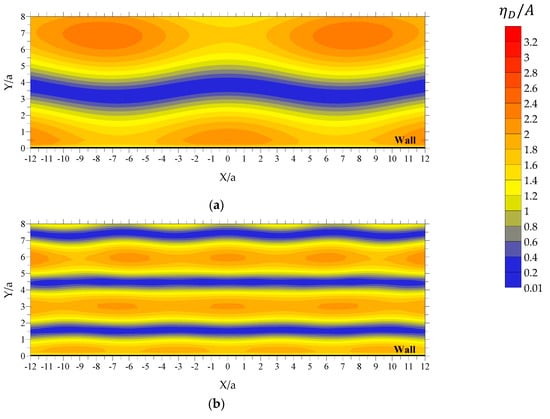
Figure 15.
Spatial variation of at the seaward side of the wall with in the absence of WECs: (a) rad/s and (b) rad/s.
Starting with the case of rad/s, the presence of the wall boundary in the absence of the WECs (Figure 15a), at approximately , leads to the formation of a longitudinal zone, with a sinusoidal-like variation pattern along (coined hereafter “zone A1”), where has values almost equal to zero. Outside of this zone, varies quite intensively and has significant values. By placing the WECs in front of the wall (Figure 13), zone A1 still exists; depending, however, upon the examined value, the zone’s width along and its variation pattern along are modified due to the hydrodynamic interactions among the WECs and between the wall and the WECs. Accordingly, from a physical point of view, the case of (Figure 13a) corresponds to the placement of WECs outside of zone A1. More specifically, the WECs are placed in an area between the leeward side of zone A1 and the wall, where, the combined diffraction disturbances induced by the WECs and the wall amplify the intense variation pattern and the large values of already existing, due to the presence of the wall. As a result, a non-symmetric (with respect to the WECs’ local horizontal axes) diffracted wave field, with significant values, is formed around the WECs. On the other hand, the case of (Figure 13b) is physically equivalent to the placement of the WECs inside zone A1. This in turn, leads to the formation of an almost symmetric (with respect to the WECs’ local horizontal axes) diffracted wave field around the WECs, with quite small values. All the above advocate the existence of larger values for at rad/s as compared with the case of , in absolute accordance with the results of Figure 7.
In the case of rad/s, the consideration of incident waves with shorter wave length results in the formation of three distinct longitudinal zones that are almost parallel to the wall, at the seaward side of the boundary (Figure 15b), where has almost zero values. The first zone (coined hereafter “zone B1”) is bounded at approximately , while the second and the third zones (coined hereafter “zone B2” and “zone B3”, respectively) are bounded at approximately and , respectively. These zones remain almost unaffected, when the WECs are placed close to the wall, i.e., in the case of (Figure 14a), whereas for the existence of the WECs modifies the width and the variation pattern of these zones along (Figure 14b). Following a rationale similar to the case of Figure 13, from a physical point of view, the non-dimensional distance from the wall (Figure 14a) corresponds to the placement of WECs inside zone B1. This, in turn, results in the existence of an almost symmetric (with respect to the WECs’ local horizontal axes) diffracted wave field around the WECs, with quite small values. However, the case of (Figure 14b) is physically equivalent with the placement of the WECs in the area between zones B1 and B2, where intense variation patterns and significant values of are observed. Consequently, a non-symmetric (with respect to the WECs’ local horizontal axes) diffracted wave field with significant values is formed around the WECs. All the above advocate for the existence of very small values for at rad/s as compared with , in accordance with the results of Figure 7.
4. Conclusions
In this paper, we investigate in the frequency domain the performance (hydrodynamic behavior and power absorption) of a linear array of five semi-immersed oblate spheroidal heaving WECs placed in front of a bottom-mounted, vertical wall of finite-length and of negligible thickness under the action of perpendicular to the wall regular waves. A summary of the main conclusions of this investigation is the following:
- Compared to the cylindrical WECs, the deployment of either the hemisphere-shaped or the oblate spheroidal WECs improves the power absorption ability of the array to a great extent. However, among all the three WECs’ geometries examined, the oblate spheroidal WECs are considered to have the best power absorption ability due to their intrinsic hydrodynamic characteristics that also enable the consideration of larger values.
- Irrespectively of the values of and/or , the presence of the wall boundary in the leeward side of the oblate spheroidal WECs, contrary to the isolated array, leads to the existence of global maxima at rad/s with values larger than 1.0.
- For different values, the oblate spheroids’ heave exciting forces show great differences at specific frequency ranges. From a physical point of view, this fact can be related to the realization or not of an array’s placement at existing characteristic wave field zones, resulting from the presence of the wall, where the relevant wave elevation has values almost equal to zero. In cases, where falls within these zones, a smooth diffracted wave field around the WECs with symmetrical features is formed advocating the existence of very small values, while the opposite holds true when the WECs are placed outside of these zones.
- For the smallest examined distance from the wall, the power absorption ability of the oblate spheroidal WECs array is not driven by resonance phenomena, as large heave exciting forces, significant responses, and thus maximum values, occur at wave frequencies outside the range, where WECs’ resonance occurs. The opposite holds true for the remaining examined values, where the presence of the wall does not impose any restrictions on the amplification due to resonance.
- The placement of the oblate spheroidal WECs array at successively larger distances from the wall induces hydrodynamic interactions between the spheroids and the boundary that enhance consecutively the hydrodynamic behavior of the WECs, and thus the array’s power absorption ability. However, this holds true for up to since a further increase of leads to arrays with consecutively reduced power absorption ability. Consequently, among the values examined in this paper, presents an upper limit of this design parameter in terms of power absorption enhancement. Compared to the isolated array, the presence of the wall boundary positively affects the power absorption ability of the array leading to a significant increase of at specific frequency ranges, as well as to more than one peak, depending upon the value of .
- The increase of from 18 to enhances the power absorption ability of the oblate spheroidal WECs array to a small extent, and a further increase of does not lead to any relevant improvement. Compared to the isolated array, the existence of the wall boundary, irrespectively of its length, affects positively the power absorption ability of the array, since it results in a significant increase of , especially at the frequency range where resonance phenomena occur.
This investigation can be further extended in order to examine the effect of other characteristic parameters (e.g., PTO characteristics, wave directionality, etc.) on the performance of the oblate spheroidal WECs array under the action of both regular and irregular waves. Moreover, in terms of power absorption maximization, the hydrodynamic model can be appropriately coupled with an optimization algorithm aiming at defining the optimum distance or location of the WECs in front of the wall.
Author Contributions
Conceptualization, I.K.C. and E.L.; methodology, E.L. and I.K.C.; investigation, E.L., I.B. and I.K.C.; software, I.B.; formal analysis, I.B. and E.L.; writing—original draft preparation, E.L.; writing—review and editing, I.K.C. and I.B. All authors have read and agreed to the published version of the manuscript.
Funding
This research received no external funding.
Conflicts of Interest
The authors declare no conflict of interest.
References
- Oceans of Energy—European Ocean Energy Roadmap 2010–2050. Available online: https://www.icoe-conference.com/publication/oceans_of_energy_european_ocean_energy_roadmap_2010_2050/ (accessed on 25 November 2019).
- Communication from the Commission to the European Parliament, the Council, the European Economic and Social Committee and the Committee of Regions: Blue Energy Action Needed to Deliver on the Potential of Ocean Energy in European Seas and Oceans by 2020 and Beyond (COM/2014/08 final). Available online: http://eur-lex.europa.eu/legal-content/EN/TXT/?uri=CELEX%3A52014DC0008 (accessed on 25 November 2019).
- Magagna, D.; Uihlein, A. Ocean energy development in Europe: Current status and future perspectives. Int. J. Mar. Energy 2015, 11, 84–104. [Google Scholar] [CrossRef]
- Uihlein, A.; Magagna, D. Wave and tidal current energy—A review of the current state of research beyond technology. Renew. Sustain. Energy Rev. 2016, 58, 1070–1081. [Google Scholar] [CrossRef]
- Antonio, F.D.O. Wave energy utilization: A review of the technologies. Renew. Sustain. Energy Rev. 2010, 14, 899–918. [Google Scholar] [CrossRef]
- Aderinto, T.; Li, H. Ocean wave energy converters: Status and challenges. Energies 2018, 11, 1250. [Google Scholar] [CrossRef]
- Magagna, D.; Monfardini, R.; Uihlein, A. JRC Ocean Energy Status Report: 2016 Edition; EUR 28407 EN (JRC104799); Publications Office of the European Union: Luxembourg, 2016; pp. 10–13.
- Vicinanza, D.; Margheritini, L.; Kofoed, J.P.; Buccino, M. The SSG wave energy converter: Performance, status and recent developments. Energies 2012, 5, 193–226. [Google Scholar] [CrossRef]
- Mustapa, M.A.; Yaakob, O.B.; Ahmed, Y.M.; Rheem, C.-K.; Koh, K.K.; Adnan, F.A. Wave energy device and breakwater integration: A review. Renew. Sust. Energ. Rev. 2017, 77, 43–58. [Google Scholar] [CrossRef]
- Zhao, X.L.; Ning, D.Z.; Zou, Q.P.; Qiao, D.S.; Cai, S.Q. Hybrid floating breakwater-WEC system: A review. Ocean Eng. 2019, 186, 106126. [Google Scholar] [CrossRef]
- Zheng, S.; Zhang, Y. Wave diffraction from a truncated cylinder in front of a vertical wall. Ocean Eng. 2015, 104, 329–343. [Google Scholar] [CrossRef]
- Zheng, S.; Zhang, Y. Wave radiation from a truncated cylinder in front of a vertical wall. Ocean Eng. 2016, 111, 602–614. [Google Scholar] [CrossRef]
- Schay, J.; Bhattacharjee, J.; Soares, C.G. Numerical Modelling of a Heaving Point Absorber in front of a Vertical Wall. In Proceedings of the ASME 32nd International Conference on Ocean, Offshore and Arctic Engineering, Nantes, France, 9–14 June 2013. [Google Scholar]
- Falnes, J.; Hals, J. Heaving buoys, point absorbers and arrays. Philos. Trans. R. Soc. A Math. Phys. Eng. Sci. 2012, 370, 246–277. [Google Scholar] [CrossRef]
- McIver, P.; Porter, R. The motion of a freely floating cylinder in the presence of a wall and the approximation of resonances. J. Fluid Mech. 2016, 795, 581–610. [Google Scholar] [CrossRef][Green Version]
- McIver, P.; Evans, D.V. An approximate theory for the performance of a number of wave-energy devices set into a reflecting wall. Appl. Ocean Res. 1988, 10, 58–65. [Google Scholar] [CrossRef]
- Wolgamot, H.A.; Taylor, P.H.; Eatock Taylor, R. The interaction factor and directionality in wave energy arrays. Ocean Eng. 2012, 47, 65–73. [Google Scholar] [CrossRef]
- Belibassakis, K.; Bonovas, M.; Rusu, E. Novel method for estimating wave energy converter performance in variable bathymetry regions and applications. Energies 2018, 11, 2092. [Google Scholar] [CrossRef]
- Bonovas, M.; Belibassakis, K.; Rusu, E. Multi-DOF WEC performance in variable bathymetry regions using a hybrid 3D BEM and optimization. Energies 2019, 12, 2108. [Google Scholar] [CrossRef]
- Mavrakos, S.A.; Katsaounis, G.M.; Nielsen, K.; Lemonis, G. Numerical Performance Investigation of an Array of Heaving Power Converters in front of a Vertical Breakwater. In Proceeding of the 14th International Offshore and Polar Engineering Conference, Toulon, France, 23–28 May 2004. [Google Scholar]
- Loukogeorgaki, E.; Chatjigeorgiou, I.K. Hydrodynamic performance of an array of truncated cylinders in front of a vertical wall. Ocean Eng. 2019, 189, 106407. [Google Scholar] [CrossRef]
- Loukogeorgaki, E.; Chatjigeorgiou, I.K. Hydrodynamic Performance of an Array of Wave Energy Converters in Front of a Vertical Wall. In Proceedings of the 13th European Wave and Tidal Energy Conference (EWTEC 2019), Napoli, Italy, 1–6 September 2019; p. 1464. [Google Scholar]
- Zhao, X.; Ning, D.; Zhang, C.; Liu, Y.; Kang, H. Analytical study on an oscillating buoy wave energy converter integrated into a fixed box-type breakwater. Math. Probl. Eng. 2017, 2017, 3960401. [Google Scholar] [CrossRef]
- Ning, D.Z.; Zhao, X.L.; Chen, L.F.; Zhao, M. Hydrodynamic performance of an array of wave energy converters integrated with a pontoon-type breakwater. Energies 2018, 11, 685. [Google Scholar] [CrossRef]
- Zhao, X.L.; Ning, D.Z.; Liang, D.F. Experimental investigation on hydrodynamic performance of a breakwater integrated WEC system. Ocean Eng. 2019, 171, 25–32. [Google Scholar] [CrossRef]
- WAMIT Theory Manual. Available online: https://www.wamit.com/Publications/tmanual.pdf (accessed on 25 November 2019).
- Lee, C.H.; Newman, J.N. Computation of wave effects using the panel method. In Numerical Models in Fluid-Structure Interaction; Chakrabarti, S., Ed.; WIT Press: Southampton, UK, 2005; pp. 211–251. [Google Scholar]
- Tzellos, N. Performance of an Oblate Spheroid-Shaped Wave Energy Converter. Integrated Master Thesis, Civil Engineering Degree-Aristotle University of Thessaloniki, Thessaloniki, Greece, 12 July 2019. (In Greek). [Google Scholar]
- Babarit, A. Impact of long separating distances on the energy production of two interacting wave energy converters. Ocean Eng. 2010, 37, 718–729. [Google Scholar] [CrossRef]
- Bogarino, B.; Babarit, A.; Ferrant, P. Impact of wave interactions effects on energy absorption in large arrays of wave energy converters. Ocean Eng. 2012, 41, 79–88. [Google Scholar] [CrossRef]
- Loukogeorgaki, E. Finite water depth effects on the performance of a wave farm. J. Renew. Sustain. Energy 2018, 10, 034501. [Google Scholar] [CrossRef]
- Falnes, J. Ocean Waves and Oscillating Systems: Linear Interactions Including Wave-Energy Extraction, 1st ed.; Cambridge University Press: Cambridge, UK, 2002; pp. 17–20. [Google Scholar]
© 2020 by the authors. Licensee MDPI, Basel, Switzerland. This article is an open access article distributed under the terms and conditions of the Creative Commons Attribution (CC BY) license (http://creativecommons.org/licenses/by/4.0/).