Article

Using a Distributed Recharge Model to Quantify Recharge Processes in a Semi-Arid Karst Catchment: An Example from Wadi Natuf, West Bank

1
British Geological Survey, Keyworth, Nottinghamshire NG12 5GG, UK
2
British Geological Survey, Wallingford, Oxfordshire OX10 8BB, UK
*
Author to whom correspondence should be addressed.
Water 2019, 11(2), 276; https://doi.org/10.3390/w11020276
Submission received: 24 December 2018 / Revised: 23 January 2019 / Accepted: 28 January 2019 / Published: 5 February 2019
(This article belongs to the Section Water Use and Scarcity)

Abstract

:
The Wadi Natuf catchment is situated to the west of the Palestinian capital city of Ramallah which is in the West Bank. The catchment has been instrumented since 2003 to identify and examine recharge processes in semi-arid upland karst terrain, in which both direct and indirect recharge are important. The key recharge processes are direct rainfall recharge, and indirect recharge via wadis including the lateral routing of potential recharge in the unsaturated zone to springs which supply the wadis. A conceptual model describing these processes was developed. A distributed recharge model was then employed to test this conceptual model and to calculate recharge. A semi-arid wetting threshold method, based on local field experiments was used for recharge estimation. The model was calibrated by comparing simulated wadi flows to those recorded during a relatively short historical event. The study demonstrates that short-term monitoring can enable a sensible validation of a conceptual model leading to the estimation of recharge. Confidence in the model simulation requires further field work to strengthen the understanding of processes taking place in semi-arid climates and karstic flow environments.

1. Introduction

It is a self-evident truth that, at this time in the early part of the 21st century, water resources are under considerable pressure, particularly from increasing urbanization [1]. Population growth, particularly the drift to urban centers, and the demand from sectors in the global economy such as agriculture, manufacturing, and energy, combined with environmental degradation and climate change, all place water resources under greater and greater strain. To meet this demand, groundwater abstraction plays an important part in providing water for public and industrial supply around the world; however, aquifers are increasingly being exploited [2], as well as experiencing pressures from climate change [3].
One of the regions of the world where this problem is particularly acute is the Middle East [4], where political instability compounds the challenge of ensuring sustainable water supply [5]. In this region, groundwater plays an important role in providing water resources, mainly due to the arid nature of the climate and the geological setting. Understanding groundwater recharge in arid and semi-arid environments is key to determining the potential resource available for abstraction. However, the nature of the terrain, with its steep slopes and karstic aquifers with a thick unsaturated zone [6,7,8,9,10], provides a challenge to both the understating and quantification of recharge.
The West Bank, Palestine (see Figure 1) is one such area which was studied over a number of decades [6], but is complex and is still yielding its secrets. To assist this process, the Wadi Natuf catchment (see Figure 1) [11] was developed as a test area to develop the understanding of recharge processes.
Recharge derived from rainfall can occur via direct or indirect means [12]. Direct recharge is rainwater that percolates where it falls straight into the soil zone, whereas indirect recharge takes place from rainwater that is transported overland, for example, as runoff via wadis with secondary infiltration to the vadose zone. In semi-arid and arid regions, indirect recharge is an important mechanism [13]. Direct or indirect recharge and the balance between the two is very difficult to quantify [14], particularly in karstic terrains. Furthermore, recharge may also occur from water losses in urban reticulation systems and from agricultural irrigation.
There are, however, a number of potential approaches to quantify recharge, which include using hydrograph analysis [15], chloride mass balance calculations [16], tracer techniques [17], water balance calculations [6], and numerical models [18]. The nature of the catchments in the West Bank, with thick unsaturated zones resulting in both vertical and horizontal movement of groundwater before it reaches the water table of the main aquifers, means that the consideration of processes is important and they need to be carefully identified. Furthermore, the lack of data available in the region and even in a relatively well-studied catchment like Wadi Natuf provides its challenges.
The groundwater system underlying the West Bank comprises three basins: Western, Eastern, and Northeastern [19] (Figure 1). There were a number of recharge estimates undertaken in the West Bank. The first recharge studies were undertaken on the Western Aquifer Basin by the Israeli Hydrological Service [7,8]. These studies used water balance methods to arrive at an empirical relationship between long-term average (LTA) rainfall and recharge:
RcLTA = 0.86 (PLTA − 360),
where RcLTA is the long-term average (LTA) recharge (mm·a−1), and PLTA is the LTA rainfall (mm·a−1).
This work was extended by Rofe and Rafety [20] who developed a recharge estimate based on Penman [21]. They concluded that recharge was about 35% of LTA rainfall. The empirical approach was applied to the Eastern Aquifer Basin by Guttman and Zukerman [8] who derived an improved empirical relationship between rainfall and recharge by extending the rainfall record. Other recharge estimates were produced for groundwater models, such as Bachmat [22], with work in the Western Aquifer Basin and [9] extending their work into the Eastern Aquifer Basin. The chloride mass balance approach for the Central Western Aquifer derived an empirical recharge value of 27% of mean annual rainfall over a 20-year period (1997–2017) [16].
A consistent recharge estimate was reached for the Western Aquifer Basin (Figure 1) of around 350 Mm3·a−1, and this was since reinforced [19]. The comparable recharge estimate for the Eastern Aquifer Basin is about 130 Mm3·a−1. A small number of studies also estimated recharge for the whole of the West Bank, concluding a value of just over 800 Mm3·a−1, more than 200 Mm3·a−1 greater than the sum of the estimates for each individual basin. Time-variant recharge estimates [9] for the Eastern Aquifer Basin, for the period 1969 to 1994, provided a minimum recharge estimate of 60 Mm3·a−1 for a dry year and a maximum 460 Mm3·a−1 for a wet year. An extension to empirical methods was undertaken [23] using remotely sensed data to provide rainfall (via the Tropical Rainfall Measuring Mission) and surface reflectance, land surface temperature and emissivity (via the Moderate Resolution Imaging Spectroradiometer or MODIS; Santa Barbara Remote Sensing, CA US), in combination with data from six meteorological stations for the West Bank. Monthly recharge estimates were produced which included an approximation of runoff, but excluded processes such as irrigation and reticulation losses. The estimates produced 700 Mm3·a−1 and compared favorably with those of previous work (see Table 2 in Reference [6]), but further work was recommended on satellite measurement techniques and field measurements and the understanding of recharge processes.
With the exception of Rofe and Rafety [20], the work in the West Bank relied on empirical formulae that describe the relationship between rainfall and recharge. Although founded on detailed hydrogeological studies, this approach can neither deal with additional recharge processes as they are identified nor allow any predictive assessment, for example, on the impact of land use or climate change. This was addressed by References [6,10]. A process-based distributed recharge model was constructed and applied on a regional scale to the West Bank [6], and this was refined to allow work at a higher resolution catchment scale within the Wadi Natuf catchment. A distributed model based on a soil “bucket” allied with a FEFLOW model was also undertaken [10]. This work determined that the distribution of recharge during any year is more important than the annual total.
To understand the key recharge processes in the West Bank, a recent conceptual model of recharge processes for Wadi Natuf regarding wadi transmission losses was proposed [11], but has yet to be tested using modeling approaches. Testing of a conceptual understanding using numerical models is one method of determining whether the identified processes are occurring in small catchments [24]. The work described in this paper aims to both test the current conceptual model and the importance of transmission losses from wadis and shallow circulation of groundwater to springs using a storm event which occurred in February/March 2009. The work identifies the main uncertainties in the understanding and quantification of recharge in semi-arid, karstic catchments.

2. Materials and Methods
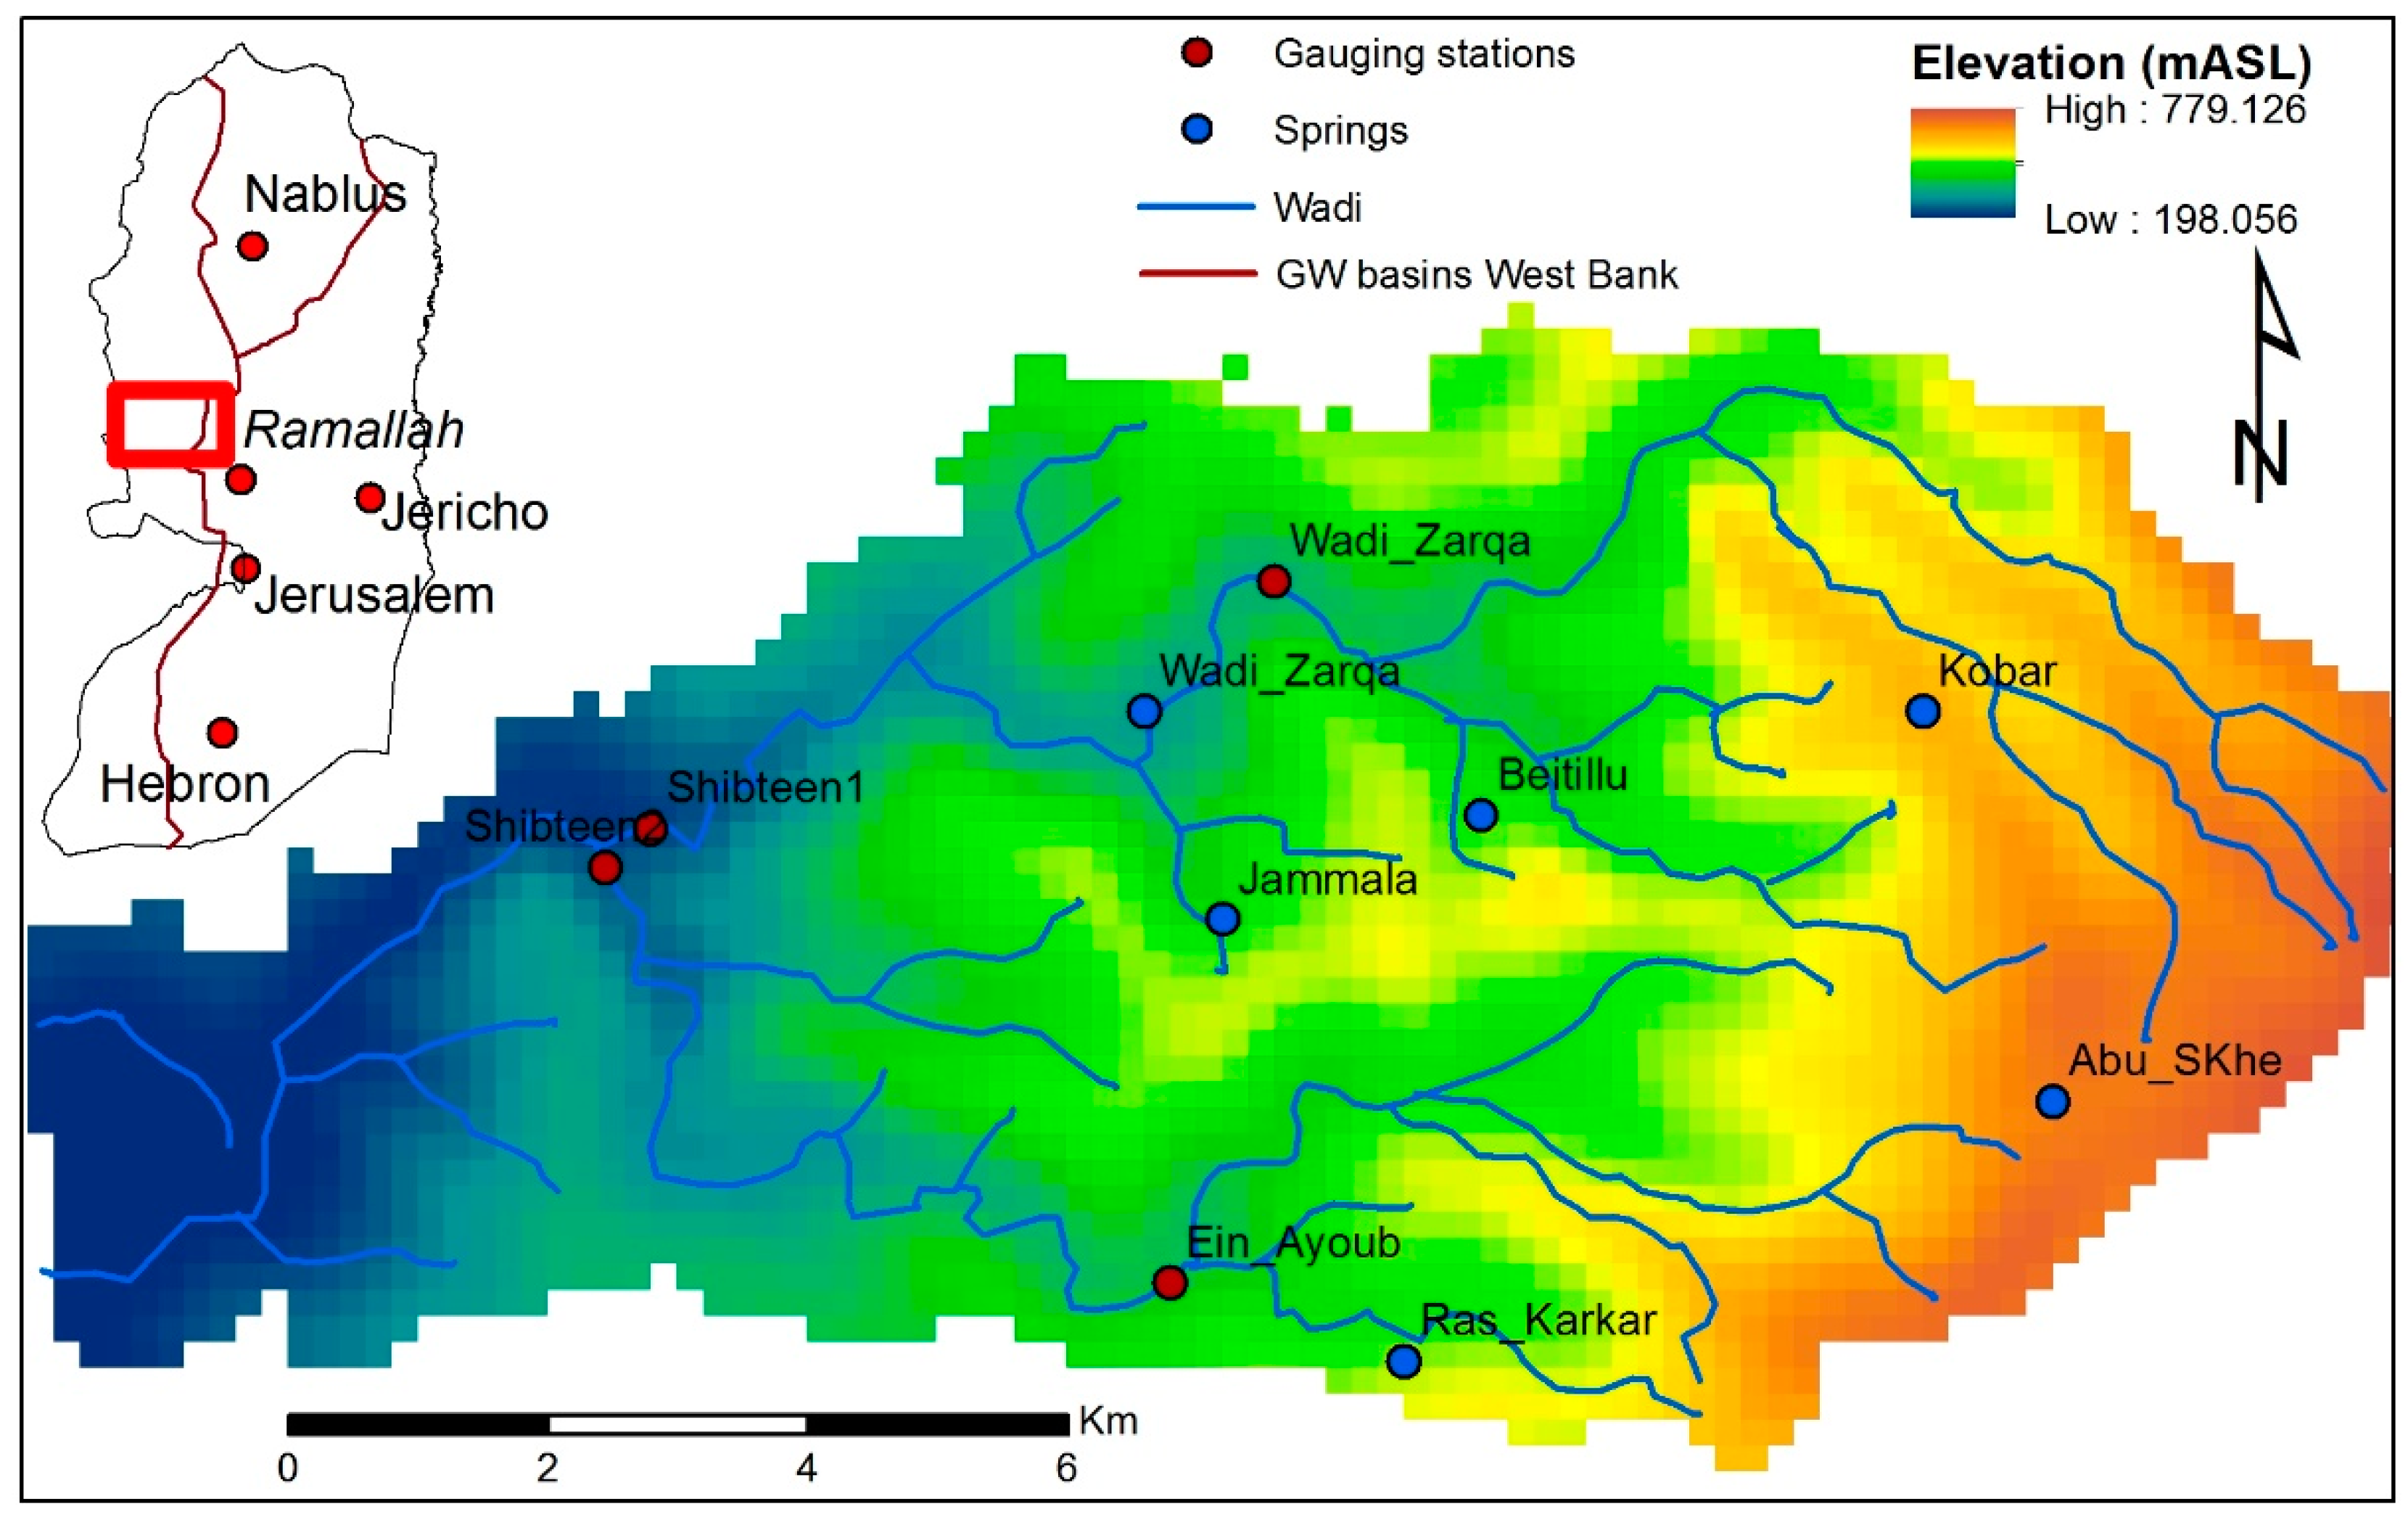
2.1. Study Area

The catchment lies in the Western Aquifer Basin and is situated to the west of Ramallah city (Figure 1). Land use consists of uncultivated grassland, agricultural land with natural vegetation, and olive tree plantations, along with some isolated urban areas. These land-use types are evenly distributed throughout the Natuf catchment wherever soil cover is present. The soil cover on valley sides is variable and comprises small pockets of stony soil in an otherwise rocky terrain. The valleys are largely floored by alluvium.
The overall catchment area is 103 km2 and includes outcrop of the two main limestone aquifer systems, the Lower and Upper aquifers, in the Western Aquifer Basin [6].

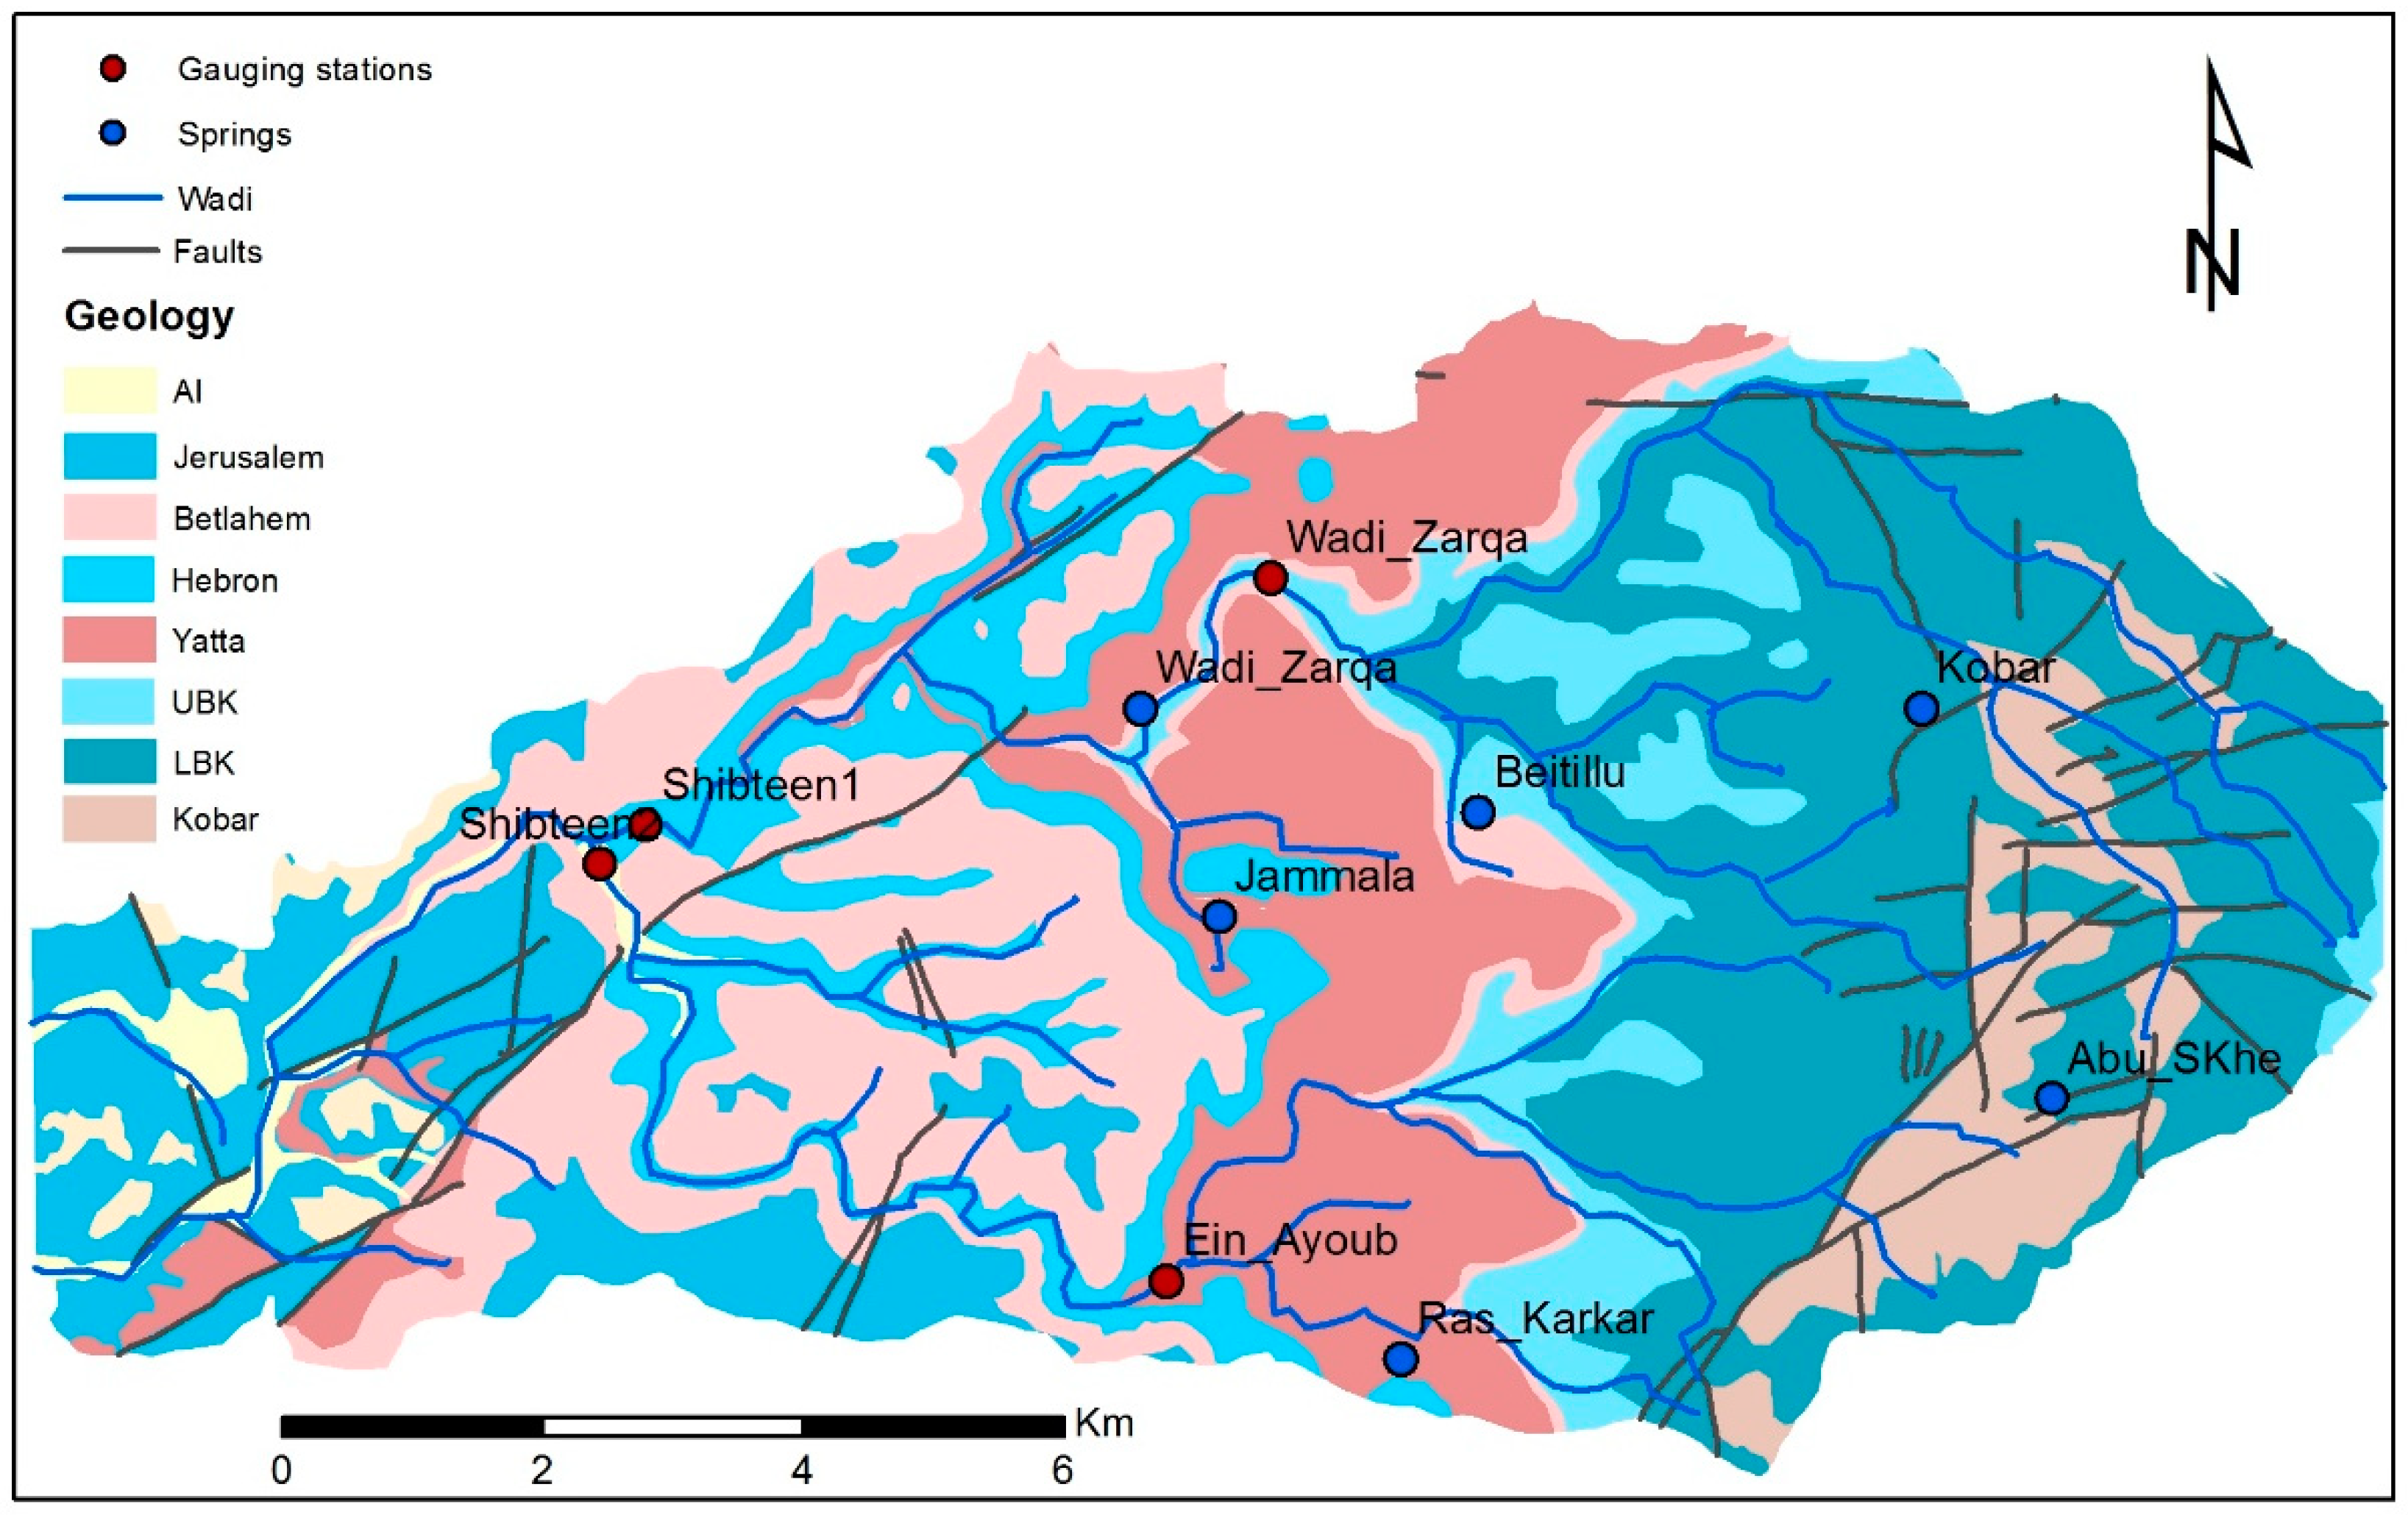
2.1.1. Geology and Hydrogeology

The Wadi Natuf catchment is situated on the western limb of the Judean Anticline (Figure 1). The oldest rocks outcrop at the core of the anticline with younger deposits distributed down the limb, while the whole sequence dips steeply to the west. The uppermost part of the Wadi Natuf catchment coincides with the outcrop of the Cretaceous Upper and Lower Beit Kahil Formations (Figure 2 and Table 1). The Lower Beit Kahil Formation comprises dolomite over karst limestone, and the Upper Beit Kahil Formation comprises reef limestones over dolomite interbedded with marl horizons. Above this and outcropping almost north–south across the central part of the catchment are the marls and clays of the Yatta Formation. The lower western part of the catchment comprises the karstic dolomite of the Hebron Formation with the younger soft dolomite and chalky limestone of the Bethlehem Formation exposed to the west and the dolomites and limestones of the Jerusalem formation exposed at the lower end of the catchment. A small proportion of the catchment is covered by alluvial deposits. At outcrop, the limestone is karstic.
The hydrogeological system includes the Lower Aquifer and the Upper Aquifer which are hydraulically isolated from each other by the Yatta Formation which forms a leaky aquitard [19] (Figure 2). The Lower Aquifer comprises the Lower and Upper Beit Kahil formations, and the Upper Aquifer comprises the Hebron, Bethlehem, and Jerusalem Formations. The unsaturated zone in the aquifers is thick and the water table is between 100 and 150 m below the ground surface throughout much of the Natuf catchment except where spring discharges occur from perched aquifers and where there is hydraulic contact with wadi bottoms (see Figure 2 for the location of the main spring groups). For these reasons, the groundwater catchment may be quite different from the surface water topographic catchment.

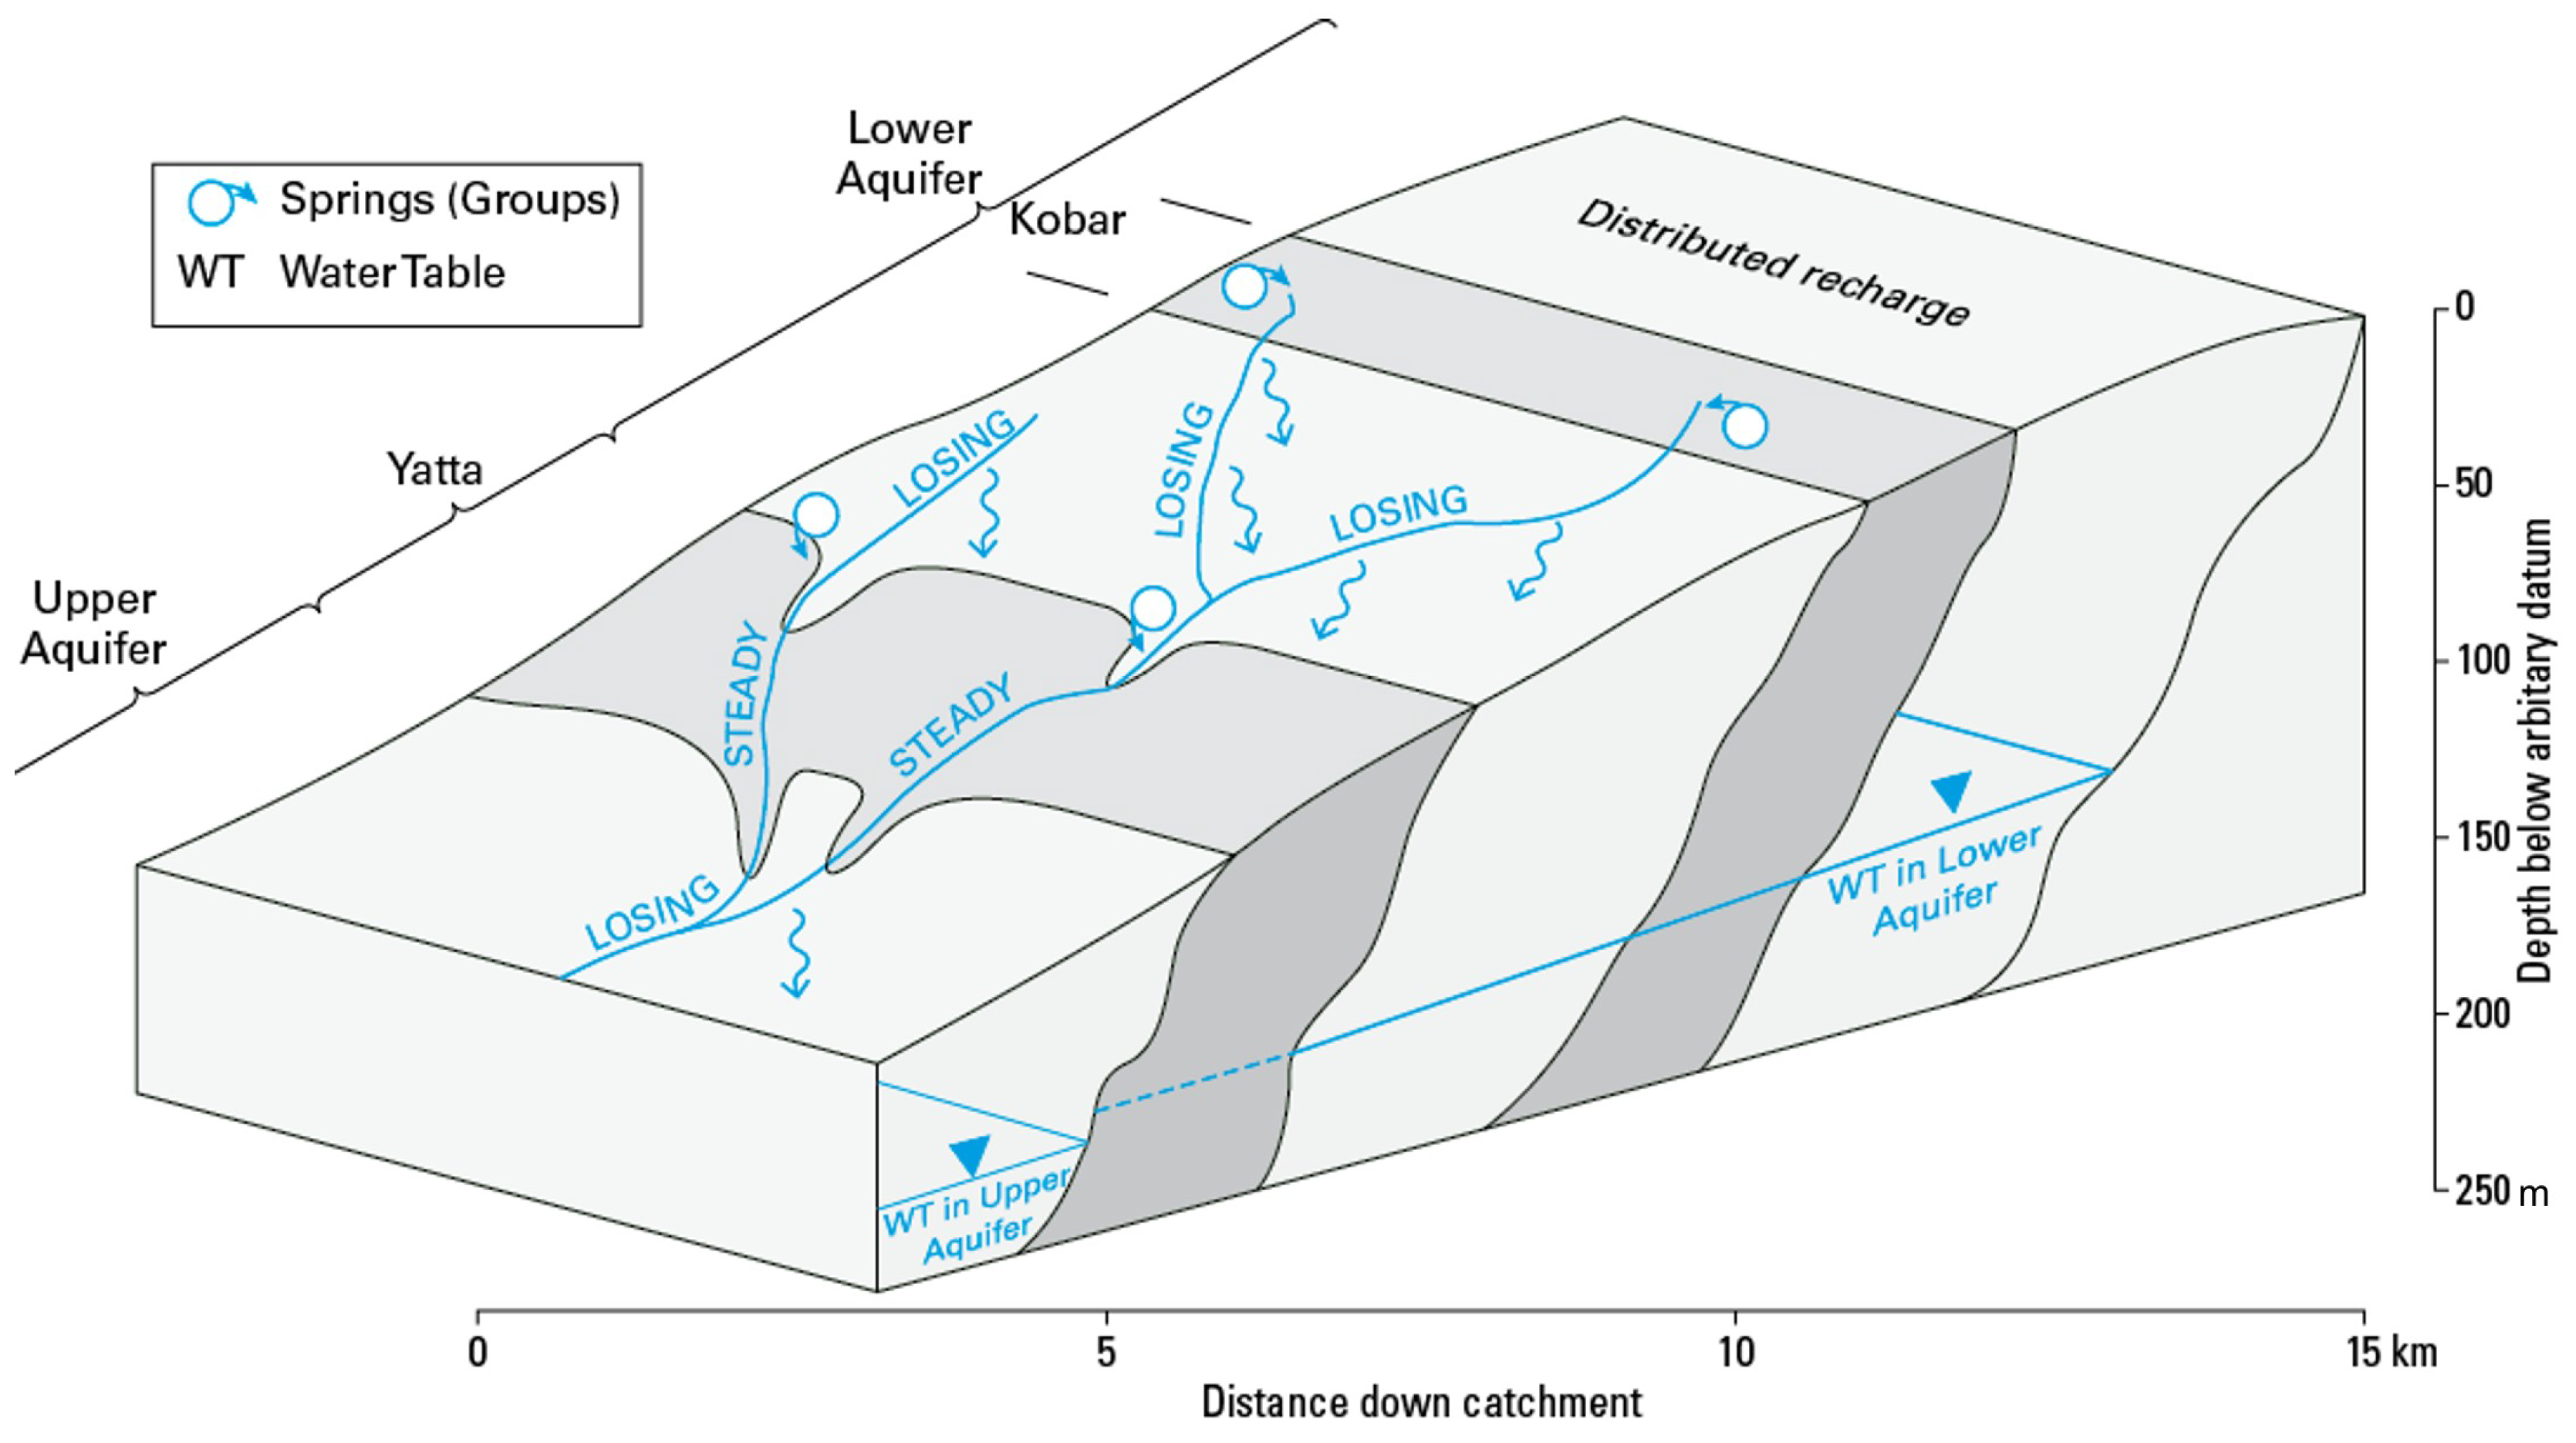
2.1.2. Recharge Processes in the Wadi Natuf

In humid environments, conventional soil moisture deficit analysis is commonly used to estimate recharge [21]. In semi-arid areas such as the Wadi Natuf, other approaches such as a wetting threshold approach better replicate conditions when rainfall over steep rocky slopes generates runoff or infiltration [25]. In both cases, the recharge potential is greatest where soil and vegetation are sparse [14]. Recharge in arid and semi-arid karstic environments occurs to a large extent during intensive but intermittent rainfall events, with temporary ponding of rainwater encouraging percolation through cracks, fractures, and solution features [26]. Potential evaporation exceeds rainfall at all times other than periods of intense rainfall, and long-term average meteorological data bear little relationship with actual recharge [18].
It is also important to distinguish conceptually between potential recharge and actual recharge, that is, flow leaving the base of the vadose zone and arriving at the water table [27]. In areas with a thick, heterogeneous, and karstic unsaturated zone, as encountered in the Wadi Natuf, it is important to make this distinction, as actual recharge is usually very different from potential. The processes operating in the unsaturated zone mean that direct and indirect recharge can be highly modified both spatially and temporally [11].
The main outcrop areas are karstic and devoid of significant soil cover. Rain may fall over exposed rock or available soil and vegetation, and as the system reaches a specific wetting threshold, both runoff and infiltration may occur [25]. Soil-based rainfall recharge also occurs where there is sufficient soil cover, particularly in the western part of the catchment where a conventional soil moisture deficit approach can be applied.
Most wadis (Figure 1) are sourced both by runoff and by spring flow, although runoff occurs only during and immediately following significant rainfall events [11]. Longer-lasting spring-fed reaches of wadis occur in Wadi Zarqa, one of the tributaries of the Natuf. Surface water flow in the wadis maybe influent to the groundwater system and provide indirect recharge [11]. The role of the thick unsaturated zone in the main aquifers (up to 150 m) is poorly understood, but routing of unsaturated zone flow to the water table may result in lateral transport for some distance; thus, a calculation based on surface measurements may not produce a realistic value of recharge at depth if based on vertical flow only.
Wadi losses are partly dependent on the geology beneath the wadi bed [11]. The unsaturated zone is significant (up to 150 m); thus, wadis mainly lose water when flowing over permeable deposits, and only gain flow from runoff (overland flow) or effluent input from springs. The principal geological formations that can receive indirect recharge from the wadis are the Hebron, Upper Bethlehem, and Jerusalem formations in the Upper Aquifer, and the upper beds of the Upper Beit Kahil Kesalon in the Lower Aquifer. The poorly permeable Upper Yatta (e.g., in Wadi Dilb) and the lower beds of the Upper Biet Kahil (e.g., in Wadi Zarqa) cannot receive wadi losses, and wadi flow may accrete over these formations (Figure 2). Therefore, wadis tend to flow over the Yatta only disappearing downstream once the wadi flows onto the Hebron Formation.
There is a large number of springs (around 130 [19]) in the catchment, with an estimated LTA flow of 0.5 Mm3·a−1 (~1400 m3·d−1). The majority issue around Beitillu [28] (Figure 1) where 101 springs discharge for part of the year. The springs are small, localized components of the groundwater system issuing from perched aquifers and are of mainly good groundwater quality [29]. They provide discharge to the surface often only to re-infiltrate the groundwater system nearby. The most important formations containing springs are as follows:
  • Lower beds of the Upper Beit Kahil formation—alternating layers of marl create springs at outcrop.
  • Upper beds of the Upper Beit Kahil formation—some portions are marly with associated spring lines.
  • Lower beds of the Yatta formation—springs occur over blue clay at the base of the formation.
However, challenges in determining recharge within the catchment are great since there is a large range in topographical elevation, and the geology is diverse and includes karstic limestone (Figure 3); there are just three control boreholes.

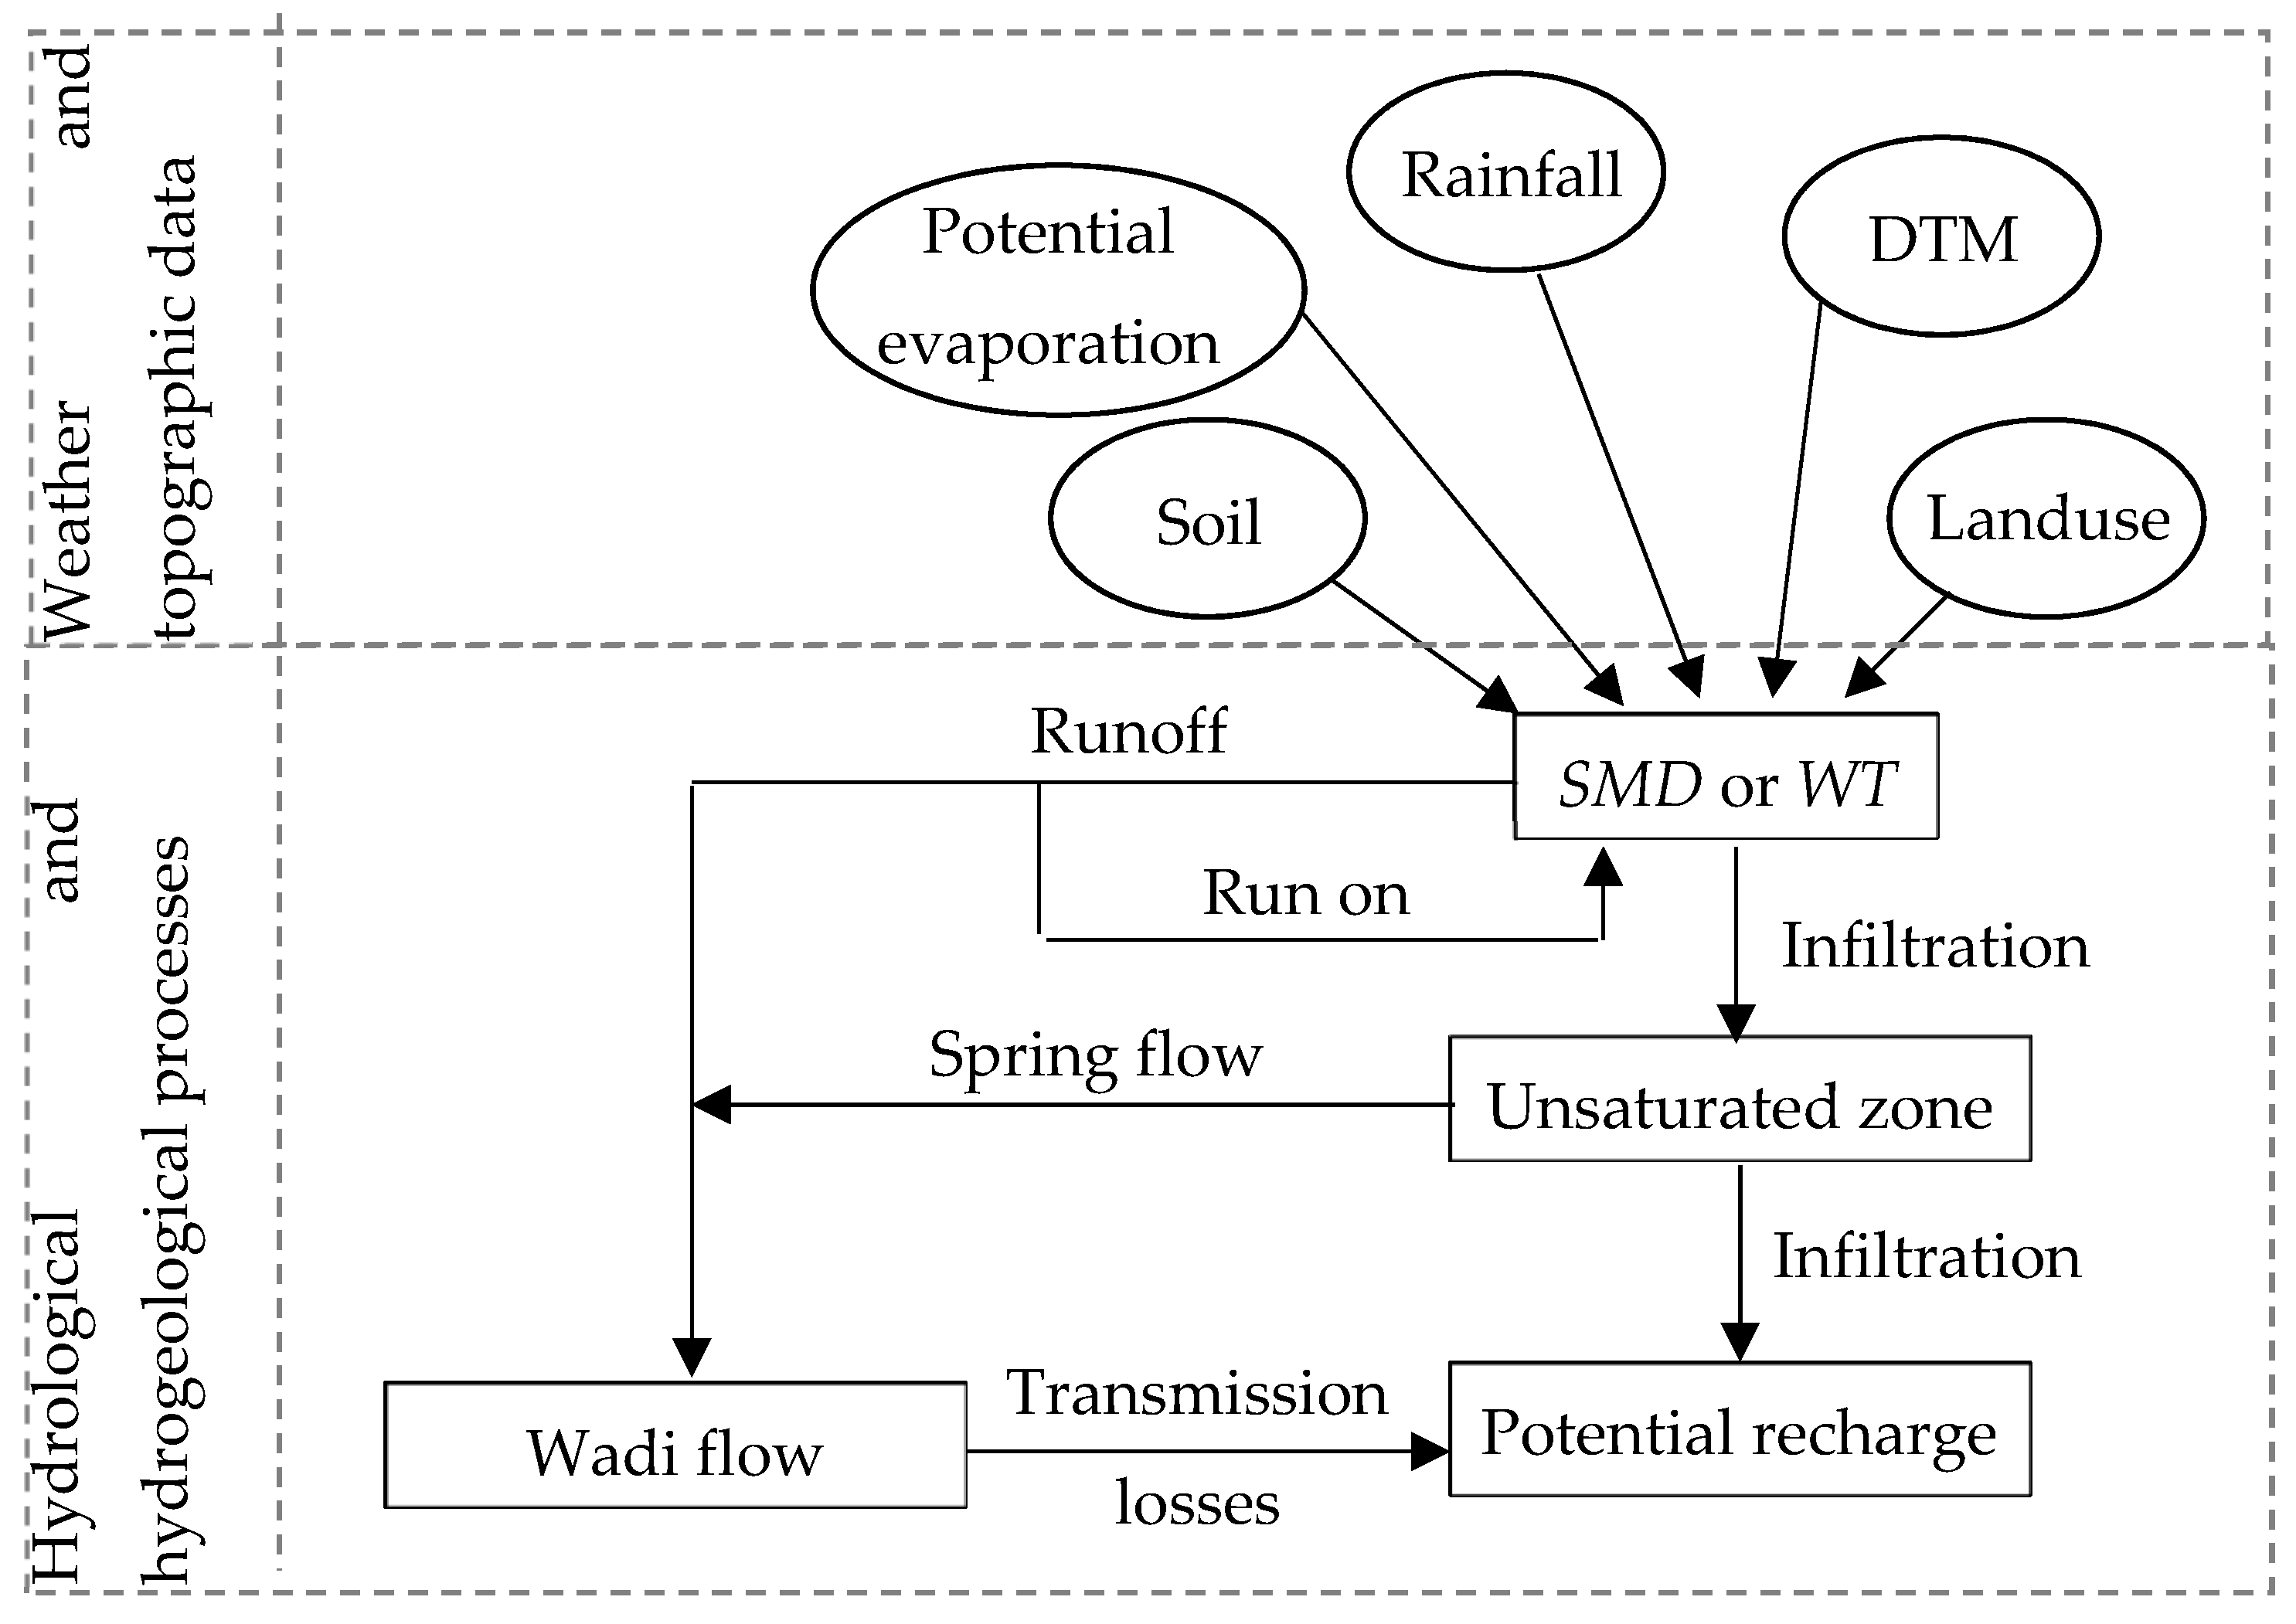
2.2. Distributed Recharge Model

The distributed recharge model, Zoomable Object Oriented Distributed Recharge Model (ZOODRM) [6,30], was used for this study. ZOODRM utilizes object-orientated techniques for including advanced numerical techniques such as local grid refinement and the flexibility to add and remove mechanisms (or processes) as objects. ZOODRM can simulate five types of soil and unsaturated flow process that result in recharge, three of which were used for this study: soil-based recharge (direct recharge), runoff to surface water systems and subsequent leakage into the unsaturated zone (indirect recharge), and routing in the unsaturated zone to springs leading to surface water leakage into the unsaturated zone (indirect recharge). These mechanisms were tested by application in a range of climatic conditions and locations around the world, including China [31], the Middle East [32], and Europe [33,34].
The distributed recharge model calculates recharge at appropriate points over the model grid. Typically, a daily time step is used for the recharge calculation, with the output supplied as monthly averages. Objects represent real-world entities such as soil objects and wadi objects. The structure of the model uses grid and node objects, and the recharge calculation is undertaken within a node object. These node objects are held, in turn, within a grid [6], and grids can be nested to increase resolution in critical areas.
The recharge calculation to be made at each node needs to be pre-selected. Two methods are incorporated into the model: the soil moisture deficit (SMD) method and a soil moisture balance approach that is suitable for semi-arid regions—the wetting threshold (WT) method. The SMD method calculates actual evaporation (AE) using the potential evaporation rate (PE) and is based on the soil moisture deficit (SMD) value in relation to the values of two parameters, the root constant (C) and the wilting point (D), which represent crop characteristics. Runoff (RO) is calculated as a fraction of the rainfall (R) and using a runoff coefficient (ROC). Effective precipitation (Reff), which is the difference between the rainfall, potential evaporation, and runoff, is then calculated. If the effective precipitation is positive, the SMD decreases. Potential recharge (PRech) occurs in this case if the SMD is zero. If effective precipitation is negative, the SMD increases [35]. Table 2 shows the SMD algorithm where is a factor (<1.0) specifying the reduced crop evapotranspiration rate when SMD falls between C and D; n is the current time step.
The WT method is based on sprinkler tests carried out near Wadi Natuf [25]. These showed that runoff and recharge only occurred after the system achieved a set wetting threshold. In this method, a water depth (WD) representing soil storage is defined. When WD becomes equal to the soil wetting threshold (ST), excess rainfall water (EW) is split into potential recharge and runoff based on a runoff coefficient. Table 2 shows the wetting threshold algorithm (the variables are defined above).
Daily rainfall is input to the model as rainfall time series combined with Theissen polygons or grid files exported from ArcGIS. Each grid file represents a single rain-day on which precipitation occurred.
The recharge model consists of two grids [6,30], both storing node objects; one is used to perform the soil-based recharge and surface runoff processes, and the other is used to perform the processes in the unsaturated zone. Runoff is routed using a digital terrain model (DTM). The DTM is processed to provide directions of slope on the cardinal points of the compass. The nodes are linked to create routing pathways, and the runoff is calculated by the nodes is routed to wadis, whereby wadi flow can also be leaked to the underlying aquifer via the unsaturated zone [6].
Each wadi node has an associated set of nodes via which it receives runoff. The model links wadi nodes with recharge nodes according to surface aspect directions. Runoff generated from these recharge nodes is then routed to the wadis. A lag routing method [36] is coded in the model to account for the time delay that can be observed in the propagation of a flood wave in wadis. This method approximates the outflow from the wadi node using a simple dual parameter exponential equation as shown in Equation (2).
Outflow = Inflow ( 1 e ( s u r l a g / t c h ) ) ,
where t c h is the time of concentration and s u r l a g is a calibration parameter; t c h is calculated from Manning’s equation assuming that the channel has a trapezoidal cross section with 2:1 side slopes and a 10:1 bottom width-to-depth ratio.
When springs are connected to unsaturated zone nodes, a proportion of the recharge arriving at each node is routed to the spring. Unsaturated nodes are connected to spring nodes automatically, provided that they are at a higher elevation than the discharge point. However, there needs to be additional rules that define the spring catchment for specifying which nodes connect to which spring. These depend on the area of outcrop providing the recharge that is diverted to the spring, a maximum distance from the spring that a node can connect with, and a condition to prevent nodal connections passing above ground level across a valley. Groundwater velocity (VGW) has to be specified to ensure a realistic elapsed time to reach the spring discharge. Figure 4 shows an illustration of the different processes applied in this study.

Model Parameterization

Two series of model simulations were undertaken. Series 1 used daily rainfall data for the period of January 2003 to December 2004 and used data collected during the initial field program including soil moisture. Series 2 used a storm which occurred in February/March 2009.
A grid of 200-m square cells was used to represent Wadi Natuf. The selection of the cell size was a compromise between accuracy of representation of features such as wadis, and availability of field data that define the features. There are nine available rainfall stations in and adjacent to Wadi Natuf. Theissen polygons were used to interpolate between stations. The recharge model requires monthly potential evaporation (PE) data. Average monthly PE was measured at six meteorological stations in the West Bank, of which the nearest is at Ramallah, which in turn is climatically similar to Hebron (Table 3).
Land use was acquired from scanned maps and reports [37]. The lack of soil cover elsewhere suggests that soil-based recharge processes are subordinate to wetting threshold processes. Therefore, the wetting threshold method was chosen, and a WT value of 40 mm was applied. While terraces built for olive cultivation reduce runoff, they are not easy to represent in the model; the same runoff coefficient was applied, therefore, everywhere within the catchment. There were six main spring groups included in the model (Table 4). Spring nodes and unsaturated nodes separated by distances larger than 5000 m were not allowed to connect in the model. A single value for groundwater velocity of 40 m·h−1 determined the travel time to reach the springs.
Two variables control the generation of runoff as it is routed to the wadis. Firstly, a runoff coefficient is defined that controls the proportion of rainfall that contributes to runoff at any recharge node. Secondly, the overland loss coefficient, which determines the amount of overland runoff lost per meter between each node is specified. The runoff coefficient was set to 50% at all nodes, and the overland loss coefficient was set to 0.0005 m−1. This value leads, in the case of a 200-m square node, to 1% of the water passing over a node to be lost at that point.
The current conceptual understanding concerning infiltration from wadi losses is that these occur over all geological formations, with the exception of the Yatta. Therefore, no losses are allowed from wadis where the Yatta crops out, while a loss coefficient of 10.0 is specified for all other geological outcrops. All parameter values listed above were obtained by manually calibrating the recharge model, i.e., using a trial-and-error calibration approach, to produce the observed wadi flows.

3. Results

The results from the two series of runs are presented in Figure 5, Figure 6, Figure 7 and Figure 8. The results presented are comparisons between modeled and measured soil moisture (Figure 5 and Figure 6) for which the model was run from 20 January 2004 to 3 March 2004 on a daily time step and using the simple soil moisture deficit recharge calculation method. The results also include a comparison between simulated and observed flow hydrographs (Figure 7 and Figure 8), for which the model was run from 27 February 2009 to 5 March 2009 on an hourly time step.

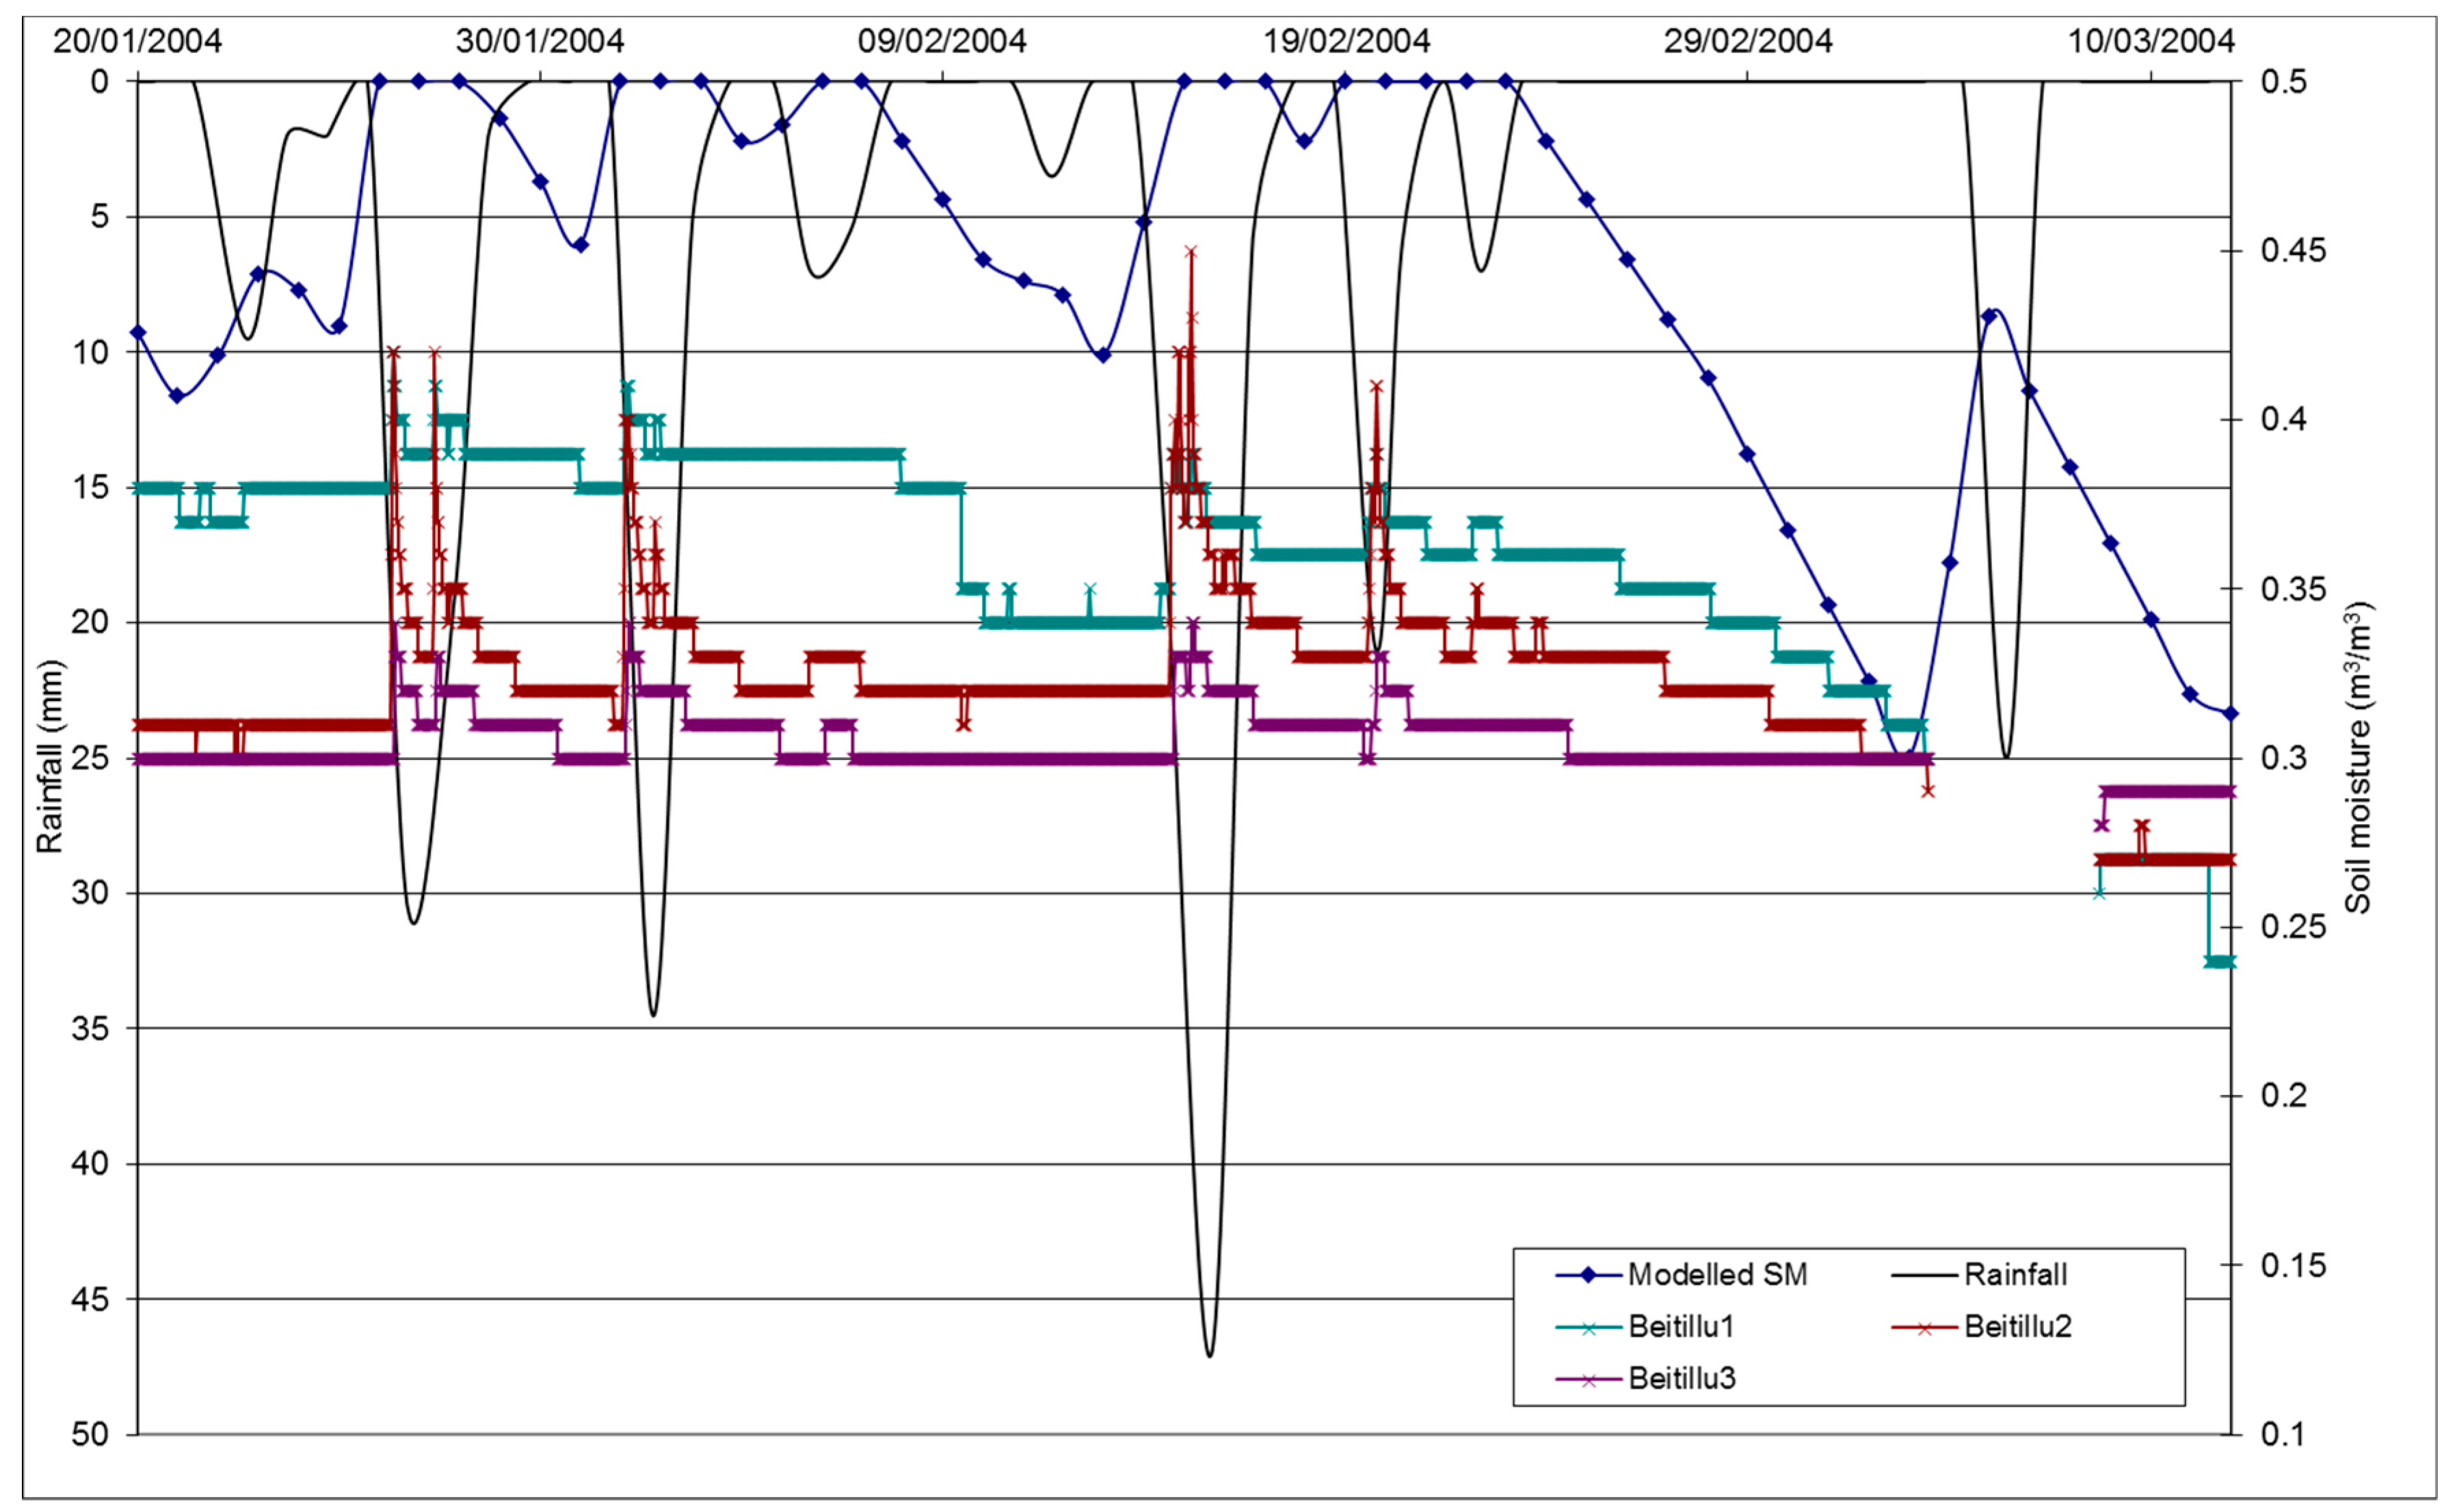
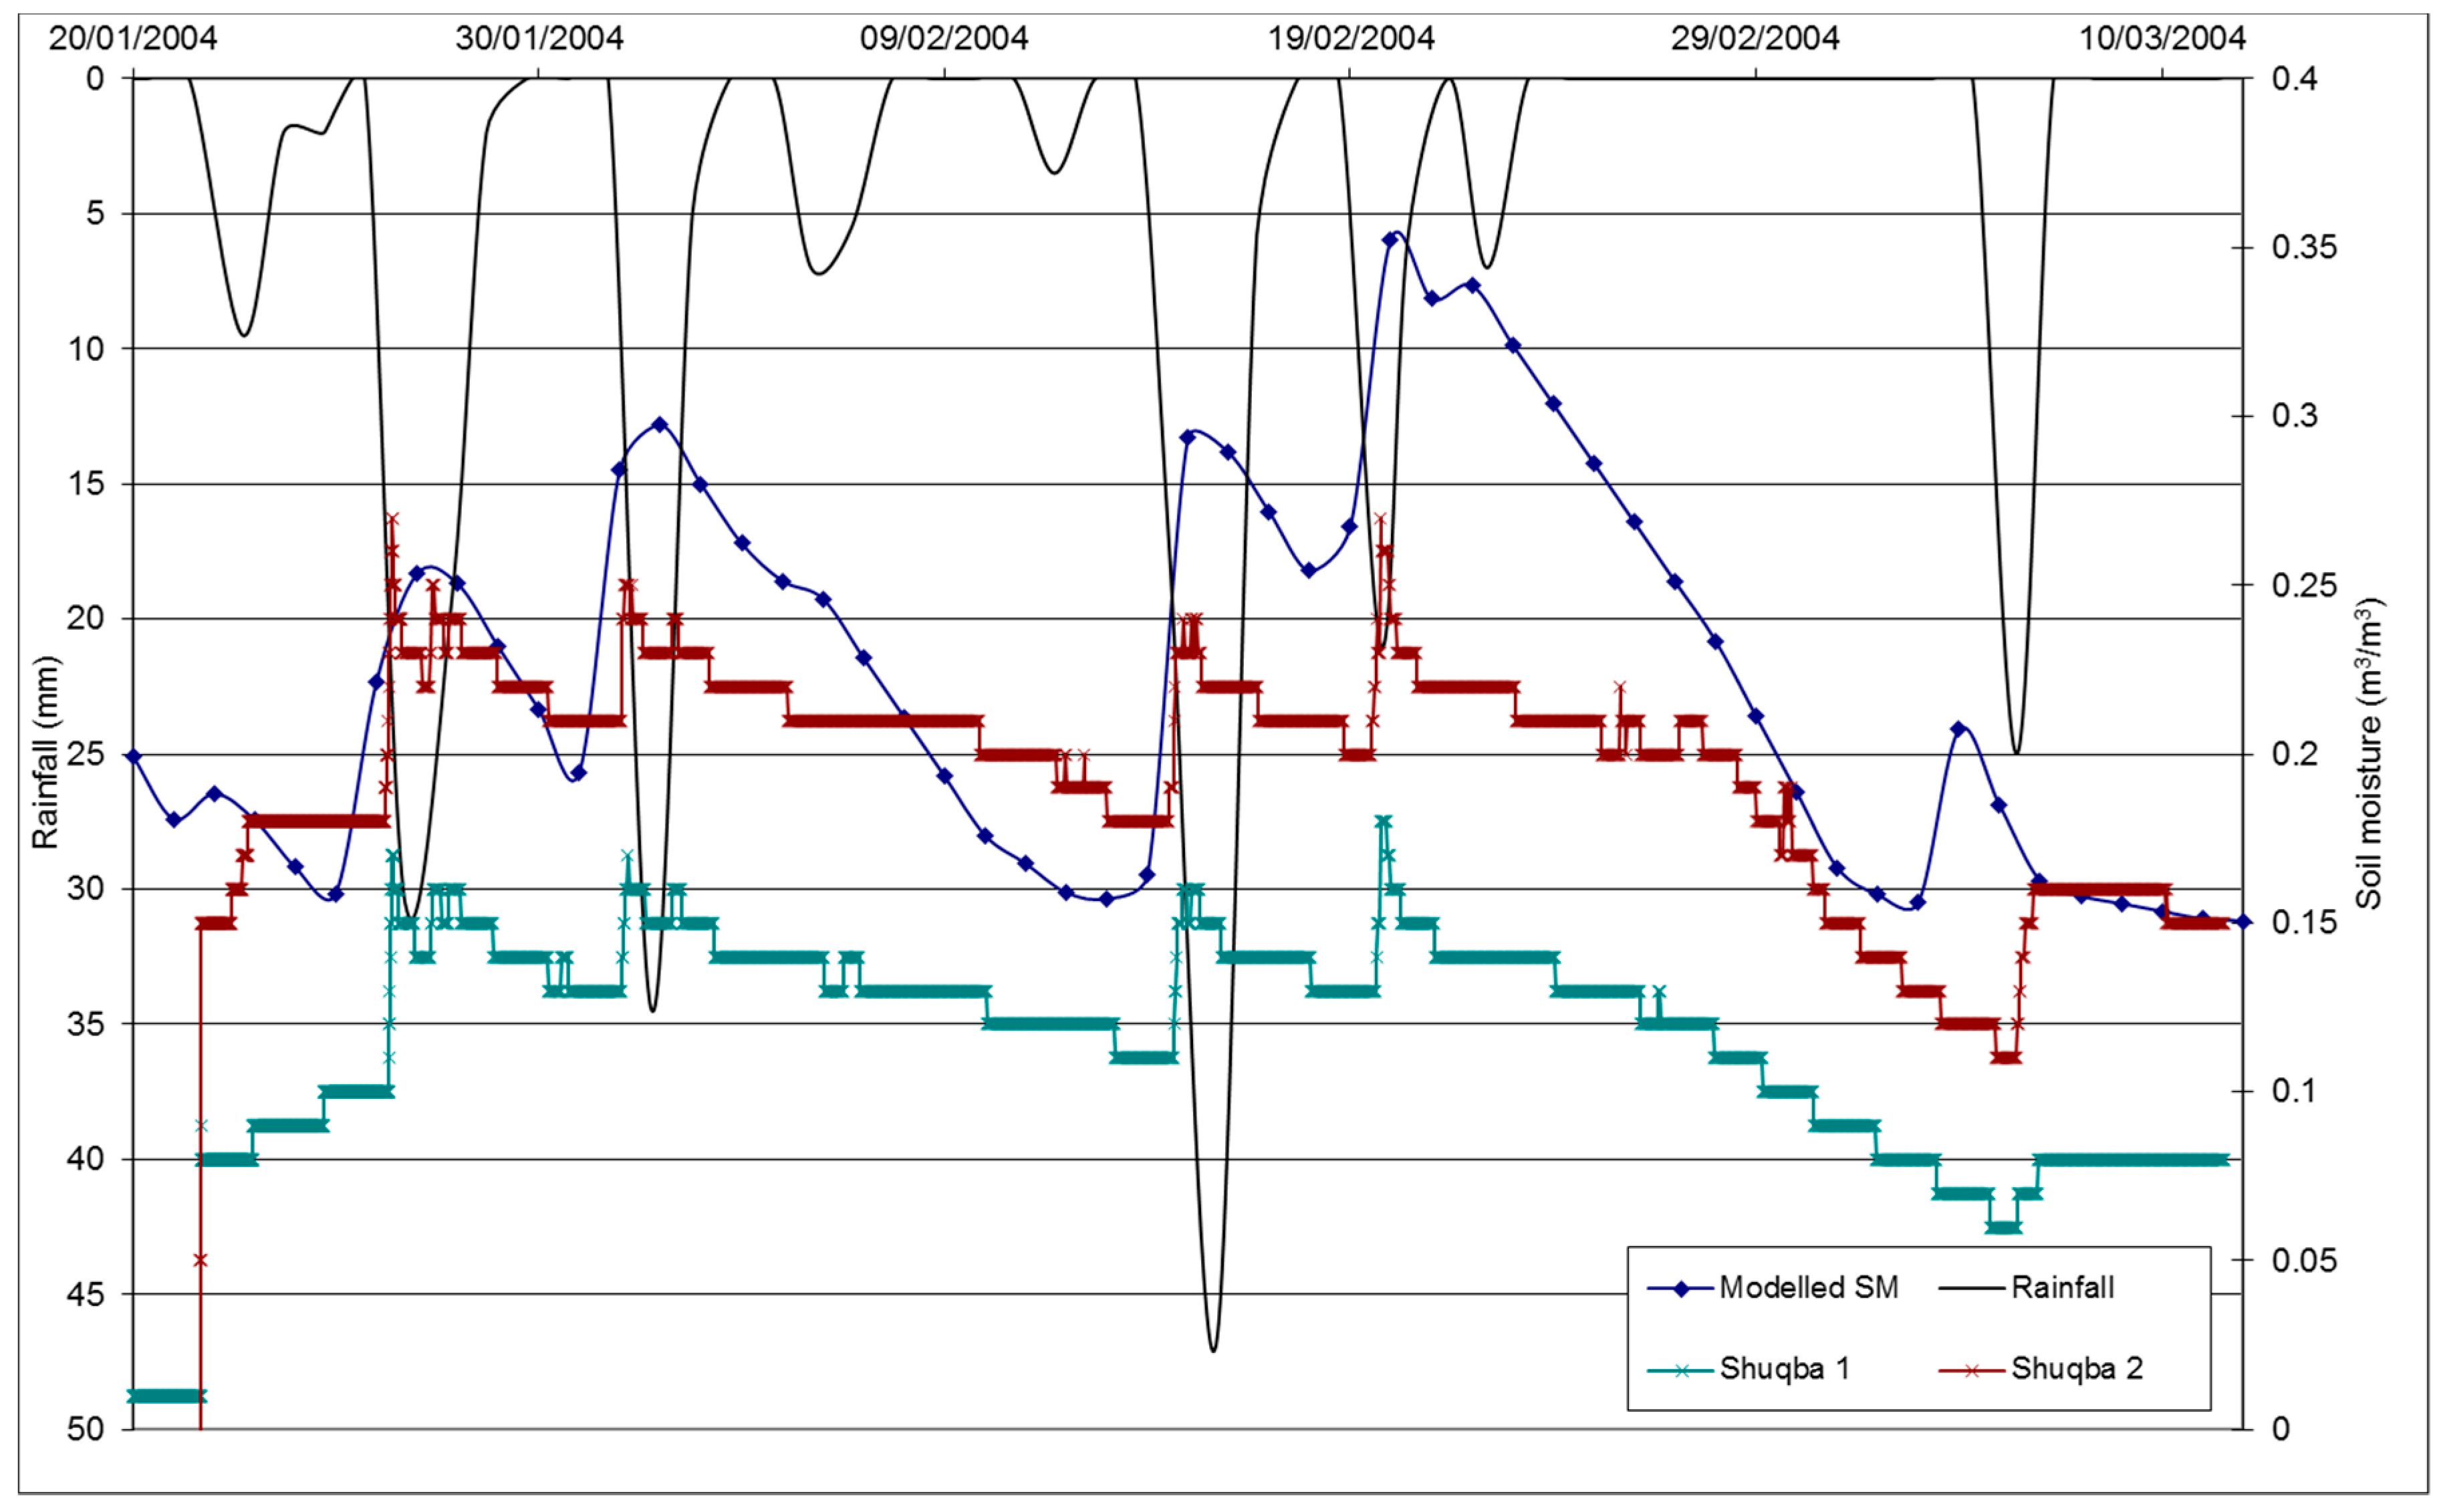
3.1. Series 1—Soil Moisture

The simple soil moisture deficit [6] and the wetting threshold methods [35] were applied to estimate the spatial distribution of recharge over the whole West Bank. This was repeated to compare the recharge values calculated using the SMD and WT methods at the Natuf catchment scale. A range of WT (15, 30, 45 mm) values were used and recharge values were compared to the recharge calculated using the SMD method with a representative land use having a root constant of 300 mm and a wilting point of 750 mm. The WT method produced a higher recharge value (746 mm·a−1 with WT of 15 mm) than the recharge value produced by the SMD method (475 mm·a−1).
The moisture content of the soil measured at Beitillu (see Figure 1) was recorded at three different depths (0.25 m, 0.5 m, and 0.75 m) and at Shuqba at two depths (0.25 and 0.5 m). The SMD method includes a soil moisture component and this can be compared to the observed data. Figure 5 and Figure 6 show a plot of the variation of the soil moisture content with time against the rainfall time series at Beitillu and Shuqba, respectively. This shows that the soil moisture content at Beitillu is higher than the moisture content at Shuqba, although the time series data for the two sites show similar behavior. A sudden increase in the moisture content is observed when rainfall occurs, and a slow decrease in the moisture content is observed during the dry period.
Figure 5 and Figure 6 also show the time series for the soil moisture deficit simulated at two nodes in the model representing the Beitillu and Shuqba Sites. These were compared with the field observations, using the SMD calculation method. Although the same land-use types were defined at the nodes representing these sites, Figure 5 and Figure 6 show that the variations of the SMD at Betillu were smaller than the variations of SMD at Shuqba. This means that higher soil moisture contents were maintained at Beitillu than at Shuqba which is consistent with observed data.

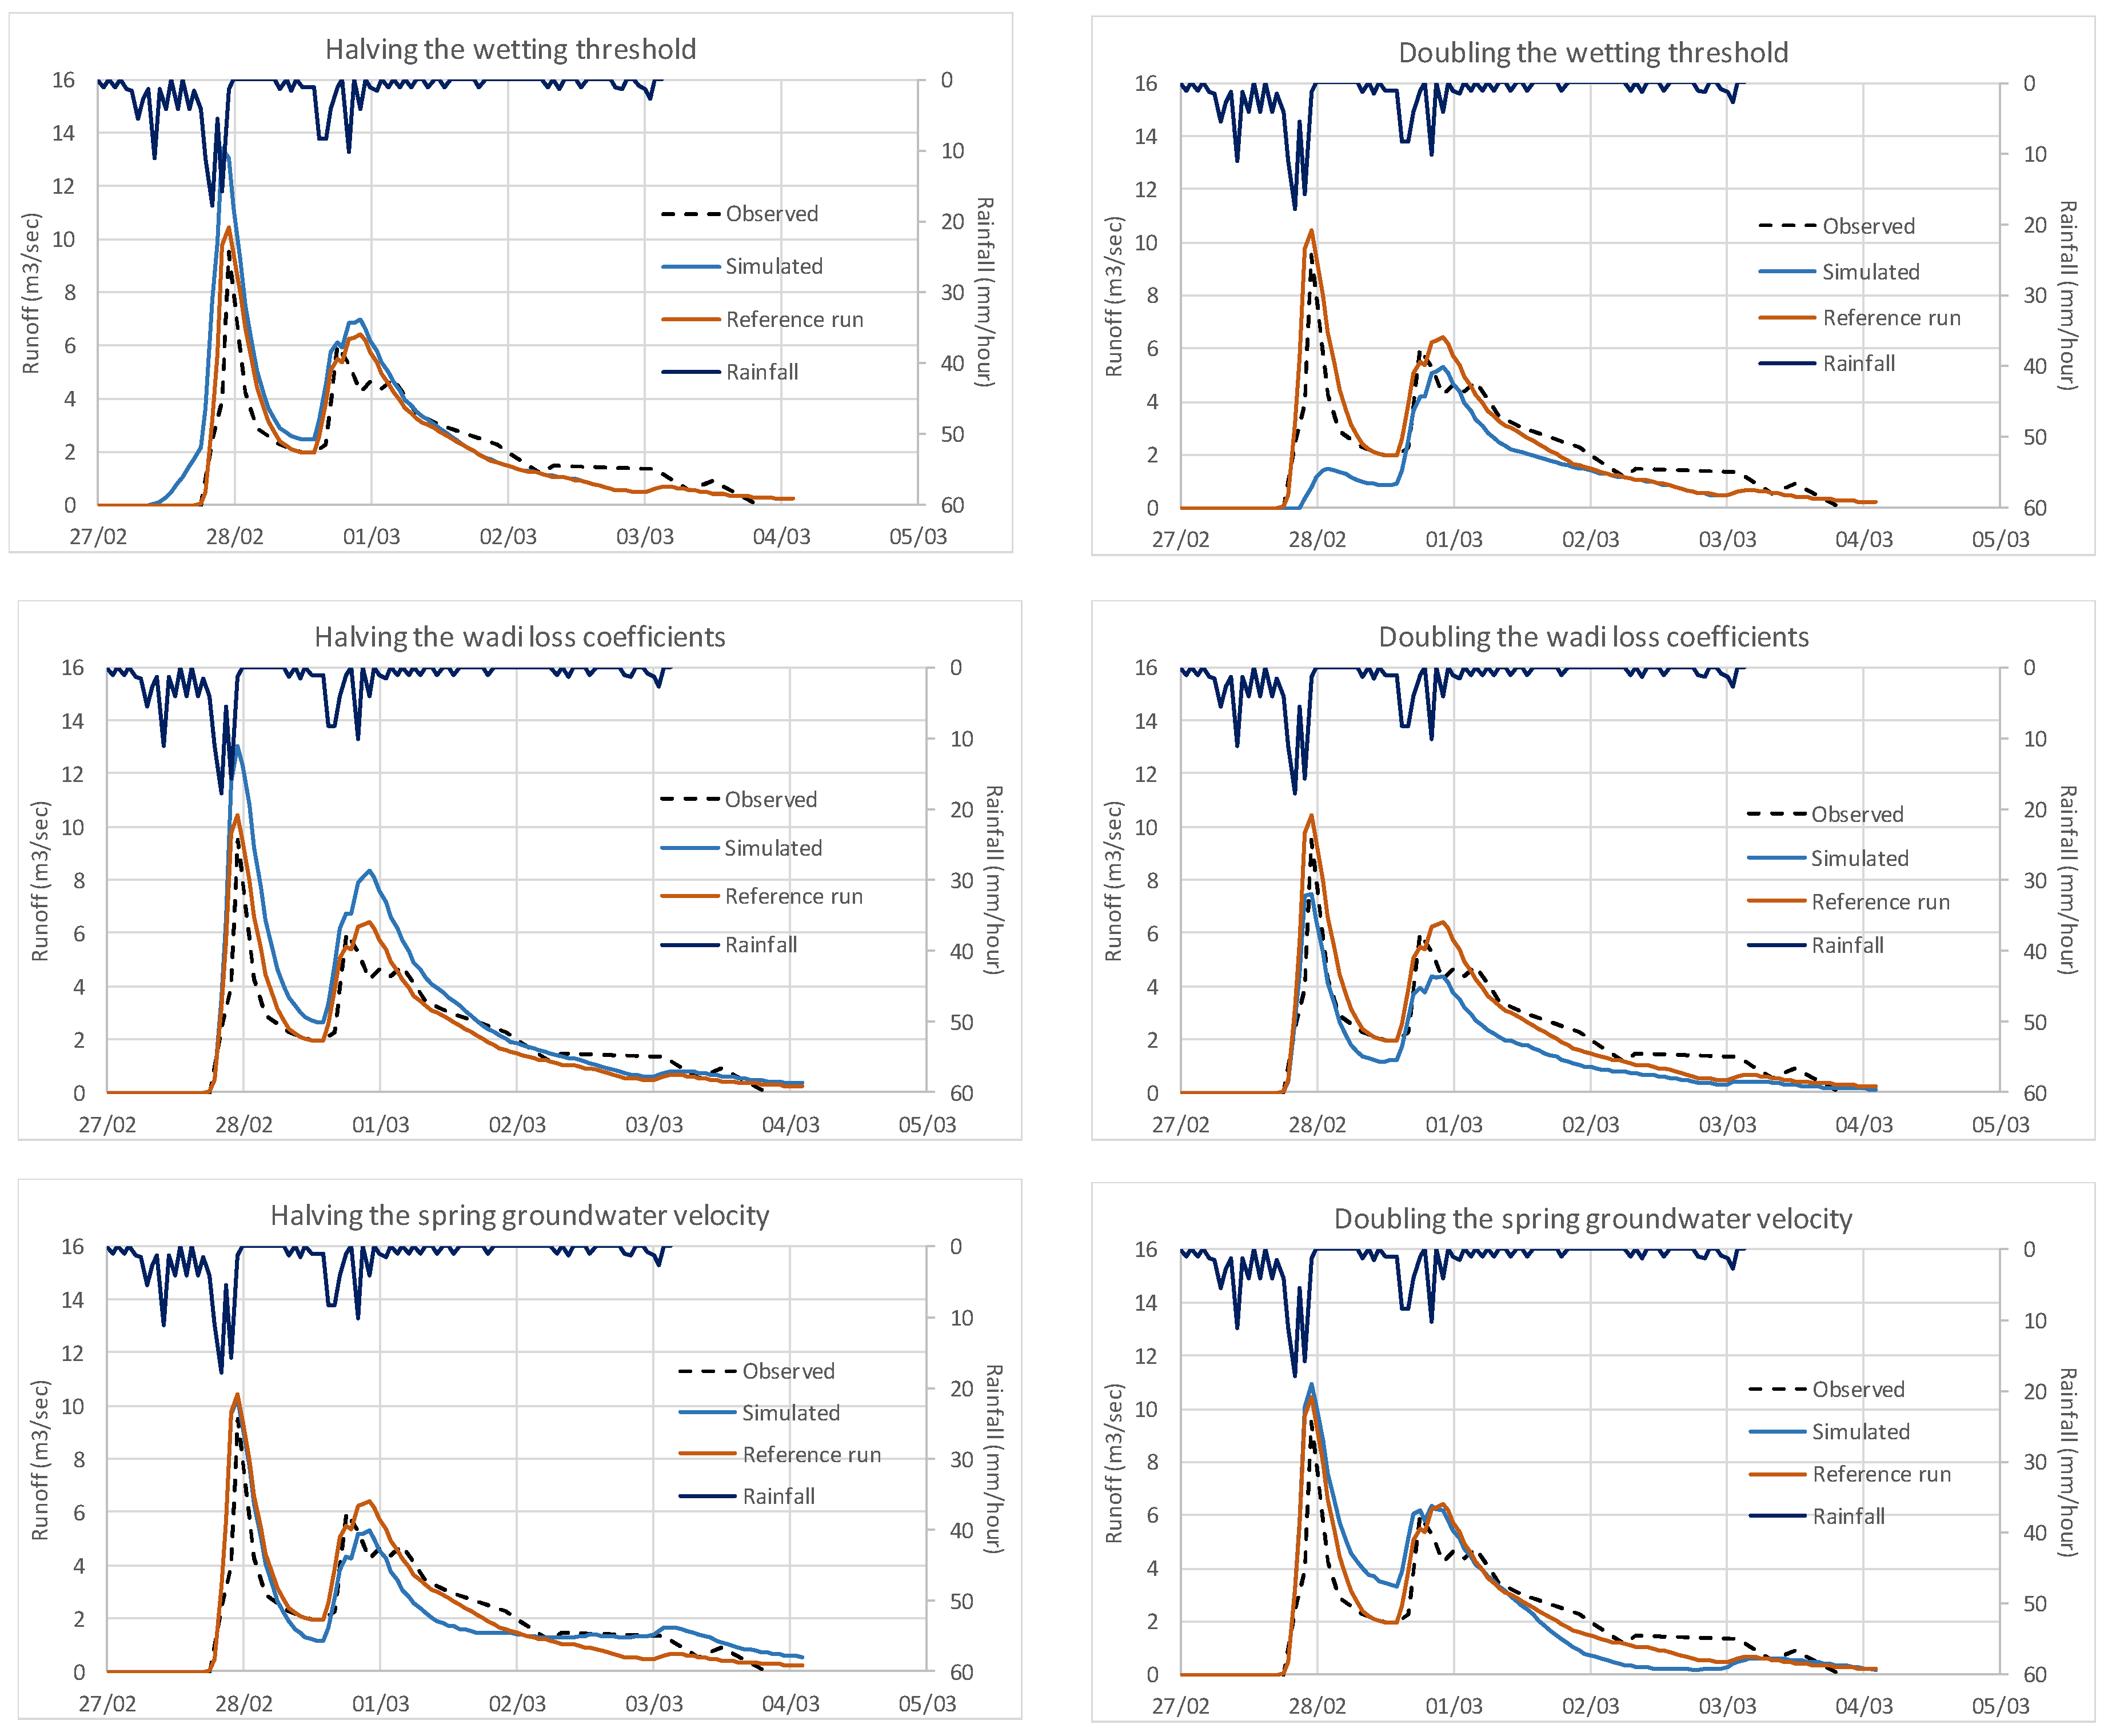
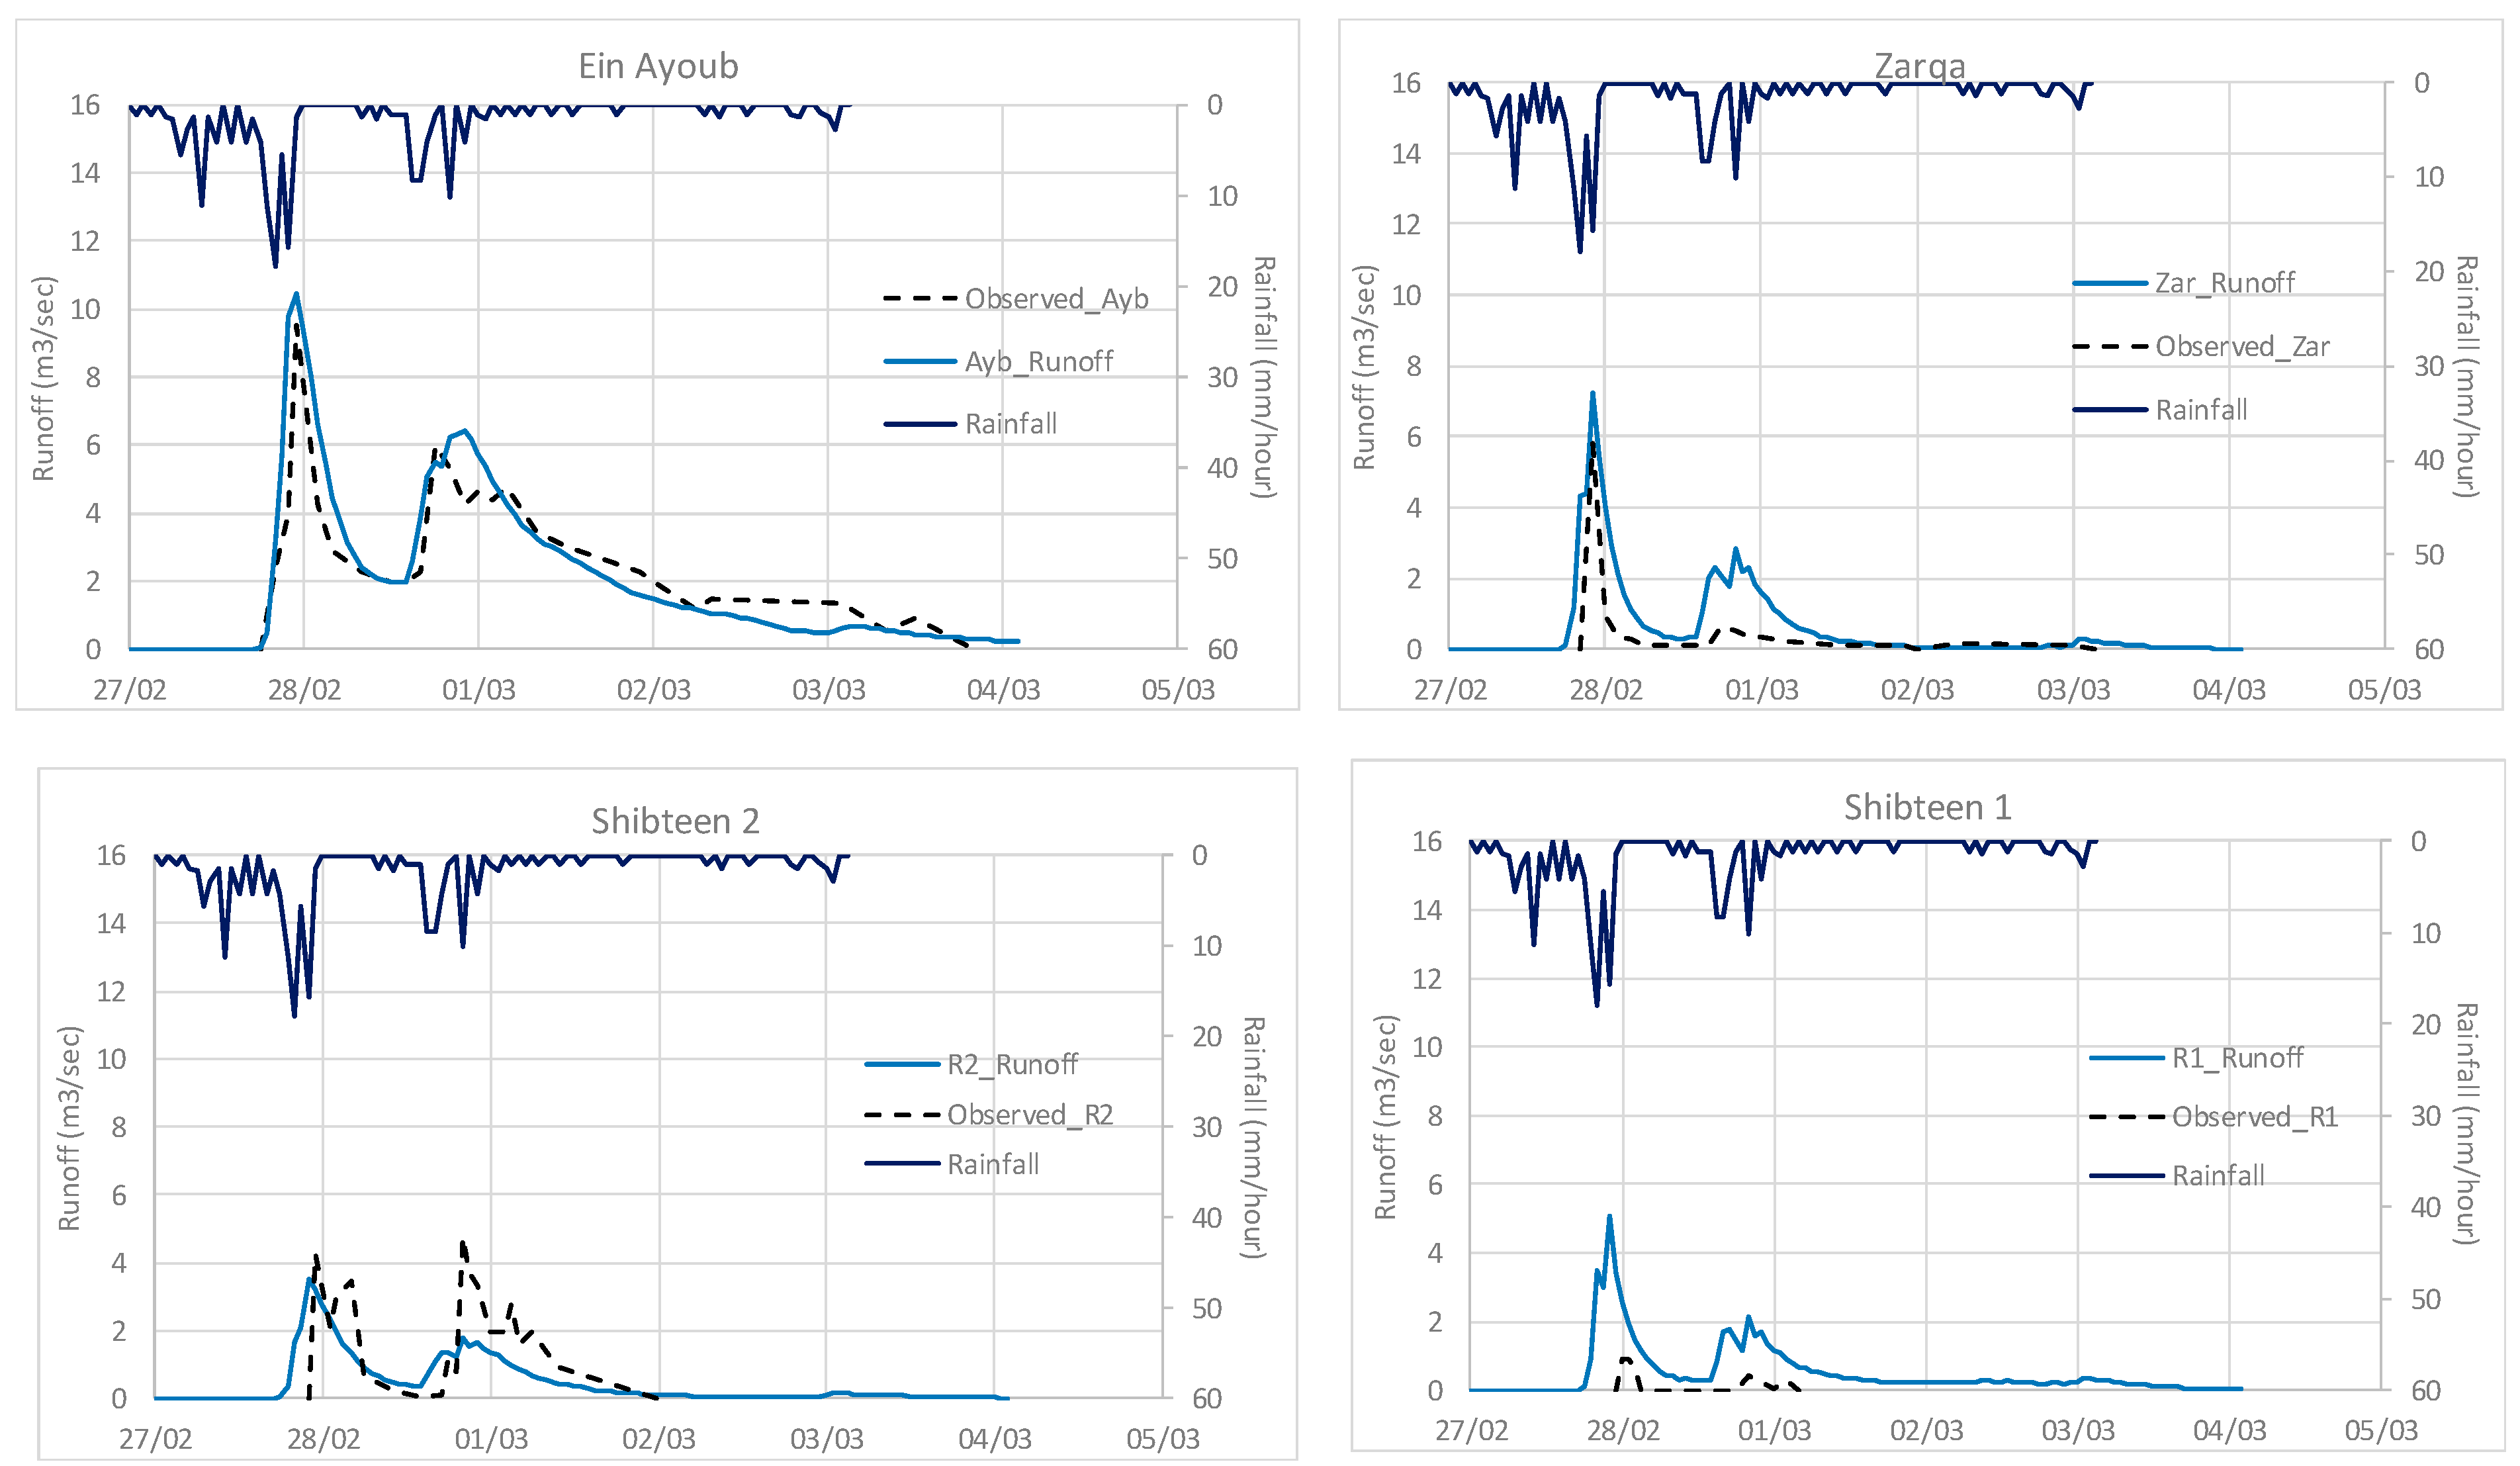
3.2. Series 2—Storm of February/March 2009

Figure 7 shows the flow hydrographs of the model response to two rainfall events in February and March 2009. Four surface water hydrographs are presented for the gauging stations shown in Figure 1. The two storms resulted in two peaks in the measured flow, which are present to a greater or lesser extent in all four hydrographs. However, there is a clear delay between the rainfall occurrence and the onset of the first storm, which is an indication that the system has to “wet up” before any flow can start occurring. The simulated runoff showed a quicker response to rainfall than the observed flows. To improve the match, the simulated flows were delayed using the lag routing method. The Manning roughness coefficient value that produced the best wave delay was approximately 0.03. This is the minimum value suggested for mountain streams [38]. Flow decreased down catchment and the peak flows in Shibteen 1 and 2 were very much lower than those measured at Wadi Zarqa and Ein Ayoub. The highest flow rate was observed at the gauge at Ein Ayoub which is downstream of the wadi as it flows off the Yatta Formation (low permeability). The reduction in flow is likely to be due to the transmission losses in the wadis [11], in which flow leaks through the wadi floor influent to the underlying aquifers.
To improve the simulation of this storm event, the model was run using an hourly time step. The model simulated the observed flows quite well, particularly for the flow at Ein Ayoub. While the first peak at the Zarqa gauging station was reproduced by the model, the second peak was over-estimated. The model slightly under-estimated both peaks at Shibteen 2 gauging station (downstream Ein Ayoub). The flow at Shibteen 1 (downstream from Zarqa) was over-estimated by the model for both peaks. This is a result of the relatively simple way the runoff and wadi losses are parameterized. Without more field observations of actual wadi losses, i.e., spot gauging along a reach to see where flows are declining, improvement of the fit between the model results and observed data may not be possible.
Table 5 shows the Nash–Sutcliff efficiency (NSE), as well as the root-mean-square errors (RMSE) between the simulated and observed time series data calculated at the four gauging stations. Table 5 and Figure 7 show that the best match between the simulated and observed time series was obtained at the Ein Ayoub gauging station (NSE = 0.68), but this quality of model performance was not maintained at the remaining gauging stations, with NSE calculated at Shibteen 2 gauging station at 0.22 and NSE at the other two gauging stations being negative.
Table 6 shows the water balance for the model summarized for the whole runtime period, where there was a total of 161.1 ML·h−1 both as inflow (Qin) and outflow (Qout). Direct rainfall recharge was 48.6 ML·h−1 (30.2%) whereas indirect recharge made up of runoff to the wadis was 57.6 ML·h−1 (35.8%), and spring flow which flows into the wadis was 8.8 ML·h−1 (5.5%). Given that the average outflow at the bottom of the catchment was only 0.4 ML·h−1, then indirect recharge was 66 ML·h−1 (41%). For this period, indirect recharge was 135.8% of direct recharge. This reflects the magnitude of the runoff combined with the perched nature of the wadis in relation to the regional water table, resulting in significant flow concentration which leaks into the vadose zone.
To understand how the parameters control the hydrograph response, a sensitivity exercise was undertaken for the wetting threshold, wadi loss coefficient, and VGW (controlling rate of movement of groundwater to the springs). Values of these parameters in the base case model were halved or doubled to understand how they affect the hydrograph at Ein Ayoub (Figure 8).

4. Discussion

The first series of results involved the application of the soil moisture deficit recharge calculation method. This method is most suited for temperate weather conditions, to estimate recharge values and to compare them with those estimated by the wetting threshold method. This exercise shows that the SMD-estimated recharge values were significantly lower than the WT ones, which demonstrates that the estimated recharge values are very sensitive to the selected recharge calculation method. However, the recharge values presented here are not representative long-term average values because the simulations considered only the wet months.
The simulated soil moisture time series at Beitillu and Shuqba showed that higher soil moisture contents are maintained at Beitillu than at Shuqba, which is consistent with observed data. The difference in the time series at these two locations is due to the application of different daily rainfall rates and to the different considerations of runoff and run-on mechanisms.
Because of the semi-arid hydrological characteristics of the Natuf catchment, and due to the land use on scanned maps [37] showing a lack of soil cover, it is suggested that soil-based recharge processes are subordinate to the wetting threshold processes. The second series of results were obtained using the wetting threshold recharge method.
The Ein Ayoub gauging station data was used to calibrate the model with the focus on reproducing the actual flow hydrograph. It must be noted that, while the model allows complex spatial distribution of hydraulic parameter values across the study area, the parameters obtained from the calibration of the model against the hydrograph recorded at Ein Ayoub were used uniformly everywhere in the catchment. This produces a good match between the simulated and observed wadi flows at Ein Ayoub (NSE = 0.68) but not at the other three gauging stations (Figure 7). Table 5 shows that the model had a good predictive capability at Ein Ayoub, but its performance was not so good at Shibteen 2 (NSE = 0.22), and at Zarqa and Shibteen 1, with the NSE being negative at the last two gauging stations. The parameter values were obtained by focusing on the hydrograph at Ein Ayoub, and model performance difficulties arose as the length of available data (flow records greater than zero) at the other gauging stations was much shorter. In addition, the amount of flow recorded at the other three gauging stations was much smaller than that recorded at Ein Ayoub. This lack of field data cannot justify the use of a complex spatial distribution of the values of the hydraulic parameters to improve the performance of the model at Zarqa and Shibteen 1 and 2 gauging stations.
The sensitivity analysis undertaken for the simulation of the 2009 rainfall event (Figure 8) demonstrates the importance of the three main processes identified in Wadi Natuf. Reduction in the wetting threshold parameter resulted in flow starting sooner, as less rainfall was required to “wet up” the system and initiate runoff. Doubling the WT required much more rainfall to occur before runoff was initiated, and significantly reduced the flow in the first peak. For both situations, the flows produced sensitivity runs which only joined with the base case after the second peak, once all the system was wetted up, resulting in the generation of runoff to the wadis.
Halving the wadi loss coefficient resulted in generally greater wadi flow as the transmission losses were reduced; doubling them had the opposite effect. Since the coefficients affected flow at all times, changes to the flow hydrograph occurred during the whole simulation period.
Halving the groundwater velocity for the springs affected the hydrographs from the recession of the first peak and increased the flow after the rainfall events occurred. This was due to the spring flow taking longer to reach the wadis and continuing to arrive after the storms abated. Doubling the groundwater velocity brought flow to the wadis more quickly, but it ceased more rapidly. This means that the flow was enhanced during the recession of the first peak and it was reduced faster after the second peak. Table 6 provides important information about the significance of the different hydrological processes described by the conceptual model which are also included in the numerical model. For example, the total runoff flow calculated over the whole of the catchment was approximately 57 ML·h−1, which is approximately 40% of the total rainfall; the total wadi flow calculated at the downstream end of the Natuf catchment was 0.4 ML·h−1. This indicates that almost all runoff water infiltrated back into the ground due to transmission losses and became potential recharge. This infiltration through indirect processes (~35 ML·h−1), together with the water discharging through the springs (~9 ML·h−1), had approximately the same volume as the volume of water infiltrated through direct recharge processes. The exclusion of indirect recharge processes from the conceptual model, as well as estimating recharge from a model that accounts for direct recharge processes only, would lead to estimated recharge values that are half the amount of the actual potential recharge.

5. Conclusions

The distributed recharge model ZOODRM was applied to the Wadi Natuf catchment to test the importance of the inclusion of indirect recharge processes to estimate the total recharge in a complicated and partially karstic semi-arid catchment. The model enabled the diversity of processes operating within the catchment to be disaggregated so that the different water movement mechanisms and recharge processes could be evaluated. The main challenge for this study was the scarcity of field data. The full calibration of the model required a variety of parameters that were not measured adequately in the field. These were assigned to the model as different, but likely, values in order to test both output and sensitivity of the model. The main conclusions drawn from this study are as follows:
  • The estimated recharge values are sensitive to the type of recharge calculation method applied. The selection of the method must be undertaken, therefore, with great care.
  • The recharge values presented in this study are calculated over short simulation periods and they are not representative of a long-term average recharge value that can be used for the management of water resources. However, the model can form the basis of a methodology for estimating water resources once longer-term driving data are obtained and applied.
  • Indirect recharge occurring through overland and wadi losses is an important process that has to be included to reproduce the wadi flow hydrographs. The sensitivity analysis indicates that the wetting threshold directly controls when wadi flow will start, while the wadi loss coefficient determines the magnitude of the flows, and the groundwater velocity allows spring flow to contribute to wadi flow and support the recession in the flow hydrograph. This highlights the need to use a numerical model that incorporates all the flow processes identified in the conceptual model. These processes can be investigated by field campaigns to better understand how systems wet up, i.e., by undertaking sprinkler or tracer tests [17,25], gauging wadi flows, and investigating transmission losses [11], and by observing when spring flows increase in response to rainfall events [29].
  • This study shows the importance of field data availability. No model calibration was possible without the availability of wadi flow and soil moisture data. In the current study, and due to the scarcity of field data, the hydraulic parameter values were uniformly distributed across the catchment. The use of a complex distribution of hydraulic parameter values to improve the match between the simulated and observed gauged flows should be supported and justified by further collection of field data.
  • The model water balance shows that the volume of water recharge caused by indirect recharge processes is higher than that of the direct recharge processes. While, these figures are expected to change with further model refinement when additional field data become available, the water balance highlights the importance of accounting for indirect recharge in catchments with hydrological conditions in semi-arid conditions similar to the Natuf catchment.
Finally, in addition to the careful selection of the recharge method, further work on determining the location and magnitude of wadi losses is required, along with understanding of time-variant spring flow response and the characterization of the perched groundwater system. However, the model proposed here provides a relatively parsimonious way of representing complex recharge processes in a karst environment.

Author Contributions

Conceptualization, D.P. and N.R.; methodology, M.M. and A.H.; software, M.M.; writing—original draft preparation, M.M. and A.H.; writing—review and editing, A.H.

Funding

The study was undertaken within the Sustainable Management of the West Bank and Gaza Project funded by the UK Department for International Development.

Acknowledgments

The authors gratefully acknowledge the assistance of the many members of PWA staff who contributed to this study, especially Abbass Kalbounah and Omar Zayed. The two anonymous reviewers are acknowledged, as addressing their comments improved the paper. This paper was published with the permission of the Executive Director, British Geological Survey (UKRI).

Conflicts of Interest

The authors declare no conflict of interest.

References

  1. McDonald, R.I.; Green, P.; Balk, D.; Fekete, B.M.; Revenga, C.; Todd, M.; Montgomery, M. Urban growth, climate change, and freshwater availability. Proc. Natl. Acad. Sci. USA 2011, 108, 6312–6317. [Google Scholar] [CrossRef] [PubMed]
  2. Wada, Y.; van Beek, L.P.H.; van Kempen, C.M.; Reckman, J.W.T.M.; Vasak, S.; Bierkens, M.F.P. Global depletion of groundwater resources. Geophys. Res. Lett. 2010, 37. [Google Scholar] [CrossRef]
  3. Taylor, R.G.; Scanlon, B.; Döll, P.; Rodell, M.; van Beek, R.; Wada, Y.; Longuevergne, L.; Leblanc, M.; Famiglietti, J.S.; Edmunds, M.; et al. Ground water and climate change. Nat. Clim. Chang. 2012, 3, 322–329. [Google Scholar] [CrossRef]
  4. Allan, J.A.; Allan, T. The Middle East Water Question: Hydropolitics and the Global Economy; Ib Tauris: London, UK, 2002; Volume 2. [Google Scholar]
  5. Zeitoun, M.; Messerschmid, C.; Attili, S. Asymmetric abstraction and allocation: The Israeli-Palestinian water pumping record. Groundwater 2009, 47, 146–160. [Google Scholar] [CrossRef] [PubMed]
  6. Hughes, A.G.; Mansour, M.M.; Robins, N.S. Evaluation of distributed recharge in an upland semi-arid karst system: The West Bank Mountain Aquifer, Middle East. Hydrogeol. J. 2008, 16, 845–854. [Google Scholar] [CrossRef]
  7. Goldschmidt, M.J. Precipitation and Runoff from Jordan and Litani Catchments; Hydrological Service of Israel: Jerusalem, Israel, 1955. [Google Scholar]
  8. Goldschmidt, M.J.; Jacobs, M. Precipitation and Replenishment of the Yarqon and Nahal Hatteninum Underground Catchments; Hydrological Service of Israel: Jerusalem, Israel, 1958. [Google Scholar]
  9. Guttman, Y.; Zukerman, C.H. Flow Model of the Eastern Basin of the Mountains of Judea & Samaria from the Paharoh Stream to the Judean Desert; Tahal Water Unit, Hydrological Section: Tel Aviv, Israel, 1995. [Google Scholar]
  10. Sheffer, N.A.; Dafny, E.; Gvirtzman, H.; Navon, S.; Frumkin, A.; Morin, E. Hydrometeorological daily recharge assessment model (DREAM) for the Western Mountain Aquifer, Israel: Model application and effects of temporal patterns. Water Resour. Res. 2010, 46. [Google Scholar] [CrossRef]
  11. Messerschmid, C.; Lange, J.; Sauter, M. Assessment of transmission loss in a Mediterranean karstic watershed (Wadi Natuf, West Bank). Hydrol. Process. 2018, 32, 1375–1390. [Google Scholar] [CrossRef]
  12. Lerner, D.N.; Issar, A.S.; Simmers, I. Groundwater Recharge: A Guide to Understanding and Estimating Natural Recharge; Heise: Hannover, Germany, 1990; Volume 8. [Google Scholar]
  13. Wheater, H.; Al-Weshah, R.A. Hydrology of wadi systems. IHP regional network on wadi hydrology in the Arab region. In Technical Documents in Hydrology; UNESCO: London, UK, 2002. [Google Scholar]
  14. De Vries, J.J.; Simmers, I. Groundwater recharge: An overview of processes and challenges. Hydrogeol. J. 2002, 10, 5–17. [Google Scholar] [CrossRef]
  15. Lafare, A.E.A.; Peach, D.W.; Hughes, A.G. Use of seasonal trend decomposition to understand groundwater behaviour in the Permo-Triassic Sandstone aquifer, Eden Valley, UK. Hydrogeol. J. 2016, 24, 141–158. [Google Scholar] [CrossRef]
  16. Jebreen, H.; Wohnlich, S.; Wisotzky, F.; Banning, A.; Niedermayr, A.; Ghanem, M. Recharge estimation in semi-arid karst catchments: Central West Bank, Palestine. Grundwasser 2017, 23, 91–101. [Google Scholar] [CrossRef]
  17. Lange, J.; Arbel, Y.; Grodek, T.; Greenbaum, N. Water percolation process studies in a Mediterranean karst area. Hydrol. Process. 2010, 24, 1866–1879. [Google Scholar] [CrossRef]
  18. Ries, F.; Lange, J.; Schmidt, S.; Puhlmann, H.; Sauter, M. Recharge estimation and soil moisture dynamics in a Mediterranean, semi-arid karst region. Hydrol. Earth Syst. Sci. 2015, 19, 1439–1456. [Google Scholar] [CrossRef]
  19. SUSMAQ. Conceptual Flow Model of the Western Aquifer Basin; Palestinian Water Authority: West Bank, Palestine, 2003. [Google Scholar]
  20. Rofe and Rafety. West Bank Hydrology 1963–65: Analysis; Hashemite Kingdom of Jordan Central Water Authority: Amman, Jordan, 1965.
  21. Penman, H.L. Natural evaporation from open water, bare soil and grass. Proc. R. Soc. Lond. Ser. A Math. Phys. Sci. 1948, 193, 120–145. [Google Scholar]
  22. Bachmat, Y. Hydrologic Model of the Western Mountain Groudnwter Basin for Stage 1 of the Harvard Middle East Water Project; Institution for Social and Economic Policy in the Middle East: Cambridge, MA, USA, 1995. [Google Scholar]
  23. Khalaf, A.; Donoghue, D. Estimating recharge distribution using remote sensing: A case study from the West Bank. J. Hydrol. 2012, 414–415, 354–363. [Google Scholar] [CrossRef]
  24. Abesser, C.; Clarke, D.; Hughes, A.G.; Robins, N.S. Modelling small groundwater systems: Experiences from the Braunton Burrows and Ainsdale coastal dune systems, UK. J. Coast. Conserv. 2017, 21, 595–614. [Google Scholar] [CrossRef]
  25. Lange, J.; Greenbaum, N.; Husary, S.; Ghanem, M.; Leibundgut, C.; Schick, A.P. Runoff generation from successive simulated rainfalls on a rocky, semi-arid, Mediterranean hillslope. Hydrol. Process. 2003, 17, 279–296. [Google Scholar] [CrossRef]
  26. Scanlon, B.R.; Tyler, S.W.; Wierenga, P.J. Hydrologic issues in arid, unsaturated systems and implications for contaminant transport. Rev. Geophys. 1997, 35, 461–490. [Google Scholar] [CrossRef]
  27. Rushton, K.R. Groundwater Hydrology: Conceptual and Computational Models; John Wiley & Sons: Hoboken, NJ, USA, 2004. [Google Scholar]
  28. Messerschmid, C.; Lange, J.; Sauter, M. Field-based groundwater recharge and leakage estimations in a semi-arid Eastern Mediterranean karst catchment, Wadi Natuf, West Bank. Hydrol. Earth Syst. Sci. Discuss. 2018, 1–38. [Google Scholar] [CrossRef]
  29. Shalash, I.; Ghanem, M. Hydrochemistry of the Natuf drainage basin in Ramallah area/West Bank. Environ. Geol. 2007, 55, 359–367. [Google Scholar] [CrossRef]
  30. Mansour, M.M.; Wang, L.; Whiteman, M.; Hughes, A. Estimation of spatially distributed groundwater potential recharge for the United Kingdom. Q. J. Eng. Geol. Hydrogeol. 2018, 51, 247–263. [Google Scholar] [CrossRef]
  31. Dochartaigh, B.E.O.; MacDonald, A.M.; Darling, W.G.; Hughes, A.G.; Li, J.X.; Shi, L.A. Determining groundwater degradation from irrigation in desert-marginal northern China. Hydrogeol. J. 2010, 18, 1939–1952. [Google Scholar] [CrossRef]
  32. Mansour, M.M.; Peach, D.W.; Hughes, A.G.; Robins, N.S. Tension over equitable allocation of water: Estimating renewable groundwater resources beneath the West Bank and Israel. Geol. Soc. Lond. Spec. Publ. 2012, 362, 355–361. [Google Scholar] [CrossRef]
  33. Turner, R.J.; Mansour, M.M.; Dearden, R.; Dochartaigh, B.E.O.; Hughes, A.G. Improved understanding of groundwater flow in complex superficial deposits using three-dimensional geological-framework and groundwater models: An example from Glasgow, Scotland (UK). Hydrogeol. J. 2015, 23, 493–506. [Google Scholar] [CrossRef]
  34. Guardiola-Albert, C.; Jackson, C.R. Potential Impacts of Climate Change on Groundwater Supplies to the Doñana Wetland, Spain. Wetlands 2011, 31, 907–920. [Google Scholar] [CrossRef]
  35. Mansour, M.M.; Mackay, J.D.; Hughes, A.G. User’s Manual for the Distributed Recharge Model Zoodrm; Unpublished Report IR/04/150; British Geological Survey: Nottingham, UK, 2004. [Google Scholar]
  36. Neitsch, S.L.; Arnold, J.G.; Kiniry, J.R.; Williams, J.R. Soil and Water Assessment Tool Theoretical Documentation. Version 2005; Grassland, Soil and Water Research Laboratory. Agricultural Research Service and Blackland and Research Centre: Temple, TX, USA, 2005. [Google Scholar]
  37. ARIJ. Water Resources and Irrigated Agriculture in the West Bank; Applied Research Institute: Jersualem, Israel, 1998. [Google Scholar]
  38. Chow, V.T. Open-Channel Hydraulics; McGraw-Hill: New York, NY, USA, 1959. [Google Scholar]
Figure 1. Location map of the Wadi Natuf catchment and topography of the catchment and location of the main spring groups.
Water 11 00276 g001
Figure 2. Summary geological map together with the locations of the main spring groups.
Water 11 00276 g002
Figure 3. Conceptual model of recharge processes in the Wadi Natuf catchment.
Water 11 00276 g003
Figure 4. Framework of the recharge model ZOODRM with hydrological processes applied in this study.
Water 11 00276 g004
Figure 5. Comparison between modeled and observed soil moisture content for Beitillu (Winter 2003/04).
Water 11 00276 g005
Figure 6. Comparison between modeled and observed soil moisture content for Shuqba (Winter 2003/04).
Water 11 00276 g006
Figure 7. Comparison between the simulated and observed wadi flows at the four gauging stations (Figure 1): Ein Ayoub (Ayb), Shibteen 2 (R2), Wadi Zarqa (Zar), and Shibteen 1 (R1). Dates on X axis are formatted in day/month (dd/mm) for 2009.
Water 11 00276 g007
Figure 8. Sensitivity analysis for the three main hydraulic parameters: wetting threshold, wadi loss coefficients, and spring groundwater velocity. Time series were recorded at the Ein ayoub (Ayb) gauging station. Dates on X axis are formatted in day/month (dd/mm) for 2009.
Water 11 00276 g008
Table 1. Lithostratigraphy of the Upper and Lower aquifers in the Wadi Natuf catchment area.
Geological FormationSub-FormationLithologyThickness (m)
Upper AquiferJerusalem White limestone, dolomite over thin bedded limestone40–190
BethlehemUpperSoft dolomite50–100
LowerChalky limestone
Hebron Karstic dolomite65–160
AquitardYattaUpperYellow marl55–120
LowerLimestone, dolostone, and chalky marl
Lower AquiferUpper Beit Kahil (UBK)UBK 2Limestone10–20
UBK 1Dolomite limestone interbedded with marl60–130
Lower Beit Kahil (LBK)LBK 2Dolomite40–90
Kobar Marl10–20
LBK 1Karstic limestone100–160
Table 2. Algorithms of the soil moisture deficit (SMD) and wetting threshold (WT) methods.
Soil Moisture Deficit (SMD) MethodWetting Threshold (WT) Method
R O = R × R O C R e f f = R R O P E
If R e f f > 0
   A E = P E
   S M D n = S M D n 1 R e f f
  If S M D n < 0
     P R e c h = | S M D n |
     S M D n = 0 ,
  otherwise P R e c h = 0
  If R e f f < 0
   A E = | R e f f | for S M D n 1 < C
  If D > S M D n 1 > C
     A E = | R e f f | ,
     S M D n = S M D n 1 A E
     ( S M D n ) m a x = D
R e f f = R P E
If R e f f < 0
   E W = 0 , P R e c h = 0
   W D n = W D n 1 | R e f f |
  If W D n < 0
   A E = R + W D n 1 , W D n = 0
  If W D n > 0 ,
     A E = R + W D n 1 W D n
If R e f f > 0
   A E = P E ,
   W D n = W D n 1 + R e f f
  If W D n < S T ,
     E W = 0 , P R e c h = 0
  If W D n > S T
     E W = W D n S T
     P R e c h = E W × ( 1 R O C )
     R O = E W × R O C , W D n = S T
Table 3. Monthly potential evaporation (PE) for Hebron and Ramallah (see Figure 1).
Monthly PE (mm·month−1)
HebronRamallah
January68.170.5
February64.466.6
March82.285.1
April149.1154.3
May176.8182.9
June232.5240.6
July280289.7
August217224.5
September175.9182.0
October123.4127.7
November138.2143.0
December80.883.6
Total1788.41850.4
Table 4. Main spring groups in the Wadi Natuf.
NameEastingNorthingElevation (m above sea level (a.s.l.))
Wadi Zarqa159,000155,000324.0
Beitillu161,000154,000523.2
Jammala159,500153,500432.3
Ras Karkar161,000150,000528.6
Kobar165,000155,000~570.0
Anu Skhedem166,000152,000~700.0
Table 5. Nash–Sutcliff efficiency (NSE) and root-mean-square errors (RMSE) of wadi flows at the four gauging stations.
Gauging StationMean Observed FlowsMean Simulated FlowsNSERMSE
Ein Ayoub3.143.540.686.6
Shibteen 21.91.430.226.03
Zarqa0.331.04−0.466.67
Shibteen 10.361.04−14.84.53
Table 6. Water balance calculated over the simulation period.
ItemQin (ML·h−1)Qin (% age)Qout (ML·h−1)Qout (% age)
Rainfall148.392.1
Evaporation 10.96.7
Runoff 57.635.8
Run-on12.87.9
Soil storage change 35.221.8
Flow to springs 8.85.5
Direct recharge 48.630.2
Total 161.1100.0161.1100.0
Note: Average flow gauged at the most downstream end of the wadi system is 0.4 ML·h−1.

