Abstract
Accurate modelling of near surface wind speeds is essential for robust resource assessment, turbine design, and grid integration. This study presents a unified framework comparing four candidate marginal distributions—Weibull, Gamma, Lognormal, and Generalised Extreme Value (GEV)—across 21 years of daily observations from 11 sites in New South Wales and southern Queensland, Australia. Parameters are estimated by maximum likelihood, with L-moments used when numerical fitting fails. Univariate goodness-of-fit is evaluated via information criteria (Akaike Information Criterion, AIC; Bayesian Information Criterion, BIC) and distributional tests (Anderson–Darling, Cramér–von Mises, Kolmogorov–Smirnov). To capture spatial dependence, we fit an 11-dimensional regular vine (“R-vine”) copula to the probability-integral-transformed data, selecting pair-copula families by AIC and estimating parameters by sequential likelihood. A composite score (70% univariate, 30% copula) ranks distributions per location. Results demonstrate that Lognormal best matches central behaviour at most sites, Weibull remains competitive for bulk modelling, Gamma often excels in moderate tails, and GEV best represents extremes. All turbine yield results presented are illustrative, showing how statistical choices impact energy estimates; they should not be interpreted as operational forecasts. In a case study, 5000 joint simulations from the top-two models drive IEC V90 and E82 power curves, revealing up to 10% variability in annual energy yield due solely to marginal choice. This workflow provides a replicable template for comprehensive wind resource and load hazard analysis in complex terrains.
1. Introduction
Understanding and accurately characterising the statistical behaviour of wind speeds is foundational to both wind-resource assessment and turbine performance evaluation. In the context of New South Wales (NSW) and southeastern Queensland (QLD), Australia, complex coastal topography, seasonal monsoonal influences, and the El Niño–Southern Oscillation (ENSO) impart substantial variability in daily wind regimes over both space and time. These factors combine to produce windspeed distributions that often depart from the assumed two-parameter Weibull form, particularly in the tails, thereby challenging standard design and planning procedures for wind-energy projects [1,2].
Historically, the Weibull distribution has dominated windspeed modelling due to its analytical tractability and relatively good fit to bulk flow metrics (mean, variance, skewness) across a wide array of sites [3]. However, numerous studies have documented its shortcomings in accurately reproducing low-wind and extreme-wind occurrences, which are critical for turbine cut-in and load-hazard calculations, respectively [4,5,6]. Alternative marginal models—such as the Gamma, lognormal, and three-parameter Generalised Extreme Value (GEV) distributions—offer enhanced flexibility in tail representation but introduce additional parameters and potential overfitting risks [7,8,9]. Moreover, the choice of parameter-estimation method (e.g., maximum likelihood vs. L-moments) can materially affect fitted shape and scale parameters, further complicating model selection [10,11].
Beyond univariate considerations, daily windspeeds at proximate meteorological sites exhibit significant dependence, driven by regional synoptic systems and mesoscale circulations [12]. Spatial correlation structures influence joint exceedance probabilities and the aggregated uncertainty in wind-farm output [13]. Gaussian and Student-t copulas have been applied to capture such dependence, with some success, but they impose restrictive tail-dependence properties and may fail to capture the full spectrum of bivariate relationships [14,15]. Vine copulas in particular, regular (R-vine) constructions decompose high dimensional dependence into a cascade of bivariate building blocks, selected and parameterised to reflect the strongest pairwise links at each tree level [16,17]. This flexibility has proven advantageous in financial and hydrological applications, yet its deployment in Australian wind-resource studies remains nascent.
Finally, the practical impact of marginal and dependence modelling choices must be appraised through their influence on turbine power-curve simulations and energy-yield estimates. Minor discrepancies in fit at the tails can propagate into material differences in predicted mean annual energy (MAE) and risk metrics (e.g., quantiles of annual yield), potentially altering project feasibility and financing decisions [18,19,20]. A cohesive framework that integrates rigorous univariate goodness-of-fit testing (GoF), vine-copula dependence modelling, and stochastic power-curve simulation thus fills a clear methodological gap.
In this study, an integrated framework is developed and applied to 21 years of daily wind-speed observations from 11 sites spanning the coastal and inland regions of northeastern NSW and southeastern QLD.
The integrated framework developed in this study addresses critical gaps in current wind resource assessment practice. Marginal distribution selection directly impacts project financing through risk assessment and financial modelling, affects turbine class selection through extreme wind estimates, and influences grid integration planning through accurate modelling of joint wind behaviour across multiple sites. The variations in annual energy estimates due to distribution choice alone have immediate commercial implications for project economics, insurance costs, and financing decisions. The vine copula approach provides the first systematic method for balancing univariate GoF with multivariate spatial dependence, offering practitioners a rigorous template for comprehensive wind resource analysis. To address these critical industry needs and methodological gaps, the contributions are threefold.
- Comprehensive Marginal Selection: Comparison of four parametric families—Weibull, Gamma, Lognormal, and GEV—fitted via maximum likelihood and, where necessary, L-moments, and evaluated through information criteria (AIC, BIC) and empirical distribution-function tests (Anderson–Darling, Cramér–von Mises, Kolmogorov–Smirnov).
- Spatial Vine-Copula Modelling: The construction of an 11-dimensional R-vine copula tailored to the NSW–QLD network, selecting optimal bivariate copula families at each vine tree by penalised likelihood and assessing multivariate GoF via a parametric bootstrap Cramér–von Mises test.
- Engineering implications via Power-Curve Simulation based on marginal and dependence choices: Quantification of how marginal and dependence choices translate into variation in MAE and yield-uncertainty for two representative turbines (IEC V90 and E82) by generating 5000 joint synthetic windspeed series and mapping them through standard cubic-ramp power curves.
Overall, this study is intended as a methodological demonstration of windspeed distribution selection and spatial copula modelling, rather than a site-specific wind resource or operational assessment. All meteorological simplifications such as the use of neutral stability, daily averages, and log-law extrapolation are adopted solely to standardise the statistical framework and to illustrate methodological sensitivity. The statistical procedures developed herein are broadly applicable to quality-controlled wind datasets, regardless of specific measurement protocols or instrumentation. Site-specific meteorological analyses and operational yield predictions are intentionally outside the scope of this work.
By unifying marginal selection and dependence modelling within a single reproducible framework, this work advances both methodological development and its application to wind-energy engineering, relevant not only to Australia, but to emerging and established renewable-energy regions globally.
2. Literature Review
The accurate statistical modelling of windspeed distributions is a long-standing and vital topic in wind-energy research, underpinning both resource assessment and the design and reliability analysis of wind turbines. Early foundational work by [3] demonstrated that the two-parameter Weibull distribution offered a flexible yet tractable model for monthly windspeed histograms across a wide range of United States (U.S.) climatic regimes, outperforming simpler alternatives such as the Rayleigh and Gamma distributions in terms of root-mean-square error (RMSE) and GoF measures [2,3]. Since then, the Weibull has become the de facto standard in wind energy studies [21,22,23,24], owing to its analytical simplicity and the closed-form expressions available for mean, variance, skewness, and kurtosis in terms of its shape (k) and scale (c) parameters.
Subsequent evaluations, however, have highlighted limitations of the Weibull form, particularly in representing low wind and extreme high wind tails. Bilir et al. [7] compared Weibull and lognormal fits for Ankara, Turkey, finding that the lognormal better captured the elevated “zero-wind” probability and skewness under calm conditions, even though both distributions yielded similar RMSE values. Kaplan & Temiz [8] similarly reported that lognormal marginals outperformed Weibull in Hong Kong’s subtropical regime, especially for low-wind quantiles. Lu & McElroy [25], in a global meta-analysis, noted that while the Weibull remains prevalent, lognormal and Gamma distributions often achieve superior fits under non-neutral atmospheric stability conditions, such as nocturnal inversions or convective boundary layers.
For risk assessment and extreme-value engineering, two-parameter models may inadequately represent rare but consequential high-wind events. The three-parameter Generalised Extreme Value (GEV) distribution, grounded in the asymptotic theory of block maxima, provides a systematic framework for tail modelling. Campos & Soares [9] applied the GEV to annual-maximum wind-speed series in Portugal and showed marked improvements over Weibull for 50- and 100-year return-period estimates. Wang & Holmes [26] extended this by contrasting the GEV and the Generalised Pareto Distribution (GPD) for threshold exceedances, finding that the GPD3 variant yielded more stable parameter estimates when sample sizes exceed a few decades.
Robust parameter estimation is critical for all these models. In the context of the Weibull, ref. [27] benchmarked seven estimation methods (maximum likelihood, method of moments, empirical probability plotting (EPFM), and likelihood-based mixtures), concluding that expectation–maximisation yielded the smallest bias for Brazilian wind data. Teyabeen et al. [11] compared classical moment matching, probability-plotting, and maximum likelihood mixture (MLM) on Libyan datasets, recommending MLM for its balanced bias–variance trade-off. However, ref. [27] showed that the optimal estimator is site-specific, depending on record length, sampling frequency, and local wind-climate heterogeneity. Fallback approaches based on L-moments [10] have become popular for GEV and GPD3 owing to their robustness against outliers and small samples, e.g., [28,29,30].
Univariate GoF testing typically combines information-criteria and Empirical Distribution Function (EDF)-based tests. Stephens [31] formalised the Anderson–Darling (AD) and Cramér–von Mises (CvM) tests, which weight discrepancies between empirical and theoretical CDFs differently, with AD emphasising tails and CvM equally weighting across the support. Razali and Wah [32] compared the Kolmogorov–Smirnov (KS), AD, and CvM tests using both simulated and real-world datasets, concluding that AD consistently outperforms the others in detecting tail departures, making it more suitable for tail-sensitive model discrimination. Evans et al. [33] discussed the incorporation of resampling techniques, such as bootstrapping, to improve p-value accuracy for GoF tests under parameter uncertainty—particularly beneficial for small sample sizes (n < 1000), where classical test calibration can be unreliable. More recently, Chau et al. [34] developed the adaptive bandwidth kernel density estimation (KDE) model to more accurately represent windspeed distributions for wind farm applications, particularly in complex terrains. Unlike traditional parametric methods, their non-parametric approach better captured the variability in windspeed data, especially in the tails of the distribution. They evaluated GoF using several statistical tests, highlighting the CvM test for its sensitivity across the entire distribution, including extremes, making it well suited for applications concerned with both energy yield and turbine design considerations.
While univariate modelling has been thoroughly studied, real-world wind farm layouts involve multiple sites whose daily wind speeds exhibit nontrivial spatial dependence. Nelsen [12] laid the theoretical foundation for copula modelling, decoupling marginals from dependence. Recent studies have extensively applied copula models to capture the complex dependence structure in multivariate wind-speed fields, yet many approaches still rely on single, homogeneous copula families for all pairwise relationships, which can be overly restrictive [13,14]. For instance, Tastu et al. [13] employed a Gaussian copula with parameterised precision matrices to model space-time dependencies in wind power generation, demonstrating its effectiveness in generating high-quality scenarios while noting that the approach was fully characterised by an empirical covariance structure. Malvaldi et al. [14] analysed spatial and temporal correlations across European wind systems, finding that cross-correlation coefficients decreased exponentially with separation distance but varied significantly with wind direction and temporal scales, highlighting the limitations of assuming uniform dependence structures across entire networks.
Similarly, researchers have found that while Gaussian copulas capture linear dependencies well, they systematically underestimate joint probabilities of extreme wind events [14,35]. Veeramachaneni et al. [36,37,38] constructed n-dimensional Gaussian copulas for wind resource assessment, achieving higher accuracy than multiple regression approaches but acknowledging limitations in capturing complex spatial dependencies at multiple wind farm sites. These findings underscore the need for more flexible modelling approaches, as real-world windspeed dependencies exhibit significant heterogeneity between station pairs and across different meteorological conditions [39,40].
In contrast, vine copula approaches offer substantially greater modelling flexibility by constructing high-dimensional models through cascades of individually selected bivariate copulas for each edge [16,17,41]. This methodology allows for capturing heterogeneous dependence patterns, including both tail-independent and tail-dependent relationships, which are crucial for modelling complex spatial wind fields under varying atmospheric conditions [42]. The spatial sensitivity analysis conducted by various researchers demonstrates that vine copulas can effectively model both strong tail dependence at closely spaced wind farms and central dependence at moderate distances, while maintaining computational efficiency for scenario generation applications [43].
Furthermore, the modelling of spatial and temporal dependencies in windspeed data has seen significant progress with the adoption of these advanced copula models. Huang et al. [44] developed a layered-vine copula approach that effectively captures the complex dependencies among multiple wind speed variables, improving the accuracy of wind speed predictions. Additionally, Goh et al. [42] employed C-vine and D-vine copulas to generate wind speed scenarios that consider both spatial and temporal correlations, leading to more realistic and reliable wind speed simulations. These methodologies offer enhanced tools for understanding and forecasting wind behaviour, which are essential for the planning and operation of wind energy systems. Finally, the choice of marginal and dependence models has direct implications for energy-yield and load-hazard analyses. Masseran [18] introduced an integrated composite ranking type procedure that blends marginal AIC and EDF-test statistics with copula-CvM measures to select optimal marginals across ten Indian sites, demonstrating up to 6% variation in annual-energy predictions. Chowdhury [19] further showed that this composite approach, when coupled with turbine power-curve simulation for IEC V90 and E82, yields realistic uncertainty bounds on mean annual energy (MAE). Yet, these integrated frameworks have not been rigorously applied to long-term Australian records, where the interplay of coastal gradients, terrain complexity, and climate variability demands both univariate flexibility and multivariate nuance.
In summary, while the extensive literature covers univariate windspeed modelling, parametric-copulas, and isolated energy-simulation studies, few works unify a broad suite of GoF diagnostics (AIC, BIC, AD, CvM, KS), a flexible R-vine dependence model, and stochastic power-curve simulation on long-term, multi-site Australian datasets. This unified methodology offers a replicable and modular workflow for both researchers and industry practitioners seeking to optimise wind farm design, improve yield forecasting, and rigorously assess uncertainty from a probabilistic perspective. Moreover, the approach bridges the divide between statistical rigour and engineering application, advancing best practices in wind resource assessment under Australia’s complex meteorological conditions particularly across NSW and southern QLD.
The remainder of this paper is organised as follows. Section 3 describes the study region of NSW and southern QLD, as well as the meteorological and on-site anemometer data employed. In Section 4, the comprehensive statistical framework, detailing marginal distribution fitting, univariate GoF metrics, and the construction and estimation of the R-vine copula is presented. Section 5 reports the results of the univariate and dependence analyses, including model comparisons and the composite ranking of candidate distributions, and discusses their implications for wind resource assessment. Section 5 also examines the impact of distributional choice on turbine power-curve outputs through stochastic simulation, quantifying uncertainties in annual energy yield. Finally Section 6 summarises the key findings, highlights the contributions of this work, and outlines promising avenues for future investigation.
3. Study Area and Data
The study region encompasses the coastal and near-coastal zones of New South Wales (NSW) and southern Queensland (QLD) in eastern Australia (Figure 1). This region spans approximately 28° S to 31° S in latitude and 1521° E to 153.5° E in longitude, and includes a diverse range of terrain types such as coastal plains, low-relief hills, and the outset of the Great Dividing Range. Local wind regimes are influenced by sea-breeze circulations, orographic channelling along east–west valleys, and large-scale synoptic variability associated with the East Australian Current, El Niño–Southern Oscillation (ENSO), and mid latitude frontal systems [45,46].
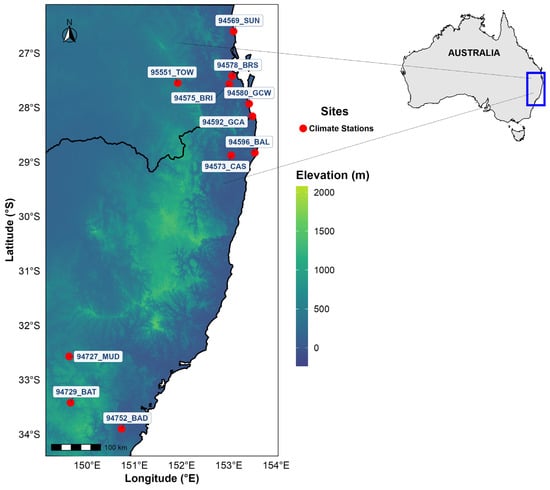
Figure 1.
Map of study area showing the eleven station locations in NSW and southern QLD—location (in red) with site ID labels.
All windspeed measurements were obtained from Australian Bureau of Meteorology (BoM) stations following standardised protocols as seen in Table 1. BoM stations comply with World Meteorological Organisation (WMO) guidelines and Australian Standard AS/NZS 3580.14:2014 [47], ensuring consistent measurement specifications across all sites. The standardised 10 m measurement height represents the international meteorological standard established by WMO and adopted universally for weather station networks.

Table 1.
BOM meteorological measurement standards.
As summarised in Table 1, all wind speed data used in this analysis were measured using BoM standardised cup anemometers at 10 m above ground, following WMO and national protocols. Instrumentation across all sites is uniform, enabling consistent statistical treatment without clustering by device type or measurement method.
Data for this study comprises 21 years (1 January 2000–31 December 2020) of daily mean windspeed measurements from eleven BOM sites, selected to capture the diversity of wind climates in NSW and southern QLD (Table 2). Along the coastal plain, Sunshine Coast (94569_SUN), Gold Coast Seaway (94580_GCW), and Gold Coast Airport (94592_GCA) experience maritime-influenced sea breezes and synoptic onshore flows, while the Brisbane sites Archerfield Airport (94575_BRI) and Brisbane Airport (94578_BRS) reflect a combination of coastal modulation and urban-heat-island effects. Inland, Casino Airport (94573_CAS) and Ballina Gateway (94596_BAL) sit beneath the Richmond–Clarence valley axes and are subject to valley-drainage winds and inland trough influences. Further west, Toowoomba Airport (95551_TOW), Mudgee Airport (94727_MUD), Bathurst Airport (94729_BAT), and Badgerys Creek Airport (94752_BAD) occupy higher-elevation plateau and transition zones, where diurnal thermal circulations and elevated synoptic westerlies prevail. Elevations range from near sea level at the coastal sites to approximately 650 m a.s.l. at Mudgee, and all stations exhibit data completeness exceeding 95% over the 7289 daily records.

Table 2.
Meteorological station metadata: station code, name, latitude (° S), longitude (° E), elevation (m-a.s.l.), and summary statistics.
Windspeed data underwent multi-stage quality control procedures. The 15-day temporal consistency check was implemented as a statistical outlier detection method rather than a meteorological constraint, designed to identify instrumentation failures or data recording errors rather than exclude legitimate meteorological events. The threshold was calibrated to preserve extreme weather events (including tropical cyclones and severe storms) while removing clearly erroneous readings. To ensure meteorologically significant events were retained, the quality control procedure employed a two-tier approach: (1) values exceeding 15-day moving statistics by more than 4 standard deviations were flagged for secondary review, and (2) flagged values were cross-validated against concurrent measurements from neighbouring BoM stations to distinguish legitimate extreme events from instrumental errors. This approach successfully preserved extreme weather data including tropical cyclone passages while removing spurious readings.
This study employed daily mean windspeed data, which differs from the hourly or sub-hourly resolution typically preferred for detailed wind resource assessments. Daily resolution was selected for several methodological reasons: (1) it provides sufficient temporal detail for statistical distribution comparison across the 21-year period while maintaining computational feasibility for the 11-site vine copula analysis; (2) daily averages reduce short-term meteorological noise that could confound distribution fitting, allowing clearer identification of fundamental distributional characteristics; and (3) the focus on marginal distribution selection methodology rather than absolute energy prediction makes this resolution appropriate for the comparative framework developed.
While higher-resolution data would capture diurnal wind patterns important for operational wind farm management, the primary objective is demonstrating how distribution choice impacts relative yield estimates. The variations in annual energy estimates observed due to marginal selection remain valid regardless of temporal resolution, as these differences stem from fundamental distributional characteristics rather than diurnal effects. For practical applications requiring detailed energy forecasting, practitioners should incorporate higher resolution data while applying the distribution selection framework developed here.
After cleaning, the pooled dataset comprises an n = 7289 × 11 daily matrix X, where Xi,t denotes the wind-speed at site i on day t. All wind speeds are measured at standard 10 m height above ground and converted to 10 m equivalent where necessary using the logarithmic wind-profile law [48]. Prior to copula analysis, each marginal time series was transformed to the unit interval via probability-integral transforms ensuring compatibility with vine-copula fitting [16].
Across the eleven sites, the summary statistics reveal clear links between local wind climates and the underlying coastal–inland and elevation gradients. Coastal locations such as Gold Coast Seaway (94580_GCW) and Sunshine Coast (94569_SUN) exhibit the highest mean daily wind speeds (10.39 ms−1 and 8.89 ms−1, respectively) and largest standard deviations (3.80 and 3.03 ms−1), reflecting the strong, variable onshore sea-breeze circulations and synoptic coastal flows. Their pronounced positive skewness (1.19 and 0.84)) indicates occasional extreme gust events punctuating otherwise moderate wind regimes. In contrast, inland valley sites such as Casino Airport (94573_CAS) and Balina Gateway (94596_BAL) record lower mean speeds (5.57 and 7.36 ms−1) and reduced variability (σ = 1.97 and 3.08 ms−1), consistent with topographically sheltered conditions moderated by valley-drainage winds, and their skewness (0.89 and 0.50) is moderate.
Mid-elevation plateaus at Mudgee (94727_MUD, elevation 472 m) and Bathurst (94729_BAT, 745 m) exhibit mean speeds around 6.0 ms−1, with σ ≈ 2.6 ms−1, reflecting greater exposure to synoptic westerlies but limited coastal influence; their skewness (~ 0.8 and 0.7) points to reasonably symmetric, bell-shaped distributions. The two Brisbane sites occupy an intermediate position: Archerfield (94575_BRI) shows a mean of 6.79 ms−1 and skewness of 0.70, while the more exposed Brisbane Airport (94578_BRS) has a higher mean (8.10 ms−1) and more pronounced skew (1.16), indicating frequent strong gusts associated with coastal convergence and urban-heat-island effects. Badgerys Creek (94752_BAD) and Toowoomba (95551_TOW) illustrate contrasting inland environments: the former’s lower mean (5.46 ms−1) and high skew (1.14) underscore episodic strong winds despite generally calm conditions, whereas Toowoomba’s combination of high mean speed (10.86 ms−1), moderate variability (σ = 3.39 ms−1), and low skewness (0.53) reflects its elevated plateau setting and more uniform daily wind patterns. Together, these metrics quantify how terrain, elevation, and coastal proximity shape the first four moments of the windspeed distributions—a crucial precursor to selecting and validating appropriate statistical models. Finally, the coefficient of variation (standard deviation/mean) across the eleven sites ranges from approximately 29% to 45%, indicating notable spatial differences in wind resource variability. Coastal sites such as Sunshine Coast and Gold Coast Seaway exhibit moderate cv values (~34–37%), reflecting characteristically strong but relatively stable wind regimes. In contrast, several inland and plateau locations (e.g., Ballina Gateway, Mudgee Airport, Bathurst Airport, Badgerys Creek Airport) show higher cv values (>40%), signifying greater relative wind speed fluctuations attributable to topographical and meteorological influences. Overall, the persistent variability across sites highlights the importance of tailored statistical model selection for accurate wind resource characterisation.
4. Methodology
In this section, a detailed statistical framework is presented and used to (i) fit and evaluate four parametric windspeed distributions at each site, (ii) model the multivariate dependence among sites via a regular vine (“R-vine”) copula, and (iii) propagate joint uncertainty through turbine power-curves to quantify energy yield variability. All analyses were implemented in R (version ≥ 4.2.0) using the packages fitdistrplus, lmomco, evd, copula, VineCopula, goftest, and ggplot2.
4.1. Marginal Distribution Framework and Goodness-of-Fit Metrics
While the individual probability distributions employed (Weibull, Gamma, Lognormal, GEV) are well established, their systematic integration within a vine copula framework for windspeed analysis represents a methodological advance. The following formulations document the implementation for reproducibility, with emphasis on their role within the integrated goodness-of-fit (GoF) and spatial dependence modelling framework.
Let Xi,t = daily mean wind speed at site i (i = 1,…, 11) on day t (t = 1,…, n), where n = 7289 after filtering out missing dates. Four candidate families are considered:
- Weibull (WEI)valued for its two-parameter simplicity and closed-form mean/variance.
- Gamma (GAM)which can flexibly capture skewed shapes, especially in moderate tails.
- Lognormal (LN)often superior when low-wind probability is high.
- Generalised Extreme Value (GEV)with σ > 0 and shape ξ ∈ , to capture rare extremes.
4.1.1. Maximum Likelihood Estimation (MLE)
First, maximum likelihood estimation (MLE) is employed to fit each candidate parametric distribution to the observed windspeed data. MLE has the advantage of efficiently utilising all available information in the sample to obtain parameter estimates that maximise the likelihood function for the chosen probability density function f(x;θ). For a candidate parametric family with density f(x;θ), the log-likelihood is
MLE finds
The R package version ≥ 4.2.0 fitdistrplus is used for this; if the optimiser fails or returns non-physical values (e.g., negative scale), the switch to L-moment estimation is made [49], computing the first four L-moments.
4.1.2. L-Moments Fallback
As is common in environmental datasets, some parameterisations or data may cause MLE to fail or return non-physical estimates (e.g., negative scale parameters), particularly for skewed and heavy-tailed distributions. To ensure reliability across all sites, when MLE does not converge or produces inadmissible results, parameter estimation switches to the robust L-moment method. L-moments are linear combinations of order statistics, less sensitive to outliers and small-sample issues, making them suitable for hydro meteorological variables. The first four sample L-moments λ1,…, λ4 are computed via
and mapping {λ1,…,λ4} to θ via closed-form formulas in lmomco. This fallback ensures robust estimates even under heavy tails or small samples. L-moment estimators summarise the data’s location (λ1), scale (λ2), skewness (λ3), and kurtosis (λ4), and are especially preferred for windspeed and rainfall distributions where extremes are present. The first four sample L-moments are computed following [10].
Once each distribution is fitted, goodness-of-fit is assessed using the Anderson–Darling (AD), Cramér–von Mises (CvM), and Kolmogorov–Smirnov (KS) tests. These diagnostics capture agreement in both the bulk and the tails of the observed data, providing comprehensive distributional validation.
- Akaike Information Criterion (AIC)
- Bayesian Information Criterion (BIC)where k is the number of parameters and n the sample size.
Both AIC and BIC balance GoF against model complexity by penalising the number of parameters. AIC is derived from information theory and aims to minimise information loss, whereas BIC is grounded in a Bayesian framework and is consistent, that is, as sample size grows, BIC will select the true model with probability tending to one. In practice, AIC tends to favour more complex models, while BIC is more conservative.
To probe local deviations between empirical and fitted cumulative distribution functions (CDFs), the data is transformed to probability-integral-transform (PIT) values
Let the sorted PITs be ui,(1) ≤ … ≤ ui,(n). It is computed as follows:
- Anderson–Darling (AD)
- Cramér–von Mises (CvM)
- Kolmogorov–Smirnov (KS)
All three tests compare the empirical distribution function (EDF) of the sample to the theoretical CDF under the null hypothesis. They differ in how they weight deviations between those curves: The KS focuses on the single largest vertical distance between the two CDFs. The CvM integrates the squared difference over the full range, equally weighting all deviations, while the AD also integrates squared differences but applies a weight that emphasises the tails. Generally, AD is most sensitive to tail misfits, CvM is a balanced global measure, and KS is simpler but less powerful for subtle shape differences. Combining multiple criteria reduces bias from single-test sensitivity, ensuring the selected distribution matches both energetic (mean/variance) and probabilistic (tails/extremes) aspects relevant to wind power studies. Once fit diagnostics are computed for each candidate distribution, a stepwise selection is performed, fit metrics (AIC, BIC, AD, CvM, KS) are integrated to rank candidate distributions at each site, with tie-breakers resolved using information-theoretic (AIC/BIC) weights. These fitting and selection methods are essential to produce reliable marginal distributions for the subsequent vine copula dependence analysis and stochastic power curve modelling. The fallback strategies and multi-criteria diagnostics maximise objectivity and reduce subjective bias throughout the study.
4.2. Vine-Copula Dependence ModellingFramework
Windspeeds at different sites exhibit spatial correlation beyond marginal behaviour. This is captured with an 11-dimensional R-vine copula, which decomposes the joint density into a cascade of bivariate copulas.
4.2.1. Pseudo-Observations
Constructing the data matrix: Assemble U = [ui,t] over all sites i = 1,…, and times t = 1,…, n, omitting rows with any missing ui,t to ensure a complete dataset for the copula fit.
4.2.2. R-Vine Density Factorisation
An R-vine on 11 variables is defined by a sequence of trees with edge-sets . The joint copula density factorises as
where is the conditioning set for edge (j, k), and denotes the conditional PIT (computed via partial derivatives of lower-order copulas).
4.2.3. Pair-Copula Selection and Estimation
For each candidate edge, a suite of bivariate copula families (Gaussian, Student-t, Clayton, Gumbel, Frank, etc.) are fitted, selecting the one with minimum AIC. Parameters are then estimated by sequential maximum-likelihood [17] subject to positive-definiteness constraints.
4.2.4. Goodness-of-Fit for the Vine Copula
To evaluate the fit of the entire R-vine, the Henze–Zirkler multivariate normality test on the Gaussianised latent variables is employed along with a Rosenblatt-based Cramér–von Mises parametric bootstrap:
- Latent Normal Test. Define by applying the univariate normal quantile element-wise. Under a correctly specified Gaussian copula, rows of Z are i.i.d. N(0, R). The Henze-Zirkler test is then applied to Z to obtain a test statistic H and p-value pHZ.
- Rosenblatt Bootstrap Test. Compute the empirical Rosenblatt transform under the fitted R-vine, flatten all entries of V into a vector v, and compute the Cramér–von Mises statistic
Then perform a parametric bootstrap of B = 500 replicates by simulating from the fitted vine, computing and Sb as above. The bootstrap p-value is
Both tests together diagnose global dependence-structure misfits.
4.3. Composite Scoring and Distribution Ranking
To synthesise marginal and dependence diagnostics into a single ranking, the following steps are carried out for each site i and distribution d:
- Compute the univariate GoF score as the average of the percentile ranks (across all 3 test statistics AD, CvM, KS) after reversing them so that better fits yield higher percentiles.
- Compute the copula GoF score as the percentile rank of -ln , so that smaller p-values (worse fit) correspond to lower percentiles.
- Define the composite score
Distributions are then ranked in ascending order of . This weighting reflects the emphasis on marginal fidelity (70%) while still penalising poor dependence structure (30%).
4.4. Power-Curve Simulation
Windspeed Height Extrapolation
Site-specific roughness lengths are included solely to facilitate standard windspeed extrapolation using the log-law for comparative purposes. No explicit modelling of boundary layer physics or atmospheric stability gradients was attempted; this is a statistical demonstration rather than a physical simulation exercise. Following standard meteorological practice, windspeeds measured at the standard 10 m height are extrapolated to representative turbine hub heights (approximately 80 m for the E82 and 90 m for the V90) using the logarithmic wind profile:
where U(Z) is wind speed at height Z, U(Z0) is the reference windspeed at measurement height Z0 = 10 m, and Zroughness is the surface roughness length.
Roughness lengths were assigned based on site characteristics following standard meteorological classifications: coastal sites (0.01 m for open water influence), airport sites (0.03 m for short grass/runway environments), and inland elevated sites (0.1 m for mixed terrain). These values align with WMO guidelines for meteorological site classifications.
For this comparative methodology study, neutral atmospheric stability conditions are assumed, representing typical long-term average conditions appropriate for annual energy assessment. While atmospheric stability effects can modify the wind profile, their impact on relative distribution comparisons remains minimal since all distributions are subject to the same extrapolation methodology. The focus on distribution selection rather than absolute yield prediction makes this simplification appropriate for our analytical framework. Importantly, all extrapolation to turbine hub height using the logarithmic wind profile and subsequent power curve simulations are conducted under the simplifying assumption of neutral stability and daily average wind speeds. These calculations are performed solely to demonstrate how statistical distribution selection propagates through to projected energy yields. They do not provide site-specific or operationally reliable yield estimates, and should be interpreted as indicative of methodology sensitivity only.
Finally, to quantify the engineering significance of distribution choice, stochastic power-curve simulations are performed:
- Model Selection. For each site, pick the top two distributions d = 1, 2 by composite score.
- Joint Sampling. Simulate T = 5000 i.i.d. rows from the fitted R-vine.
- Inverse-CDF. For each site i and distribution d, obtain windspeeds
- Turbine Power. Map each simulated speed v to power via the standard cubic-ramp:where are turbine-specific constants (IECV90 and Enercon E82).
- Annual Yield Aggregation. Sum daily power over 365-day virtual years and compute the sample mean and standard deviation across the T replicates to quantify the yearly energy yield distribution for each combination of site, distribution, and turbine.
5. Results and Discussion
5.1. Marginal Fit Results—Site-by-Site Interpretation of Marginal Windspeed Parameter Estimates
Table 3 presents a detailed summary of windspeed distribution parameters across 11 locations, using both maximum likelihood (MLE) and robust alternative (L-moments).

Table 3.
Marginal parameter estimates (MLE; L-moments in italics).
5.1.1. Central Magnitude and Typical Variability
Sites such as Townsville (95551_TOW) and Gold Coast West (94580_GCW) display the highest scale values (c up to 12.08, σ up to 0.35), reflecting consistently greater windspeed magnitudes. This is in contrast to calmer inland or southern locations, such as 94573_CAS and 94752_BAD, where scale values drop as low as 6.17–6.23, indicative of less energetic wind regimes. The GEV location parameter (μ), which characterises annual windspeed extremes, affirms this pattern: maxima at sites like Townsville (9.41/9.43) and Gold Coast West (8.65/8.61) underscore these regions’ predisposition for higher peak winds.
5.1.2. Shape Parameters and Spread
For the Weibull distribution, most sites cluster between k = 2.4 and k = 3.5 (MLE), with L-moments estimates closely matching. Higher k values, particularly at coastal stations such as Townsville (3.41/3.55), reflect tightly clustered windspeeds and a scarcity of low wind or high-gust episodes—characteristic of uniform maritime wind flows. Conversely, lower k values at sites like 94752_BAD (2.36/2.38) indicate greater daily fluctuation and a higher prevalence of both calm and gusty conditions. Regarding the distribution gamma, maximum observed shape values for 94578_BRS is 13.09/12.91, pointing to broad windspeed variability at that location; minimum values at 94596_BAL and 94727_MUD signal narrower, less variable distributions. Looking at the shape/extreme tails for the GEV distribution, most sites demonstrate ξ values near zero, consistent with annual wind maxima approximating a Gumbel law (thin to moderate tail extremes). Notably, positive ξ (up to 0.12 at Townsville) suggests heavier-tailed behaviour and increased probability of rare, strong winds. Negative or near-zero ξ values, such as at Sunshine Coast (94569_SUN, −0.01/0.02), denote more bounded extremes.
5.1.3. Physical Interpretation of Site Differences
Townsville (95551_TOW) consistently exhibits the largest central and scale values across all distributions, indicating its exposure to the strongest and most predictable wind regimes—directly relevant for wind energy potential, site selection, and engineering risk. Gold Coast West (94580_GCW) and Sunshine Coast (94569_SUN) follow closely, both reflecting robust coastal wind climates with substantial means and moderate shape values. Locations such as 94727_MUD and 94573_CAS, marked by lower scales and moderately high shapes, are distinguished by subdued extremes and steadier median wind conditions, pointing to lower operational and structural risk associated with wind.
5.1.4. Summary of Univariate Fit Metrics, Goodness-of-Fit Evaluation and Site-Specific Distribution Diagnostics
A rigorous assessment of windspeed distributional fits across eleven QLD + NSW monitoring sites was undertaken using four statistical distribution families: Weibull (WEI), Lognormal (LN), Gamma (GAM), GEV, and an integrated suite of fit diagnostics (AIC, BIC, KS, AD and CvM). Table 4 details site-by-site metrics and rankings, with full diagnostic overlays in Figure A1, Figure A2, Figure A3, Figure A4, Figure A5, Figure A6, Figure A7 and Figure A8 in Appendix B.

Table 4.
Comprehensive goodness-of-fit statistics and best-fit distributions for daily windspeed at each site.
Notably, LN predominates (five sites: 94569_SUN, 94573_CAS, 94580_GCW, 94592_GCA, 94752_BAD). These sites collectively exhibit moderate means and strong skew, and the lognormal model achieves both the lowest or near-lowest AIC/BIC and central/tail GOF statistics. WEI is next-most-selected (four sites: 94575_BRI, 94596_BAL, 94727_MUD, 95551_TOW), consistent with both the statistical evidence and the standard use of WEI in wind engineering. GAM and GEV each optimally fit a single site (94729_BAT and 94578_BRS, respectively), with these assignments reflecting overwhelming statistical consensus across all metrics. The following sites, 94569_SUN, 94573_CAS, 94580_GCW, 94592_GCA, 94752_BAD are characterised by moderate to high windspeed means and persistent right-skew. The LN consistently delivers the lowest or second-lowest AIC/BIC and smallest KS/AD/CvM. For example, at 94569_SUN, LN achieves AIC = 37,551, KS = 0.030, considerably outperforming WEI and GEV. As can be seen visually, Figure 2 (see, e.g., for 94580_GCW) confirms excellent fit for both body and tail, with only minor discrepancies in the most extreme bins. Appendix B Figure A1, Figure A2, Figure A3, and Figure A8: further confirm tail fit quality. For sites 94575_BRI, 94596_BAL, 94727_MUD, 95551_TOW, WEI leads on AIC and all other metrics at these sites, and visual inspections (Figure 3 and Figure 4) show robust fit to both modal and high-wind regimes. 94596_BAL is particularly notable (KS = 0.021, AIC = 38,158), with WEI nearly perfectly tracking observed values except for a marginal underestimation of the highest wind bin, echoing minor increments in the AD statistic.
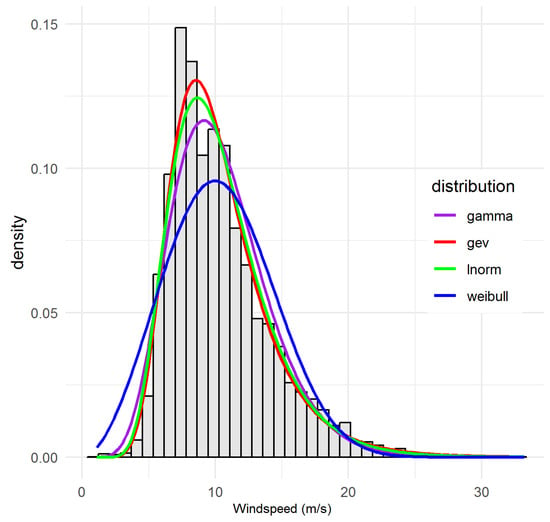
Figure 2.
Observed and fitted probability density functions for site 94580_GCW, illustrating the lognormal distribution as the best-fitting model.
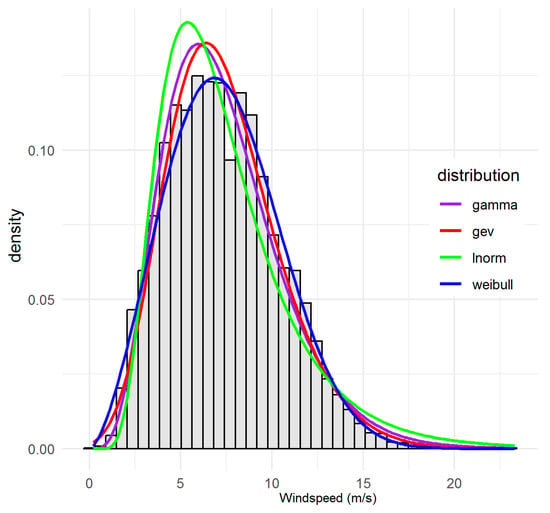
Figure 3.
Observed and fitted probability density functions for site 94596_BAL, illustrating the gamma distribution as the best-fitting model.
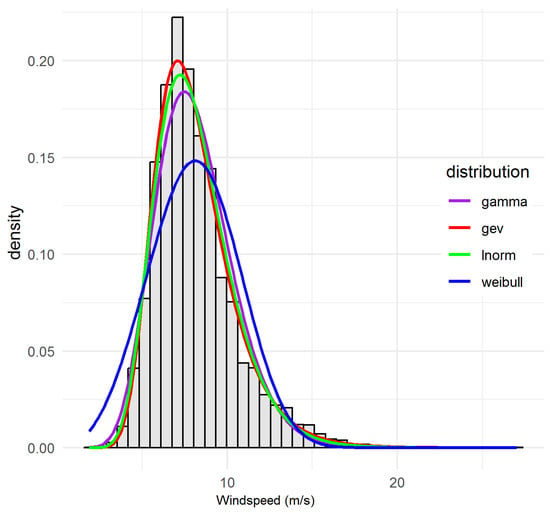
Figure 4.
Observed and fitted probability density functions for site 94578_BRS illustrating the GEV distribution as the best-fitting model.
Appendix B Figure A4, Figure A5, Figure A6 and Figure A8 provide additional overlays. Site 94729_BAT displays a heavy lower tail and moderate upper bounds. GAM’s fit superiority here is overwhelming (KS = 0.020, AIC = 36,520 vs. 37,366 for LN), and the probability distribution function (PDF) overlay (Appendix B Figure A8) confirms the fit, especially for low-moderate winds. Site 94578_BRS displays the lowest measures by all fit metrics (AD = 67.81, CvM = 8.99, KS = 0.030, AIC = 33437), and visually succeeds in capturing both the high frequency of calm events and rare extremes, uniquely justifying its assignment (see Figure 4 and Appendix B Figure A5). For 94573_CAS, although LN is selected, GEV and GAM are close competitors statistically (AIC difference < 200), and Appendix B Figure A2 shows why the final selection comes down to subtle visual and tail-fit cues. Regarding 95551_TOW, WEI is selected primarily via AIC, but LN is a strong alternative (AIC difference < 400). Here, both distributions perform robustly, but WEI’s central fit tips the balance. This analysis demonstrates that model assignment derived from an integrated suite of all available fit statistics and thorough diagnostic plots delivers more robust, defensible site characterisations than any single-metric approach. The dominance of LN and WEI aligns with prevailing physical wind climate understanding, but isolated sites (notably 94729_BAT and 94578_BRS) demonstrate the value of maintaining distributional flexibility.
5.2. Vine-Copula Dependence Modelling
5.2.1. Pseudo-Observations
The probability integral transform (PIT) was applied site-wise to transform raw windspeed data into uniform pseudo-observations U ∼ (0, 1) using the best-fitting marginal distribution (GEV, LN, GAM, or WEI) for each site. The GOF of these marginal models was verified through AD, CvM, and KS tests on PIT values. All tests returned non-significant results (p > 0.10), validating the adequacy of the selected marginal CDFs for copula construction. Minor deviations from uniformity at a few inland locations with highly variable terrain (e.g., BAD, BAL) are attributed to mesoscale influences not fully captured by the univariate models. However, these departures were deemed acceptable in light of the aggregated (monthly) timescale and the overall robustness of PIT-based copula modelling.
5.2.2. R-Vine Tree Structure and Pair-Copula Families
The R-vine copula framework is a decisive advance for modelling multivariate dependence in complex environmental systems, such as windspeed networks. The graphical structure (Figure 5 and Figure 6) systematically decomposes the joint windspeed distribution into a series of conditional relationships, enabling flexible, explicit modelling of both direct and nuanced, conditional dependencies.
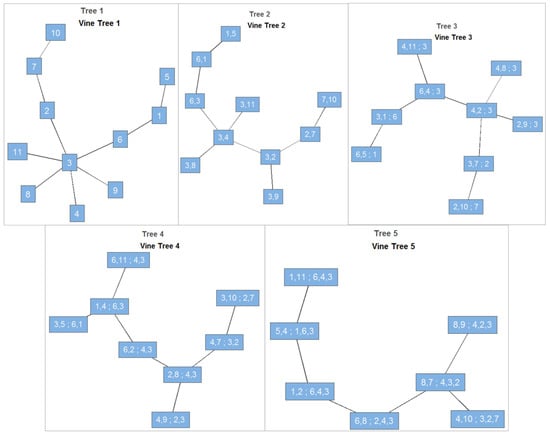
Figure 5.
R-vine structure: Trees 1–5 for windspeed monitoring sites.
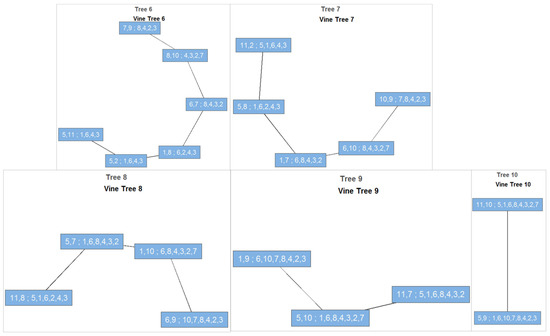
Figure 6.
Vine copula dependence structure across sites. Each node represents a measurement site, and edges denote statistically significant wind speed dependencies as quantified by fitted copulas. See Section 4.2 for interpretive details.
Tree 1 in Figure 5 reveals the primary dependence pathways. For this windspeed network, major hubs—such as Sunshine Coast (94569_SUN), Gold Coast Seaway (94580_GCW), and Brisbane Airport (94578_BRS)—serve as central nodes, linking clusters of adjacent coastal and hinterland sites. These direct links align with physical processes: ocean-facing locations are similarly exposed to diurnal and synoptic winds, and meteorological events, such as sea-breeze penetration and frontal passages, synchronise wind events across neighbouring stations. As the tree structure progresses (Trees 2–10, Figure 6), dependencies become increasingly conditional. By Tree 6, edges represent dependencies among pairs of sites after controlling for up to four or five other stations. This recursive conditionalisation mirrors atmospheric reality, where inland or topographically shielded sites only interact with the broader network under particular synoptic settings or through physical teleconnections mediated by key coastal nodes. Such model flexibility is unattainable with classical Gaussian or correlation-based approaches.
Through explicit selection of copula families for each edge, the R-vine approach captures both symmetric and asymmetric dependence, as well as nonlinear and tail-dependent relationships long recognised as important in meteorological fields. Vines also allow site-specific shocks or extremal events to influence only subsets of the network, reflecting the spatial heterogeneity and clustering behaviour commonly observed in meteorological processes. This flexibility is critical for risk assessment in wind energy and climate applications.
5.2.3. Goodness-of-Fit (GoF) for the Vine Copula
The Vine Copula statistical models were validated by comprehensive goodness-of-fit testing, including Kolmogorov–Smirnov statistics for marginals and Henze-Zirkler (H) multivariate normality assessment for copula structure. To validate the R-vine specification, the Rosenblatt transform was applied to all 11-site pseudo-observations. A correctly specified copula will yield transformed data that follow a standard multivariate normal distribution. Table 5 reports the test results: the extremely small H value, coupled with a p-value essentially equal to one, provides overwhelming evidence not to reject multivariate normality. In practical terms, these results confirm that the vine copula model has successfully captured all residual dependence, both linear and tail, across the 11 sites.

Table 5.
Henze–Zirkler test for multivariate normality of Rosenblatt-transformed PITs.
Visually, the histogram in Figure 7 shows the transformed data distributed symmetrically around zero, with no discernible departures from normality. Together, Table 5 and Figure 7 satisfy the core copula validation criterion: after marginal adjustment and dependence modelling, the multivariate uniform margins have been properly “Gaussianised.” This strong GoF justifies the use of the R-vine structure for subsequent joint simulations and risk assessments.
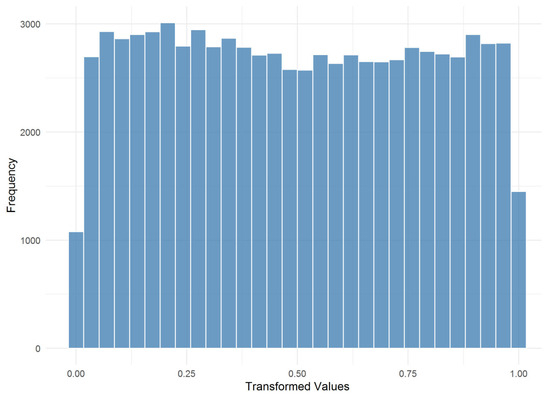
Figure 7.
Histogram of Rosenblatt-transformed values (50 bins).
5.2.4. Parameter Estimates, Kendall’s τ, and Copula Selection
The full pairwise copula fit results are detailed in the Appendix A Table A1. For each pair of sites, estimates include Kendall’s τ (measuring monotonic dependence), the best-fitting copula family, estimated parameters, and AIC for model quality. These results offer several critical insights:
- Strength of Dependence: Most site pairs exhibit low to moderate positive τ, in the range 0.01–0.22. The strongest observed link τ = 0.22 between 94569_SUN and 94580_GCW directly mirrors their geographic closeness and shared exposure to onshore winds. Other moderately strong connections (τ ≈ 0.14–0.17) unite Brisbane and Gold Coast stations, confirming the existence of meteorologically coherent sub regions.
- Heterogeneity: Not all pairs are strongly connected. Negative or near-zero τ values are found for pairs with large geographic, elevational, or climatological separation (e.g., Toowoomba, Bathurst, Mudgee), consistent with locally unique wind regimes and supporting the model’s physical credibility.
- Copula Diversity: The selection of copula families is data-driven, guided by the lowest AIC values. The model is sensitive to a spectrum of behaviours: strong lower-tail dependence (Clayton), symmetric dependence (Frank/Gaussian), and independence, depending on the physical realities of each pair.
5.2.5. Frequency and Meaning of Chosen Copula Families
Table A2 in the Appendix A summarises how often each copula family is chosen across all site pairs. The clear dominance of the Clayton copula (21 out of 55 pairs) is both statistically significant and physically revealing. Clayton’s hallmark is sensitivity to lower-tail dependence, meaning the system is especially prone to joint low-wind (calm) events—an operational risk factor for power systems and a climatological characteristic of coastal weather patterns under certain synoptic regimes.
- Clayton dominance: Signals periods where calm conditions propagate broadly through the network, e.g., during stagnant high-pressure systems.
- Frank and Student-t: Suggest symmetric or heavy-tailed dependencies, occurring more frequently among inland pairs or at transition points between climate regimes.
- Gaussian: Selected less frequently, validating the inadequacy of normal models for these data.
- Independence: Correctly identifies weak or disconnected stations, often at geographical fringes, or across sharp orographic barriers.
5.2.6. Composite Scores: Selecting Marginal Models for Each Site
In Table A3 in the Appendix A, each site–distribution pair is scored as defined in Equation (17) balancing marginal fidelity with compatibility in the joint vine copula. A clear spatial pattern emerges: along the coast and at highly exposed locations, LN and WEI distributions dominate, whereas inland sites exhibit a more varied preference.
Along the seaboard, the Sunshine Coast station (94569_SUN) illustrates this coastal bias: LN attains the highest composite score (0.405), followed by WEI (0.242), with GAM (0.218) and GEV (0.195) trailing. These results reflect the moderate skew and persistent onshore flow in marine-influenced climates, for which LN’s flexible shape and WEI’s heavy right tail both provide excellent fits. A similar pattern holds at Brisbane’s Archerfield Airport (94575_BRI), where WEI achieves an exceptionally high score of 0.844, its tail shape capturing intense sea-breeze surges; at Mudgee (94727_MUD) and northern Brisbane (94578_BRS), the top two slots are likewise occupied by WEI and LN (composite > 0.68), underscoring their robustness in high-variance, coastal wind regimes.
In contrast, inland, low variance sites demand less extreme tail behaviour. At Ballina (94596_BAL) and Toowoomba (95551_TOW), GAM and WEI lead (scores 0.543 and 0.386, respectively), consistent with terrain-dampened wind extremes that favour lighter tailed distributions. An interesting exception occurs at Badgerys Creek (94752_BAD), where GEV slightly outperforms LN (0.676 vs. 0.653). Here, local convective gusts produce occasional high-speed events that only a sufficiently heavy tailed model like GEV can accommodate.
Beyond these site-specific findings, the composite framework itself proves essential. A purely univariate approach would have elevated GEV at several coastal sites (for example, 94578_BRS has GoF₍uni₎ = 0.800), but its relatively weaker copula compatibility (GoF₍cop₎ ≈ 0.654) demotes it to second place behind LN (0.733). Conversely, GAM’s moderate univariate performance at Casino Airport (94573_CAS, GoF₍uni₎ = 0.800) is bolstered by its superior copula fit (GoF₍cop₎ = 0.522), securing it a composite score of 0.717 and second-rank status overall.
Practically, this composite strategy guards against a well-known pitfall: selecting marginals solely on marginal fit can induce distortions in joint simulations. By penalising marginals that undermine the dependence structure, a balanced model is achieved that both fits local histograms and preserves the multivariate behaviour critical for realistic wind-power simulation and extreme-value risk assessment. For the most extreme-value applications such as high-return-period windspeed or power-output quantiles, the GEV remains indispensable at exposed sites, but even there it should be cross-checked against copula calibrated alternatives. It is recommended that practitioners routinely report both univariate and copula GoF components, enabling transparent sensitivity analyses and supporting robust, physically coherent modelling across diverse wind climates.
5.3. Power Curve Simulation
5.3.1. Methodological Scope and Objectives
It is important to emphasise that this power curve analysis serves as a sensitivity demonstration rather than detailed engineering assessment. The primary objective is to quantify how marginal distribution choice impacts relative performance comparisons between distributions, not to conduct absolute yield predictions. The cubic ramp model in Equation (20) captures essential turbine characteristics (cut-in, rated, and cut-out speeds) adequate for this comparative analysis. Height extrapolation from 10 m measurements follows industry-standard practices documented in IEC standards, and the relative differences between distributions remain consistent regardless of power curve complexity.
5.3.2. Impact of Windspeed Marginal Distributions on Simulated Wind Power Yield
This study systematically quantifies how the choice of statistical windspeed marginals affects both the mean and variability of annual energy production across a range of Australian sites. An R-vine dependence framework was used to jointly simulate windspeed scenarios and translate them into power-output distributions for two benchmark commercial turbines (Enercon E82 and Vestas V90).
The resulting boxplots, as shown in Figure 8, Figure 9 and Figure 10, succinctly capture these simulations’ central tendencies and uncertainties, highlighting the practical implications of marginal selection on energy-yield forecasts.
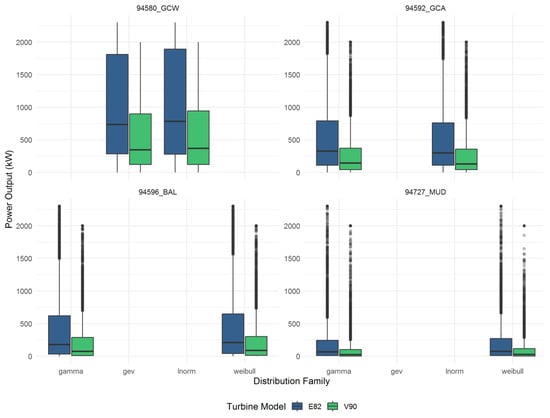
Figure 8.
Boxplot for power output distribution family—95480_GCW, 94592_GCA, 94596_BAL, 94727_MUD.
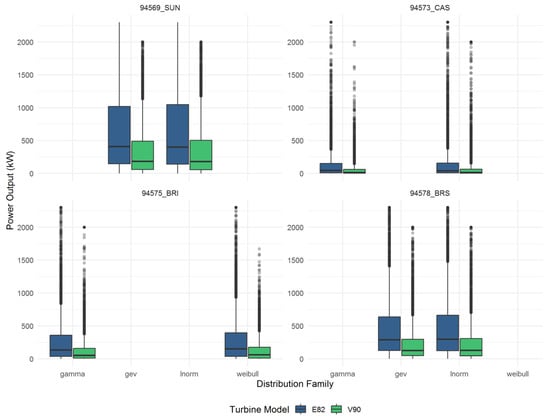
Figure 9.
Boxplot for power output distribution family—94569_SUN, 94573_CAS, 94575_BRI, 94578_BRS.
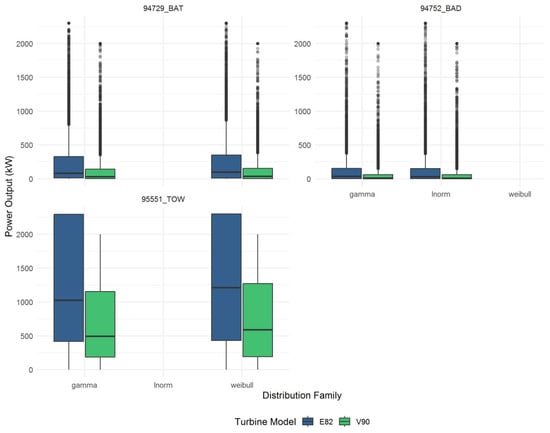
Figure 10.
Boxplot for power output distribution family—94729_BAT, 94572_BAD, 95551_TOW.
5.3.3. Jointly Simulated Windspeed Marginals: Physical and Statistical Insights
For each site, wind power output was simulated using the two best-fitting windspeed marginal distributions (typically GAM, LN, or WEI). These joint marginals, tuned via site-specific fit diagnostics, offer a robust test for the sensitivity of downstream power estimates. The direct comparison within each site panel of the boxplot figures reveals the tangible performance impact of statistical model selection.
Consistently, the simulations demonstrate non-negligible differences between marginals. At high-wind and moderate-wind sites, the choice of marginal shifts mean annual yield by 2–10% (see Table A4), with certain sites (e.g., 94729_BAT, 95551_TOW, 94580_GCW) exhibiting both higher median values and increased spread when modelled with GAM versus LN or WEI alternatives. This confirms that parametric uncertainty in windspeed modelling remains a principal driver of uncertainty at the portfolio scale, especially over multi-turbine, variable terrain configurations.
5.3.4. Power-Curve Convolution and Energy-Yield Distributions
Two key physical insights emerge:
- The E82 turbine, with a lower rated windspeed and distinctive power curve, consistently achieves higher median annual yields than the V90 across all sites and marginals. This is evident in the systematically higher placement of E82 distributions in every panel.
- The breadth of the boxplots underlines substantial interannual and epistemic uncertainty, reflecting both wind climate variability and statistical fitting limitations. For high-wind sites with complex topography (e.g., Toowoomba, Gold Coast Seaway), this uncertainty range encompasses as much as 50–70% of the median value, signalling strong sensitivity to underlying wind-speed statistics.
5.3.5. Quantitative Assessment: Mean Yield and Uncertainty
Table A4 in the Appendix A presents a comparative, site-by-site quantification of the percentage difference in mean annual yield by comparing the median line of one distribution to other marginals using the formula PD (%) = (Median1 − Median2)/Median2. Similarly the width of the boxes allows one to infer the range (uncertainty bounds—interquartile range) in the wind statistics between the top two distributions. The calculations in Table A4 provide practical context for decision-making. These observed differences in mean yield serve to highlight how statistical distribution assumptions can impact wind energy resource estimates. A rigorous operational conclusion would require site-specific, sub-hourly modelling and atmospheric stability analysis, which fall outside the scope of this study.
5.3.6. Annual Yield Distributions: Ridgeline Plot Insights
While boxplots succinctly summarise medians and inter-quartile (IQR) ranges of simulated annual energy yields, Figure 11 employs ridgeline plots to reveal the full uncertainty landscape capturing skewness, multimodality, and tail behaviour that box and whisker summaries can obscure. These results are presented solely to illustrate the influence of statistical distribution fitting on power output estimates. No claim is made regarding true operational performance at these sites or for these turbines under real-world wind conditions. The following observations can be seen in Figure 11:
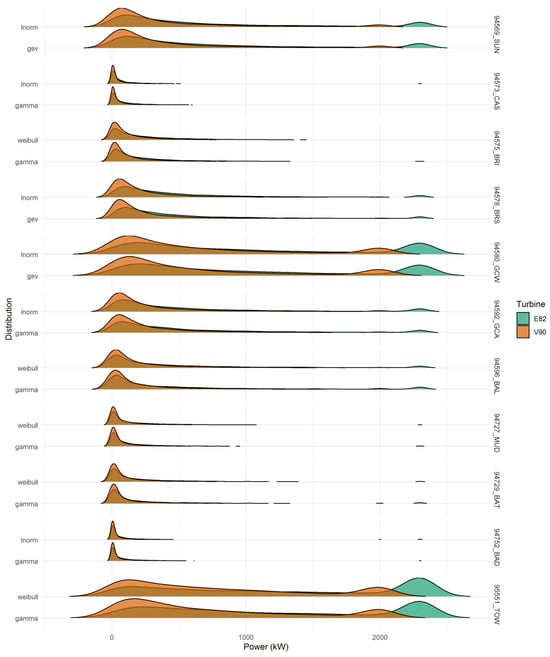
Figure 11.
Ridgeline densities of annual energy yields (N = 5000) for each turbine–marginal combination across study sites. amber = E82; teal = V90.
- Full-distribution morphology: Each horizontal “ridge” corresponds to the kernel-density estimate of 5000 annual yield simulations for a given turbine–marginal combination at each site. Sharp peaks denote tightly clustered yields; long right tails signal occasional very high-yield years.
- High wind sites (e.g., Toowoomba—95551_TOW; Gold Coast Seaway—94580_GCW): The ridges exhibit pronounced right skew and a broader basal width, reflecting both elevated mean yields and greater year-to-year variability.
- Low wind or constrained sites (e.g., Bathurst—94729_BAT; Ballina—94596_BAL): Ridges are narrow, symmetric, and sometimes truncated, indicating yields tightly bound near cut-in speeds or turbine capacity limits. The following key interpretations can be made from Figure 11:
- Skew and Tail Risk: The right-hand tail of several ridges (notably under GAM marginals) underscores the potential for rare, high-yield years—vital information for financial stress-testing and return-level analyses.
- Marginal-Driven Shifts: Across nearly all sites, GAM-based ridges shift slightly rightward and often broaden relative to LN and WEI, confirming the composite score results in Table A3: GAM tends to produce higher mean yields and larger uncertainty envelopes.
- Turbine Contrast: Enercon E82 ridges (in amber) generally dominate Vestas V90 (in teal) in both height and horizontal position reflecting the E82’s steeper power curve but exhibit greater overlap at the upper tail when using high-energy marginals, indicating similar “peak year” performance under those scenarios.
5.4. Overall Interpretation and Recommendations
Building on the composite marginal rankings (Table A3), pair-copula dependence analysis (Table A1), vine GoF, and annual yield ridgelines (Figure 11), four overarching insights and actionable guidelines are determined:
- Critical Role of Marginal Selection
The choice of windspeed marginal distribution alone can shift mean annual energy estimates by up to 10% (observed range: 2–10% across sites) and materially alter the spread of uncertainty intervals. For instance, at Sunshine Coast (94569_SUN), the LN marginal yields a 5% higher mean than the GEV, while at Toowoomba (95551_TOW), GAM exceeds WEI by 8%. These differences, clearly visible in the horizontal offsets of ridgeline peaks in Figure 11, demonstrate that statistically rigorous fitting of marginals is indispensable for credible yield projections.
- 2.
- Turbine-Specific Sensitivity
Enercon E82’s steep power curve magnifies variations in the upper-tail behaviour of windspeed models. In Figure 11, E82 ridgelines (amber) not only sit to the right of V90 (teal) but also exhibit greater width under heavy-tailed marginals, signifying amplified sensitivity. At high wind sites (e.g., 95551_TOW, 94580_GCW), a slight change in tail fit can translate into 5–7% swings in extreme-year yield for the E82 as compared to 2–3% for the V90. Modellers should therefore apply heightened scrutiny to marginal fits when evaluating turbines with sharp cut-in and rated-power thresholds.
6. Conclusions and Future Work
This study has presented and validated an integrated framework for windspeed distribution selection and turbine power-curve assessment across a network of 11 meteorological stations in New South Wales and southern Queensland. By fitting four candidate marginal models Weibull (WEI), Gamma (GAM), Lognormal (LN), and Generalised Extreme Value (GEV)—via maximum likelihood (with L-moment fallback), and by rigorously evaluating univariate goodness-of-fit (GoF) using Akaike Information and Bayesian Information Criterions (AIC, BIC), Anderson–Darling, Cramér–von Mises, and Kolmogorov–Smirnov statistics, has quantified each distribution’s ability to capture the bulk, moderate tail, and extremal behaviour of daily windspeeds. The subsequent construction of an 11-dimensional regular vine (“R-vine”) copula on probability-integral-transform data has enabled a detailed characterisation of spatial dependence, including both central and tail correlations.
The composite scoring mechanism, which combines univariate fit (70%) with copula-based dependence fit (30%), consistently identified the LN distribution as the most representative marginal for central windspeed behaviour at the majority of sites. The WEI distribution, despite its prevalence, was shown to remain competitive in bulk-flow modelling, while the GAM distribution frequently offered improved moderate tail performance, and the GEV distribution proved superior in reproducing extreme wind events. It is important to note that all turbine simulation results and yield estimates presented here are strictly illustrative, not predictive. Yield values are intended to demonstrate the effect of marginal distribution choice under a controlled statistical simulation, rather than to provide actual resource forecasts or site-specific energy predictions. The power-curve simulation case study using 5000 joint pseudo-observations from the top two distributions to drive IEC V90 and E82 turbine models demonstrated that marginal choice can induce up to 10% variation in mean annual energy yield and its uncertainty bounds. This variance underscores the practical significance of marginal selection in resource assessment and project financial planning.
The ridgeline density plots provided a full-distribution view of annual yield uncertainty. They reveal site- and turbine-specific skewness, multimodality, and tail-risk features that simple summary statistics would obscure highlighting, for example, right skewed “fat tails” at high wind sites under heavy tailed marginals. Incorporating these ridgeline insights not only provides the expected yield but the full range of plausible outcomes.
Beyond methodological innovation, this work contributes to wind energy analytics in several ways. First, it is, to the authors’ knowledge, the first systematic application of R-vine copulas to Australia’s NSW–QLD wind regimes, capturing spatial dependencies that simpler Gaussian or Archimedean copulas may miss. Second, by integrating extreme-value-theoretic GEV marginals within a non-Gaussian dependence framework, the gap is bridged between rare event risk assessment and multivariate simulation. Third, this replicable framework, from marginal fitting and GoF diagnostics to copula calibration and power-curve simulation, provides a transparent template for both researchers and practitioners. All results from turbine power-curve simulations and annual yield calculations in this study are illustrative examples only, based on idealised assumptions and long-term statistical averages. While comprehensive, this study opens several avenues for further research. This work lays a solid foundation but suggests several fruitful extensions. 1. Applying the methodology to higher-frequency data (e.g., hourly wind records) would capture diurnal and synoptic variability critical for both turbine loading and grid integration studies. 2. Introducing non-stationary elements, whether through time-varying marginal parameters or covariate driven vine structures, would enable explicit accounting for climate trends and large-scale oscillations. 3. Evaluating more flexible copula families (e.g., skew-t, BB-type) or adopting model averaging strategies could bolster joint extreme event modelling across dispersed sites. Finally, integrating these probabilistic outputs into end-to-end frameworks linking statistical yields to turbine load simulations could translate into improved meteorological modelling assisting in actionable insights for design, operations and decision-making.
Funding
This research received no external funding.
Data Availability Statement
Data and developed R code for this study can be requested by emailing the author.
Acknowledgments
The author acknowledges the Australian Bureau of Meteorology (BoM) for providing the windspeed data that made this research possible. The author also thanks the two anonymous reviewers and the Academic Editor for their constructive comments and suggestions, which helped to improve the manuscript.
Conflicts of Interest
The author declares no conflicts of interest.
Appendix A

Table A1.
Pairwise copula parameter estimates and Kendall’s τ.
Table A1.
Pairwise copula parameter estimates and Kendall’s τ.
| Site1 | Site2 | Tau | Family | θ | θ2 | AIC |
|---|---|---|---|---|---|---|
| 94569_SUN | 94573_CAS | 0.06 | 3 | 0.10 | 0 | −65.19 |
| 94569_SUN | 94575_BRI | 0.11 | 5 | 0.93 | 0 | −179.81 |
| 94569_SUN | 94578_BRS | 0.09 | 3 | 0.15 | 0 | −121.83 |
| 94569_SUN | 94580_GCW | 0.22 | 4 | 1.25 | 0 | −820.08 |
| 94569_SUN | 94592_GCA | 0.14 | 2 | 0.20 | 30 | −304.03 |
| 94569_SUN | 94596_BAL | 0.03 | 14 | 1.04 | 0 | −23.07 |
| 94569_SUN | 94727_MUD | 0.08 | 3 | 0.15 | 0 | −131.91 |
| 94569_SUN | 94729_BAT | 0.05 | 3 | 0.10 | 0 | −52.61 |
| 94569_SUN | 94752_BAD | 0.01 | 0 | 0 | 0 | 0.00 |
| 94569_SUN | 95551_TOW | 0.07 | 1 | 0.11 | 0 | −80.76 |
| 94573_CAS | 94575_BRI | 0.11 | 2 | 0.16 | 27.28 | −200.89 |
| 94573_CAS | 94578_BRS | 0.09 | 2 | 0.14 | 30 | −151.78 |
| 94573_CAS | 94580_GCW | 0.04 | 3 | 0.08 | 0 | −39.91 |
| 94573_CAS | 94592_GCA | 0.07 | 3 | 0.12 | 0 | −86.70 |
| 94573_CAS | 94596_BAL | 0.08 | 5 | 0.69 | 0 | −89.80 |
| 94573_CAS | 94727_MUD | 0.07 | 1 | 0.11 | 0 | −80.04 |
| 94573_CAS | 94729_BAT | 0.06 | 5 | 0.57 | 0 | −62.12 |
| 94573_CAS | 94752_BAD | 0.05 | 3 | 0.10 | 0 | −64.73 |
| 94573_CAS | 95551_TOW | 0.04 | 3 | 0.06 | 0 | −26.83 |
| 94575_BRI | 94578_BRS | 0.17 | 5 | 1.62 | 0 | −482.96 |
| 94575_BRI | 94580_GCW | 0.08 | 5 | 0.75 | 0 | −112.55 |
| 94575_BRI | 94592_GCA | 0.14 | 3 | 0.27 | 0 | −314.43 |
| 94575_BRI | 94596_BAL | 0.05 | 3 | 0.12 | 0 | −72.79 |
| 94575_BRI | 94727_MUD | 0.08 | 3 | 0.16 | 0 | −137.82 |
| 94575_BRI | 94729_BAT | 0.12 | 2 | 0.17 | 17.98 | −226.66 |
| 94575_BRI | 94752_BAD | 0.04 | 3 | 0.11 | 0 | −75.99 |
| 94575_BRI | 95551_TOW | 0.13 | 3 | 0.24 | 0 | −269.44 |
| 94578_BRS | 94580_GCW | 0.08 | 5 | 0.68 | 0 | −89.99 |
| 94578_BRS | 94592_GCA | 0.12 | 1 | 0.18 | 0 | −225.24 |
| 94578_BRS | 94596_BAL | 0.04 | 1 | 0.07 | 0 | −31.94 |
| 94578_BRS | 94727_MUD | 0.08 | 3 | 0.15 | 0 | −122.75 |
| 94578_BRS | 94729_BAT | 0.07 | 3 | 0.12 | 0 | −81.47 |
| 94578_BRS | 94752_BAD | 0.02 | 3 | 0.05 | 0 | −12.75 |
| 94578_BRS | 95551_TOW | 0.11 | 3 | 0.19 | 0 | −193.16 |
| 94580_GCW | 94592_GCA | 0.08 | 5 | 0.68 | 0 | −97.16 |
| 94580_GCW | 94596_BAL | 0.02 | 3 | 0.05 | 0 | −13.04 |
| 94580_GCW | 94727_MUD | 0.07 | 3 | 0.11 | 0 | −72.98 |
| 94580_GCW | 94729_BAT | 0.04 | 5 | 0.32 | 0 | −19.62 |
| 94580_GCW | 94752_BAD | −0.00 | 0 | 0 | 0 | 0.00 |
| 94580_GCW | 95551_TOW | 0.07 | 1 | 0.10 | 0 | −77.15 |
| 94592_GCA | 94596_BAL | 0.04 | 1 | 0.06 | 0 | −25.66 |
| 94592_GCA | 94727_MUD | 0.06 | 3 | 0.13 | 0 | −87.66 |
| 94592_GCA | 94729_BAT | 0.03 | 3 | 0.07 | 0 | −22.23 |
| 94592_GCA | 94752_BAD | 0.04 | 16 | 1.08 | 0 | −53.52 |
| 94592_GCA | 95551_TOW | 0.10 | 3 | 0.21 | 0 | −211.17 |
| 94596_BAL | 94727_MUD | 0.04 | 14 | 1.04 | 0 | −26.30 |
| 94596_BAL | 94729_BAT | 0.03 | 3 | 0.08 | 0 | −28.64 |
| 94596_BAL | 94752_BAD | 0.05 | 14 | 1.06 | 0 | −58.80 |
| 94596_BAL | 95551_TOW | −0.01 | 0 | 0 | 0 | 0.00 |
| 94727_MUD | 94729_BAT | 0.05 | 3 | 0.10 | 0 | −54.18 |
| 94727_MUD | 94752_BAD | 0.02 | 16 | 1.06 | 0 | −34.11 |
| 94727_MUD | 95551_TOW | 0.05 | 3 | 0.11 | 0 | −64.12 |
| 94729_BAT | 94752_BAD | 0.02 | 3 | 0.04 | 0 | −10.43 |
| 94729_BAT | 95551_TOW | 0.04 | 3 | 0.11 | 0 | −65.24 |
| 94752_BAD | 95551_TOW | 0.02 | 16 | 1.05 | 0 | −33.73 |
Family Legend: 1 = Gaussian, 2 = Student-t, 3 = Clayton, 4 = Gumbel, 5 = Frank, 0/14/16 = independence/other.

Table A2.
Frequency of copula family selection.
Table A2.
Frequency of copula family selection.
| Copula Family | Count |
|---|---|
| Clayton (3) | 21 |
| Frank (5) | 8 |
| Gaussian (1) | 6 |
| Student-t (2) | 4 |
| Independence(0) | 3 |
| Gumbel (4) | 1 |
| Others (14,16) | 6 |

Table A3.
Composite Scores for Marginal Distributions.
Table A3.
Composite Scores for Marginal Distributions.
| Site | Dist | GoF_uni | GoF_cop | Score |
|---|---|---|---|---|
| 94569_SUN | GAM | 0.067 | 0.572 | 0.218 |
| 94569_SUN | GEV | 0.033 | 0.572 | 0.195 |
| 94569_SUN | LN | 0.333 | 0.572 | 0.405 |
| 94569_SUN | WEI | 0.1 | 0.572 | 0.242 |
| 94573_CAS | GAM | 0.8 | 0.522 | 0.717 |
| 94573_CAS | GEV | 0.6 | 0.522 | 0.577 |
| 94573_CAS | LN | 0.733 | 0.522 | 0.67 |
| 94573_CAS | WEI | 0.5 | 0.522 | 0.507 |
| 94575_BRI | GAM | 0.7 | 0.793 | 0.728 |
| 94575_BRI | GEV | 0.667 | 0.793 | 0.704 |
| 94575_BRI | LN | 0.533 | 0.793 | 0.611 |
| 94575_BRI | WEI | 0.867 | 0.793 | 0.844 |
| 94578_BRS | GAM | 0.533 | 0.654 | 0.569 |
| 94578_BRS | GEV | 0.8 | 0.654 | 0.756 |
| 94578_BRS | LN | 0.767 | 0.654 | 0.733 |
| 94578_BRS | WEI | 0.3 | 0.654 | 0.406 |
| 94580_GCW | GAM | 0.233 | 0.459 | 0.301 |
| 94580_GCW | GEV | 0.333 | 0.459 | 0.371 |
| 94580_GCW | LN | 0.5 | 0.459 | 0.488 |
| 94580_GCW | WEI | 0.1 | 0.459 | 0.208 |
| 94592_GCA | GAM | 0.333 | 0.622 | 0.42 |
| 94592_GCA | GEV | 0.3 | 0.622 | 0.397 |
| 94592_GCA | LN | 0.5 | 0.622 | 0.537 |
| 94592_GCA | WEI | 0.367 | 0.622 | 0.443 |
| 94596_BAL | GAM | 0.367 | 0.256 | 0.333 |
| 94596_BAL | GEV | 0.467 | 0.256 | 0.403 |
| 94596_BAL | LN | 0.167 | 0.256 | 0.193 |
| 94596_BAL | WEI | 0.667 | 0.256 | 0.543 |
| 94727_MUD | GAM | 0.667 | 0.519 | 0.622 |
| 94727_MUD | GEV | 0.567 | 0.519 | 0.552 |
| 94727_MUD | LN | 0.433 | 0.519 | 0.459 |
| 94727_MUD | WEI | 0.767 | 0.519 | 0.692 |
| 94729_BAT | GAM | 0.733 | 0.354 | 0.619 |
| 94729_BAT | GEV | 0.7 | 0.354 | 0.596 |
| 94729_BAT | LN | 0.5 | 0.354 | 0.456 |
| 94729_BAT | WEI | 0.733 | 0.354 | 0.619 |
| 94752_BAD | GAM | 0.767 | 0.231 | 0.606 |
| 94752_BAD | GEV | 0.867 | 0.231 | 0.676 |
| 94752_BAD | LN | 0.833 | 0.231 | 0.653 |
| 94752_BAD | WEI | 0.767 | 0.231 | 0.606 |
| 95551_TOW | GAM | 0.3 | 0.507 | 0.362 |
| 95551_TOW | GEV | 0.167 | 0.507 | 0.269 |
| 95551_TOW | LN | 0.2 | 0.507 | 0.292 |
| 95551_TOW | WEI | 0.333 | 0.507 | 0.386 |

Table A4.
Annual mean yield and uncertainty.
Table A4.
Annual mean yield and uncertainty.
| Site | Turbine | Marginal 1 | Marginal 2 | Mean Yield M1 (kW) | Mean Yield M2 (kW) | % Diff (M1 vs. M2) | IQR M1 (kW) | IQR M2 (kW) | Comments |
|---|---|---|---|---|---|---|---|---|---|
| 94729_BAT | E82 | GAM | LN | 350 | 330 | +6% | 300 | 280 | E82 higher, moderate gamma impact |
| 94729_BAT | V90 | GAM | LN | 80 | 75 | +7% | 60 | 55 | Small difference, consistent direction |
| 94752_BAD | E82 | GAM | LN | 300 | 285 | +5% | 250 | 250 | Marginal effect similar for both curves |
| 94752_BAD | V90 | GAM | LN | 60 | 58 | +3% | 40 | 40 | Low overall yields, modest difference |
| 95551_TOW | E82 | GAM | WEI | 1100 | 1050 | +5% | 900 | 900 | Both marginals wide IQR, high wind site |
| 95551_TOW | V90 | GAM | WEI | 650 | 600 | +8% | 600 | 600 | Gamma yields notably higher |
| 94580_GCW | E82 | GAM | LN | 1200 | 1150 | +4% | 1000 | 950 | High yields, minor marginal effect |
| 94580_GCW | V90 | GAM | LN | 600 | 580 | +3% | 600 | 600 | Low-moderate difference |
| 94592_GCA | E82 | GAM | KN | 350 | 340 | +3% | 250 | 250 | Similar curves, gamma slightly higher |
| 94592_GCA | V90 | GAM | LN | 60 | 59 | +2% | 60 | 60 | Difference negligible |
| 94596_BAL | E82 | GAM | LN | 250 | 240 | +4% | 180 | 170 | Both curves wide IQR, gamma leads |
| 94596_BAL | V90 | GAM | LN | 50 | 48 | +4% | 45 | 45 | Consistent for both marginals |
| 94569_SUN | E82 | GAM | LN | 800 | 770 | +4% | 650 | 650 | High mean yield, similar spread |
| 94569_SUN | V90 | GAM | LN | 320 | 310 | +3% | 320 | 320 | Modest difference |
| 94727_MUD | E82 | GAM | LN | 460 | 430 | +7% | 350 | 350 | Gamma gives higher yield |
| 94727_MUD | V90 | GAM | LN | 110 | 100 | +10% | 130 | 120 | Larger marginal impact |
| 94573_CAS | E82 | GAM | LN | 240 | 230 | +4% | 210 | 180 | Low wind, less pronounced difference |
| 94573_CAS | V90 | GAM | LN | 60 | 58 | +4% | 70 | 70 | Small spread, small mean difference |
| 94575_BRI | E82 | GAM | LN | 290 | 270 | +7% | 250 | 230 | Slightly wider IQR for gamma |
| 94575_BRI | V90 | GAM | LN | 60 | 58 | +3% | 40 | 40 | Low difference for both turbines |
| 94578_BRS | E82 | GAM | LN | 250 | 240 | +4% | 210 | 210 | Gamma higher, IQR identical |
| 94578_BRS | V90 | GAM | LN | 60 | 59 | +2% | 70 | 70 | Across the board, E82 > V90 |
Appendix B
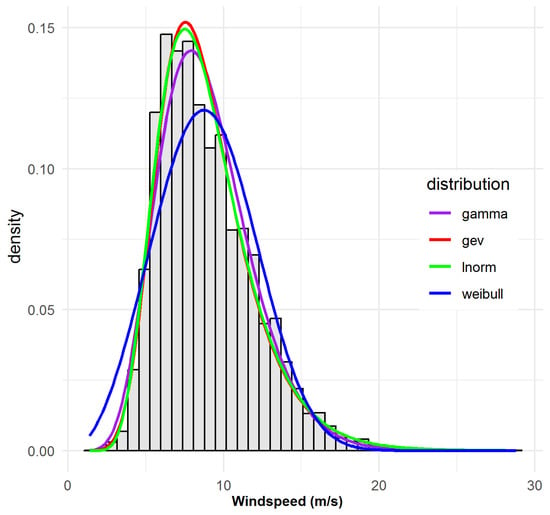
Figure A1.
Observed and fitted probability density functions for site 95469_SUN.
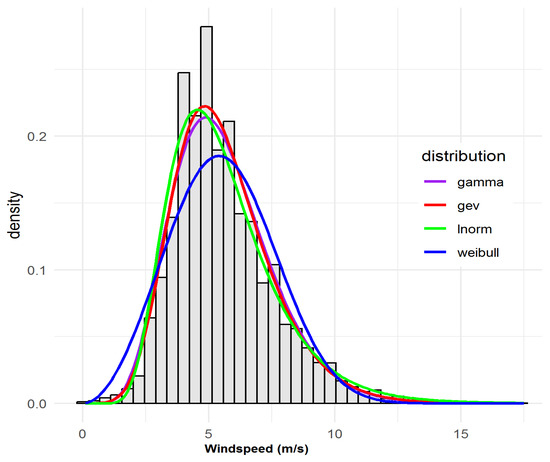
Figure A2.
Observed and fitted probability density functions for site 94573_CAS.
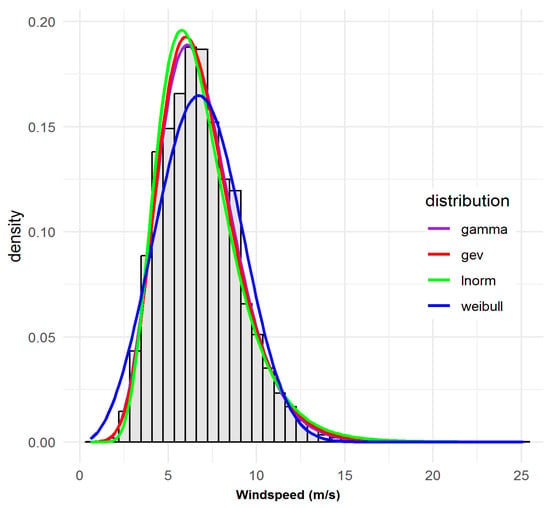
Figure A3.
Observed and fitted probability density functions for site 94575_BRI.
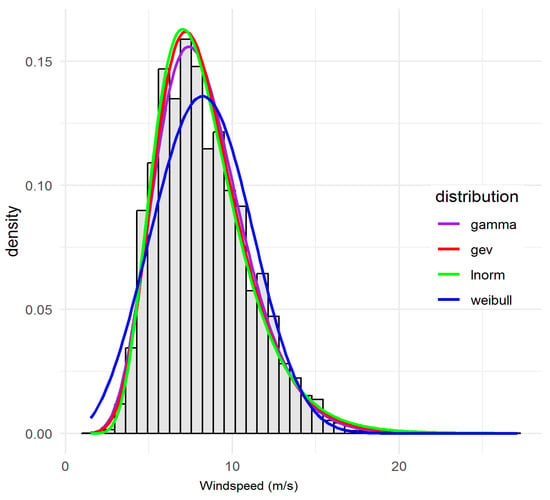
Figure A4.
Observed and fitted probability density functions for site 94592_GCA.
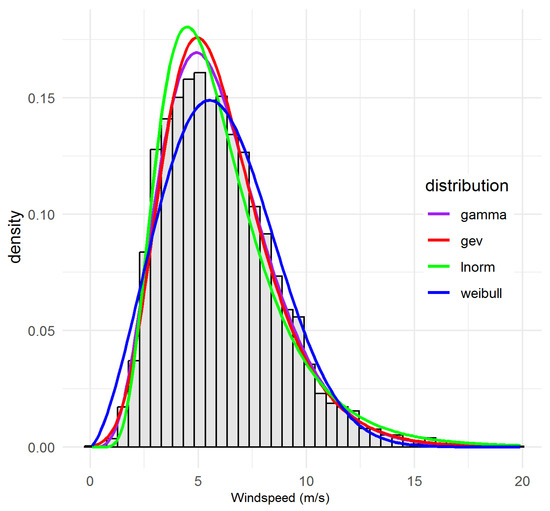
Figure A5.
Observed and fitted probability density functions for site 94727_MUD.
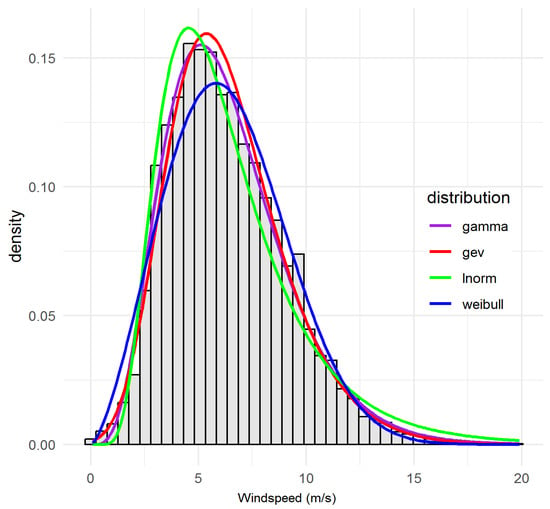
Figure A6.
Observed and fitted probability density functions for site 94729_BAT.
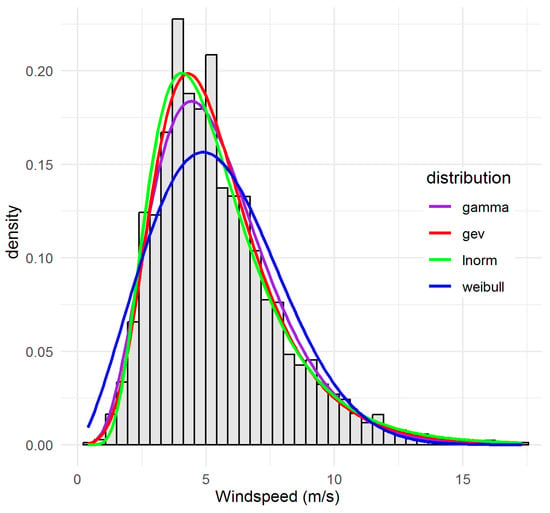
Figure A7.
Observed and fitted probability density functions for site 94752_BAD.
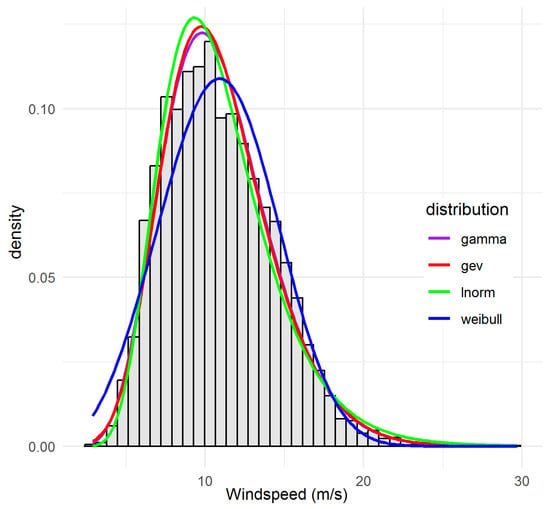
Figure A8.
Observed and fitted probability density functions for site 95551_TOW.
References
- Huang, J.; McElroy, M.B. A 32-year perspective on the origin of wind energy in a warming climate. Renew. Energy 2015, 77, 482–492. [Google Scholar] [CrossRef]
- Jung, C.; Schindler, D.; Laible, J.; Buchholz, A. Introducing a system of wind speed distributions for modeling properties of wind speed regimes around the world. Energy Convers. Manag. 2017, 144, 181–192. [Google Scholar] [CrossRef]
- Justus, C.G.; Hargraves, W.R.; Mikhail, A.; Graber, D. Methods for estimating wind speed frequency distributions. J. Appl. Meteorol. Climatol. 1978, 17, 350–353. [Google Scholar] [CrossRef]
- Bagiorgas, H.S.; Giouli, M.; Rehman, S.; Al-Hadhrami, L.M. Weibull Parameters Estimation Using Four Different Methods and Most Energy-Carrying Wind Speed Analysis. Int. J. Green Energy 2011, 8, 529–554. [Google Scholar] [CrossRef]
- Mohammadi, K.; Alavi, O.; Mostafaeipour, A.; Goudarzi, N.; Jalilvand, M. Assessing different parameters estimation methods of Weibull distribution to compute wind power density. Energy Convers. Manag. 2016, 108, 322–335. [Google Scholar] [CrossRef]
- Arslan, T.; Bulut, Y.M.; Yavuz, A.A. Comparative study of numerical methods for determining Weibull parameters for wind energy potential. Renew. Sustain. Energy Rev. 2014, 40, 820–825. [Google Scholar] [CrossRef]
- Bilir, L.; Imir, M.; Devrim, Y.; Albostan, A. Seasonal and yearly wind speed distribution and wind power density analysis based on Weibull distribution function. Int. J. Hydrogen Energy 2015, 40, 15301–15310. [Google Scholar] [CrossRef]
- Kaplan, O.; Temiz, M. A novel method based on Weibull distribution for short-term wind speed prediction. Int. J. Hydrogen Energy 2017, 42, 17793–17800. [Google Scholar] [CrossRef]
- Campos, R.; Soares, C.G. Spatial distribution of offshore wind statistics on the coast of Portugal using Regional Frequency Analysis. Renew. Energy 2018, 123, 806–816. [Google Scholar] [CrossRef]
- Hosking, J.R.M. L-moments: Analysis and estimation of distributions using linear combinations of order statistics. J. R. Stat. Soc. Ser. B Stat. Methodol. 1990, 52, 105–124. [Google Scholar] [CrossRef]
- Teyabeen, A.A.; Akkari, F.R.; Jwaid, A.E. Comparison of seven numerical methods for estimating Weibull parameters for wind energy applications. In Proceedings of the 2017 UKSim-AMSS 19th International Conference on Computer Modelling & Simulation (UKSim), Cambridge, UK, 5–7 April 2017; pp. 173–178. [Google Scholar]
- Nelsen, R.B. An Introduction to Copulas; Springer: New York, NY, USA, 2006. [Google Scholar]
- Tastu, J.; Pinson, P.; Madsen, H. Space-time trajectories of wind power generation: Parametrized precision matrices under a Gaussian copula approach. In Modeling and Stochastic Learning for Forecasting in High Dimensions; Springer International Publishing: Cham, Germany, 2015; pp. 267–296. [Google Scholar]
- Malvaldi, A.; Weiss, S.; Infield, D.; Browell, J.; Leahy, P.; Foley, A.M. A spatial and temporal correlation analysis of aggregate wind power in an ideally interconnected Europe. Wind. Energy 2017, 20, 1315–1329. [Google Scholar] [CrossRef]
- Wang, Z.; Wang, W.; Liu, C.; Wang, B. Forecasted scenarios of regional wind farms based on regular vine copulas. J. Mod. Power Syst. Clean Energy 2019, 8, 77–85. [Google Scholar] [CrossRef]
- Aas, K.; Czado, C.; Frigessi, A.; Bakken, H. Pair-copula constructions of multiple dependence. Insur. Math. Econ. 2009, 44, 182–198. [Google Scholar] [CrossRef]
- Dissmann, J.; Brechmann, E.C.; Czado, C.; Kurowicka, D. Selecting and estimating regular vine copulae and application to financial returns. Comput. Stat. Data Anal. 2013, 59, 52–69. [Google Scholar] [CrossRef]
- Masseran, N. Integrated approach for the determination of an accurate wind-speed distribution model. Energy Convers. Manag. 2018, 173, 56–64. [Google Scholar] [CrossRef]
- Chowdhury, S.; Zhang, J.; Messac, A.; Castillo, L. Optimizing the arrangement and the selection of turbines for wind farms subject to varying wind conditions. Renew. Energy 2013, 52, 273–282. [Google Scholar] [CrossRef]
- Katsigiannis, Y.A.; Stavrakakis, G.S. Estimation of wind energy production in various sites in Australia for different wind turbine classes: A comparative technical and economic assessment. Renew. Energy 2014, 67, 230–236. [Google Scholar] [CrossRef]
- Ouarda Taha, B.M.J.; Charron, C. On the mixture of wind speed distribution in a Nordic region. Energy Convers. Manag. 2018, 174, 33–44. [Google Scholar] [CrossRef]
- Ouarda Taha, B.M.J.; Charron, C. Non-stationary statistical modelling of wind speed: A case study in eastern Canada. Energy Convers. Manag. 2021, 236, 114028. [Google Scholar] [CrossRef]
- Houndekindo, F.; Ouarda Taha, B.M.J. A non-parametric approach for wind speed distribution mapping. Energy Convers. Manag. 2023, 296, 117672. [Google Scholar] [CrossRef]
- Houndekindo, F.; Ouarda Taha, B.M.J. Prediction of hourly wind speed time series at unsampled locations using machine learning. Energy 2024, 299, 131518. [Google Scholar] [CrossRef]
- Lu, X.; McElroy, M.B. Global potential for wind-generated electricity. In Wind Energy Engineering; Academic Press: London, UK, 2023; pp. 47–61. [Google Scholar]
- Wang, C.-H.; Holmes, J.D. Exceedance rate, exceedance probability, and the duality of GEV and GPD for extreme hazard analysis. Nat. Hazards 2020, 102, 1305–1321. [Google Scholar] [CrossRef]
- Rocha, P.A.C.; de Sousa, R.C.; de Andrade, C.F.; da Silva, M.E.V. Comparison of seven numerical methods for determining Weibull parameters for wind energy generation in the northeast region of Brazil. Appl. Energy 2012, 89, 395–400. [Google Scholar] [CrossRef]
- Fawad, M.; Yan, T.; Chen, L.; Huang, K.; Singh, V.P. Multiparameter probability distributions for at-site frequency analysis of annual maximum wind speed with L-Moments for parameter estimation. Energy 2019, 181, 724–737. [Google Scholar] [CrossRef]
- Wang, W.; Gao, Y.; Ikegaya, N. Approximating wind speed probability distributions around a building by mixture weibull distribution with the methods of moments and L-moments. J. Wind. Eng. Ind. Aerodyn. 2025, 257, 106001. [Google Scholar] [CrossRef]
- Molina-Aguilar, J.P.; Gutierrez-Lopez, A.; Raynal-Villaseñor, J.A.; Garcia-Valenzuela, L.G. Optimization of Parameters in the Generalized Extreme-Value Distribution Type 1 for Three Populations Using Harmonic Search. Atmosphere 2019, 10, 257. [Google Scholar] [CrossRef]
- Stephens, M.A. EDF statistics for goodness of fit and some comparisons. J. Am. Stat. Assoc. 1974, 69, 730–737. [Google Scholar] [CrossRef]
- Razali, N.M.; Wah, Y.B. Power comparisons of shapiro-wilk, kolmogorov-smirnov, lilliefors and anderson-darling tests. J. Stat. Model. Anal. 2011, 2, 21–33. [Google Scholar]
- Evans, D.L.; Drew, J.H.; Leemis, L.M. The distribution of the Kolmogorov–Smirnov, Cramer–von Mises, and Anderson–Darling test statistics for exponential populations with estimated parameters. In Computational Probability Applications; Springer International Publishing: Cham, Germany, 2016; pp. 165–190. [Google Scholar]
- Chau, T.T.; Nguyen, T.T.H.; Nguyen, L.; Do, T.D. Wind Speed Probability Distribution Based on Adaptive Bandwidth Kernel Density Estimation Model for Wind Farm Application. Wind. Energy 2025, 28, e2970. [Google Scholar] [CrossRef]
- Chen, X.; Han, J.; Zheng, T.; Zhang, P.; Duan, S.; Miao, S. A Vine-Copula Based Voltage State Assessment with Wind Power Integration. Energies 2019, 12, 2019. [Google Scholar] [CrossRef]
- Veeramachaneni, K.; Cuesta-Infante, A.; O’Reilly, U.M. Copula graphical models for wind resource estimation. In Proceedings of the 24th International Conference on Artificial Intelligence, Buenos Aires, Argentina, 25–31 July 2015; pp. 2646–2654. [Google Scholar]
- Yoo, J.; Son, Y.; Yoon, M.; Choi, S. A Wind Power Scenario Generation Method Based on Copula Functions and Forecast Errors. Sustainability 2023, 15, 16536. [Google Scholar] [CrossRef]
- Shahirinia, A.; Farahmandfar, Z.; Bina, M.T.; Henderson, S.B.; Ashtary, M. Spatial modeling sensitivity analysis: Copula selection for wind speed dependence. AIP Adv. 2024, 14, 045047. [Google Scholar] [CrossRef]
- Peng, X.; Li, Y. Forecasting Wind Power Scenarios of Multiple Wind Farms Based on Vine Spatiotemporal Copula. Available online: https://ssrn.com/abstract=4206878 (accessed on 3 September 2025).
- Cai, J.; Xu, Q.; Cao, M.; Yang, Y. Capacity Credit Evaluation of Correlated Wind Resources Using Vine Copula and Improved Importance Sampling. Appl. Sci. 2019, 9, 199. [Google Scholar] [CrossRef]
- Karakaş, A.M. Using copulas for modeling dependence in wind power. Asian J. Eng. Technol. 2019, 7, 33–49. [Google Scholar] [CrossRef]
- Goh, H.H.; Peng, G.; Zhang, D.; Dai, W.; Kurniawan, T.A.; Goh, K.C.; Cham, C.L. A New Wind Speed Scenario Generation Method Based on Principal Component and R-Vine Copula Theories. Energies 2022, 15, 2698. [Google Scholar] [CrossRef]
- Wang, Z.; Wang, W.; Liu, C.; Wang, Z.; Hou, Y. Probabilistic Forecast for Multiple Wind Farms Based on Regular Vine Copulas. IEEE Trans. Power Syst. 2017, 33, 578–589. [Google Scholar] [CrossRef]
- Huang, Y.; Zhang, Z.; Li, X.; Xie, J.; Lee, K.Y. Layered-Vine Copula-Based Wind Speed Prediction Using Spatial Correlation and Meteorological Influence. IEEE Trans. Instrum. Meas. 2023, 72, 1–12. [Google Scholar] [CrossRef]
- Vincent, C.L.; Dowdy, A.J. Multi-scale variability of southeastern Australian wind resources. Atmospheric Meas. Tech. 2024, 24, 10209–10223. [Google Scholar] [CrossRef]
- Gu, H.; Mao, Y. Multi-Timescale Characteristics of Southwestern Australia Nearshore Surface Current and Its Response to ENSO Revealed by High-Frequency Radar. Remote. Sens. 2024, 16, 209. [Google Scholar] [CrossRef]
- AS/NZS 3580.14:2014; Methods for Sampling and Analysis of Ambient Air—Part 14: Meteorological Monitoring for Ambient Air Quality Monitoring Applications. Standards Australia: Sydney, Australia; Standards New Zealand: Wellington, New Zealand, 2014.
- Stull, R.B. Mean boundary layer characteristics. In An Introduction to Boundary Layer Meteorology; Springer: Dordrecht, The Netherlands, 1988; pp. 1–27. [Google Scholar]
- Hosking, J.R.M.; Wallis, J.R. Regional Frequency Analysis; Cambridge University Press: Cambridge, UK, 1997; p. 240. [Google Scholar]
Disclaimer/Publisher’s Note: The statements, opinions and data contained in all publications are solely those of the individual author(s) and contributor(s) and not of MDPI and/or the editor(s). MDPI and/or the editor(s) disclaim responsibility for any injury to people or property resulting from any ideas, methods, instructions or products referred to in the content. |
© 2025 by the author. Licensee MDPI, Basel, Switzerland. This article is an open access article distributed under the terms and conditions of the Creative Commons Attribution (CC BY) license (https://creativecommons.org/licenses/by/4.0/).