Abstract
This study investigates the atmospheric formation and sinks of HONO and HNO3 and their contribution to secondary PM2.5 formation in Daejeon (urban) and Iksan (suburban), South Korea. Continuous observations revealed distinct concentration patterns: Iksan exhibited elevated ammonia and nitrate levels associated with agricultural activities and biomass burning, while Daejeon showed higher NOx concentrations driven by traffic and industrial sources. Positive Matrix Factorization (PMF) analysis indicated that secondary formation was the dominant contributor to PM2.5 at both sites, with biomass burning exerting an additional influence in Iksan. Among observed precursors, HNO3 showed the highest conversion to aerosol nitrate, highlighting aerosol-phase reactions as its primary sink, followed by dry deposition. Seasonal analysis demonstrated that HONO loss was largely controlled by photolysis in summer. Externally transported aerosols contributed more than locally formed particles at both sites, emphasizing the role of regional background pollution. These findings provide a scientific basis for region-specific air quality strategies that combine local precursor control with the management of long-range transport.
1. Introduction
Among various nitrogen oxides, HONO and HNO3 play crucial roles as atmospheric reservoirs contributing to aerosol formation via distinct production mechanisms and reaction pathways [1,2,3]. Both species can be generated through heterogeneous reactions between gas-phase compounds and solid surfaces. In the case of HONO, it is primarily produced by the heterogeneous hydrolysis of NO2 on urban surfaces such as building walls and the ground, particularly under nighttime conditions. However, during daytime, HONO rapidly decomposes via photolysis [4,5,6]. HNO3 is mainly formed through the gas-phase reaction between NO2 and OH radicals, yet in polluted atmospheres, it also participates in heterogeneous processes that promote particle-phase formation [7,8]. Recent studies have shown that such heterogeneous reactions are highly dependent on meteorological conditions—specifically, temperature, humidity, and surface characteristics—which significantly influence the reaction pathways involved [7,9,10,11].
Although several atmospheric models now incorporate diverse production and removal mechanisms for HONO and HNO3, discrepancies remain between model predictions and field measurements, highlighting the need for further refinement [12,13]. In particular, recent investigations have reported substantial amounts of HONO produced from unidentified sources, indicating the necessity of ongoing research into its origin and fate [14,15]. For HNO3, however, such detailed mechanistic studies remain largely unexplored.
Kim et al. conducted a comprehensive study on the formation and removal mechanisms of HONO and HNO3 in the atmosphere of Daejeon, South Korea [16]. Consistent with findings from other studies, they reported that HONO formation was dominated by nighttime heterogeneous reactions, while photolysis was the primary daytime sink. Nevertheless, a considerable fraction of HONO was attributed to unidentified sources, emphasizing the need for further investigation. Their study also presented a quantitative assessment of HNO3 dynamics, showing that nighttime heterogeneous reactions were the predominant formation route. While the authors suggested that HNO3 sinks mainly occurred via aerosol conversion and dry deposition, they did not distinguish these processes quantitatively.
In Korea, numerous studies have investigated the potential for external secondary aerosols, consistently reporting mixed influences from both external sources and domestic emissions. Kang et al. observed elevated concentrations of sulfate and nitrate on Baengnyeong Island associated with biomass burning plumes transported from China and Russia, as confirmed by backward trajectory analysis [17]. Won et al. identified the influence of secondary inorganic aerosols (SIOA), soil, and aged sea salt in wintertime PM2.5 in Seosan, originating from China and Mongolia [18]. Kim et al. distinguished domestic and external contributions to PM2.5 in Ansan using chemical composition and size distribution analyses [19]. Similarly, the KORUS-AQ campaign highlighted the combined influence of local emissions and long-range transport in Seoul and Busan, based on source characteristics and vertical aerosol distribution profiles [20].
These studies collectively suggest that PM2.5 levels in Korea are not solely driven by primary emissions but are strongly affected by both local heterogeneous reactions and the inflow of externally formed secondary aerosols. In particular, the long-range transport of pre-formed sulfate, nitrate, and organic aerosols contributes substantially to ambient aerosol concentrations, in agreement with the quantitative findings of the present study.
Building upon previous approaches, the present study expands the scope of analysis by incorporating additional reaction pathways and deposition processes. Furthermore, we broaden the study domain to include both urban and suburban regions, enabling a comparative evaluation. In addition, the amount of aerosol converted from HNO3 within the region is quantitatively estimated and compared to the influx of aged PM2.5 transported from external sources.
2. Materials and Methods
2.1. Measurement Sites and Campaign Period
Field observations were conducted at air quality research center (ARC) located in Daejeon Metropolitan City and Iksan City, Jeollabuk-do, operated by the National Institute of Environmental Research (NIER) (Figure 1). The site in Daejeon, officially named the Central Region ARC, is situated at 36.3224895° N and 127.4138165° E. It serves as a key facility for detailed air quality analysis in the central region of Korea. Approximately 5 km to the north lies the Daejeon General Industrial Complex, which may influence the site’s pollutant profile. The monitoring site in Iksan, known as the Jeonbuk Regional ARC, is located in Mohyeon-dong with the same geographic coordinates (35.9555494° N, 126.9391455° E). This station is surrounded by extensive agricultural land, distinguishing it from typical urban monitoring environments. The region is also influenced by nearby livestock facilities, such as pig and poultry farms, which are expected to contribute significantly to atmospheric ammonia levels. Although the site is classified as suburban, there are industrial complexes located 3.7 km and 5 km to the east, which may further affect local air quality.
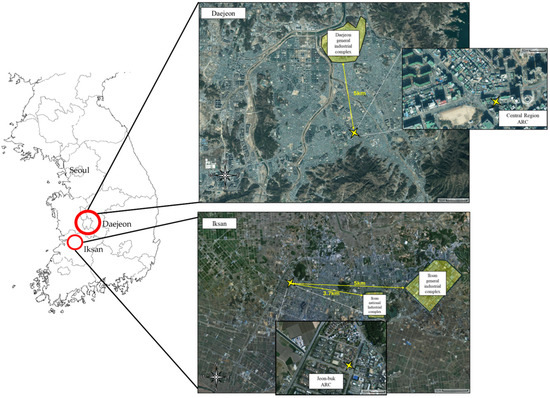
Figure 1.
Description of measurement site.
Continuous field measurements were conducted for approximately one month per campaign. The campaign was performed once during the summer of 2021 in the Daejeon ARC. In the Iksan ARC, three separate campaigns were conducted: once in the fall of 2021, and once each in the spring and summer of 2022. The detailed schedule of each campaign is summarized in Table 1.

Table 1.
Summary of measurement schedules for campaign.
Hourly concentrations of PM2.5 and its chemical components were measured using automated instruments at each monitoring site. The measured species included PM2.5 mass, eight major ions (e.g., SO42−, NO3−, NH4+), carbonaceous species (OC and EC), and 15 trace metals (e.g., Pb, Cr, Cu).
PM2.5 mass was determined using a Beta Attenuation Monitor (BAM-1020; MetOne, Grants Pass, OR, USA) operating at 16.7 L/min. Ionic species were analyzed using an Ambient Ion Monitor (URG-900D; URG, Chapel Hill, NC, USA) with ion chromatography (ICS-2000; DIONEX Gamb, Sunnyvale, CA, USA), and carbonaceous species were quantified via thermal–optical analysis (Model-4; Sunset Laboratory, Portland, OR, USA) at 8 L/min. Trace metals were measured using an X-ray fluorescence spectrometer (Xact 625i; SailBri Cooper, Tigard, OR, USA). Detailed protocols followed the national guidelines from NIER [21].
Hourly gaseous pollutant data (O3, NO2, SO2, CO) were obtained from AirKorea [22], and meteorological data were sourced from nearby weather stations operated by the Korea Meteorological Administration.
2.2. PPDS-IC
The concentrations of HONO and HNO3, which are key intermediates in secondary aerosol formation, were measured using a parallel plate diffusion Scrubber coupled with an ion chromatograph (PPDS-IC). Distilled water was supplied to the scrubber at a constant flow rate of 50 µL/min, while ambient air samples were drawn into the system using an air pump at a rate of 0.5 L/min. The ion chromatograph system (IC) automatically injected the collected samples at 1-h intervals for analysis. For chromatographic separation, 40 mM KOH and 10 mM MSA (J.T. Baker, Phillipsburg, NJ, USA) were used as eluents. After passing through the suppressor and columns (IonPac AS12A and IonPac CS15, 2 × 250 mm, DIONEX, Sunnyvale, CA, USA), the samples were analyzed based on changes in electrical conductivity detected by the conductivity detector (CD20, DIONEX, Sunnyvale, CA, USA). A schematic diagram of the PPDS-IC system and a summary of analytical conditions are provided in Figure S1 and Table S1. Detailed analytical procedures are described in the study by Kim et al. [16].
2.3. PTR-ToF-MS
76 and 67 species Volatile Organic Compounds (VOCs) were measured using a Proton Transfer Reaction–Time of Flight–Mass Spectrometer (PTR-ToF-MS 1000; Ionicon Analytik GmbH, Innsbruck, Austria) in Daejeon and Iksan site, respectively (Table S2). Instrument control and data acquisition were carried out using ToF software version 4.0 and Viewer version 3.3.17 [23,24,25]. Measurements were performed under ionization modes using H3O+, O2+, and NO+ reagent ions, with real-time VOC concentrations recorded in counts per second (cps) or parts per billion by volume (ppbv). In this study, H3O+ was primarily used to enhance selectivity, and the U Drift voltage was optimized accordingly. To distinguish isomeric compounds, the Automated Measurement and Evaluation (AME) mode was applied (Table S3).
VOCs were quantified using both a direct calibration method with TO-14A standard gas (Restek Corp., Bellefonte, PA, USA) and a theoretical estimation method based on reported reaction rate constants (k = 2.0 × 10⁻⁹ cm3/s) [26,27]. The calibration results for the TO-14A standard are presented in Figure S2, with all target compounds exhibiting determination coefficients (R2) above 0.99, indicating high measurement reliability. For theoretical estimations considering ion transmission efficiency, aromatic compounds were used as reference substances, and the calibration procedure followed the method described by Oh et al. [28].
2.4. PMF Receptor Models
A total of 701 hourly samples were collected from the Daejeon site. Twenty-three species, including PM2.5 mass concentration and its major components (SO42−, NO3−, Cl−, Na+, NH4+, Mg2+, Ca2+, OC, EC, Si, K, Ti, V, Cr, Mn, Fe, Ni, Cu, Zn, As, Se, Pb), were used as input variables. During data validation, the acceptable tolerance for both ion balance and the ratio between the measured PM2.5 mass and the sum of component concentrations was set at ±50%. After preprocessing, the final dataset for Daejeon consisted of 432 valid hourly samples. For the Iksan site, data from three seasons—fall, spring, and summer—were used. Twenty species were selected as input variables, including PM2.5, SO42−, NO3−, Cl−, Na+, NH4+, Mg2+, Ca2+, OC, EC, K, Ti, Mn, Fe, Ni, Cu, Zn, As, Br, and Pb. The initial dataset contained 2639 hourly samples. After preprocessing using the same criteria applied to the Daejeon dataset, 1995 hourly samples were retained for PMF analysis.
Uncertainty was estimated using the equation-based method recommended in the EPA PMF 5.0 user guide [29]. The PM2.5 mass concentration, set as the “Total Variable” in the model input, was assigned a value equal to 400% of the measured concentration to minimize its influence on factor resolution. For other species, if a measured value was below the method detection limit (MDL), the uncertainty was set to 5/6 of the MDL. For missing values, the uncertainty was set to 400% of the species-specific median. For all other valid data points, uncertainties were estimated using the standard formula, and the MDLs used in this study were based on values reported by Han et al. [30].
An error fraction of 10% and an external uncertainty of 20% were applied. The optimal number of factors was determined not only by evaluating Q values but also by considering additional information such as local emission source characteristics, pollutant distribution patterns, and the geographic setting of the receptor sites. The PMF modeling approach in this study was guided by standardization efforts developed by NIER to enhance modeling capacity and ensure reliable results among PMF users in Korea [31].
2.5. Methodological Framework for HONO and HNO3 Reaction
This study builds upon the foundational work by Kim et al. [16], which provides detailed descriptions of the formation and conversion mechanisms of HONO and HNO3, including the reaction rate constants used. Therefore, only newly developed approaches are presented herein.
The dry deposition velocity of HONO was assumed to be 0.873 cm/s, based on previous studies, and the deposition height was set to 40 m for calculation purposes (Table 2) [32]. In the time-dependent HONO concentration equation, the difference between the observed concentration change and that calculated from known reactions was interpreted as either Punknown or Lunknown. Specifically, when the residual term X (as expressed in Equation (1)) was positive, it was attributed to Punknown (unexplained production); when negative, it was treated as Lunknown (unexplained loss), to identify dominant pathways contributing to HONO formation and loss Equation (2).
Table 2.
Production and loss processes for HONO.
Similarly, for HNO3, the unexplained change in concentration (Y) was interpreted as Punknown when positive and Lunknown when negative. The constants and procedures used for these calculations are summarized in Table 3. The dry deposition velocity of HNO3 was assumed to be 1.431 cm/s, based on previously reported average values, and a deposition height of 40 m was applied for the flux calculations [32]. Quantitative analyses of HONO and HNO3 conversion processes were performed using data collected during the summer season only.
Table 3.
Production and loss processes for HNO3.
2.6. Photochemical Modeling Using F0AM
To quantify the photochemical processes of HONO and HNO3 during the summer, a zero-dimensional box model (Framework for 0-Dimensional Atmospheric Modeling; F0AM) was employed [38,44]. Since reactive species such as OH, HO2, NO3, N2O5, and peroxyacetyl nitrate (PAN) were not directly measured, their ambient concentrations were estimated using the F0AM model. The Master Chemical Mechanism (MCM) v3.3.1 was used as the chemical scheme, and hourly averaged observed concentrations and meteorological data were applied [45,46]. Detailed chemical and photochemical reaction data can be accessed via the MCM website (https://www.mcm.york.ac.uk/MCM/, accessed on 9 September 2025).
Meteorological parameters included temperature, relative humidity, and atmospheric pressure. For photolysis simulation, an albedo value of 0.132 was used [16], and the solar zenith angle (SZA) was calculated based on solar elevation angles provided by the Korea Astronomy and Space Science Institute (https://www.astro.kasi.re.kr/life/pageView/10, accessed on 9 September 2025).
VOC input data for the F0AM simulation were derived from PTR-ToF-MS measurements. VOC species were selected based on both their measured concentrations and their maximum incremental reactivity (MIR) values [47,48]. The top 25 VOC compounds, for which the product of average concentration and MIR exceeded 1, were included in the model (Tables S4 and S5).
2.7. Thermodynamic Modeling Using ISORROPIA II
To estimate the gas–particle partitioning of HNO3 and particulate nitrate, the ISORROPIA II thermodynamic equilibrium model was used. Input variables included Na+, SO42−, NH3, NO3−, Cl−, Ca2+, K+, Mg2+, temperature, and relative humidity. The total NH3 input was calculated as the sum of gaseous NH3 and particulate ammonium concentrations. Similarly, the total NO3 input was obtained by summing the concentrations of gaseous HNO3 and particulate nitrate. The model was run in forward mode to simulate the direction of equilibrium progression, and the phase state was set to metastable.
3. Results and Discussion
3.1. Temporal and Spatial Characteristics of Pollutant Concentrations
During the summer, average concentrations of HONO and HNO3 in Daejeon were 1.8 ± 0.8 ppb and 0.1 ± 0.03 ppb, respectively, with HONO levels markedly higher and HNO3 slightly lower than those in Iksan (0.16 ± 0.03 ppb and 0.06 ± 0.01 ppb) (Table S6). In Iksan, HONO concentrations were highest in fall, followed by spring and summer, whereas HNO3 levels peaked in spring. The largest inter-site concentration difference was observed for NH3, which exceeded 65 ppb on average during spring and fall in Iksan, likely due to emissions from nearby agricultural activities such as livestock operations. Although summer averages were similar between sites, the maximum NH3 concentration in Iksan was approximately 10 ppb higher.
PM2.5 concentrations in Iksan peaked during fall (32.5 ± 20.0 µg/m3) and spring (31.4 ± 18.2 µg/m3) (Table S7). In summer, sulfate was the dominant component in Daejeon, while nitrate dominated in Iksan, particularly during fall and spring, with average nitrate concentrations reaching ~7 µg/m3—suggesting enhanced formation via elevated NH3 levels. Organic and elemental carbon concentrations were also higher in Iksan during fall, by 2.7 µg/m3 (OC) and 0.7 µg/m3 (EC), likely reflecting emissions from biomass burning.
Time-series trends of pollutants and meteorological parameters are illustrated in Figures S3–S6. Temperature and relative humidity showed an inverse relationship, and most pollutants increased with rising temperature. Ozone (O3) concentrations peaked during the daytime, indicating active photochemical reactions involving VOCs and NOx under high-temperature conditions. In Daejeon, wind speeds ranged from 1–5 m/s with variable wind directions, suggesting conditions favorable for pollutant accumulation.
Sulfate concentrations tended to rise under warm and humid conditions. Formation of nitrate and ammonium ions was enhanced by increased HNO3 levels through reactions with NH3. While O3 showed strong diurnal variability, peaking during the day, HONO exhibited nighttime increases and daytime depletion. In Iksan, elevated NH3 during spring and fall facilitated nitrate formation, and stagnant atmospheric conditions further favored secondary aerosol accumulation. In contrast, during summer, the volatilization of NH4NO3 suppressed nitrate levels, while active photochemistry elevated O3. Overall, differences in pollutant concentrations between the two sites were associated with meteorological conditions and emission source characteristics.
3.2. Source Apportionment of PM2.5 by PMF Model
PMF was applied to identify the major sources of PM2.5 in both study areas, regardless of season. In Daejeon, only summer data were used, while in Iksan, all seasonal datasets were included. A strong correlation between measured and modeled PM2.5 concentrations was observed in both sites (R2 > 0.95), indicating reliable model performance (Figure S7). PMF analysis identified seven sources in Daejeon and eight in Iksan (Figure 2). Common sources across both sites included secondary nitrate, secondary sulfate, traffic and industrial emissions, coal combustion, soil and dust, and sea salt. An additional biomass burning source was resolved in Iksan. Due to its suburban characteristics, Iksan showed a stronger influence from biomass burning, with elevated contributions from OC, EC, and K—typical indicators of this source [49].
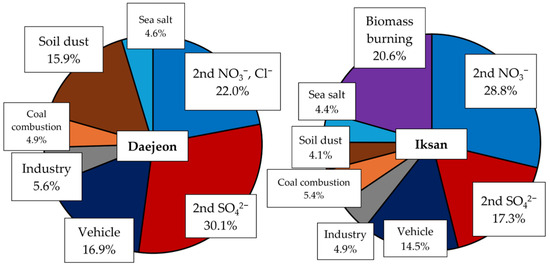
Figure 2.
Source contributions of PM2.5 in Daejeon and Iksan.
In Daejeon, secondary aerosols were the dominant contributors to PM2.5, with secondary sulfate and nitrate (including chloride) accounting for 6.3 µg/m3 (30.1%) and 4.8 µg/m3 (22.0%), respectively. These contributions are notably higher than previously reported values (~19%), suggesting a rising influence of secondary aerosol formation in recent years [50]. In Iksan, both secondary sulfate and nitrate contributed 17.3% each. The high nitrate contribution in Iksan is likely driven by elevated ambient levels of NH3 and HNO3 [17], along with influences from long-range transport (Table S6). Traffic emissions (16.9%) and soil/dust (15.9%) were more significant in Daejeon compared to Iksan (both at 14.5%), likely due to higher traffic density. Contributions from industrial sources, coal combustion, and sea salt were comparable between the two sites. Figure 3 presents the time series of potassium ion concentrations and biomass burning source contributions. In Iksan, biomass burning contributions peaked during the fall, which can be attributed to post-harvest agricultural residue burning [19].
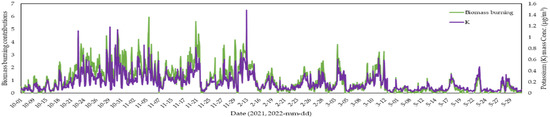
Figure 3.
Temporal distribution of biomass burning contributions and its key marker (K) in Iksan.
3.3. Evaluation and Simulation Result from F0AM
The performance of the F0AM box model was evaluated using root mean square error (RMSE), which showed generally small discrepancies between observed and simulated concentrations for most pollutants. In particular, for key species such as HONO and total non-methane hydrocarbons (TNMHCs), RMSE values were lower than the corresponding standard deviations, indicating that the model effectively reproduced the observed variability (Tables S8 and S9).
The model was further used to simulate highly reactive and short-lived species that are difficult to measure directly, such as OH, HO2, NO3, and N2O5. Simulations were performed for summer conditions in both Daejeon and Iksan (Table S10 and Figure S10). The modeled OH concentrations were comparable between the two sites, with 5.8 × 10⁵ molecules/cm3 in Daejeon and 4.9 × 10⁵ molecules/cm3 in Iksan. However, HO2 levels in Iksan (41.0 × 10⁷ molecules/cm3) were over ten times higher than those in Daejeon (3.2 × 10⁷ molecules/cm3), likely due to significantly higher VOC concentrations (TNMHCs: 248.6 ppb in Iksan and 62.4 ppb in Daejeon, respectively). NO3 and N2O5 levels were also higher in Iksan (1.7 ppt and 16.1 ppt, respectively) compared to Daejeon (0.4 ppt and 3.3 ppt, respectively). These elevated levels are attributed to nighttime reactions between O3 and NO2, rather than differences in HO2 concentrations, and are consistent with the higher nighttime O3 levels observed in Iksan.
3.4. Quantification of HONO Formation and Loss Pathways
Quantitative analysis of HONO production and removal pathways was conducted for both Daejeon and Iksan during the summer (Figure 4). In Daejeon, 71.1% of the total HONO production was attributed to unidentified sources (Punknown, 3.12 µg/m3·hr), indicating a significant knowledge gap in the current understanding of HONO formation. Heterogeneous reactions of NO2 (Phet) accounted for 12.6% (0.55 µg/m3·hr), followed by direct emissions (Pemiss, 4.7%, 0.20 µg/m3·hr) and the NO+OH reaction (PNO+OH, 4.6%, 0.20 µg/m3·hr). Notably, the contribution of PNO+OH increased during the early morning when OH levels were elevated, corresponding to peak HONO concentrations likely driven by traffic emissions (Figure S11). Among loss pathways in Daejeon, dry deposition (Ldep) was dominant, contributing 61.0% (2.95 µg/m3·hr), while photolysis (Lphoto) accounted for 37.7% (1.82 µg/m3·hr). Other pathways, including LHONO+OH and L2HONO, were negligible. The amount of unknown loss in Daejeon was calculated to be negligible (zero) during the sampling period on the applied formula.
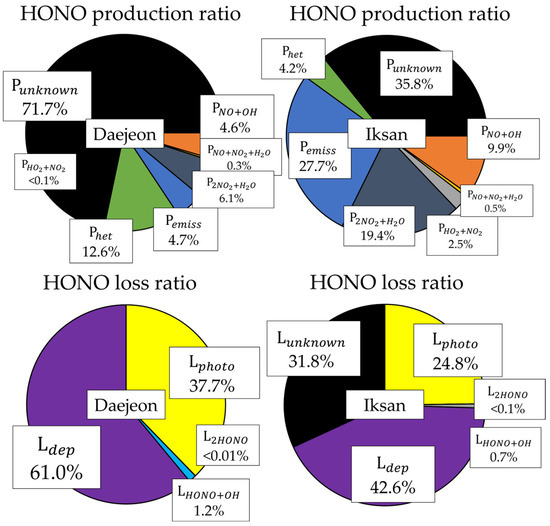
Figure 4.
Proportions of production and loss rate for HONO.
In Iksan, the contribution of Punknown was considerably lower at 35.8% (0.17 µg/m3·hr), suggesting a better representation of known sources in the model. Major formation pathways included Pemiss (27.7%, 0.13 µg/m3·hr) and P2NO2+H2O (19.4%, 0.09 µg/m3·hr), while PNO+OH contributed 9.9% (0.05 µg/m3·hr), more than twice the corresponding value in Daejeon. Other minor formation pathways included PHO2+NO2 (2.5%) and PNO+NO2+H2O (0.6%). For HONO loss in Iksan, dry deposition (Ldep) accounted for 42.7% (0.26 µg/m3·hr), and photolysis (Lphoto) 24.8% (0.15 µg/m3·hr), both lower than in Daejeon. However, the unknown loss pathway (Lunknown) represented a relatively large fraction (31.9%, 0.20 µg/m3·hr), indicating the potential involvement of uncharacterized reactions or model limitations under local atmospheric conditions.
Several studies have explored potential pathways contributing to unidentified HONO sources. Wang et al. [51] theoretically demonstrated that although the reaction between NO2 and H2O is generally slow, the presence of NH3 can catalyze the formation of HONO. Indarto [52] reported that reactions between NO2 and carbonaceous particles can produce HONO, emphasizing the importance of particle surface reduction processes and adsorbed water. Additionally, HNO3 has been suggested to react with NO on the surfaces of organic aerosols or carbon particles to yield HONO. Incorporating these pathways into chemical models may enhance our understanding of HONO formation, reduce uncertainties associated with unknown sources, and improve the predictive accuracy of numerical simulations.
3.5. Aerosol Conversion and Loss Pathways of HNO3
A previous study reported that 99.96% of HNO3 loss could not be attributed to known pathways, highlighting substantial uncertainties in its atmospheric removal processes [16]. Building upon that work, this study provides an advanced assessment of HNO3 transformation (Figure 5). Aerosol-phase conversion was indirectly estimated from temporal variations in nitrate concentrations. An increase in nitrate was interpreted as aerosol formation from HNO3 (Laero), while a decrease was considered indicative of volatilization (Pvapo). In Iksan, where ambient NH3 levels are higher, Laero exhibited greater variability (0.04–6.26 µg/m3·hr) compared to Daejeon (0.001–1.78 µg/m3·hr), suggesting that elevated NH3 concentrations promoted aerosol formation. Despite high summer temperatures, Pvapo was also higher in Iksan (1.93 ± 1.56 µg/m3·hr) than in Daejeon (1.18 ± 1.19 µg/m3·hr), indicating that volatilization is more sensitive to nitrate concentrations than to temperature alone.
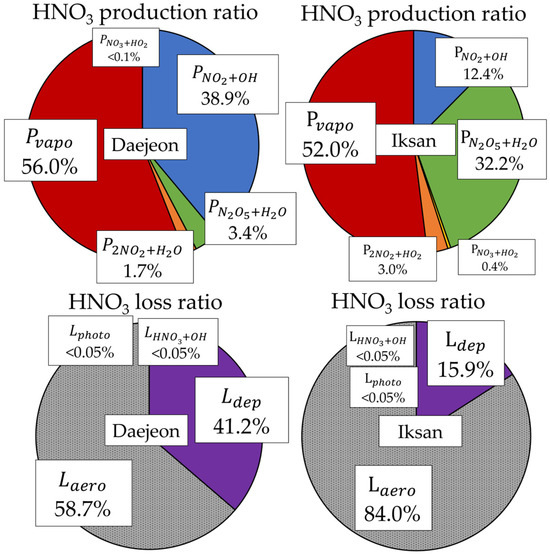
Figure 5.
Proportions of production and loss rate for HNO3.
Analysis of the hourly variations in HNO3 formation via homogeneous and heterogeneous reactions in Daejeon and Iksan revealed distinct temporal patterns and differing formation characteristics between the two regions (Figure 6). In Daejeon, HNO3 concentrations peaked during midday (12:00–14:00), showing a typical diurnal profile. This pattern suggests that photochemical production of HNO3 was primarily driven by the reaction between nitrogen oxides (NOx) and OH radicals under high solar radiation. In contrast, Iksan exhibited a more pronounced increase in HNO3 concentration during the daytime due to homogeneous reactions, while lower formation rates were observed in the evening. Although heterogeneous production of HNO3 generally increases during nighttime, Iksan showed two peaks in absolute heterogeneous formation—one in the early morning and another at night. Nevertheless, the relative contribution of heterogeneous pathways to total HNO3 production was highest during nighttime.
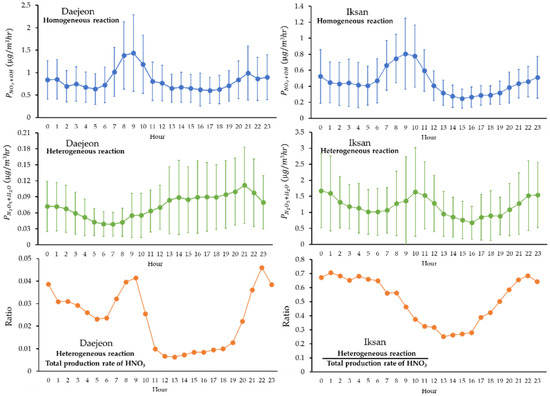
Figure 6.
Diurnal variations of HNO3 production rates by homogeneous and heterogeneous reactions in Daejeon and Iksan. Error bars represent standard deviations.
3.6. Estimation of Locally Formed and Externally Transported Nitrate
Due to the rapid conversion of HNO3 to aerosol-phase nitrate in the presence of atmospheric NH3, this study employed an indirect approach to quantify the aerosol formation of HNO3. Specifically, we estimated this transformation by tracking the hour-to-hour changes in thermodynamically predicted particulate nitrate concentrations. An increase in nitrate concentration during a given hour was interpreted as the result of HNO3 conversion to aerosol, and the corresponding amount was expressed as Laero in terms of HNO3 mass concentration. The same quantity, when expressed as nitrate mass, was defined as , representing locally formed nitrate. Conversely, a decrease in nitrate concentration was attributed to the volatilization of ammonium nitrate back to gaseous HNO3 and NH3 under changing temperature and humidity conditions. This amount was denoted as Pvapo and included in the quantitative assessment.
Theoretically, the concentrations of HNO3 and nitrate at thermodynamic equilibrium should match the observed concentrations in the following time step. However, discrepancies between the modeled equilibrium values and actual observations were frequently noted. We interpreted these differences as follows:
If the next-hour observed HNO3 concentration exceeded the equilibrium prediction, the excess was assumed to result from external inflow and was defined as [HNO3]EXT. If the observed HNO3 concentration was lower than the model value, the deficit was attributed to unaccounted removal processes, particularly the conversion of HNO3 into coarse particles such as sea salt nitrate. Coarse-mode conversion is a known loss pathway for HNO3 in ambient air, especially through reactions with marine aerosols, and can significantly reduce HNO3 levels [53,54].
A similar diagnostic approach was applied from the perspective of nitrate. If the observed nitrate concentration in the next hour exceeded the model prediction, the difference was considered to represent externally transported nitrate (). Conversely, if the observed value was lower, the deficit was interpreted as dry deposition loss of particulate nitrate. Through this framework, we were able to quantify the locally formed nitrate resulting from homogeneous gas-phase HNO3 production and subsequent reaction with NH3, while also inferring the contribution of long-range transported nitrate.
It should be noted that although this study focused on the aerosol conversion pathway of HNO3 via reaction with NH3, other chemical removal pathways—especially those contributing to the unexplained loss of HNO3 in Daejeon and Iksan—may exist. Thus, some degree of uncertainty remains inherent in this indirect estimation method.
The average observed nitrate concentrations were 3.6 µg/m3 in Daejeon and 5.2 µg/m3 in Iksan (Table S6). Of these, locally formed nitrate concentrations via HNO3 aerosol conversion were estimated to be 0.58 µg/m3 in Daejeon and 1.23 µg/m3 in Iksan (Table S12). Accordingly, the externally transported nitrate contributions were calculated as 3.02 µg/m3 and 3.97 µg/m3 in Daejeon and Iksan, respectively. These results suggest that, in both regions, a large fraction of nitrate pollution is attributed to long-range transport rather than local formation via HNO3 conversion.
Quantitatively, the ratio of externally transported nitrate to locally formed nitrate () was approximately 5.2 in Daejeon and 3.2 in Iksan, indicating a greater influence of external nitrate input in Daejeon. This finding is consistent with the results of Kim et al. [48], who reported that, based on the 2016 National Emissions Inventory for the Jeonbuk region, significant contributions to PM2.5 originated from neighboring domestic provinces such as Jeonnam and Chungnam. Moreover, over half of the fine particulate concentrations in Jeonbuk were attributed to transboundary inflow, further supporting the strong influence of external sources.
This study quantified secondary aerosol formation in Daejeon and Iksan by applying mass balance equations based on the production and conversion rates of reactive gas-phase species (Table 4). External contributions were estimated by comparing model-derived values with observed concentrations. The observed mean concentration of ammonium nitrate (SAN) was 3.6 ± 5.8 µg/m3 in Daejeon and 5.6 ± 5.5 µg/m3 in Iksan. Among these, locally formed SAN via the reaction between NH3 and HNO3 (SANLF) was estimated at 0.2 ± 0.4 µg/m3 and 0.7 ± 1.1 µg/m3, respectively. The remaining portion was interpreted as externally transported SAN (SANEXT), with values of 3.4 ± 5.7 µg/m3 in Daejeon and 4.9 ± 5.1 µg/m3 in Iksan—approximately 13 to 14 times higher than the locally formed component.
Table 4.
Assessments of locally formed and externally inflowed aerosol.
4. Conclusions
This study conducted four intensive field observation campaigns between 2021 and 2022 in an urban area (Daejeon) and a suburban area (Iksan), measuring both gas-phase and particulate pollutants, as well as key intermediates related to secondary aerosol formation. HONO, HNO3, and NH3 were measured using a PPDS-IC system, VOCs were monitored via PTR-ToF-MS, and meteorological parameters and PM2.5 components were obtained from official datasets provided by the NIER.
Nitrogen oxides were more elevated in Daejeon due to traffic emissions, while NH3 concentrations were significantly higher in Iksan, especially during spring and fall—conditions that favored nitrate formation due to low temperatures and abundant ammonia. PMF results indicated that vehicular emissions dominated in Daejeon, whereas biomass burning (20.6%) was the major contributor in Iksan. In both regions, secondary sulfate and nitrate were the most influential PM2.5 components.
Reaction pathway analysis showed that 71.7% of HONO production in Daejeon originated from unidentified sources, while in Iksan, direct emissions and the 2NO2 + H2O pathway played larger roles. For HNO3, unknown loss processes were dominant in both regions. Due to high NH3 levels, Iksan exhibited greater aerosol formation (Laero) and volatilization (Pvapo) of nitrate compared to Daejeon. Box model simulations also revealed that HO2 radical concentrations in Iksan were approximately 10 times higher than in Daejeon, largely driven by higher VOC levels.
Externally transported secondary aerosols were found to exceed locally formed amounts in both regions. The average ammonium nitrate (SAN) concentrations were 3.6 µg/m3 in Daejeon and 5.6 µg/m3 in Iksan, with external contributions (SANEXT) being approximately 14 times and 13 times greater than the locally formed SAN (SANLF), respectively. These findings indicate that secondary aerosol concentrations in both cities are more influenced by inflow of already-formed aerosols than by in situ conversion of precursor gases.
By quantitatively separating local formation and external inflow contributions, this study provides scientific evidence essential for developing region-specific air quality management strategies. While Daejeon was more strongly affected by long-range transport, the high VOC burden in Iksan underscores the importance of local secondary formation. Continued accumulation of long-term seasonal and meteorological datasets is expected to support the development of higher-resolution, spatiotemporally targeted policy designs.
Supplementary Materials
The following supporting information can be downloaded at: https://www.mdpi.com/article/10.3390/atmos16091067/s1.
Author Contributions
Conceptualization, J.-S.H.; methodology, J.-S.H. and K.-C.K.; validation, J.-S.H.; formal analysis, K.-C.K.; investigation, K.-C.K.; data curation, Y.-J.L. and J.-S.H.; writing—original draft preparation, K.-C.K.; writing—review and editing, K.-C.K.; supervision, J.-S.H.; funding acquisition, J.-S.H.; All authors have read and agreed to the published version of the manuscript.
Funding
This research was supported by Experts Training Graduate Program for Particulate Matter Management (2021003410002) from the Ministry of Environment, Republic of Korea and provided measurement data on Air quality Research Center (NIER-GP2022-141 and NIER-GP2024-007) by the National Institute of Environmental Research (NIER), Republic of Korea.
Institutional Review Board Statement
Not applicable.
Informed Consent Statement
Not applicable.
Data Availability Statement
The data presented in this study are available on request from the corresponding author.
Acknowledgments
This research was funded by the Korea Ministry of Environment (MOE) (2021003410002) and the Experts Training Graduate Program for Particulate Matter Management from the Ministry of Environment, Korea. The authors also acknowledge the National Institute of Environmental Research (NIER) for providing the observational data used in this study.
Conflicts of Interest
The authors declare no conflicts of interest.
References
- Akimoto, H.; Tanimoto, H. Review of Comprehensive Measurements of Speciated NOy and Its Chemistry: Need for Quantifying the Role of Heterogeneous Processes of HNO3 and HONO. Aerosol Air Qual. Res. 2021, 21, 200395. [Google Scholar] [CrossRef]
- Liu, C.; Liang, L.; Xu, W.; Ma, Q. A Review of Indoor Nitrous Acid (HONO) Pollution: Measurement Techniques, Pollution Characteristics, Sources, and Sinks. Sci. Total Environ. 2024, 921, 171100. [Google Scholar] [CrossRef]
- Rutter, A.P.; Malloy, Q.G.J.; Leong, Y.J.; Gutierrez, C.V.; Calzada, M.; Scheuer, E.; Dibb, J.E.; Griffin, R.J. The Reduction of HNO3 by Volatile Organic Compounds Emitted by Motor Vehicles. Atmos. Environ. 2014, 87, 200–206. [Google Scholar] [CrossRef]
- Xu, Z.; Wang, T.; Wu, J.; Xue, L.; Chan, J.; Zha, Q.; Zhou, S.; Louie, P.K.K.; Luk, C.W.Y. Nitrous Acid (HONO) in a Polluted Subtropical Atmosphere: Seasonal Variability, Direct Vehicle Emissions and Heterogeneous Production at Ground Surface. Atmos. Environ. 2015, 106, 100–109. [Google Scholar] [CrossRef]
- Wang, L.; Wen, L.; Xu, C.; Chen, J.; Wang, X.; Yang, L.; Wang, W.; Yang, X.; Sui, X.; Yao, L.; et al. HONO and Its Potential Source Particulate Nitrite at an Urban Site in North China during the Cold Season. Sci. Total Environ. 2015, 538, 93–101. [Google Scholar] [CrossRef] [PubMed]
- Alicke, B.; Geyer, A.; Hofzumahaus, A.; Holland, F.; Konrad, S.; Pätz, H.W.; Schäfer, J.; Stutz, J.; Volz-Thomas, A.; Platt, U. OH Formation by HONO Photolysis during the BERLIOZ Experiment. J. Geophys. Res. Atmos. 2003, 108, PHO 3-1–PHO 3-17. [Google Scholar] [CrossRef]
- Lin, Y.-C.; Cheng, M.-T.; Ting, W.-Y.; Yeh, C.-R. Characteristics of Gaseous HNO2, HNO3, NH3 and Particulate Ammonium Nitrate in an Urban City of Central Taiwan. Atmos. Environ. 2006, 40, 4725–4733. [Google Scholar] [CrossRef]
- Saathoff, H.; Naumann, K.-H.; Riemer, N.; Kamm, S.; Möhler, O.; Schurath, U.; Vogel, H.; Vogel, B. The Loss of NO2, HNO3, NO3/N2O5, and HO2/HOONO2 on Soot Aerosol: A Chamber and Modeling Study. Geophys. Res. Lett. 2001, 28, 1957–1960. [Google Scholar] [CrossRef]
- Vlasenko, A.; Sjogren, S.; Weingartner, E.; Stemmler, K.; Gäggeler, H.W.; Ammann, M. Effect of Humidity on Nitric Acid Uptake to Mineral Dust Aerosol Particles. Atmos. Chem. Phys. 2006, 6, 2147–2160. [Google Scholar] [CrossRef]
- Abbatt, J.P.D.; Waschewsky, G.C.G. Heterogeneous Interactions of HOBr, HNO3, O3, and NO2 with Deliquescent NaCl Aerosols at Room Temperature. J. Phys. Chem. A 1998, 102, 3719–3725. [Google Scholar] [CrossRef]
- Heikes, B.G.; Thompson, A.M. Effects of Heterogeneous Processes on NO3, HONO, and HNO3 Chemistry in the Troposphere. J. Geophys. Res. Ocean. 1983, 88, 10883–10895. [Google Scholar] [CrossRef]
- Kim, K.; Han, K.M.; Song, C.H.; Lee, H.; Beardsley, R.; Yu, J.; Yarwood, G.; Koo, B.; Madalipay, J.; Woo, J.-H.; et al. An Investigation into Atmospheric Nitrous Acid (HONO) Processes in South Korea. EGUsphere 2024, 24, 12575–12593. [Google Scholar] [CrossRef]
- Karamchandani, P.; Emery, C.; Yarwood, G.; Lefer, B.; Stutz, J.; Couzo, E.; Vizuete, W. Implementation and Refinement of a Surface Model for Heterogeneous HONO Formation in a 3-D Chemical Transport Model. Atmos. Environ. 2015, 112, 356–368. [Google Scholar] [CrossRef]
- Lee, J.D.; Whalley, L.K.; Heard, D.E.; Stone, D.; Dunmore, R.E.; Hamilton, J.F.; Young, D.E.; Allan, J.D.; Laufs, S.; Kleffmann, J. Detailed Budget Analysis of HONO in Central London Reveals a Missing Daytime Source. Atmos. Chem. Phys. 2016, 16, 2747–2764. [Google Scholar] [CrossRef]
- Wang, J.; Zhang, X.; Guo, J.; Wang, Z.; Zhang, M. Observation of Nitrous Acid (HONO) in Beijing, China: Seasonal Variation, Nocturnal Formation and Daytime Budget. Sci. Total Environ. 2017, 587–588, 350–359. [Google Scholar] [CrossRef] [PubMed]
- Kim, K.; Lee, C.; Choi, D.; Han, S.; Eom, J.; Han, J. A Study on the Formation Reactions and Conversion Mechanisms of HONO and HNO3 in the Atmosphere of Daejeon, Korea. Atmosphere 2024, 15, 267. [Google Scholar] [CrossRef]
- Kang, S.; Park, G.; Park, T.; Ban, J.; Kim, K.; Seo, Y.; Choi, J.; Seo, S.; Choi, J.; Bae, M.-S.; et al. Semi-Continuous Measurements of Water-Soluble Organic Carbon and Ionic Composition of PM2.5 in Baengnyeong Island during the 2016 KORUS-AQ (Korea-United States Air Quality Study). Asian J. Atmos. Environ. 2020, 14, 307–318. [Google Scholar] [CrossRef]
- Won, S.R.; Lee, K.; Song, M.; Kim, C.; Jang, K.-S.; Lee, J.Y. Characteristic of PM2.5 Concentration and Source Apportionment during Winter in Seosan, Korea. Asian J. Atmos. Environ. 2024, 18, 22. [Google Scholar] [CrossRef]
- Kim, C.H.; Kim, J.; Hwang, K.; Kim, P.; Shin, S.H.; Park, J.-S.; Park, S.; Lee, G.; Lee, J.Y.; Kim, J.B. Characteristics Analysis of PM2.5 in Industrial Complex Near Area According to Domestic and Foreign Influences in Case of High Concentration PM2.5 Episode Occurrence. KOSAE 2023, 39, 62–76. [Google Scholar] [CrossRef]
- Kim, J.-M.; Lee, H.-J.; Jo, H.-Y.; Jo, Y.-J.; Kim, C.-H. Vertical Characteristics of Secondary Aerosols Observed in the Seoul and Busan Metropolitan Areas of Korea during KORUS-AQ and Associations with Meteorological Conditions. Atmosphere 2021, 12, 1451. [Google Scholar] [CrossRef]
- NIER Air Pollution Monitoring Network Installation and Operation Guidelines. Available online: https://www.airkorea.or.kr/web/board/3/1051/?pMENU_NO=145 (accessed on 11 June 2025).
- Ministry of Environment (MOE) AirKorea: Hourly Trends. Available online: https://www.airkorea.or.kr/eng/hourlyTrends?pMENU_NO=151 (accessed on 31 October 2024).
- Pagonis, D.; Sekimoto, K.; de Gouw, J. A Library of Proton-Transfer Reactions of H3O+ Ions Used for Trace Gas Detection. J. Am. Soc. Mass Spectrom. 2019, 30, 1330–1335. [Google Scholar] [CrossRef] [PubMed]
- Jensen, N.R.; Gruening, C.; Goded, I.; Müller, M.; Hjorth, J.; Wisthaler, A. Eddy-Covariance Flux Measurements in an Italian Deciduous Forest Using PTR-ToF-MS, PTR-QMS and FIS. Int. J. Environ. Anal. Chem. 2018, 98, 758–788. [Google Scholar] [CrossRef]
- IONICON PTR-MS Viewer. Available online: https://www.ionicon.com/accessories/details/ptr-ms-viewer (accessed on 18 March 2025).
- Gueneron, M.; Erickson, M.H.; VanderSchelden, G.S.; Jobson, B.T. PTR-MS Fragmentation Patterns of Gasoline Hydrocarbons. Int. J. Mass Spectrom. 2015, 379, 97–109. [Google Scholar] [CrossRef]
- Kim, K.; Oh, B.-H.; Baek, J.-D.; Lee, C.-S.; Lim, Y.-J.; Joo, H.-S.; Han, J.-S. Characteristics and Source Profiles of Volatile Organic Compounds (VOCs) by Several Business Types in an Industrial Complex Using a Proton-Transfer-Reaction Time-of-Flight Mass Spectrometry (PTR-ToF-MS). Atmosphere 2024, 15, 1156. [Google Scholar] [CrossRef]
- Oh, B.; Jeong, J.Y.; Shin, J.; Kim, B. A Field Study on Volatile Organic Compounds Generated During Cooking in a Large Pot Using PTR ToF MS. J. Environ. Anal. Health Toxicol. 2022, 25, 32–42. [Google Scholar] [CrossRef]
- US EPA Positive Matrix Factorization Model for Environmental Data Analyses. Available online: https://www.epa.gov/air-research/positive-matrix-factorization-model-environmental-data-analyses (accessed on 30 October 2024).
- Han, S.-W.; Joo, H.-S.; Song, H.-J.; Lee, S.-B.; Han, J.-S. Source Apportionment of PM2.5 in Daejeon Metropolitan Region during January and May to June 2021 in Korea Using a Hybrid Receptor Model. Atmosphere 2022, 13, 1902. [Google Scholar] [CrossRef]
- NIER. Establishment of Guidelines for the PMF Modeling and Applications; National Institute of Environmental Research: Singapore, 2021. [Google Scholar]
- Zhang, L.; He, Z.; Wu, Z.; Macdonald, A.M.; Brook, J.R.; Kharol, S. A Database of Modeled Gridded Dry Deposition Velocities for 45 Gaseous Species and Three Particle Size Ranges across North America. J. Environ. Sci. 2023, 127, 264–272. [Google Scholar] [CrossRef] [PubMed]
- Liessmann, M.; Miller, Y.; Gerber, B.; Abel, B. Reaction of OH and NO at Low Temperatures in the Presence of Water: The Role of Clusters. Z. Für Phys. Chem. 2011, 225, 1129–1144. [Google Scholar] [CrossRef]
- Chan, W.H.; Nordstrom, R.J.; Calvert, J.G.; Shaw, J.H. Kinetic Study of Nitrous Acid Formation and Decay Reactions in Gaseous Mixtures of Nitrous Acid, Nitrogen Oxide (NO), Nitrogen Oxide (NO2), Water, and Nitrogen. ACS Publ. 1976, 10, 674–682. [Google Scholar] [CrossRef]
- Tyndall, G.S.; Orlando, J.J.; Calvert, J.G. Upper Limit for the Rate Coefficient for the Reaction HO2 + NO2 → HONO + O2. Environ. Sci. Technol. 1995, 29, 202–206. [Google Scholar] [CrossRef]
- England, C.; Corcoran, W.H. Kinetics and Mechanisms of the Gas-Phase Reaction of Water Vapor and Nitrogen Dioxide. Ind. Eng. Chem. Fund. 1974, 13, 373–384. [Google Scholar] [CrossRef]
- Acker, K.; Febo, A.; Trick, S.; Perrino, C.; Bruno, P.; Wiesen, P.; Möller, D.; Wieprecht, W.; Auel, R.; Giusto, M.; et al. Nitrous Acid in the Urban Area of Rome. Atmos. Environ. 2006, 40, 3123–3133. [Google Scholar] [CrossRef]
- Wolfe, G.M.; Marvin, M.R.; Roberts, S.J.; Travis, K.R.; Liao, J. The Framework for 0-D Atmospheric Modeling (F0AM) v3.1. Geosci. Model Dev. 2016, 9, 3309–3319. [Google Scholar] [CrossRef]
- Burkholder, J.B.; Mellouki, A.; Talukdar, R.; Ravishankara, A.R. Rate Coefficients for the Reaction of OH with HONO between 298 and 373 K. Int. J. Chem. Kinet. 1992, 24, 711–725. [Google Scholar] [CrossRef]
- Carter, W.P.L. Development of the SAPRC-07 Chemical Mechanism. Atmos. Environ. 2010, 44, 5324–5335. [Google Scholar] [CrossRef]
- Wahner, A.; Mentel, T.F.; Sohn, M. Gas-Phase Reaction of N2O5 with Water Vapor: Importance of Heterogeneous Hydrolysis of N2O5 and Surface Desorption of HNO3 in a Large Teflon Chamber. Geophys. Res. Lett. 1998, 25, 2169–2172. [Google Scholar] [CrossRef]
- Hack, W.; Preuss, A.W.; Temps, F.; Wagner, H.G.; Hoyermann, K. Direct Determination of the Rate Constant of the Reaction NO + HO2 → NO2 + OH with the LMR. Int. J. Chem. Kinet. 1980, 12, 851–860. [Google Scholar] [CrossRef]
- Becker, E.; Rahman, M.M.; Schindler, R.N. Determination of the Rate Constants for the Gas Phase Reactions of NO3 with H, OH and HO2 Radicals at 298 K. Berichte Der Bunsenges. Für Phys. Chem. 1992, 96, 776–783. [Google Scholar] [CrossRef]
- Jenkin, M.E.; Saunders, S.M.; Pilling, M.J. The Tropospheric Degradation of Volatile Organic Compounds: A Protocol for Mechanism Development. Atmos. Environ. 1997, 31, 81–104. [Google Scholar] [CrossRef]
- Saunders, S.M.; Jenkin, M.E.; Derwent, R.G.; Pilling, M.J. Protocol for the Development of the Master Chemical Mechanism, MCM v3 (Part A): Tropospheric Degradation of Non-Aromatic Volatile Organic Compounds. Atmos. Chem. Phys. 2003, 3, 161–180. [Google Scholar] [CrossRef]
- Jenkin, M.E.; Saunders, S.M.; Wagner, V.; Pilling, M.J. Protocol for the Development of the Master Chemical Mechanism, MCM v3 (Part B): Tropospheric Degradation of Aromatic Volatile Organic Compounds. Atmos. Chem. Phys. 2003, 3, 181–193. [Google Scholar] [CrossRef]
- Carter, W.P.L.; Pierce, J.A.; Luo, D.; Malkina, I.L. Environmental Chamber Study of Maximum Incremental Reactivities of Volatile Organic Compounds. Atmos. Environ. 1995, 29, 2499–2511. [Google Scholar] [CrossRef]
- Venecek, M.A.; Carter, W.P.L.; Kleeman, M.J. Updating the SAPRC Maximum Incremental Reactivity (MIR) Scale for the United States from 1988 to 2010. J. Air Waste Manag. Assoc. 2018, 68, 1301–1316. [Google Scholar] [CrossRef]
- Vodacek, A.; Kremens, R.L.; Fordham, A.J.; Vangorden, S.C.; Luisi, D.; Schott, J.R.; Latham, D.J. Remote Optical Detection of Biomass Burning Using a Potassium Emission Signature. Int. J. Remote Sens. 2002, 23, 2721–2726. [Google Scholar] [CrossRef]
- Kim, S.C. Study on the Health Effects of PM2.5 Constituents and Source Contributions in Major Metropolitan Cities (Seoul, Daejeon, Gwangju, and Ulsan), South Korea. Ph.D. Thesis, Seoul National University, Seoul, Korea, 2023. [Google Scholar]
- Wang, X.; Bai, F.-Y.; Sun, Y.-Q.; Wang, R.-S.; Pan, X.-M.; Tao, F.-M. Theoretical Study of the Gaseous Hydrolysis of NO2 in the Presence of NH3 as a Source of Atmospheric HONO. Environ. Chem. 2016, 13, 611. [Google Scholar] [CrossRef]
- Indarto, A. Heterogeneous Reactions of HONO Formation from NO2 and HNO3: A Review. Res. Chem. Intermed. 2012, 38, 1029–1041. [Google Scholar] [CrossRef]
- Guimbaud, C.; Arens, F.; Gutzwiller, L.; Gäggeler, H.W.; Ammann, M. Uptake of HNO3 to Deliquescent Sea-Salt Particles: A Study Using the Short-Lived Radioactive Isotope Tracer 13N. Atmos. Chem. Phys. 2002, 2, 249–257. [Google Scholar] [CrossRef]
- Smyshlyaev, S.P.; Mareev, E.A.; Galin, V.Y. Simulation of the Impact of Thunderstorm Activity on Atmospheric Gas Composition. Izv. Atmos. Ocean. Phys. 2010, 46, 451–467. [Google Scholar] [CrossRef]
Disclaimer/Publisher’s Note: The statements, opinions and data contained in all publications are solely those of the individual author(s) and contributor(s) and not of MDPI and/or the editor(s). MDPI and/or the editor(s) disclaim responsibility for any injury to people or property resulting from any ideas, methods, instructions or products referred to in the content. |
© 2025 by the authors. Licensee MDPI, Basel, Switzerland. This article is an open access article distributed under the terms and conditions of the Creative Commons Attribution (CC BY) license (https://creativecommons.org/licenses/by/4.0/).