Abstract
Fungal spore calendars help illustrate the abundance and distribution of spores throughout the year, enabling clinicians and patients to predict and treat allergic symptoms based on spore presence and concentration. This three-year study (2021–2024) established the first fungal spore calendar for the most clinically important spore types in Lima, Perú: Alternaria, Cladosporium, Nigrospora, Curvularia, Drechslera, Fusarium, and Stemphylium. Air sampling was performed using a Burkard volumetric spore trap placed on the rooftop of SANNA Clínica el Golf in San Isidro, Lima. Cladosporium was the most abundant (37,945 spores/m3), followed by Nigrospora (11,558), Curvularia (3946), Fusarium (2454), Alternaria (2138), Drechslera (1850), and Stemphylium (201). The highest concentrations of Alternaria, Nigrospora, Curvularia, and Drechslera were recorded in 2023–2024, with seasonal peaks mainly during spring/summer. Meteorological correlations showed that Alternaria, Cladosporium, Nigrospora, and Curvularia were positively correlated with temperature while Drechslera had a negative correlation. Cladosporium, Curvularia, Fusarium, and Stemphylium were negatively correlated with relative humidity, while other types showed a mix of both positive and negative responses or inverse responses. These two meteorological parameters are likely the main influences on spore concentrations; however, other factors may include other meteorological parameters. Cladosporium correlated positively with southwesterly winds, and negatively with northwesterly, winds, and Curvularia was positively correlated with northeasterly winds.
1. Introduction
Exposure to aeroallergens such as fungal spores, pollen grains, and dust mites can cause sensitization and the onset of allergic symptoms such as rhino conjunctivitis. Sensitization rates are variable and are influenced by several factors not only on an individual level, such as age and genetic predisposition, but also on a broader scale, such as geographic location, vegetation, climate change, pollution, allergen abundance, and allergenicity [1]. Similarly, the aeroallergens themselves are highly variable; allergen size, allergenicity, abundance, and duration in the atmosphere are all factors that influence the presence of symptoms as well as their severity and duration. Cross-reactivity among allergens, such as between Cladosporium and Alternaria [2], and overlapping seasons also have consequences on prolonged exposure, and pollution can also affect the allergenicity of certain particles [3].
Furthermore, on the most basic level, the presence and concentrations of these aeroallergens are dependent on geographic location, climate, and vegetation, hence the importance of site-specific aerobiology research. Calendars tracking the seasonality and abundance of different aeroallergens over the course of several years have been created for cities all over the world, and each one is entirely unique. A study comparing aeroallergen abundance and sensitization rates between Lima, Perú and Tenerife, Spain, two areas with similar climates, suggested that the “Spanish population is exposed to a greater variety of pollen allergens, leading to broader sensitization” [1] (p. 10) compared to the Peruvian population [1].
Pollen and fungal spores have been studied extensively for decades in many countries in Europe and North America; however, there is a large gap in research in many areas including Latin America. The Red Latinoamericana de Aerobiología (RLA) was created in 2023 and only includes eight member states at present, each with only one monitoring station in big cities and towns associated with the RLA apart from Brazil and Puerto Rico which have two stations: Perú (Lima), Argentina (Bahia Blanca), Ecuador (Samborondón), Paraguay (Asunción), Chile (Santiago), Mexico (Ciudad Victoria), Brazil (Paraná and Belo Horizonte), and Puerto Rico (San Juan and Caguas) [4]. The goal of the RLA is to facilitate research, communication, and education both between countries, as well as with patients; RLA members are all adequately trained professionals united by one common goal: to better treat and prevent allergic symptoms. Many of these monitoring stations have only started sampling in the last five years and are now starting to publish initial findings with the help of these more experienced stations, while others have been publishing studies for longer and are currently adding to the existing research. However, even these countries that have established monitoring stations require additional air monitoring and allergy research to reach those goals.
One study from México by Ortega Rosas et al. [5] found that the most abundant spore type was Cladosporium, followed by Ascospores, Smut, Alternaria, and Diatrypaceae, and the highest concentrations occurred in the summer–fall months when temperatures are higher. Many studies found that the fungal spore with the highest atmospheric concentrations was Cladosporium, found throughout the year with peaks in the summer and fall months when temperatures are higher [5,6,7,8,9]. In fact, they also report that the seasons with the highest total concentrations of spores are summer and fall [5,6,7,8,9]. Some articles also reported Alternaria as having significant airborne concentrations, although not to the same extent as Cladosporium [5,7,8,9]. Other spore types analyzed in this article are often not represented in previous studies due to them being present in comparatively low concentrations as compared to the types that are most common in these particular study areas, or due to their absence in these atmospheres as a result of different geographies and vegetation. One study from Argentina reported the presence of Epiccoccum, and Botrytis in large concentrations following those of Cladosporium and Alternaria [7]. Another study from Argentina reported that following Cladosporium, Leptosphaeria, Coprinus, and Agaricus had the highest concentrations in the atmosphere [6]. A study from Colombia found that the majority of spores identified, including Alternaria and Cladosporium, were of allergenic importance, such as Curvularia, Drechslera, Epicoccum, Fusarium, Leptosphaeria, Nigrospora, Pleospora, and Ustilago, to name a few [8]. A study from Chile, similarly, found that Stemphylium, Torula, Epicoccum, Ganoderma, Helminthosporium, Chaetomium, and Pleospora totaled only 1.9% of annual fungal concentrations, as Cladosporium and Alternaria were the types that contributed most to airborne annual fungal concentrations [9].
Aerobiology research in Perú is still in its beginning stages, with most, if not all, research being conducted out of one monitoring station in the capital city of Lima [10,11]. The research that has been published has been limited to identifying the most prevalent aeroallergens in the atmosphere that are of clinical importance, as well as the sensitization rates allergic patients have to these allergens in Lima, Perú. One study reports that, of the identified clinically relevant types, Cladosporium herbarum (14%) and Fusarium (13.5%) had the highest sensitization rates, followed by Nigrospora, Alternaria alternata, Stemphylium, Drechslera/Helminthosporium, Curvularia, and lastly, Aspergillus fumigatus [10]. Another study found that Cladosporium herbarum, Nigrospora, and Alternaria alternata were the most abundant fungal spores in the atmosphere and showed peaks during the summer and autumn months [11].
Comprehensive studies would entail the creation of a calendar that tracks the start and end dates of each identified spore type as well as its concentration throughout the year and would also identify the total atmospheric concentrations, including those of unidentifiable particles. Data collection would span several years to allow for the study of yearly and seasonal variability, as well as to study the impacts that meteorological parameters and climate change could have on the allergen data. Identifying total atmospheric concentrations rather than just allergens of clinical importance would allow researchers, clinicians, and patients to identify the proportion of each allergen to the total concentration of particles at a given time and place. This study aims to provide a more comprehensive understanding of the seasonality and abundance of these clinically important aeroallergens.
2. Materials and Methods
2.1. Study Location
Lima (12°03′36″ S 77°02′15″ W) is the capital of Perú and is one of the most populated cities in the world, having over 10,391,000 inhabitants in 2018 [12]. Lima is characterized by its coastal desert landscape, with Central Lima being surrounded by an unvegetated desert. To the west, Lima is bordered by the Pacific Ocean, and to the right, it is flanked by the Andes mountains [13]. Central Lima has an elevation of about 156 m above sea level. Due to its proximity to the coast, Lima can be described as having a desert climate with subtropical characteristics, as it has mild temperatures (ranging from 16 to 18 °C), low annual precipitation, high humidity, and extensive cloud cover [13].
2.2. Air Sampling and Calculation of Spore Concentrations
A Hirst-type Burkard volumetric 7-day spore trap (Burkard Manufacturing Co., Ltd., Rickmansworth, UK) was placed on the rooftop at a height of 20 m above ground level at SANNA Clínica El Golf, San Isidro, Lima, Perú (12°5′54″ S 77°3′6″ W; 129 m.a.s.l.) (Figure 1). This air sampler allowed for continuous monitoring of airborne particles, aiding in the creation of a more complete spore calendar. Monitoring was carried out from 1 January 2021 through 31 December 2024.
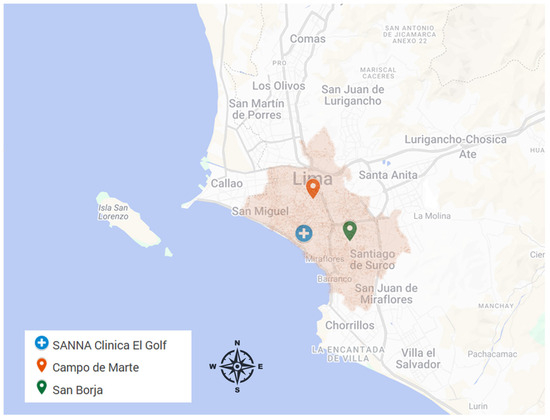
Figure 1.
Map displaying the locations of the spore trap (in blue) and the two meteorological stations (in red and green).
The samples were prepared and stained with fuchsine for analysis under an optic microscope at a magnification of 40×. Fungal spores along four horizontal transects were analyzed, and the concentrations in spores/m3 were obtained for each day, following guidelines set by the American Academy of Allergy, Asthma, and Immunology and the National Allergy Bureau. The main spore season (MSS) was determined using the Nilsson and Persson method [14], where 90% of the total yearly spores were found, with 5% of the total marking the start and 95% marking the end of the season.
2.3. Creation of a Spore Calendar
Spore calendars are usually constructed so they begin during the coldest month of the year, with calendars in the Northern Hemisphere starting in January and those in the Southern Hemisphere starting in July. Therefore, although four full calendar years were monitored (January–December of 2021–2024), only three years were analyzed in this article (July–June of 2021–2022, 2022–2023, and 2023–2024). Table 1 shows the characteristics pertaining to the annual spore integral (ASIn) and main spore season (MSS) for each annual period studied as well as the average including the peak daily value, the start and end dates, and the number of days where the yearly spore concentrations surpassed 50 spores/m3, indicating the presence of allergic symptoms due to Alternaria [15,16], or 1500 spores/m3, indicating the presence of allergic symptoms due to Cladosporium [2,16]. These concentrations are singled out in Table 1 due to the absence of determined thresholds for the other clinically important spore types. As for Cladosporium, allergenic thresholds range from 1500 spores/m3 [17] to 3000 spores/m3 [2,16]. The allergenic thresholds in Table 1 are only applicable to the two known spore concentrations, not the others listed as n.a. ASIn can be calculated by adding the average daily concentrations of a given spore type over the entire annual period, and the MSS is the period of time when 90% of the total annual concentration of a certain spore type is found in a study year at a given location [18]. The mean annual behavior for all types studied was analyzed over a 3-year period and smoothed using a 5-day running mean, as shown in Figure 2. The peak values in Table 1 were calculated using all data points, while the peak concentration values displayed in Figure 2 were derived from the data smoothed with a 5-day running mean. Additionally, the monthly concentrations of Alternaria and Cladosporium were calculated and graphed to show their distribution over the years (Figure 3).

Table 1.
Aerobiological behavior of Cladosporium, Nigrospora, Curvularia, Fusarium, Alternaria, Drechslera, and Stemphylium in Lima, Perú (2021–2024). * daily concentration > 50 spores/m3; ** daily concentration > 1500 spores/m3, n.a. = not applicable.
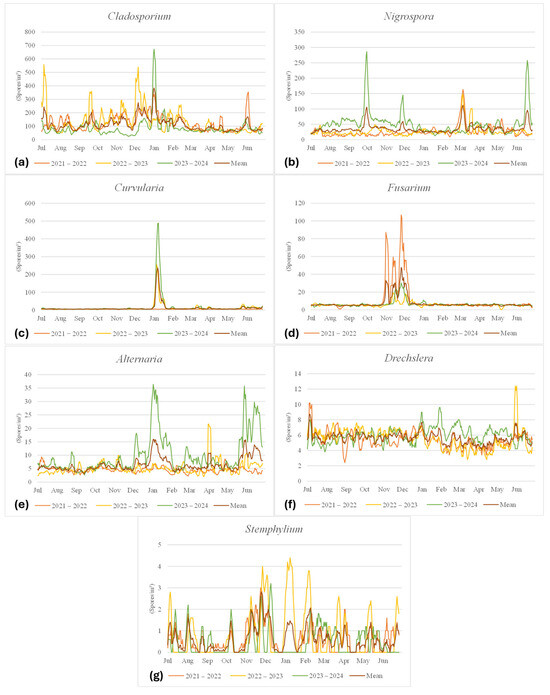
Figure 2.
Seasonal variation (2021–2024; 5-day running mean). (a) Cladosporium; (b) Nigrospora; (c) Curvularia; (d) Fusarium; (e) Alternaria; (f) Drechslera; (g) Stemphylium.
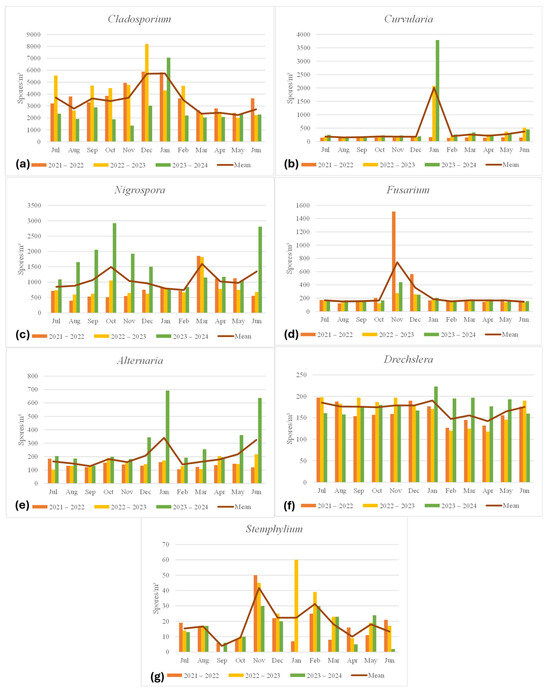
Figure 3.
Total monthly concentrations. (a) Cladosporium; (b) Curvularia; (c) Nigrospora; (d) Fusarium; (e) Alternaria; (f) Drechslera; (g) Stemphylium.
The spore calendar (Figure 4) was constructed using Spieksma’s model [19], where 10-day averages are taken of concentrations equal to or greater than 1 spore/m3 and are assigned 1 of 11 classes (C1: 1–2 spores/m3; C2: 3–5 spores/m3; C3: 6–11 spores/m3; C4: 12–24 spores/m3; C5: 25–49 spores/m3; C6: 50–99 spores/m3; C7: 100–199 spores/m3; C8: 200–399 spores/m3; C9: 400–799 spores/m3; C10: 800–1600 spores/m3; and C11: >1600 spores/m3).
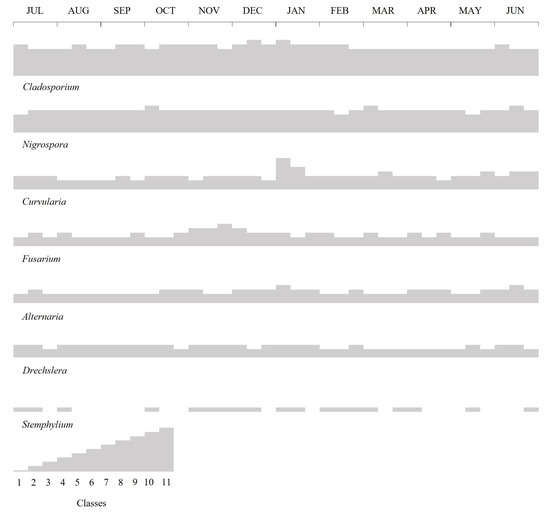
Figure 4.
Spore calendar for Lima, Perú (on average from 2021 to 2024). Exponential classes proposed (C1: 1–2 spores/m3; C2: 3–5 spores/m3; C3: 6–11 spores/m3; C4: 12–24 spores/m3; C5: 25–49 spores/m3; C6: 50–99 spores/m3; C7: 100–199 spores/m3; C8: 200–399 spores/m3; C9: 400–799 spores/m3; C10: 800–1600 spores/m3; and C11: >1600 spores/m3).
2.4. Analysis of Meteorological Parameters
The program SPSS version 30.0.0 was used to analyze the relationships between meteorological factors and daily spore concentrations using the Spearman non-parametric correlation test. The meteorological parameters analyzed were mean daily temperature (°C), total daily rainfall (mm), mean daily relative humidity (%), mean daily frequency of winds from the NE, SE, SW, and NW (%), and mean daily wind speed (km/h) (Table 2). All meteorological data was obtained from the National Service of Meteorology and Hydrology of Perú (SENAMHI), specifically from the Campo de Marte (12°4′14.03″ S; 77°2′35.3″ W; 117 m.a.s.l.) and San Borja (12°6′31.94″ S; 77°0′27.68″ W; 128 m.a.s.l.) stations, each 3.3 km and 4.9 km from Clínica SANNA El Golf, respectively (Figure 1).
Table 2.
Spearman correlation coefficients between daily spore concentrations and main meteorological factors during the main spore season (MSS) of each spore type for 2021–2024.
3. Results
3.1. Characteristics of the Main Spore Seasons
Of the seven spore types in this study, the most abundant was Cladosporium (mean MSS 37,945 spores/m3), followed by Nigrospora (11,558 spores/m3), Curvularia (3946 spores/m3), Fusarium (2454 spores/m3), Alternaria (2138 spores/m3), Drechslera (1850 spores/m3), and Stemphylium (201 spores/m3). Alternaria, Nigrospora, Curvularia, and Drechslera shared a similar trend where the highest concentrations were observed in 2023–2024 (3251 spores/m3; 17,090 spores/m3; 5956 spores/m3; and 1961 spores/m3, respectively), followed by 2022–2023 (1657 spores/m3; 8864 spores/m3; 4224 spores/m3; and 1821 spores/m3, respectively), and finally 2021–2022 (1506 spores/m3; 8719 spores/m3; 1659 spores/m3; and 1767 spores/m3, respectively). However, Cladosporium (44,172 spores/m3) and Stemphylium (251 spores/m3) had the highest concentrations in 2022–2023 (44,172 spores/m3 and 251 spores/m3, respectively) followed by 2021–2022 (41,299 spores/m3 and 189 spores/m3, respectively), and 2023–2024 (28,365 spores/m3 and 163 spores/m3, respectively), and Fusarium had the highest concentrations in 2021–2022 (3314 spores/m3), then 2023–2024 (2155 spores/m3), and then 2022–2023 (1893 spores/m3).
There were differences in peak dates among the three study years. The highest daily peak for each study year varied significantly from year to year for most spore types. In 2021–2022, Alternaria reaches its daily peak of 16 spores/m3 in late April, 28 spores/m3 in June of 2022–2023, and 54 spores/m3 in January of 2023–2024. Figure 2e does not show a distinct peak that all three years seem to share, but the 2023–2024 daily concentrations far exceeded those of the previous two years; 2023–2024 also saw similar trends with Nigrospora and Curvularia. Nigrospora reached its peaks of 188 and 341 in March 2021–2022 and 2022–2023, respectively; however it reached its peak of 421 spores/m3 in October during 2023–2024. Curvularia’s highest peak in 2021–2022 was in early December, reaching only 9 spores/m3, but these concentrations rose significantly to 346 spores/m3 and 653 spores/m3 on the same date, 8 January, of 2022–2023 and 2023–2024, respectively. Cladosporium had the lowest peak, reaching a concentration of 844 spores/m3 on 3 January 2022. The highest peak was reached on that same date in 2024, but the concentration that year was 1124 spores/m3. In 2022–2023, the peak of 1238 spores/m3 was reached in early July, although Figure 2a shows a second peak in December as well. Drechslera and Fusarium had the highest peaks in 2021–2022, in contrast to all the previously mentioned spore types that showed peaks in different annual periods. Drechslera reached a peak of 28 spores/m3 in early July 2021, 24 spores/m3 in June 2023, and 15 spores/m3 in February 2024. Fusarium’s daily peak was 254 spores/m3 in November 2021, 31 spores/m3 in November 2022, and 47 spores/m3 in November 2023. Fusarium, similarly to the previously mentioned types in 2023–2024, had significantly higher concentrations in 2021–2022 when compared to the other years (Figure 2d). Stemphylium’s peak was 5 spores/m3 in November 2021, 6 spores/m3 in January 2023, and 4 spores/m3 in November 2023.
The spore types in this study all had long main spore seasons, mostly spanning 300 days (Table 1). Cladosporium was present almost year-long, with the length of the MSS ranging from 318 to 325. In 2021–2022 and 2023–2024, the main season began in mid-to-late July and ended in early June; however, in 2022–2023, the season had earlier start and end dates, on 8 July and 29 May, respectively. Nigrospora had main spore seasons that ranged from 322 to 326 days, with 2021–2022 and 2022–2023 starting in mid-July and ending in early June and 2023–2024 showing later start and end dates, on 29 July and 20 June, respectively. Curvularia showed start dates in mid-August for 2022–2023 and 2023–2024, but showed a significantly earlier start date in 2021–2022 on 19 June of that annual period. The end dates for all three years were in early June, making the 2021–2022 season longer than the subsequent two years. Contrastingly, Fusarium had start dates in mid-to-late July in 2022–2023 and 2023–2024, but had a later start date in 2021–2022 on 3 August. The end date that year was in late May, resulting in that annual period being shorter than the two subsequent years, which both had end dates on 7 June. Alternaria had start dates in mid-to-late July and end dates in early to mid-June in all three study years, with the length of the MSS ranging between 329 and 332 days. Similarly, there were minimal variations in the main spore seasons of Drechslera, with start dates happening in mid-July and end dates occurring in early to mid-June. Lastly, Stemphylium showed the same start date of 15 July in 2021–2022 and in 2023–2024 and an earlier start date of 9 July in 2022–2023. In 2021–2022 and 2022–2023, the end dates were in mid-June, while 2023–2024 had its end date on 21 May, making this season shorter than the previous two.
3.2. Spore Calendars
Figure 4 shows the average spore concentrations, grouped in 10-day intervals for the seven spore types analyzed in this study, averaged over the three annual periods (2021–2024). At its highest concentration, Cladosporium reached class 8 (200–399 spores/m3) during the second 10-day period in December and during the first 10 days of January. The period from July to June showed mainly class 6 concentrations (50–99 spores/m3). Nigrospora reached class 6 concentrations (50–99 spores/m3) during the first 10 days of October and March and during the second 10-day period of June but maintained class 5 concentrations (25–49 spores/m3) throughout the rest of the year. Cladosporium and Nigrospora showed consistently high concentrations throughout the year; however, Curvularia had a distinct peak in the first 10 days of January, reaching class 7 (100–199 spores/m3), while the rest of the year had contrastingly low, mostly class 3 concentrations (6–11 spores/m3). Fusarium reached class 5 (25–49 spores/m3) during the last 10 days of November, but concentrations remained at class 2 (3–5 spores/m3) or class 3 (6–11 spores/m3) concentrations for the rest of the year. Alternaria had class 2 (3–5 spores/m3) and class 3 (6–11 spores/m3) concentrations for the majority of the annual period but reached a peak of class 4 (12–24 spores/m3) in the first 10 days of January and in the second 10 days of June. Drechslera alternated between class 2 (3–5 spores/m3) and class 3 (6–11 spores/m3) concentrations throughout the annual period, while Stemphylium only reached class 1 concentrations for half of the year (1–2 spores/m3).
3.3. Correlations with Meteorological Parameters
The annual period from 2021 to 2022 was the coldest of the three study years, with an average daily temperature of 18.1 °C; 2022–2023 had the second warmest temperature (19.6 °C), and 2023–2024 was the warmest year (20.4 °C). The year 2021–2022 also had the lowest precipitation, adding up to 0.2 mm. This was followed by 2023–2024, which had 0.3 mm of rainfall, and lastly 2022–2023, the wettest year, which had 0.4 mm of rainfall. Similarly, 2021–2022 also had the lowest relative humidity out of the three annual periods (83%), followed by 2022–2023 (83.3%) and 2023–2024 (83.6%). Lastly, 2021–2022 was the year with the highest mean daily wind speed, averaging 2.2 km/h, followed by 2022–2023 with 1.8 km/h and 2023–2024 with 1.2 km/h. Additionally, the mean daily temperatures of July from the annual period 2022–2023 (15.1 °C) were lower than those from 2021 to 2022 (16.3 °C) and from 2023 to 2024 (19.9 °C), and the temperatures in January from the annual period 2022–2023 (21.6 °C) were lower than the temperatures from 2021 to 2022 (21.8 °C) and from 2023 to 2024 (24.0 °C).
From 2021 to 2024, fungal spore concentrations exhibited varied correlations, values, and signs with meteorological variables (Table 2). Alternaria, Nigrospora, and Curvularia all showed significant positive correlations with mean daily temperature in multiple, individual years and on average, although Alternaria’s annual patterns were mixed and included non-significant or negative trends. However, Cladosporium and Drechslera showed inconsistent responses, with Cladosporium exhibiting a significant positive correlation in select years but a significant negative correlation overall, and Drechslera mostly showing significant negative correlations except for a positive shift in 2023–2024. Fusarium and Stemphylium showed only non-significant correlations with temperature throughout.
Correlations with rainfall were more variable and less consistent across taxa. Most genera, including Alternaria, Cladosporium, and Drechslera, displayed predominantly non-significant associations. Nigrospora and Curvularia each showed at least one significant correlation in opposite directions, positive for Nigrospora in 2023–2024 and negative for Nigrospora and positive for Curvularia in 2021–2022, while Fusarium was significantly negatively correlated with rainfall on average, despite it being non-significant in individual years. Stemphylium had only non-significant correlations.
With respect to relative humidity, Cladosporium, Curvularia, and Fusarium exhibited significant negative correlations across multiple years and on average. Nigrospora and Alternaria both shifted direction across years, each showing both significant positive and negative associations. Drechslera and Stemphylium had some significant correlations but were otherwise inconsistent.
Wind direction effects were generally weak, though some types demonstrated notable trends. No type had consistent significant correlations with northeast or southeast winds, though Curvularia showed mixed results including significant positive correlations with northeast winds, and Fusarium and Stemphylium had significant correlations with southeast winds (negative and positive, respectively). Cladosporium showed a consistently positive relationship with southwest winds, while Curvularia had a significant negative average correlation. For northwest winds, several genera had significant correlations, positive for Curvularia and negative for Alternaria, Cladosporium, and Drechslera, while the others remained non-significant.
Wind speed showed some of the clearest associations; Cladosporium and Curvularia were both significantly correlated across multiple years (positive for Cladosporium, negative for Curvularia except in 2023–2024). Alternaria, Nigrospora, and Fusarium each had significant correlations in at least one year or on average, either positive or negative. Drechslera had a significant positive correlation in 2022–2023, while Stemphylium showed no significant correlation, with wind speed.
4. Discussion
The three years analyzed during this study showed variable concentrations, indicating that additional research spanning longer than three years would be beneficial to better examine trends and changes. The year 2023–2024 had the highest mean daily temperature, the highest relative humidity, and the lowest wind speed; this was also the year when Alternaria, Nigrospora, Curvularia, and Drechslera had the highest total concentrations. Studies show that generally, the season with the highest concentrations and diversity is the summer, when temperatures are higher, wind speed is higher, and relative humidity is lower [20], but the most important meteorological parameter is by far temperature. The year 2021–2022 had the lowest mean temperature, lowest precipitation, and lowest relative humidity, with the highest wind speed. Fusarium had its highest total concentration in 2021–2022. The year 2022–2023 was the wettest year and was also the year when Cladosporium and Stemphylium had their highest total concentrations. Studies show that dry years with low precipitation were followed by years with low spore concentrations [3]. The driest year, 2021–2022, was followed by 2022–2023, a year with comparatively low spore concentrations, and 2022–2023, the wettest year, led to 2023–2024 having the highest concentrations of most of the spore types analyzed in this study.
The results from this study show that, among the seven spore types that were identified, Cladosporium is the most abundant type, also proven in other studies from around the world [5,7,9,17,20,21,22,23,24,25,26,27,28]. Cladosporium, more common in urban sites [28], is typically present year-round, with peaks in the summer and autumn months [5,6,9,16,20,21,26,29]. This behavior is also present in Lima with the daily concentrations registered in December-January, summer in Perú. Other studies show peaks in the winter and spring months [25,30,31]. The year 2022–2023 had its highest concentration in July; however, this steep peak was immediately preceded and succeeded by relatively low concentrations, which gradually increased in the spring until the second highest peaks were registered in December. Average daily temperatures for July 2022 were lower than those in 2021 and 2023, and precipitation and humidity were consistent with values from the previous year. Studies typically show that higher temperatures drive spore dispersal, indicating that the drop in daily mean temperatures during July of 2022 may not be the cause for that increase in concentration but may be due to some other unknown cause. This is further confirmed by total monthly concentrations with December being the month with the highest spore abundance. Cladosporium reached class 8 during the second 10-day period in December and during the first 10 days of January. Other studies in European cities show concentrations reaching class 10 (800–1600 spores/m3) [17] and class 11 (>1600 spores/m3) [28].
Alternaria is a major cause of allergic symptoms and asthma during the summer and autumn months when thresholds surpass concentrations of 50–80 spores/m3 [2,27]. Although many studies rank Alternaria as one of the most abundant spores [5,6,7,8,9,22,23,24,29,32], other studies conclude that it has low abundance [9,17,27,33]. Higher concentrations are usually registered in inland, more agriculturally focused areas as opposed to coastal areas [20,27,32], with peaks in the summer and autumn months [5,9,16,21,26,29] mainly due to the harvest season [28]. Alternaria had its highest concentrations in the summer and autumn months of 2022–2023 and 2023–2024; however, a peak was registered in the winter of 2021–2022. Some studies reported a delayed peak in concentrations following periods of heavy rain [27]; this could possibly explain the difference among the study years. At its highest, Alternaria reached a class 4 concentration in the first 10 days of January and the second 10 days of June. Other studies show Alternaria reaching higher concentrations like class 5 (25–49 spores/m3) [34], class 6 (50–99 spores/m3) [17], and class 8 [28].
Although Alternaria and Cladosporium are the two most important outdoor allergens [5], the remaining five genera studied are also of clinical importance. Nigrospora, although the second most abundant spore in this study, is not often mentioned in fungal spore calendars due to its low abundance in comparison to total airborne particle concentrations; however, a couple studies categorize it as a dominant aeroallergen [23,31,33]. In one study from India [31], peak concentrations were reached between March and September during the dry season and in Cuba from November to January, also during the dry season [35]. The climates in both areas do not have four defined seasons, and temperatures vary depending on the region, therefore rainfall and humidity play a bigger factor. In this study, Nigrospora had the highest mean daily concentrations in March of both 2021–2022 and 2022–2023, but reached it in October during the last year. The year 2023–2024 had significantly higher concentrations throughout the entire year, showing a second peak in January. As mentioned previously, 2022–2023 being the wettest year likely resulted in higher concentrations throughout the year 2023–2024. Nigrospora reached a maximum of class 6 during the first 10 days of October and March and during the second 10-day period in June.
Curvularia had the highest mean daily concentrations during the summer months of December and January. Some studies reported similar findings of peaks during the summer months [30], one reported it in the winter [31], and another reported it during the wet season [33]. This genus, unlike the others in this study, appears to have the steepest peak, and an overall short date range where concentrations remained consistently higher than the rest. Curvularia reached class 7 in the first 10 days of January.
Drechslera reached peak daily concentrations in the winter during both 2021–2022 and 2022–2023, in July and June, respectively. Most studies report peak concentrations during the late summer and autumn months [21,28,29,30], and some report them during spring [26,31]. During 2023–2024, the highest mean daily concentration was in February, in accordance with previous studies, but concentrations across all three years seemed relatively consistent even though the peaks themselves were not. Drechslera reached class 3 at several points throughout the year, while other studies reported values reaching class 5 [28].
Like with Curvularia, Fusarium also showed consistent peaks in November for all three study years. Similar findings were reported in one study [31], while another reported it during the rainy season [33]. Fusarium reached a class 5 concentration in the last 10 days of November. Stemphylium was present in very low concentrations, with daily peaks of 5 spores/m3, 6 spores/m3, and 4 spores/m3 from November to January. Another study reported two peaks, one from March to May and the other from October to November, with an annual mean of 11 spores/m3 [9]. Some studies report similar findings, with peaks occurring during the late spring and early summer months [21,25,26,29]. On average across all three years, Stemphylium reached a maximum concentration of class 1; however, another study from Spain reported a maximum concentration of class 2 [28].
The main spore seasons for all spore types in this study span nearly the entire annual period. Many studies also report the year-round presence of Cladosporium and Alternaria in the atmosphere [5,6,16,21,25]. Some studies from Melbourne, Australia and from Islamabad, Pakistan also include the long-term presence of Drechslera and Stemphylium [26,30], and another from Thessaloniki, Greece includes these, plus Nigrospora and Fusarium [23]. One study from Tétouan, Morocco reports the year-round presence of Alternaria, Cladosporium, Curvularia, Drechslera, and Stemphylium [25], and another study from Havana, Cuba reports the presence of Alternaria, Cladosporium, Nigrospora, Curvularia, and Fusarium in their atmosphere [33]. These studies do not specifically report the length of the main spore seasons, but a couple studies from Spain have reported shorter MSS lengths for Alternaria and Cladosporium [17,28].
Cladosporium and Alternaria are considered to be ‘dry air spores’, meaning they typically favor conditions with high temperatures, low rainfall, and low humidity [16,23,25,27,29,31,32]. In this study, Cladosporium and Alternaria showed a mix of weak positive and negative correlations with mean daily temperature and rainfall; however, none of the latter proved significant. Alternaria similarly showed varying correlations with relative humidity, while Cladosporium showed significant negative correlations with this parameter. While most studies agree that these two genera correlate with temperatures [17,28,32], a few studies show negative correlations with humidity [17,28]. A study from Uruguay showed a positive correlation between Cladosporium concentrations and relative humidity [32], contrasting most studies. Studies seem to show the same positive and negative correlations with temperature and humidity, respectively, as it pertains to Nigrospora, Curvularia, Drechslera, Fusarium, and Stemphylium [23,25]. One study reports a negative correlation between Drechslera and Alternaria and rainfall [28], and another reports negative correlations with all types except for Curvularia, which was not mentioned, and Fusarium, which had a positive correlation [23]. This study, however, did not find strong significant correlations with rainfall. As for wind direction, this study found that Cladosporium and Stemphylium correlated negatively with winds to the northeast while Curvularia had the opposite reaction in at least one year. One study shows a positive correlation between this parameter and Cladosporium, and Stemphylium [25], and another showed that same relationship only with Cladosporium [17]. Fusarium and Stemphylium have opposite correlations with southeasterly winds, negative and positive, respectively, but one study reports a negative correlation with Stemphylium [25]. The trap’s industrial, low-vegetation location near the ocean suggests Cladosporium likely came from food or plant material [35], while Curvularia from the northwest originated inland from pastures or agriculture [36]. Stemphylium is typically found on decaying plants and in the soil [29], meaning winds from the southeast carried these spores towards the air sampler. As for wind speed, the assumption is that, as it increases, so does dispersal; that rings true for Cladosporium for most years and on occasion for the other genera, but, in this study, wind speed typically had a mixed correlation. One study reports positive correlations between wind speed and Alternaria, Cladosporium, and Stemphylium [25], but another reports a negative correlation between this parameter and Alternaria and Cladosporium [32]. Correlations that are positive may indicate that the source of the spore was far away from the air sampler, while negative correlations may indicate proximity to the sampler.
A limitation of the study is that the samples were collected from a single monitoring station within the city. Therefore, the results and conclusions may not fully represent other areas with different environmental or socio-demographic conditions. Future studies including multiple sites would provide a more comprehensive understanding and improve the generalizability of the findings.
Additionally, the inclusion of all spore types, and even of pollen grains as well, rather than just the ones of clinical importance, would help provide a more complete understanding of airborne allergenic particles in the atmosphere and would help determine specific periods with large concentrations of allergenic types capable of producing allergic symptoms. Future research could concurrently analyze results from skin prick allergy testing and patient surveys, which would allow for a more detailed overview of the allergic risk in Lima, Perú.
5. Conclusions
This three-year aerobiological study provides a deeper understanding of the seasonal patterns and abundance of clinically important fungal spores, as well as the influence meteorological parameters may have on them, in Lima, Perú. This study showed variation in both seasonality and in abundance for several spore types for each of the years analyzed. Cladosporium was consistently the most abundant genus, a result similarly reported in many studies globally. Alternaria showed similar behaviors to Cladosporium throughout the year, albeit at significantly lower concentrations. Alternaria also exhibited peaks during the winter months, which was not commonly reported in other studies, but may have been possibly due meteorological factors such as rainfall. Curvularia, Fusarium, and Stemphylium also showed consistent peaks primarily in the summer and autumn months, while Nigrospora had the highest concentrations in the spring.
The most influential meteorological parameter was temperature, demonstrating a positive correlation with most genera except for Drechslera. Relative humidity was also influential, with the results showing negative correlations with all spore types except Drechslera. As for the other meteorological parameters analyzed, correlations were mostly weak, insignificant, or showed varying relationships from year to year.
Future studies should aim to lengthen the study period to more clearly see trends in seasonality and abundance, as well as to provide insight into the relationships between these and certain meteorological parameters (including winds gusts and calms, if possible) since each year showed substantial changes in the seasonality of each spore type.
Author Contributions
Conceptualization, A.P.I., O.C.-L. and E.S.-R.; methodology, A.P.I., O.C.-L. and E.S.-R.; software, A.P.I. and O.C.-L.; validation, O.C.-L., M.F. and E.S.-R.; formal analysis, A.P.I. and O.C.-L.; investigation, A.P.I. and O.C.-L.; resources, O.C.-L. and E.S.-R.; data curation, A.P.I. and O.C.-L.; writing—original draft preparation, A.P.I.; writing—review and editing, O.C.-L., M.F. and E.S.-R.; visualization, A.P.I.; supervision, M.F. and E.S.-R.; project administration, E.S.-R.; funding acquisition, O.C.-L., M.F. and E.S.-R. All authors have read and agreed to the published version of the manuscript.
Funding
This work was supported by national funds through FCT/MCTES (PIDDAC): CIMO, UIDB/00690/2020 (DOI: 10.54499/UIDB/00690/2020) and UIDP/00690/2020 (DOI: 10.54499/UIDP/00690/2020); and SusTEC, LA/P/0007/2020 (DOI: 10.54499/LA/P/0007/2020).
Institutional Review Board Statement
Not applicable.
Informed Consent Statement
Not applicable.
Data Availability Statement
The data supporting the results published in this article can be requested by contacting the authors.
Acknowledgments
The authors would like to thank the University of Malta for allowing Erasmus placements at the University of Salamanca and at the Instituto Politécnico de Bragança, where the analysis and writing of the article took place.
Conflicts of Interest
The authors declare no conflicts of interest.
Abbreviations
The following abbreviations are used in this manuscript:
| ASIn | Annual spore index |
| MSS | Main spore season |
References
- González-Pérez, R.; Galván-Calle, C.A.; Galán, T.; Poza-Guedes, P.; Sánchez-Machín, I.; Enrique-Calderón, O.M.; Pineda, F. Molecular signatures of aeroallergen sensitization in respiratory allergy: A comparative study across climate-matched populations. Int. J. Mol. Sci. 2024, 26, 284. [Google Scholar] [CrossRef]
- Pashley, C. Health Effects of Climate Change (HECC) in the UK: 2023 report Chapter 6. In Outdoor Airborne Allergenic Pollen and Fungal Spores; UK Health Security Agency: London, UK, 2023. [Google Scholar]
- Pérez-Badia, R.; Rapp, A.; Sardinero, S.; Galán, C.; García-Mozo, H. Pollen spectrum and risk of pollen allergy in central Spain. Ann. Agric. Environ. Med. 2010, 17, 139–151. [Google Scholar] [PubMed]
- Calderon Llosa, O. Red Latinoamericana de Aerobiología. 2023. Available online: https://www.redlatamaerobiologia.com/ (accessed on 30 August 2025).
- Ortega-Rosas, C.I.; Medina-Félix, D.; Macías-Duarte, A.; Gamez, T. A six-year airborne fungal spore calendar for a city in the Sonoran Desert, Mexico: Implications for human health. J. Fungi 2025, 11, 183. [Google Scholar] [CrossRef] [PubMed]
- Mallo, A.C.; Nitiu, D.S.; Gardella Sambeth, M.C. Airborne fungal spore content in the atmosphere of the city of La Plata, Argentina. Aerobiologia 2010, 27, 77–84. [Google Scholar] [CrossRef]
- Temperini, C.V.; Franchi, M.L.; Benavides Rozo, M.E.; Greco, M.; Pardo, A.G.; Pose, G.N. Diversity and abundance of airborne fungal spores in a rural cold dry desert environment in Argentinean Patagonia. Sci. Total Environ. 2019, 665, 513–520. [Google Scholar] [CrossRef]
- Alzate Guarín, F.; Quijano Abril, M.A.; Alvarez, A.; Fonnegra, R. Atmospheric pollen and spore content in the urban area of the city of Medellin, Colombia. Hoehnea 2015, 42, 9–19. [Google Scholar] [CrossRef]
- Ibáñez Henríquez, V.; Rojas Villegas, G.; Maria, J.; Nolla, R. Airborne fungi monitoring in Santiago, Chile. Aerobiologia 2001, 17, 137–142. [Google Scholar] [CrossRef]
- Calderón-Llosa, O.M. Identificación y sensibilización a hongos ambientales en Lima, Perú. Rev. Alerg. Mex. 2024, 71, 82. [Google Scholar] [CrossRef]
- Calderón, O.; Uriarte, S.; Quirce, S.; Sastre, J. Aerobiological Study in Lima (Peru). J. Allergy Clin. Immunol. 2015, 135, AB189. [Google Scholar] [CrossRef]
- United Nations, Department of Economic and Social Affairs, Population Division. World Urbanization Prospects 2018: Highlights (ST/ESA/SER.A/421); United Nations: New York City, NY, USA, 2019. [Google Scholar]
- Cano, D.; Cacciuttolo, C.; Rosario, C.; Barzola, R.; Pizarro, S.; Ramirez, D.W.; Freitas, M.; Bremer, U.F. Performance of green areas in mitigating the alteration of land surface temperature in urban zones of Lima, Peru. Remote Sens. 2025, 17, 1323. [Google Scholar] [CrossRef]
- Nilsson, S.; Persson, S. Tree pollen spectra in the Stockholm region (Sweden), 1973–1980. Grana 1981, 20, 179–182. [Google Scholar] [CrossRef]
- Fuentes Antón, S.; Sánchez Reyes, E.; Rodríguez De La Cruz, D.; García Sánchez, A.; Dávila, I.; Sánchez Sánchez, J. Comparison of Alternaria spore levels between two areas within the same city (Salamanca, Middle West Spain). Aerobiologia 2021, 37, 809–824. [Google Scholar] [CrossRef]
- Katotomichelakis, M.; Nikolaidis, C.; Makris, M.; Proimos, E.; Aggelides, X.; Constantinidis, T.C.; Papadakis, C.E.; Danielides, V. Alternaria and Cladosporium calendar of Western Thrace: Relationship with allergic rhinitis symptoms. Laryngoscope 2015, 126, E51–E56. [Google Scholar] [CrossRef] [PubMed]
- Fuentes Antón, S.; Rodríguez De La Cruz, D.; Sánchez Sánchez, J.; Sánchez Reyes, E. Analysis of the airborne fungal spores present in the atmosphere of Salamanca (MW Spain): A preliminary survey. Aerobiologia 2019, 35, 447–462. [Google Scholar] [CrossRef]
- Galán, C.; Ariatti, A.; Bonini, M.; Clot, B.; Crouzy, B.; Dahl, A.; Fernández-González, D.; Frenguelli, G.; Gehrig, R.; Isard, S.; et al. Recommended terminology for aerobiological studies. Aerobiologia 2017, 33, 293–295. [Google Scholar] [CrossRef]
- Spieksma, F. Regional european pollen calendars. In Allergenic Pollen and Pollinosis in Europe; D’Amato, G., Spieksma, F.T.M., Bonini, S., Eds.; Blackwell Scientific Publications: Oxford, UK, 1991; pp. 49–65. [Google Scholar]
- De Antoni Zoppas, B.C.; Valencia-Barrera, R.M.; Vergamini Duso, S.M.; Fernández-González, D. Fungal spores prevalent in the aerosol of the city of Caxias do Sul, Rio Grande do Sul, Brazil, over a 2-year period (2001–2002). Aerobiologia 2006, 22, 117–124. [Google Scholar] [CrossRef]
- Bednarz, A.; Pawłowska, S. A fungal spore calendar for the atmosphere of Szczecin, Poland. Acta Agrobot. 2016, 69, 1669. [Google Scholar] [CrossRef]
- Bianchi, M.M.; Olabuenaga, S.E. A 3-year airborne pollen and fungal spores record in San Carlos de Bariloche, Patagonia, Argentina. Aerobiologia 2006, 22, 247–257. [Google Scholar] [CrossRef]
- Gioulekas, D.; Damialis, A.; Mpalafoutis, C.; Papakosta, D.; Giouleka, P.; Patakas, D. Allergenic fungal spore records (15 Years) and relationship with meteorological parameters in Thessaloniki, Greece. Allergy Clin. Immunol. Int.—J. World Allergy Organ. 2004, 16, 52–59. [Google Scholar] [CrossRef]
- Hasnain, S.M.; Fatima, K.; Al-Frayh, A.; Al-Sedairy, S.T. One-year pollen and spore calendars of Saudi Arabia Al-Khobar, Abha and Hofuf. Aerobiologia 2005, 21, 241–247. [Google Scholar] [CrossRef]
- Hayoun, I.; El Haskouri, F.; Bouziane, H. Airborne fungal spores in Tétouan (NW of Morocco), sporal calendar and meteorogical parameters. Rev. Française D’Allergologie 2024, 64, 104146. [Google Scholar] [CrossRef]
- Mitakakis, T.Z.; Guest, D.I. A fungal spore calendar for the atmosphere of Melbourne, Australia, for the year 1993. Aerobiologia 2001, 17, 171–176. [Google Scholar] [CrossRef]
- Sánchez Reyes, E.; Rodríguez de la Cruz, D.; Sanchís Merino, M.E.; Sánchez Sánchez, J. Meteorological and agricultural effects of airborne Alternaria and Cladosporium spores and clinical aspects in Valladolid (Spain). Ann. Agric. Environ. Med. 2009, 16, 53–61. [Google Scholar]
- Sánchez Reyes, E.; Rodríguez de la Cruz, D.; Sánchez Sánchez, J. First fungal spore calendar of the middle-west of the Iberian Peninsula. Aerobiologia 2016, 32, 529–539. [Google Scholar] [CrossRef]
- Taia, W.K.; Ibrahim, M.I.; Bassiouni, E.M. Study of the airborne fungal spores in Rosetta, Egypt. Eur. J. Exp. Biol. 2019, 9, 4. [Google Scholar] [CrossRef]
- Abbas, S.; Katelaris, C.H.; Singh, A.B.; Raza, S.M.; Ajab Khan, M.; Rashid, M.; Abbas, M.; Ismail, M. World Allergy Organization study on aerobiology for creating first pollen and mold calendar With clinical significance in Islamabad, Pakistan. World Allergy Organ. J. 2012, 5, 103–110. [Google Scholar] [CrossRef] [PubMed]
- Nayak, B.K.; Nanda, A.; Behera, N. Airborne fungal spores in an industrial area: Seasonal and diurnal periodicity. Aerobiologia 1998, 14, 59–67. [Google Scholar] [CrossRef]
- Martínez Blanco, X.; Tejera, L.; Beri, Á. First volumetric record of fungal spores in the atmosphere of Montevideo City, Uruguay: A 2-year survey. Aerobiologia 2015, 32, 317–333. [Google Scholar] [CrossRef]
- Almaguer, M.; Aira, M.-J.; Rodríguez-Rajo, F.J.; Fernandez-Gonzalez, M.; Rojas-Flores, T.I. Thirty-four identifiable airborne fungal spores in Havana, Cuba. Ann. Agric. Environ. Med. 2015, 22, 215–220. [Google Scholar] [CrossRef]
- Sánchez Reyes, E.; Córdoba Jara, A.; Sánchez Sánchez, J.; Mardones Precht, P. Seasonal pattern of Alternaria airborne spores in Santiago de Chile, Chile (2005–2015 period): First Alternaria spore calendar. Aerobiologia 2022, 38, 145–150. [Google Scholar] [CrossRef]
- Ogórek, R.; Lejman, A.; Pusz, W.; Miłuch, A.; Miodyńska, P. Characteristics and taxonomy of Cladosporium fungi. Mikol. Lek. 2012, 19, 80–85. [Google Scholar]
- Bravo, A.; Moreno, N.; Cáceres, Z.; Hopfgartner, K. Perú Cobertura y Uso del Suelo. Map Biomas; Instituto del Bien Comun. 2024. Available online: https://peru.mapbiomas.org/mapa-mural/ (accessed on 28 July 2025).


Disclaimer/Publisher’s Note: The statements, opinions and data contained in all publications are solely those of the individual author(s) and contributor(s) and not of MDPI and/or the editor(s). MDPI and/or the editor(s) disclaim responsibility for any injury to people or property resulting from any ideas, methods, instructions or products referred to in the content. |
© 2025 by the authors. Licensee MDPI, Basel, Switzerland. This article is an open access article distributed under the terms and conditions of the Creative Commons Attribution (CC BY) license (https://creativecommons.org/licenses/by/4.0/).