Abstract
The Lenghu site has emerged as a prominent candidate for future large telescopes, making a detailed understanding of its meteorological environment essential as it directly determines telescope performance, observational efficiency, and data quality. Based on multi-year observations spanning nearly two decades (2005–2024) from six meteorological stations, we conducted a comprehensive analysis of temperature, humidity, atmospheric pressure, wind speed, and wind direction, which directly affect key observing conditions such as atmospheric seeing, infrared transparency, and telescope pointing stability, in order to characterize the site’s meteorological conditions. The diurnal temperature range is approximately 9 °C, with 90% of hourly nighttime variations within 0–1°C. Relative humidity exceeds 90% less than 1% of the time, with a median below 31%. Atmospheric pressure becomes increasingly stable with altitude. Winds are predominantly westerly at night and weaker than during the day, with median speeds of 2–. Strong wind events (≥) occur occasionally at mid-mountain levels, while the maximum recorded wind speed at the summit is . We further calculated the nighttime dew-point temperature using ambient temperature and relative humidity, and inferred nighttime weather stability by comparing observed and theoretical pressures. The meteorological characteristics revealed by long-term, multi-station observations exhibit stable interannual and seasonal variations, indicating that the Lenghu site offers long-term, stable, and favorable conditions for astronomical observations. These results also provide valuable guidance for the construction, operation, and observational planning of future large telescopes.
1. Introduction
The selection of an optimal site for an optical astronomical observatory is a systematic, multi-stage process that requires extensive data collection and in-depth analysis. The initial broad-scale screening phase considers multiple factors, including geographic location, climate conditions, topographical features, and cloud coverage, to identify potential regions for astronomical observations. This phase typically relies on meteorological data, particularly satellite data, to assess key environmental parameters such as cloud cover, annual precipitation, humidity, artificial light pollution, and aerosol content [1,2,3]. In general, high-altitude, arid locations with low cloud coverage and low human impact are more suitable for optical astronomical observations. The Tibetan Plateau in western China exhibits these advantageous characteristics, making it a prime candidate for astronomical site selection [4,5,6,7]. After identifying potential candidate regions, it is essential to conduct detailed on-site measurements and assessments. The evaluation focuses on key factors such as seeing conditions, the number of observable nights, and the trends of surface meteorological parameters [8,9]. Recent studies have shown that Saishiteng Mountain, located near Lenghu Town, offers remarkable atmospheric stability, and the observable conditions are on par with those of the best astronomical observatories in the world [10,11]. The mountain is characterized by minimal nighttime temperature variations and low atmospheric water vapor content, making it highly suitable for high-precision optical and near-infrared/infrared astronomy [12,13]. Continuous monitoring of site seeing, cloud cover, and meteorological conditions provides a comprehensive dataset for evaluating observational quality. It lays a crucial foundation for the construction of large telescopes and the development of optimized observational strategies.
An ideal site for optical astronomical observations should possess favorable meteorological conditions such as stable nighttime temperatures, low relative humidity, and moderate-to-low wind speeds [14,15]. With the ongoing impacts of global climate change, astronomical observatories around the world are experiencing varying degrees of changes in their observing conditions [16,17,18]. Continuous ground-based meteorological monitoring is essential for assessing the stability and observational potential of a site, as these atmospheric conditions directly influence the performance of astronomical instruments and the quality of acquired data [12,19]. In monitoring meteorological conditions at astronomical sites, short-term data capture instantaneous fluctuations in atmospheric parameters, whereas long-term data are more effective for revealing the site’s overall climatic characteristics. Long-term data on key parameters such as air temperature, humidity, atmospheric pressure, and wind speed allow characterization of seasonal and interannual variations, thereby enabling assessment of a site’s observational conditions over extended timescales [3,20]. Additionally, analysis based on long-term ground-based meteorological data can be used to assess the likelihood of extreme weather events. For example, excessively high wind speeds may enhance near-surface turbulence and degrade seeing conditions, while icing and high humidity can lead to interruptions in observation schedules. Moreover, these data can provide a scientific foundation for supporting the sustainable development of astronomical observatory [12,21].
In this work, we collected fundamental meteorological parameters, including air temperature, relative humidity, atmospheric pressure, wind speed, and wind direction, from three weather stations around the Lenghu site and three general-purpose stations located on Saishiteng Mountain, where the observatory is situated. Based on a comprehensive analysis of these parameters, this study characterizes the mid- to long-term ground-based meteorological conditions at the Lenghu site. These findings provide a scientific foundation for future site development planning, the construction of large telescopes, and the optimization of observational strategies. In Section 2, we present the geographic distribution of six weather stations, as well as the information about the instrumentation and the datasets. Section 3 and Section 4 present the statistical characterization of meteorological conditions in the Lenghu region and the Saishiteng Mountain area, respectively. Section 5 then discusses the relevance of these surface meteorological parameters to astronomical site evaluation, and the principal conclusions are provided in Section 6.
2. Monitoring Instruments and Data
The Lenghu site, also known as the Lenghu Astronomical Observatory, is located in the Lenghu town area of Mangya City, Haixi Mongol and Tibetan Autonomous Prefecture, Qinghai Province, China. It lies at an elevation of approximately 4200 m on Saishiteng Mountain, in the northwestern Qaidam Basin, and adjacent to the northern edge of the Tibetan Plateau. Figure 1 presents the geographic distribution of the Lenghu site and three meteorological stations in the Qaidam Basin. The approximate location of this region is marked by a red balloon on the map of China (upper right). The red pentagram marks the Lenghu site located on Saishiteng Mountain, while the yellow pentagrams indicate the positions of the Lenghu, Mahai, and Dafengshan meteorological stations, respectively. The precise geographic coordinates of the Lenghu site are 383624.5 N latitude and 93;53;46 E longitude. The background depicts regional elevation ranging from below 1000 m to above 5000 m, as shown by the color bar on the right.
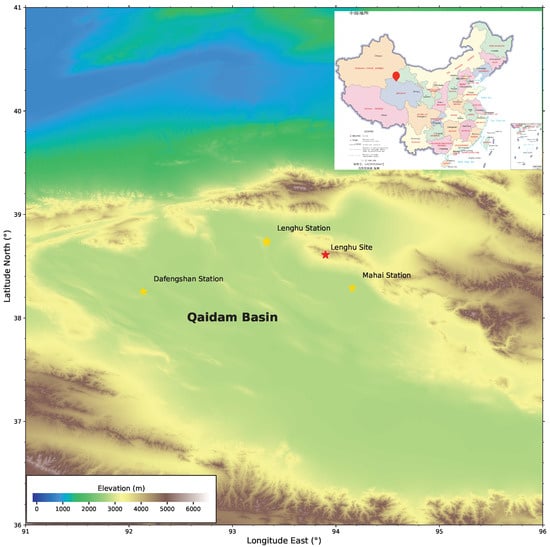
Figure 1.
Geographic distribution of the Lenghu astronomical site and nearby meteorological stations in the Qaidam Basin. The approximate location of this region is marked by a red balloon on the map of China (upper right). The red pentagram marks the location of the Lenghu site, while yellow stars indicate the positions of the Lenghu, Mahai, and Dafengshan meteorological stations. The background color map represents elevation (in meters), with lower elevations shown in blue and green, and higher elevations in yellow, brown, and gray, as indicated by the color bar.
2.1. Instruments
The Lenghu, Mahai, and Dafengshan meteorological stations, which are operated by the Haixi Meteorological Administration, are three national-standard stations located in relatively flat, low-elevation areas surrounding the Lenghu site, as indicated by the yellow stars in Figure 1. Table 1 summarizes basic information about these stations, including their geographic coordinates, altitude, instruments, time coverage, and data resolution. The three stations are positioned at similar elevations, which facilitates a reliable comparison of their recorded data. The Lenghu station is equipped with a DZZ4 automatic weather station, which was developed and manufactured by Aerospace New Meteorological Technology Co., Ltd., Wuxi, China. It provides high-resolution data at 1 min intervals from 2005 January to 2017 September, spanning over 12 years. The Dafengshan and Mahai stations, both equipped with ZQZ-BH automatic weather systems produced by the same manufacturer as DZZ4, collected hourly meteorological data from 2016 January to 2017 September and from 2013 May to 2017 September, respectively. These stations offer continuous, long-term records of fundamental meteorological parameters, including air temperature, relative humidity, barometric pressure, and wind speed and direction in the vicinity of the Lenghu site.

Table 1.
Summary of meteorological datasets used in this study, including site coordinates, altitude, instruments, observation periods, and temporal resolution.
In recent years, three DZZ4-type automatic weather stations have been installed at elevations of 3311 m, 3790 m, and 4167 m on Saishiteng Mountain, designated as S3311, S3790, and S4167, respectively. These stations are situated at different altitudes, as indicated by the red markers in Figure 2. Black dots represent the locations of major observational platforms on Saishiteng Mountain, the white line denotes the road leading to the summit, and the background shows the topographic contour map (https://www.openstreetmap.org/, accessed on 20 June 2025) of the Lenghu site. The S3311 station is located at the base of the mountain, S3790 is positioned near Point X at mid-altitude, and S4167 is located adjacent to Point C. Table 1 summarizes the geographic coordinates and data acquisition details of the three stations. The data span from 2020 May to 2024 December and have a temporal resolution of 1 h. Through continuous and systematic monitoring of the vertical meteorological structure at the Lenghu site, these high-altitude automatic weather stations offer indispensable data for assessing astronomical observing conditions at different elevation points.
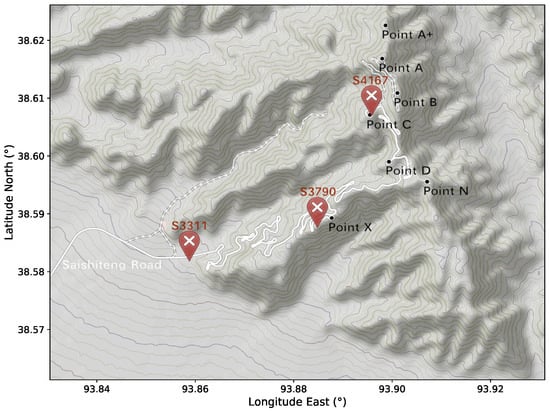
Figure 2.
Geographical distribution of three automatic weather stations (red markers) at different elevations on Saishiteng Mountain. Black dots indicate major observational platforms, the white line traces the summit road, and the background displays the topographic contour map of the Lenghu site.
2.2. Data and Quality Control
The three automatic weather stations at Lenghu, Mahai, and Dafengshan, together with the three stations on Saishiteng Mountain, constitute a multi-scale meteorological monitoring network that spans from a broader regional scope to local site-specific coverage. This network continuously observes five critical meteorological parameters, including air temperature, relative humidity, atmospheric pressure, wind speed, and wind direction. The measurement ranges and sensor specifications for each parameter are listed in Table 2. Specifically, air temperature is monitored over a range of −50 to 50 °C with a precision of 0.1 °C. Relative humidity is measured over the full range of 0–100% with an accuracy of ±1%. The atmospheric pressure sensors operate over a range of 500–1100 hPa with a resolution of 0.1 hPa. Wind speed is measured up to 60 m s−1 with a precision of m s−1, and wind direction is recorded over a full 360 range with an angular resolution of 1.
Table 2.
Summary of meteorological elements, sensor specifications, and the total amount of data collected by six weather stations.
Prior to conducting statistical analysis, we performed quality control on the raw datasets acquired from the six automatic weather stations, which involved the identification of outliers and the calculation of the total number of valid measurements. Based on the valid measurement ranges given in Table 2, any data points falling out of the ranges of these parameters were flagged as erroneous and subsequently excluded from further processing. We applied a joint filter to the wind data, keeping only physically plausible records of both speed and direction. This enhanced the measurements’ consistency and the dataset’s overall reliability. After applying these quality control procedures, the total number of valid observations for each parameter at all stations is summarized in the data column of Table 2.
We divided the meteorological data into two main categories for statistical analysis and discussion. The first consists of historical records from Lenghu, Mahai, and Dafengshan national meteorological stations located in the surrounding region of the Lenghu site, as shown in Figure 1. The second comprises recent years datasets collected from three automatic weather stations installed at different elevations along Saishiteng Mountain, as labeled in Figure 2. Following standard astronomical conventions, daytime is defined as the interval between the beginning of twilight and the ending of evening twilight, while the remaining hours are classified as nighttime.
3. Meteorological Conditions in the Lenghu Region
We analyzed the monthly averages of temperature, relative humidity, atmospheric pressure, and wind speed from January 2005 to September 2017 at the Lenghu, Mahai, and Dafengshan stations, as shown in Figure 3. All meteorological elements exhibit clear annual cycles, along with minor interannual variations. Seasonal variation is observed in temperature, while persistently low relative humidity throughout the year reflects the arid nature of the region. Although the absolute values of atmospheric pressure and wind speed vary slightly among the stations, their intra-annual and inter-annual variation patterns are generally consistent. Thanks to its persistent and stable meteorological conditions, the Lenghu region has developed a macroclimate environment suitable for astronomical observation.
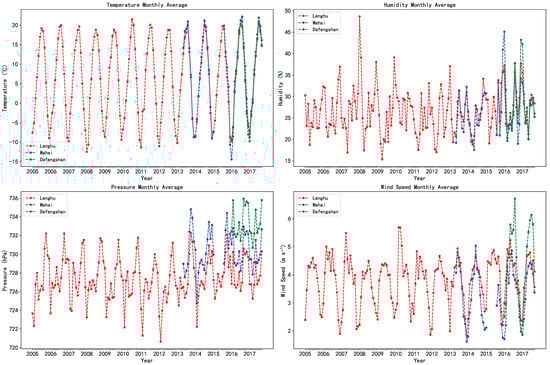
Figure 3.
Monthly mean values of temperature, relative humidity, and atmospheric pressure, and wind speed recorded at Lenghu, Mahai, and Dafengshan stations from January 2005 to September 2017.
3.1. Air Temperature
The temperature distributions reflect the combined effects of elevation, local topography, and radiative conditions. The observed temperature variations, particularly the pronounced nighttime cooling at the three stations, are consistent with the climatic characteristics of high-altitude arid regions, where rapid radiative heat loss after sunset is common. These diurnal contrasts are particularly relevant to astronomical site assessment, as stable, cooler nighttime conditions are typically associated with reduced atmospheric turbulence and improved seeing quality.
We further analyzed the monthly mean, median, maximum, and minimum daytime and nighttime air temperatures at the three meteorological stations in the Lenghu region, and the results are shown in Figure 4. They indicate that January is the coldest month, with the lowest mean temperatures and the occurrence of extreme low values, whereas July is the hottest, exhibiting the highest monthly averages and extreme maxima. The average diurnal temperature variation across all three stations remained consistently around 9 C throughout the year. When compared with other major astronomical observatories, this thermal stability is particularly noteworthy. Mauna Kea Observatory in Hawaii experiences approximately 10 C diurnal temperature variation [22], which is comparable to the Lenghu site. The consistent 9 C diurnal variation observed at Lenghu represents an optimal balance for astronomical observations—sufficient to prevent persistent ground-layer turbulence yet moderate enough to minimize thermal distortions in telescope structures. This consistency indicates that the Lenghu region is governed by a stable large-scale climatic regulation mechanism, with no significant atmospheric motions induced by local thermal disturbances.
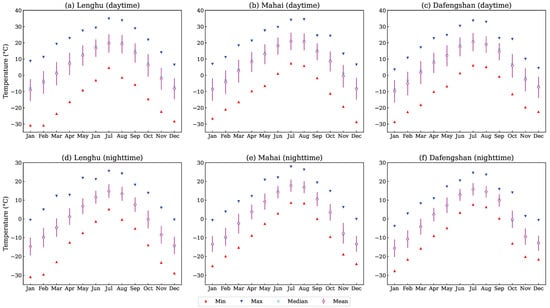
Figure 4.
Monthly variations of air temperature at Lenghu, Mahai, and Dafengshan stations during daytime (top) and nighttime (bottom).
3.2. Relative Humidity
Relative humidity reflects the amount of water vapor present in the air. High relative humidity increases the risk of moisture accumulation, which can degrade optical performance and compromise the long-term stability of astronomical instruments. Statistical analysis shows that at Lenghu Station, only 38 out of 111,359 recorded data points (approximately 0.03%) exceeded the 90% relative humidity threshold. Nighttime cases made up just 0.03%. At Mahai Station, 7 out of 30,185 measurements (around 0.02%) crossed this threshold, including 0.02% during nighttime. At Dafengshan Station, 5 out of 13,744 data points (roughly 0.04%) were above 90%, with 0% recorded at night. These results indicate that relative humidity exceeding the observational safety threshold is rare, implying that rainfall is infrequent in this region. These findings demonstrate that the Lenghu region is characterized by consistently low relative humidity, which supports stable observing conditions and minimizes the risk of humidity-related disruptions to astronomical operations.
We calculate the monthly mean, median, maximum, and minimum values of relative humidity. Figure 5 illustrates the monthly variations in relative humidity during daytime and nighttime based on statistical analyses. Both the mean and median values exhibit clear seasonal patterns, with elevated humidity levels from November to January and lower values from March to May and in October. In general, nighttime humidity is slightly higher than daytime. In most months, the mean nighttime relative humidity remains below 40%. Although maximum values occasionally exceed 90% in certain months, these high-humidity events are typically short-lived and thus exert limited impact on astronomical observations.
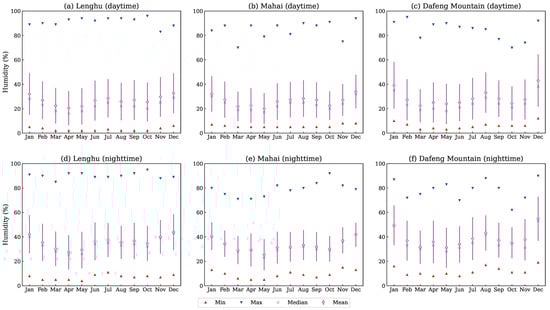
Figure 5.
Monthly variation of relative humidity at Lenghu, Mahai, and Dafengshan stations during daytime (top) and nighttime (bottom).
3.3. Barometric Pressure
Stable atmospheric pressure is generally associated with stable weather patterns, which are favorable for achieving good astronomical seeing. In addition, the relationship between atmospheric pressure and altitude can be used to estimate the water vapor content in the atmosphere, which is a key factor influencing transparency at infrared and millimeter wavelengths.
We calculate the monthly maximum, minimum, median, mean, and standard deviation of surface pressure during daytime and nighttime. The corresponding temporal variations are illustrated in Figure 6. The pressure trends are broadly consistent throughout the year, exhibiting only minor intermonthly variations. This indicates that the Lenghu region experiences a generally stable atmospheric pressure regime. Such stability also implies that other meteorological variables associated with pressure, such as temperature, wind speed, and weather conditions, are likely to remain relatively steady as well. In February, pressure variations reach their annual maximum, and Dafengshan Station shows a trend opposite to that of Lenghu and Mahai, which suggests enhanced regional meteorological activity during this period. In contrast, pressure values are most stable in August. Moreover, nighttime pressure tends to be more stable than daytime pressure, which indicates more favorable atmospheric conditions for astronomical observations during nighttime hours.
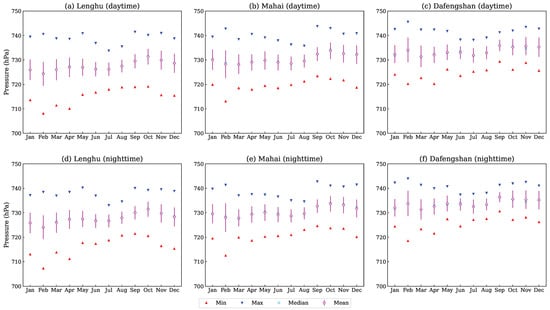
Figure 6.
Monthly statistics of air pressure at Lenghu, Mahai, and Dafengshan stations during daytime (top) and nighttime (bottom).
3.4. Wind Speed and Direction
As a direct driver of atmospheric stability, wind typically ranges from 4 to 10 m s−1 at most observatory sites around the world [5]. Higher wind speeds enhance atmospheric motion, thereby reducing overall stability. Near-surface wind directions that are influenced by local topography can generate turbulence, which directly impacts astronomical seeing [23]. In addition, excessively high wind speeds may indirectly increase the complexity and cost of dome structural design and construction. Nighttime wind speeds are generally lower and exhibit greater stability than during the daytime. A slight decrease in wind speed is observed from the outer Dafengshan station toward the more central Lenghu and Mahai stations. At Dafengshan, the median wind speed remains at 3 m s−1 for both day and night, whereas at Lenghu and Mahai, the median values decrease from 3 m s−1 during the day to 2 m s−1 at night. Across all stations, the occurrence of wind speeds exceeding the operational safety threshold for telescopes (commonly set at 15 m s−1) is extremely rare, with a rate of just 0.08% at the Lenghu station. Overall, the rarity of strong wind events during nighttime reflects the stable atmospheric dynamics of the Lenghu region and further underscores its advantageous conditions for astronomical observations.
Figure 7 presents the daily cycle of wind speed based on hourly mean and median values at the Lenghu, Mahai, and Dafengshan stations. The wind speed exhibits a pronounced and symmetric temporal pattern across all three stations. Wind speed begins to increase around 10:00 local time (UT = 2 h), peaks at approximately 20:00 (UT = 12 h) after sunset, and subsequently declines through the night. While the trends of wind speed are consistent among the stations, notable differences are observed in the peak speed and rates of speed change. At Dafengshan, the mean wind speed exceeds 7 m s−1, whereas it remains below 5 m s−1 at Mahai.
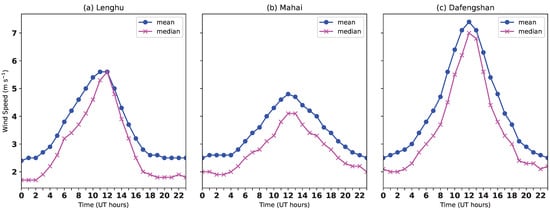
Figure 7.
Mean and median values of hourly wind speed at Lenghu, Mahai, and Dafengshan stations.
Figure 8 illustrates the monthly variation of nighttime wind speed at the Lenghu, Mahai, and Dafengshan stations. Each box in the plot represents the interquartile range from 25 to 75%, and the vertical lines extend from 1 to 99%. The diamonds and horizontal lines in each box indicate the mean and median wind speeds, respectively. The red horizontal line marks the upper operational threshold of 15 m s−1. Based on the conventional climatological classification, we define the cold season as November through February and the warm season as June through September. The calculated nighttime mean wind speeds are 3 m s−1 and 4 m s−1 for the cold and warm seasons at Lenghu Station, 2 m s−1 and 4 m s−1 at Mahai Station, and 2 m s−1 and 5 m s−1 at Dafengshan Station, respectively. These results indicate a clear annual cycle in wind speed across the Lenghu region, with generally higher wind speeds during the warm season than in the cold season.
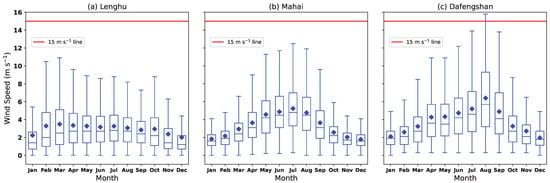
Figure 8.
Boxplot of monthly wind speed at Lenghu, Mahai, and Dafengshan stations during nighttime. Each box represents values in the range of 25 to 75% and vertical lines mark the values 1 to 99%. The diamonds and horizontal lines inside every box signify mean and median values, respectively. The red line represents the upper limit of 15 m s−1.
A wind rose reflects the frequency distribution of wind directions and the corresponding wind-speed characteristics in a specific region. Figure 9 presents the wind rose diagrams for daytime and nighttime at the three stations. It is evident that the wind directions at Lenghu and Dafengshan stations remain generally consistent throughout the day and night, whereas Mahai station exhibits a distinct shift in prevailing wind direction. At Lenghu station, winds predominantly originate from the northwest (NW). Dafengshan station is primarily influenced by winds from the north-northeast (NNE), with higher wind speeds than in other directions. Mahai experiences west-northwesterly (WNW) winds during the day, shifting to northeasterly (NE) at night. At all stations, wind speeds are primarily concentrated in the 2 to 6 m s−1 range, with gusts exceeding 8 m s−1 occurring from multiple directions.

Figure 9.
Wind rose density at Lenghu, Mahai, and Dafengshan stations during daytime (top) and nighttime (bottom).
4. Meteorological Conditions at the Lenghu Site
We conducted a statistical analysis of the monthly average temperature, relative humidity, atmospheric pressure, and wind speed at three elevations on Saishiteng Mountain, with the results presented in Figure 10. Temperature decreases gradually with altitude and exhibits distinct seasonal variations, with a gradual warming trend over the years. Relative humidity is slightly higher at higher altitudes, but remains low overall. Atmospheric pressure decreases clearly with increasing elevation, following a consistent trend. Wind speeds are slightly higher at the mid-elevation site compared to the summit and the foot of the mountain, but inter-annual variations are generally consistent. These key meteorological parameters from the base to the summit of Saishiteng Mountain demonstrate a well-defined vertical stratification and long-term stability, which support the site’s climatic suitability for high-quality astronomical observations.
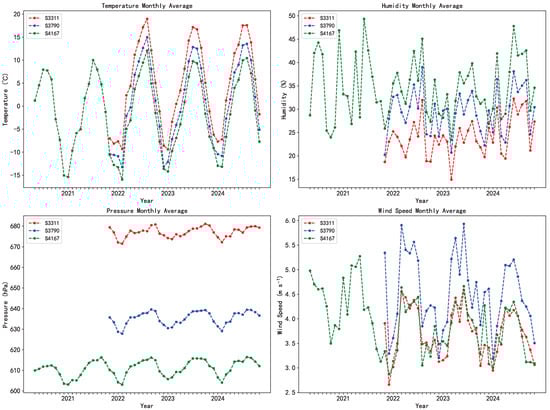
Figure 10.
Monthly average data chart of meteorological elements at S3311, S3790 and S4167.
4.1. Air Temperature
We performed a statistical analysis of daytime and nighttime temperatures at the three meteorological stations on Saishiteng Mountain, and the distribution characteristics are shown in Figure 11. At S3311 station, the average daytime temperature was 6.1 C with a median of 7.1 C, while the average nighttime temperature was 0.8 C with a median of 0.3 C. At S3790, the average daytime temperature was 2.2 °C and the median was 3 C, nighttime temperatures averaged −2.5 C with a median of −3.3 C. At S4167, the average daytime temperature was −0.4 C with a median of 0.8 °C, while the average nighttime temperature was −4.7 C with a median of −5.1 C. The statistical results reveal a decrease in temperature with increasing altitude, consistent with the typical atmospheric lapse rate.
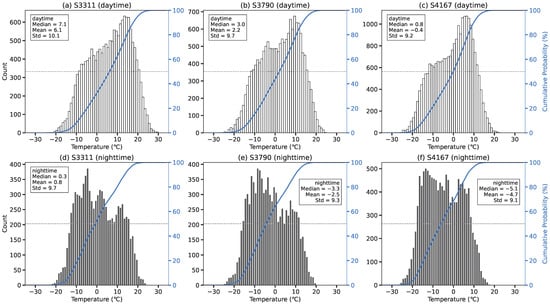
Figure 11.
Histograms and cumulative distributions of temperature at S3311, S3790, and S4167 during daytime (top) and nighttime (bottom). Solid blue line: cumulative probability; dashed gray line: 50% probability level.
The temporal variations of the monthly median, maximum, and minimum temperatures during daytime and nighttime are shown in Figure 12. All three elevations exhibit consistent seasonal patterns, with the lowest temperatures occurring in winter (December–February) and the highest in summer (June–August). January reaches the seasonal minimum at the summit, with average temperatures of −14.0 C during the day and −15.4 C at night, and corresponding standard deviations of 4.6 and 4.3 C. The highest temperature are recorded at the mountain base in August, where daytime and nighttime mean temperatures reach 17.6 and 15.5 C, respectively. The corresponding standard deviations, 4.3 and 3.5 C. Across all months and altitudes, the maximum, minimum, mean, and median temperatures show a consistent decline from the base to the summit during the daytime and nighttime.
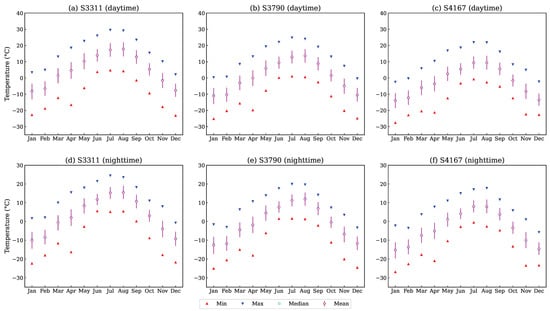
Figure 12.
Monthly statistics of air temperature at S3311, S3790, and S4167 during daytime (top) and nighttime (bottom).
The variation in nighttime temperature is a key indicator of atmospheric stability and directly influences both instrument performance and observational accuracy [24]. Accordingly, we analyzed the hourly fluctuations in nighttime temperature. The statistical results show that most hourly changes fall within 0–1 C, with more than 90% of the data at the mid-slope and summit stations lying in this range (Figure 13). The high nighttime temperature stability offers favorable conditions for astronomical observations at the Saishiteng Mountains.
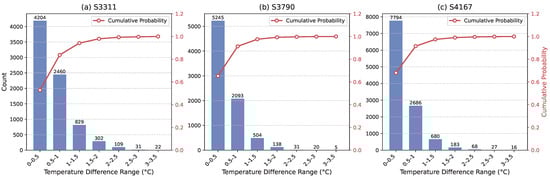
Figure 13.
Distributions and cumulative probabilities of nighttime hourly temperature difference intervals at S3311, S3790, and S4167.
4.2. Relative Humidity
Relative humidity and dew-point temperature are key meteorological parameters that must be considered in astronomical observations, as they determine the risk of water vapor condensation on the coldest parts of the telescope and its instruments. Such condensation can directly affect the operational stability of the equipment and the quality of astronomical imaging. When the relative humidity is high or the dew-point temperature approaches the ambient temperature, water vapor tends to condense, potentially damaging the instruments and even interrupting observations [25,26,27].
We statistically analyzed the overall characteristics of daytime and nighttime relative humidity, as well as the occurrence probability of high-humidity events. At S3311, a total of 25,454 data points were recorded, among which 43 instances (0.17%) exceeded the relative humidity 90% threshold. Notably, only 0.03% of the nighttime data surpassed this limit. At S3790, 131 of 25,600 measurements (0.51%) exceeded the threshold, of which only 0.2% occurred at night. At S4167, 358 out of 37,098 records (0.97%) exceeded the relative humidity threshold, with 0.39% occurring at night. These results indicate that high-humidity events are rare at the site, and their occurrence frequency increases slightly with elevation.
The daytime and nighttime distributions of relative humidity are represented by histograms and cumulative distributions in Figure 14. The median, mean, and standard deviation of relative humidity during both daytime and nighttime increase with elevation. For instance, the median relative humidity rises from 21% during the day to 23% at night. The corresponding values are 26% and 27% at S3790, while both daytime and nighttime medians reach 31% at S4167. Higher elevations thus exhibit greater humidity and larger statistical dispersion. The cumulative distribution curves further support this trend, showing a slower rise at higher altitudes, which indicates a larger fraction of samples at higher humidity levels. Moreover, the difference between daytime and nighttime relative humidity decreases with elevation.
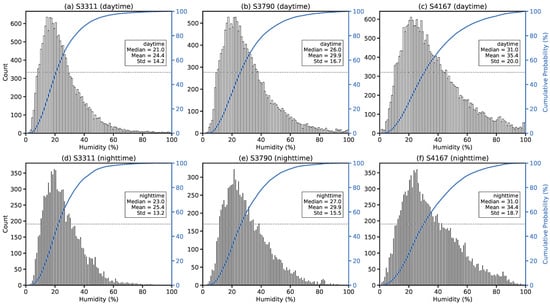
Figure 14.
The same as Figure 11 but for relative humidity.
The monthly variations in the mean, median, maximum, and minimum values of daytime and nighttime relative humidity are presented in Figure 15. All three stations show consistent interannual trends with clear seasonal fluctuations. High-humidity conditions typically occur from June to August, while lower values are observed in March and October. Nighttime humidity is consistently higher than daytime values. This behavior is consistent with standard meteorological expectations, as nocturnal cooling enhances water vapor condensation and thus increases relative humidity. Nighttime relative humidity typically remains below 40% in most months throughout the year. Although the maximum relative humidity exceeds 90% in some months, such conditions occur very infrequently. Throughout most of the year, nights generally remain dry and stable, with conditions suitable for astronomical observations prevailing overwhelmingly.
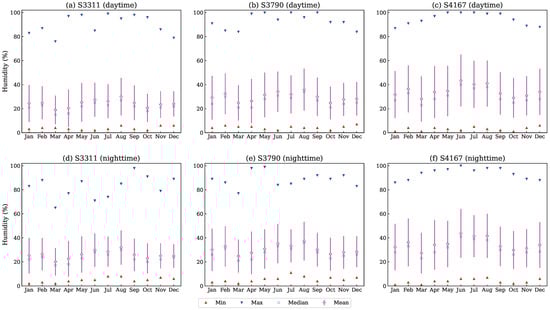
Figure 15.
Monthly statistics of relative humidity at S3311, S3790, and S4167 during daytime (top) and nighttime (bottom).
4.3. Barometric Pressure
We statistically analyzed the pressure distributions to investigate the pressure characteristics at different elevations on Saisheteng Mountain. Figure 16 presents the histograms and corresponding cumulative distribution curves of barometric pressure for daytime (top) and nighttime (bottom). The nighttime median pressures are 677.2 hPa, 635.4 hPa, and 611.1 hPa, respectively. Daytime pressures are about 1 hPa higher than nighttime values, and the standard deviations at the three sites range from 3.7 hPa to 5.0 hPa.
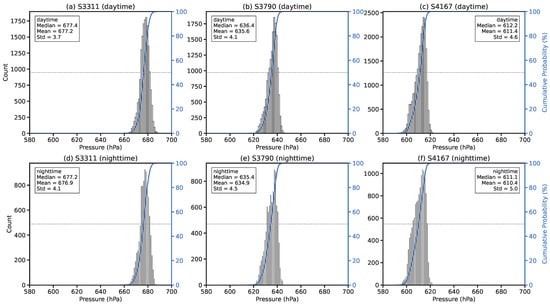
Figure 16.
The same as Figure 11 but for air pressure.
For high-precision astronomical instruments such as spectrometers and interferometers, understanding and correcting for variations in atmospheric pressure is essential for optimizing performance and ensuring data accuracy. Figure 17 shows the monthly maximum, minimum, median, and mean values of barometric pressure recorded during both daytime and nighttime. Surface pressure exhibits a clear decreasing trend with increasing elevation and reflects the thinner air at higher altitudes. The three stations recorded a similar monthly variation patterns, with surface pressure typically reaching its annual minimum in February and peaking in September or October. Under the combined influence of large-scale atmospheric circulation and thermal structure, barometric pressure tends to be lower in winter and higher in summer and early autumn. The seasonal and altitude-dependent variations in barometric pressure affect atmospheric density stratification, refractive index, stability, and transparency, thereby influencing astronomical observations.
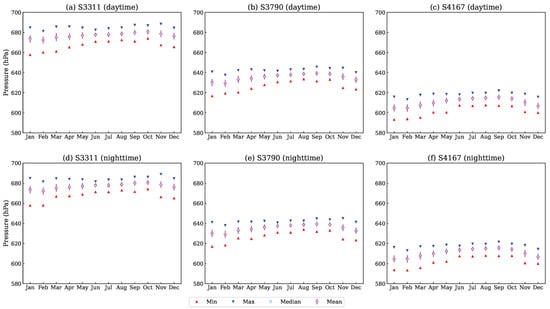
Figure 17.
Monthly statistics of air pressure at S3311, S3790, and S4167 during daytime (top) and nighttime (bottom).
4.4. Wind Speed and Direction
The strength and direction of the surface winds define the airflow conditions that affect turbulence in the ground layer [28]. Low wind speed and a steady wind direction reflect stable atmospheric flow, which is beneficial for conducting astronomical observations.
We plot the histograms and cumulative distribution curves of daytime and nighttime wind speeds in Figure 18. Statistical results indicate that nighttime wind speeds are slightly lower than those during the day, with a median value of about 3 m s−1, which helps to maintain good nighttime seeing conditions. As elevation increases, the mean and median wind speeds increase to a peak at station S3790 before declining at S4167. Extreme wind events exceeding 15 m s−1 are rare and have only been recorded at S3790, likely due to localized strong airflow generated by the valley topography in this area. The recorded maximum nighttime wind speeds are 14.9 m s−1, 23.8 m s−1, and 21 m s−1 at S3311, S3790, and S4167, respectively. This indicates that strong winds must be accounted for during telescope construction and operation, and protective measures are particularly important at mid-mountain sites.
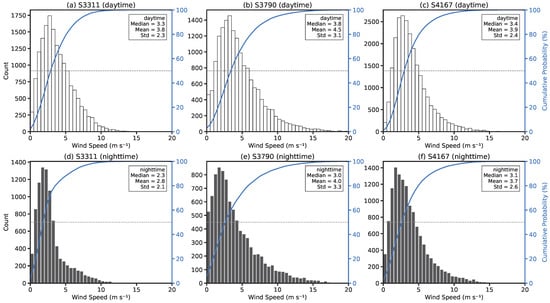
Figure 18.
The same as Figure 11 but for wind speed.
The hourly variations of mean and median wind speeds are shown in Figure 19. Wind speeds begin to increase at approximately 09:00, 10:00, and 11:00 local time at the low-, mid-, and high-altitude stations, respectively. The daily maximum mean wind speed remains below 5.5 m s−1 at all sites, while the median wind speed consistently stays under 4.5 m s−1. After sunset, the wind speed begins to decrease gradually and stabilizes within the range of 2–4 m s−1 from midnight until early morning, which is favorable for nighttime astronomical observations.
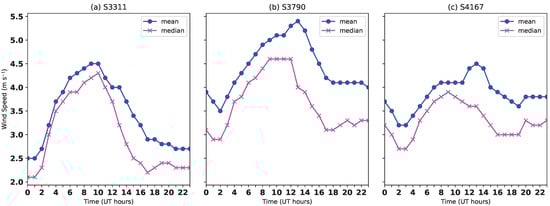
Figure 19.
Mean and median values of hourly wind speed at S3311, S3790, and S4167.
Figure 20 shows the monthly boxplots of nighttime wind speed for the three stations. Wind speeds increase and exhibit enhanced variability from May to July, and a marked difference between the mean and median values suggests the influence of intermittent gusts. At S3790, the average nighttime wind speed reaches 6.3 m s−1 in June, with several data points exceeding the threshold 15 m s−1. In contrast, S4167 and S3311 generally experience lower wind speeds with less variability, and the median wind speeds remain below 3 m s−1 for most of the year. Nighttime wind speeds exhibit a pronounced seasonal variation, with lower values in autumn and winter than in other seasons. This indicates that during seasons with longer nights, the observing conditions are more stable and data acquisition efficiency is improved.
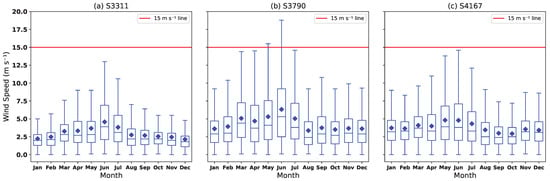
Figure 20.
Boxplot of monthly wind speed at S3311, S3790, and S4167 during nighttime. Each box represents values in the range of 25 to 75% and vertical lines mark the values 1 to 99%. The diamonds and horizontal lines inside every box signify mean and median values, respectively. The red line represents the upper limit of 15 m s−1.
The frequency of wind directions and their corresponding wind speed intensities for the three stations are illustrated in the wind rose diagrams (Figure 21). The results indicate that both wind speed and wind direction exhibit distinct variations with elevation and between daytime and nighttime. During the daytime, winds predominantly originate from the south (S) and north (N) at S3311. With increasing altitude, they transition to northwesterly (NW) and southeasterly (SE) directions at S3790, and become predominantly southwesterly (SW) at S4167. Wind directions become more stable at night. S3311 is dominated by east-northeasterly (ENE) and northeasterly (NE) winds, S3790 consistently records stronger northwesterly (NW) winds, and S4167 is dominated by westerly (W) winds. Atmospheric turbulence is generally weak on the windward side of a mountain. Considering the topography in Figure 2 and the wind direction at S4167, a telescope is expected to achieve optimal seeing on the western side of Saishiteng Mountain.
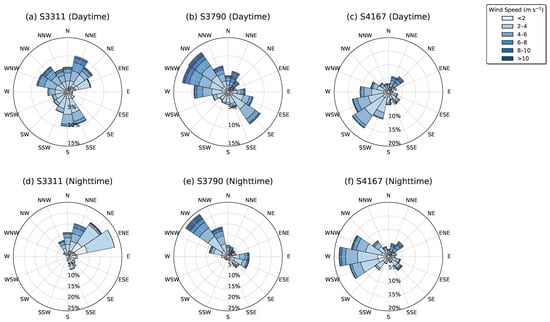
Figure 21.
Wind rose density at S3311, S3790, and S4167 during daytime (top) and nighttime (bottom).
5. Discussion
Based on a systematic analysis of long-term and recent meteorological data from six weather stations in the Lenghu region, we find that key meteorological parameters (temperature, relative humidity, atmospheric pressure, wind speed, and wind direction) exhibit clear spatial, seasonal, and diurnal variations. These variations are primarily driven by the combined influences of regional climate, elevation, and local topography. The importance of accounting for elevation and local microclimatic characteristics should be emphasized in site evaluation and telescope operation planning.
- The temperature characteristics of the three meteorological stations on Saishiteng Mountain are generally consistent with those of the surrounding lower-altitude stations at Lenghu, Mahai, and Dafengshan, reflecting a coherent regional temperature pattern. All stations exhibit clear seasonal variations, with January being the coldest month and July–August the warmest, indicating that temperatures in this region are primarily controlled by large-scale climate systems. These findings are consistent with temperature trends derived from atmospheric reanalysis datasets [12]. The annual average diurnal temperature range is approximately 9 C at Lenghu, whereas the Saishiteng Mountain stations exhibit ranges below 5 C, demonstrating a more stable thermal regime. Seasonal amplitude, diurnal variation, and interannual variability are highly consistent among the foot, mid-slope, and summit stations, further suggesting that the region is governed by a stable and extensive macroclimate system [6,29]. The cross-station consistency also confirms that the temperature behavior on Saishiteng Mountain is not an isolated local effect but part of a spatially coherent regional climate feature. The detailed monthly temperature statistics for all stations (including monthly averages, extremes, and standard deviations) are presented in Table A1 and Table A2 of Appendix A.Within this context of regional consistency, the three stations on Saishiteng Mountain show a clear vertical temperature structure: temperature decreases with elevation, drops rapidly after sunset, and remains highly stable throughout the night at all altitudes. At the summit S4167 station, 90% of the hourly nighttime temperature variations fall within 0–1 C. Such thermal stability is crucial for astronomical observations, as smaller nocturnal temperature gradients help suppress near-ground turbulence, thereby improving atmospheric seeing and reducing the thermal load on telescope structures and domes. The relatively small diurnal temperature range at high altitudes also facilitates rapid thermal equilibrium of telescope structures and domes, mitigating dome seeing effects and enhancing the performance of adaptive optics systems.
- The analysis of relative humidity across the six meteorological stations in the Lenghu region reveals consistently arid conditions with only infrequent occurrences of high-humidity events that could pose risks to astronomical operations. The frequency of relative humidity exceeding the 90% operational threshold is extremely low, generally below 1%, indicating that rainfall and condensation hazards are minimal. High-altitude stations such as S4167 recorded slightly higher median humidity levels and greater variability than low sites such as Lenghu station and S3311, which reflects a clear elevation dependence. This pattern likely reflects the combined influence of orographic lifting and lower air temperatures at higher elevations, which increase relative humidity despite the overall dryness of the region. With respect to diurnal variability, nighttime humidity is slightly higher than daytime values at all stations except S4167. The comprehensive monthly humidity statistics for all stations are provided in Table A3 and Table A4 of Appendix B.We note that the monthly variations of relative humidity at the three stations in the Lenghu region differ from those recorded at the three stations on Saishiteng Mountain. The trends at the Lenghu stations generally agree with those reported by [20]. Nighttime relative humidity is relatively high from November to January, reaches its minimum between March and May, and attains a maximum in December. However, nighttime relative humidity reaches the maximum in August at S3311 and S3790, and in June at S4167 on Saishiteng Mountain. Even during the wettest months, nighttime relative humidity generally remains below 40%.The dew point is defined as the temperature at which air becomes saturated with water vapor and condensation begins. Since the instrument temperatures are typically a few degrees lower than air temperatures, 2 °C was set as the difference of dew-point temperatures from the ambient values [30,31]. We calculated the nighttime dew-point temperature () at three stations based on ambient temperature (T) and relative humidity () [32], as expressed by the following equations:where is the relative humidity, and , °C are empirical constants. The results are shown in Figure 22, where the red line indicates the 2 °C lower limit. The figure shows that air remains relatively dry throughout the year, with a very low risk of moisture condensation. The difference between the air temperature and the dew point temperature decreases with increasing altitude, suggesting that higher-altitude areas are relatively more humid, though still far from saturation. Seasonal variations are relatively minor compared with the pronounced effect of altitude. Most whiskers extend below the red 2 °C line at S4167, indicating that this high-altitude region occasionally reaches near-saturation conditions and a potential for condensation to occur.
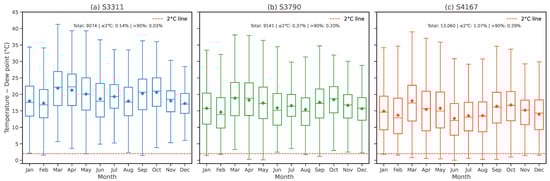 Figure 22. Box plot of monthly differences between nighttime temperature and dew point temperature at S3311, S3790, and S4167, where each box represents values in the 25% to 75% range, the vertical lines mark values in the 1% to 99% range, the diamonds and horizontal lines inside each box indicate the mean and median, respectively, and the red line corresponds to the upper limit of .Analysis reveals that S4167 experiences the highest frequency of near-saturation conditions ( °C) as well as the greatest probability of high relative humidity, presenting a delicate trade-off with its otherwise excellent atmospheric transparency. Winter observations at this elevation require particular attention to temperature and humidity control, whereas summer generally offers more favorable humidity conditions. In summary, while taking advantage of the superior transparency at Saishiteng’s high-altitude sites, observational strategies should be carefully tailored to the seasonal characteristics of relative humidity to ensure optimal performance.Based on a systematic analysis of long-term precipitation observation data from the Saishiteng Mountain region, this study reveals that the site exhibits superior arid climatic conditions comparable to internationally renowned astronomical observatories. The mean annual precipitation ranges from 2.02 mm to 3.57 mm across different altitude stations. The precipitation probability is as low as 1.27–2.03%, indicating that observational conditions are unaffected by precipitation for over 98% of the year. As shown in Figure 23, the average precipitation intensity is low (0.32–0.84 mm h−1) and exhibits a distinct seasonal distribution. Notably, the almost absence of precipitation during the winter months (November to February) provides excellent observational windows for optical and infrared astronomy.
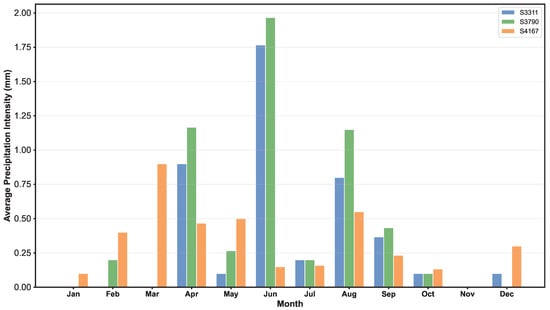 Figure 23. Monthly variation of average precipitation intensity at different altitude stations on Saishiteng Mountain. The bars represent the mean precipitation intensity (calculated only for hours with measurable precipitation) across the three stations (S3311, S3790, and S4167) from 2020 to 2024. The observed seasonal pattern shows minimal precipitation during winter months, with slightly higher intensities occurring between April and September.
 - The monthly mean atmospheric pressure trends across all meteorological stations are highly consistent in the Lenghu region, with the smallest variability observed in August and the largest in February. Diurnal pressure fluctuations remain minimal at all stations. Air pressure decreases with increasing elevation and exhibits a slight rise in variability on the Saishiteng Mountain surface, which reflects the progressively thinner atmosphere at higher altitudes. Nighttime values are generally about 1 hPa lower than daytime and the standard deviation ranges from 3.7 to 4.2 hPa. The seasonal variation of atmospheric pressure is characterized by minimum values in winter and maximum values from late summer to early autumn. The Lenghu region is characterized by a stable atmospheric pressure field, well-defined seasonal patterns, and clear altitudinal gradients, which together provide favorable and predictable meteorological conditions for astronomical observations and contribute to the relative steadiness of other pressure-related variables such as temperature, wind speed, and general weather conditions. The complete set of monthly atmospheric pressure statistics, including the distribution of nighttime low-pressure events, is available in Table A5–Table A7 of Appendix C.Unstable weather may occur when the observed pressure falls below the theoretical expectation [33]. We assessed nighttime weather instability based on the dominance of low-pressure conditions in the barometric data. Theoretical pressures were calculated for each data point and compared with observations to determine the monthly frequency of unstable conditions. The theoretical pressure values were calculated using Formula (3) from the U.S. Standard Atmosphere model [30]:where is the standard sea-level atmospheric pressure, and () is the standard sea-level temperature, h denotes the site’s elevation in meters.Figure 24 displays the monthly percentage of measured pressures falling below the theoretical values for each station, which serves as a proxy for estimating the frequency of unstable weather conditions. The percentage remains below 10% for most months of the year at the low-elevation stations (Lenghu, Mahai, and Dafengshan) in the Lenghu region, suggesting a highly stable climatic environment. During winter and spring, the proportion of low-pressure dominance increases at Saishiteng Mountain stations. Specifically, the percentages reached 65.74% for station S3311, 87.17% for station S3790, and 33.08% for station S4167 in February. In contrast, this proportion typically remains below 5% during autumn. The consistently low incidence of low-pressure dominance indicates an exceptionally stable atmospheric environment at S4167, which is conducive to obtaining high-quality astronomical data.
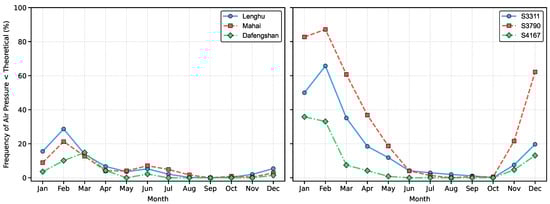 Figure 24. Monthly percentage of low-pressure occurrence and its implications for weather stability across monitoring stations at nighttime.
 - The wind speed characteristics at the six meteorological stations in the Lenghu region display spatial, seasonal, and diurnal variability driven by the combined influence of elevation and local topography. Wind speeds are predominantly concentrated in the 2 to 4 m s−1 range. The calmer and more stable wind conditions are especially advantageous for nighttime astronomical observations, which can help disperse near-surface heat layers, reduce turbulence caused by ground heating, and thus further enhance the stability of the lower atmosphere [34]. Seasonal characteristics indicate that wind speeds are systematically higher in summer than in winter, reflecting stronger atmospheric turbulence during the warm season. The low-elevation stations (Lenghu, Mahai, and S3311) are characterized by low nighttime wind speeds and minimal variability. The high-altitude station S4167 generally experiences moderate winds, although it is occasionally affected by gusts during the summer. Extreme wind events are uncommon at most stations, while the mid-altitude station S3790 records the highest wind speeds, occasionally exceeding 15 m s−1, likely due to terrain-induced acceleration through the surrounding valleys. Such localized strong-wind events require careful consideration in the design of telescope domes and site infrastructure. The detailed monthly wind speed statistics for all stations are compiled in Table A8 and Table A9 of Appendix D.The diurnal variations of hourly mean and median wind speeds show a generally consistent pattern in the area surrounding the Lenghu site, with peaks occurring at 20:00 local time. In contrast, the three stations on Saishiteng Mountain exhibit different trends in mean and median wind speeds, and the variations in the mean and median values also differ across stations. At S3311, the highest mean wind speed occurs at 18:00 local time, while at the mountain sites, the peak appears at 21:00 local time. These localized differences in wind speed are difficult to capture in single-station monitoring conducted in previous site assessments.The wind directions across the six meteorological stations in the Lenghu region reveals pronounced spatial and temporal variability modulated by both elevation and diurnal cycles. Low-elevation sites, such as Lenghu and Dafengshan, are more frequently influenced by northerly components, with Dafengshan exhibiting a stronger association between high wind speeds and the north-northeast (NNE) sector. In contrast, Mahai demonstrates a consistent diurnal wind shift from west-northwesterly (WNW) during the day to westerly (W) at night. At S3311, the wind direction is evenly distributed except for a lower frequency from the east-southeast (ESE) during the day, whereas it tends to concentrate in the east-northeast (ENE) and northeast (NE) directions at night. S3790 is primarily influenced by northwesterly (NW) winds, while S4167 experiences predominantly southwesterly (SW) winds during the day and westerly (W) winds at night. These patterns suggest that local topographic effects, superimposed on large-scale atmospheric circulation [6], play a substantial role in shaping the prevailing wind directions.
6. Conclusions
This study presents the first multi-year, multi-station, cross-elevation meteorological assessment of the Lenghu region, providing a comprehensive characterization of its atmospheric environment. The results reveal coherent spatial, seasonal, and diurnal patterns across temperature, humidity, pressure, and wind, demonstrating an exceptionally stable and predictable climate suitable for astronomical observations. These distinctions provide new insight into local turbulence conditions and performance. These distinctions provide new insight into local turbulence conditions and performance.
These findings have direct implications for telescope deployment on the Saishiteng Mountain platforms, where altitude-dependent meteorological characteristics must be considered in design and operation. The multi-station evidence presented here not only reinforces the site’s suitability for optical, infrared, and submillimeter observations but also provides a robust meteorological basis for long-term planning and infrastructure design. We are conducting systematic meteorological monitoring at Point B of the Lenghu site to refine the climatic characterization of the region and to provide essential atmospheric reference data for the siting, structural design, and operational planning of future large telescopes.
Author Contributions
Conceptualization, K.W., A.R., and L.D.; methodology, K.W. and A.R.; formal analysis, W.L. and J.M. (Jing Ma); investigation, W.L. and J.M. (Jing Ma); data curation, F.Y., J.M. (Jifang Ma), W.X., and X.Z.; writing—original draft preparation, W.L.; writing—review and editing, A.R. and K.W.; visualization, W.L.; supervision, K.W. and A.R.; project administration, K.W. and L.D.; funding acquisition, K.W. All authors have read and agreed to the published version of the manuscript.
Funding
This work was supported by the Ministry of Science and Technology of China (Grant No. 2023FY101104) and the National Natural Science Foundation of China (Grant Nos. 12373035, 12233009). This work is also supported by the China Manned Space Program with grant no. CMS-CSST-2025-A13.
Institutional Review Board Statement
Not applicable.
Informed Consent Statement
Not applicable.
Data Availability Statement
The data that support the findings of this study are available from the corresponding author upon reasonable request.
Acknowledgments
We are grateful to the Haixi Meteorological Administration for providing essential meteorological data that supported this research.
Conflicts of Interest
The authors declare no conflicts of interest.
Appendix A. Temperature Tables
This is the final compendium of all the numerical temperature statistical results (Table A1 and Table A2).
Table A1.
Monthly statistics on daytime and nighttime air temperature data at Lenghu (LS), Mahai (MS), and Dafengshan (DS) stations.
Table A1.
Monthly statistics on daytime and nighttime air temperature data at Lenghu (LS), Mahai (MS), and Dafengshan (DS) stations.
| Month | Min | Max | Mean | Median | Std | ||||||||||
|---|---|---|---|---|---|---|---|---|---|---|---|---|---|---|---|
| LS | MS | DS | LS | MS | DS | LS | MS | DS | LS | MS | DS | LS | MS | DS | |
| Daytime Data | |||||||||||||||
| Jan | −30.8 | −26.6 | −28.7 | 8.8 | 7.0 | 3.6 | −9.1 | −8.8 | −9.8 | −8.0 | −8.2 | −8.7 | 6.7 | 6.8 | 6.9 |
| Feb | −30.8 | −21.0 | −22.6 | 11.3 | 11.2 | 10.8 | −4.4 | −4.2 | −5.1 | −3.4 | −3.2 | −3.3 | 6.9 | 7.3 | 7.2 |
| Mar | −23.7 | −16.5 | −18.2 | 19.3 | 18.4 | 17.2 | 1.0 | 2.6 | 1.6 | 1.8 | 3.5 | 2.6 | 7.1 | 7.0 | 7.1 |
| Apr | −16.4 | −9.7 | −10.1 | 22.9 | 21.3 | 22.8 | 7.1 | 8.2 | 7.7 | 7.9 | 9.0 | 8.6 | 6.8 | 6.1 | 6.2 |
| May | −9.2 | −6.5 | −6.8 | 27.5 | 27.6 | 24.8 | 12.1 | 13.0 | 12.0 | 13.0 | 13.7 | 12.4 | 6.3 | 6.1 | 6.4 |
| Jun | −3.1 | 1.0 | 1.3 | 29.3 | 29.7 | 30.4 | 16.7 | 18.0 | 17.5 | 17.5 | 18.4 | 18.3 | 5.4 | 5.2 | 5.8 |
| Jul | 4.6 | 7.3 | 6.1 | 34.9 | 34.1 | 33.7 | 19.6 | 20.9 | 20.5 | 20.0 | 21.0 | 20.9 | 5.6 | 5.3 | 5.6 |
| Aug | −1.4 | 5.8 | 5.1 | 33.8 | 34.5 | 32.9 | 19.2 | 20.6 | 18.9 | 20.0 | 21.0 | 19.2 | 5.7 | 5.1 | 5.1 |
| Sep | −5.8 | −1.7 | −0.8 | 28.9 | 24.5 | 22.9 | 13.7 | 14.5 | 14.6 | 14.8 | 15.3 | 15.8 | 5.8 | 5.1 | 5.3 |
| Oct | −14.6 | −11.3 | −11.6 | 21.9 | 24.3 | 22.3 | 6.1 | 8.5 | 5.8 | 7.2 | 9.1 | 6.8 | 6.9 | 6.1 | 7.3 |
| Nov | −22.4 | −19.3 | −19.7 | 14.1 | 13.3 | 10.1 | −2.1 | −0.5 | −2.7 | −1.3 | 1.1 | −1.6 | 6.8 | 6.9 | 7.1 |
| Dec | −28.3 | −28.7 | −22.5 | 6.5 | 6.6 | 4.5 | −8.3 | −8.3 | −7.4 | −7.4 | −8.1 | −6.8 | 6.4 | 6.6 | 6.5 |
| Nighttime Data | |||||||||||||||
| Jan | −0.5 | −0.7 | −3.8 | −30.9 | −25.1 | −27.7 | −14.7 | −13.3 | −15.6 | −14.7 | −13.5 | −15.6 | 4.8 | 4.3 | 4.7 |
| Feb | 5.0 | 3.9 | 2.9 | −29.6 | −19.9 | −21.7 | −9.9 | −9.6 | −10.8 | −9.5 | −10.1 | −10.7 | 5.1 | 4.8 | 4.6 |
| Mar | 12.3 | 9.4 | 8.3 | −23.0 | −15.3 | −15.8 | −4.6 | −2.5 | −4.1 | −4.6 | −2.3 | −4.1 | 4.9 | 5.2 | 4.2 |
| Apr | 12.8 | 12.2 | 11.0 | −12.6 | −8.9 | −9.1 | 1.3 | 3.7 | 2.3 | 1.3 | 3.8 | 2.6 | 4.5 | 3.9 | 3.6 |
| May | 21.9 | 20.9 | 17.3 | −7.5 | −2.6 | −4.9 | 6.8 | 9.3 | 7.3 | 6.8 | 9.2 | 7.2 | 4.1 | 4.2 | 4.1 |
| Jun | 21.2 | 22.1 | 20.5 | −1.4 | 2.9 | 3.3 | 11.6 | 14.3 | 12.8 | 11.6 | 14.6 | 13.3 | 3.4 | 3.3 | 3.2 |
| Jul | 25.6 | 27.9 | 24.6 | 5.1 | 8.6 | 7.6 | 14.8 | 17.8 | 15.8 | 14.8 | 17.9 | 15.8 | 3.6 | 3.2 | 3.3 |
| Aug | 24.2 | 26.3 | 23.6 | −0.4 | 8.3 | 6.3 | 13.4 | 16.9 | 14.5 | 13.5 | 16.9 | 14.5 | 3.7 | 3.1 | 3.1 |
| Sep | 18.2 | 19.4 | 15.9 | −5.2 | 0 | 0.2 | 7.7 | 10.5 | 9.9 | 7.6 | 10.8 | 10.3 | 3.8 | 3.7 | 3.3 |
| Oct | 13.9 | 14.9 | 14.1 | −14.0 | −9.6 | −13.1 | −0.3 | 3.6 | −0.2 | −0.2 | 3.4 | −0.7 | 4.7 | 4.3 | 4.6 |
| Nov | 6.0 | 6.3 | 1.5 | −23.3 | −18.9 | −20.2 | −8.5 | −7.6 | −9.4 | −8.3 | −8.3 | −9.4 | 4.7 | 5.5 | 4.4 |
| Dec | −0.4 | 0 | −0.6 | −28.9 | −24.0 | −21.6 | −14.1 | −13.2 | −12.9 | −14.4 | −13.5 | −12.7 | 4.6 | 4.2 | 4.0 |
Table A2.
Monthly statistics on daytime and nighttime air temperature data at S3311, S3790 and S4167 stations.
Table A2.
Monthly statistics on daytime and nighttime air temperature data at S3311, S3790 and S4167 stations.
| Month | Min | Max | Mean | Median | Std | ||||||||||
|---|---|---|---|---|---|---|---|---|---|---|---|---|---|---|---|
| S3311 | S3790 | S4167 | S3311 | S3790 | S4167 | S3311 | S3790 | S4167 | S3311 | S3790 | S4167 | S3311 | S3790 | S4167 | |
| Daytime Data | |||||||||||||||
| Jan | −22.8 | −25.2 | −27.6 | 3.5 | 0.4 | −2.4 | −8.3 | −11.1 | −14.0 | −7.9 | −10.8 | −13.8 | 4.8 | 5.0 | 4.6 |
| Feb | −18.9 | −20.3 | −22.9 | 5.0 | 0.8 | −0.3 | −6.5 | −10.7 | −12.2 | −6.5 | −10.3 | −12.2 | 4.4 | 4.4 | 4.5 |
| Mar | −12.3 | −15.7 | −20.5 | 13.2 | 8.6 | 5.9 | 1.4 | −3.0 | −6.0 | 1.6 | −3.0 | −6.0 | 4.6 | 4.4 | 4.5 |
| Apr | −16.6 | −19.8 | −21.3 | 18.6 | 13.3 | 10.5 | 4.6 | 0 | −3.5 | 4.8 | 0 | −3.7 | 5.1 | 4.8 | 4.7 |
| May | −6.2 | −7.8 | −12.5 | 22.8 | 19.4 | 16.9 | 10.3 | 6.0 | 2.6 | 10.3 | 5.9 | 2.5 | 4.9 | 4.8 | 4.4 |
| Jun | 3.7 | 0.1 | −3.3 | 26.1 | 22.2 | 18.7 | 13.9 | 9.5 | 5.6 | 13.8 | 9.3 | 5.4 | 3.8 | 3.7 | 3.6 |
| Jul | 4.7 | 1.0 | −0.8 | 29.6 | 24.9 | 22.0 | 17.3 | 12.9 | 9.4 | 17.3 | 12.8 | 9.3 | 4.2 | 3.9 | 3.8 |
| Aug | 4.2 | 0.5 | −2.7 | 29.2 | 24.1 | 21.9 | 17.6 | 13.6 | 9.4 | 17.9 | 13.6 | 9.4 | 4.3 | 4.2 | 4.2 |
| Sep | −12.5 | −2.6 | −5.3 | 23.5 | 19.2 | 16.2 | 12.9 | 8.8 | 5.6 | 13.1 | 8.9 | 5.6 | 4.2 | 4.1 | 3.8 |
| Oct | −19.4 | −11.3 | −12.5 | 15.5 | 13.2 | 8.4 | 5.3 | 1.5 | −1.6 | 5.4 | 1.6 | −1.5 | 3.8 | 3.6 | 3.7 |
| Nov | −20.8 | −20.2 | −22.4 | 10.2 | 7.4 | 5.0 | −1.6 | −5.1 | −8.2 | −1.3 | −4.8 | −8.3 | 4.6 | 4.6 | 4.7 |
| Dec | −23.2 | −24.9 | −22.7 | 2.2 | −0.3 | −2.2 | −7.6 | −10.3 | −13.3 | −7.6 | −10.6 | −13.7 | 4.0 | 4.1 | 3.7 |
| Nighttime Data | |||||||||||||||
| Jan | −22.4 | −25.1 | −26.9 | 1.7 | −1.6 | −2.2 | −10.1 | −12.8 | −15.4 | −9.7 | −12.15 | −15.2 | 4.5 | 4.5 | 4.3 |
| Feb | −18.1 | −20.6 | −22.7 | 2.1 | −3.0 | −3.5 | −8.3 | −11.7 | −13.6 | −8.5 | −11.9 | −13.9 | 3.8 | 3.9 | 4.0 |
| Mar | −11.7 | −15.1 | −17.8 | 10.0 | 6.4 | 3.8 | −0.7 | −4.5 | −7.4 | −0.6 | −4.4 | −7.5 | 4.0 | 3.9 | 4.0 |
| Apr | −16.4 | −18.2 | −21.0 | 15.5 | 10.7 | 7.8 | 2.0 | −1.8 | −5.0 | 2.1 | −2.0 | −5.2 | 4.4 | 4.4 | 4.3 |
| May | −2.8 | −6.2 | −10.5 | 18.0 | 13.9 | 11.1 | 8.3 | 4.4 | 1.0 | 8.6 | 4.6 | 1.3 | 4.1 | 4.0 | 3.8 |
| Jun | 5.5 | 1.4 | −2.9 | 21.5 | 17.7 | 15.0 | 11.7 | 7.7 | 4.1 | 11.6 | 7.5 | 4.1 | 3.0 | 3.0 | 2.8 |
| Jul | 5.1 | 1.5 | −0.6 | 24.5 | 20.0 | 17.1 | 15.4 | 11.3 | 8.1 | 15.3 | 11.25 | 7.9 | 3.2 | 3.1 | 3.2 |
| Aug | 5.4 | 1.2 | −2.7 | 23.6 | 19.7 | 17.8 | 15.5 | 11.9 | 8.0 | 15.6 | 12.1 | 7.7 | 3.5 | 3.5 | 3.7 |
| Sep | 0.1 | −2.2 | −4.8 | 18.3 | 14.2 | 11.7 | 10.6 | 6.8 | 3.9 | 10.8 | 7.1 | 3.7 | 3.6 | 3.5 | 3.3 |
| Oct | −18.9 | −11.2 | −13.4 | 11.1 | 7.4 | 5.9 | 3.0 | −0.5 | −3.4 | 3 | −0.4 | −3.5 | 3.1 | 3 | 3.2 |
| Nov | −17.9 | −20.1 | −23.5 | 8.0 | 3.5 | 1.1 | −4.1 | −7.0 | −10.0 | −3.9 | −6.65 | −10.2 | 4.4 | 4.2 | 4.3 |
| Dec | −21.8 | −24.6 | −23.4 | −0.7 | −3.3 | −5.7 | −9.2 | −11.7 | −14.5 | −9.3 | −11.8 | −14.9 | 3.7 | 3.6 | 3.3 |
Appendix B. Relative Humidity Tables
This is the final compendium of all the numerical relative humidity statistical results (Table A3 and Table A4).
Table A3.
Monthly statistics on daytime and nighttime relative humidity data at Lenghu (LS), Mahai (MS), and Dafengshan (DS) stations.
Table A3.
Monthly statistics on daytime and nighttime relative humidity data at Lenghu (LS), Mahai (MS), and Dafengshan (DS) stations.
| Month | Min | Max | Mean | Median | Std | ||||||||||
|---|---|---|---|---|---|---|---|---|---|---|---|---|---|---|---|
| LS | MS | DS | LS | MS | DS | LS | MS | DS | LS | MS | DS | LS | MS | DS | |
| Daytime Data | |||||||||||||||
| Jan | 5.0 | 7.0 | 10.0 | 89.0 | 84.0 | 91.0 | 32.0 | 30.0 | 35.0 | 28.0 | 32.1 | 39.1 | 17.0 | 14.6 | 19.2 |
| Feb | 4.0 | 6.0 | 7.0 | 90.0 | 88.0 | 95.0 | 26.9 | 25.0 | 23.0 | 23.0 | 27.4 | 27.3 | 15.4 | 14.7 | 16.8 |
| Mar | 2.0 | 5.0 | 3.0 | 89.0 | 70.0 | 78.0 | 22.5 | 19.0 | 19.0 | 18.0 | 21.8 | 22.4 | 14.6 | 12.1 | 13.5 |
| Apr | 2.0 | 5.0 | 4.0 | 93.0 | 88.0 | 89.0 | 20.5 | 19.0 | 20.0 | 16.0 | 22.6 | 25.1 | 13.9 | 14.3 | 16.4 |
| May | 2.0 | 5.0 | 3.0 | 94.0 | 79.0 | 90.0 | 22.0 | 17.0 | 18.0 | 18.0 | 20.2 | 23.9 | 14.9 | 12.7 | 16.6 |
| Jun | 2.0 | 5.0 | 4.0 | 92.0 | 88.0 | 87.0 | 26.6 | 22.0 | 21.0 | 22.0 | 25.9 | 25.0 | 16.4 | 15.0 | 15.2 |
| Jul | 3.0 | 5.0 | 5.0 | 94.0 | 81.0 | 86.0 | 28.5 | 25.0 | 24.0 | 25.0 | 27.4 | 28.1 | 15.6 | 14.5 | 17.0 |
| Aug | 2.0 | 5.0 | 7.0 | 94.0 | 90.0 | 85.0 | 25.9 | 25.0 | 29.0 | 22.0 | 28.3 | 33.2 | 15.4 | 15.0 | 16.6 |
| Sep | 2.0 | 5.0 | 6.0 | 93.0 | 88.0 | 77.0 | 27.1 | 23.0 | 24.0 | 22.0 | 27.1 | 28.2 | 16.3 | 14.6 | 15.0 |
| Oct | 2.0 | 5.0 | 6.0 | 96.0 | 91.0 | 70.0 | 25.5 | 20.0 | 21.0 | 20.0 | 22.5 | 24.3 | 15.9 | 11.7 | 13.9 |
| Nov | 4.0 | 8.0 | 6.0 | 83.0 | 75.0 | 74.0 | 29.7 | 24.0 | 24.0 | 25.0 | 27.2 | 27.6 | 16.2 | 12.9 | 16.4 |
| Dec | 6.0 | 8.0 | 12.0 | 88.0 | 94.0 | 92.0 | 32.7 | 32.0 | 38.0 | 29.0 | 34.1 | 43.0 | 16.4 | 13.8 | 21.5 |
| Nighttime Data | |||||||||||||||
| Jan | 8.0 | 13.0 | 16.0 | 91.0 | 80.0 | 87.0 | 42.2 | 40.0 | 49.0 | 40.0 | 40.6 | 49.5 | 15.6 | 11.3 | 16.3 |
| Feb | 5.0 | 10.0 | 9.0 | 90.0 | 75.0 | 72.0 | 35.4 | 34.0 | 33.0 | 33.0 | 34.4 | 36.9 | 15.3 | 10.7 | 16.3 |
| Mar | 5.0 | 6.0 | 10.0 | 85.0 | 71.0 | 75.0 | 30.3 | 28.0 | 30.0 | 28.0 | 29.1 | 31.5 | 14.0 | 11.4 | 13.5 |
| Apr | 5.0 | 5.0 | 8.0 | 92.0 | 71.0 | 80.0 | 27.4 | 29.0 | 33.0 | 25.0 | 29.3 | 35.9 | 13.9 | 13.4 | 17.4 |
| May | 4.0 | 5.0 | 10.0 | 92.0 | 73.0 | 83.0 | 29.3 | 23.0 | 28.0 | 26.0 | 25.4 | 31.1 | 14.9 | 12.7 | 16.4 |
| Jun | 9.0 | 8.0 | 8.0 | 89.0 | 82.0 | 70.0 | 36.3 | 29.0 | 31.0 | 34.0 | 31.2 | 33.8 | 15.4 | 13.0 | 15.0 |
| Jul | 11.0 | 11.0 | 11.0 | 89.0 | 78.0 | 80.0 | 37.4 | 31.0 | 35.0 | 35.0 | 31.9 | 38.6 | 13.8 | 12.1 | 17.5 |
| Aug | 8.0 | 9.0 | 17.0 | 90.0 | 80.0 | 88.0 | 35.5 | 32.0 | 42.0 | 33.0 | 33.3 | 43.3 | 13.5 | 12.3 | 14.4 |
| Sep | 7.0 | 7.0 | 14.0 | 92.0 | 84.0 | 80.0 | 36.6 | 30.0 | 33.0 | 34.0 | 32.0 | 37.3 | 14.9 | 12.0 | 14.3 |
| Oct | 8.0 | 9.0 | 11.0 | 95.0 | 92.0 | 62.0 | 34.7 | 29.0 | 34.5 | 32.0 | 30.3 | 35.2 | 14.2 | 10.5 | 12.7 |
| Nov | 7.0 | 15.0 | 11.0 | 88.0 | 82.0 | 72.0 | 40.0 | 36.0 | 31.0 | 39.0 | 37.2 | 37.7 | 13.7 | 10.4 | 17.0 |
| Dec | 9.0 | 13.0 | 19.0 | 89.0 | 79.0 | 90.0 | 43.9 | 42.0 | 53.0 | 43.0 | 41.7 | 54.9 | 14.8 | 9.8 | 18.1 |
Table A4.
Monthly statistics on daytime and nighttime relative humidity data at S3311, S3790, and S4167 stations.
Table A4.
Monthly statistics on daytime and nighttime relative humidity data at S3311, S3790, and S4167 stations.
| Month | Min | Max | Mean | Median | Std | ||||||||||
|---|---|---|---|---|---|---|---|---|---|---|---|---|---|---|---|
| S3311 | S3790 | S4167 | S3311 | S3790 | S4167 | S3311 | S3790 | S4167 | S3311 | S3790 | S4167 | S3311 | S3790 | S4167 | |
| Daytime Data | |||||||||||||||
| Jan | 3.0 | 4.0 | 1.0 | 83.0 | 91.0 | 87.0 | 24.3 | 29.1 | 31.8 | 21.0 | 24.0 | 27.0 | 15.4 | 18.2 | 19.5 |
| Feb | 4.0 | 6.0 | 4.0 | 87.0 | 85.0 | 91.0 | 24.9 | 32.4 | 36.4 | 23.0 | 30.0 | 33.0 | 13.7 | 16.9 | 19.6 |
| Mar | 4.0 | 5.0 | 1.0 | 76.0 | 84.0 | 93.0 | 19.0 | 24.8 | 28.1 | 15.0 | 21.0 | 23.0 | 11.9 | 14.7 | 18.8 |
| Apr | 3.0 | 5.0 | 4.0 | 97.0 | 99.0 | 97.0 | 20.4 | 26.4 | 33.7 | 16.0 | 21.0 | 28.0 | 15.5 | 18.4 | 21.7 |
| May | 2.0 | 3.0 | 3.0 | 98.0 | 100.0 | 100.0 | 25.3 | 31.5 | 34.7 | 22.0 | 28.0 | 31.0 | 16.1 | 18.6 | 20.9 |
| Jun | 2.0 | 2.0 | 2.0 | 85.0 | 94.0 | 100.0 | 27.4 | 34.2 | 43.5 | 25.0 | 31.0 | 40.0 | 14.1 | 16.7 | 21.6 |
| Jul | 3.0 | 5.0 | 5.0 | 99.0 | 100.0 | 100.0 | 26.2 | 31.9 | 40.3 | 23.0 | 29.0 | 37.0 | 14.1 | 15.8 | 19.5 |
| Aug | 6.0 | 4.0 | 3.0 | 95.0 | 96.0 | 99.0 | 30.0 | 35.9 | 41.0 | 27.0 | 34.0 | 38.0 | 15.6 | 17.4 | 19.1 |
| Sep | 3.0 | 4.0 | 2.0 | 98.0 | 100.0 | 99.0 | 24.9 | 29.9 | 32.7 | 22.0 | 27.0 | 28.0 | 14.5 | 16.0 | 17.6 |
| Oct | 2.0 | 2.0 | 1.0 | 96.0 | 92.0 | 94.0 | 20.7 | 24.7 | 29.0 | 18.0 | 21.0 | 25.0 | 11.8 | 13.6 | 16.5 |
| Nov | 6.0 | 5.0 | 4.0 | 86.0 | 92.0 | 89.0 | 23.5 | 27.7 | 30.8 | 21.0 | 24.0 | 27.0 | 11.0 | 13.7 | 16.3 |
| Dec | 6.0 | 7.0 | 6.0 | 79.0 | 84.0 | 88.0 | 24.0 | 28.2 | 34.0 | 22.0 | 25.0 | 28.0 | 10.5 | 14.0 | 19.2 |
| Nighttime Data | |||||||||||||||
| Jan | 2.0 | 3.0 | 1.0 | 83.0 | 89.0 | 86.0 | 25.2 | 30.0 | 32.3 | 22.0 | 26.0 | 28.0 | 14.7 | 17.6 | 19.3 |
| Feb | 3.0 | 4.0 | 3.0 | 88.0 | 86.0 | 88.0 | 26.3 | 32.8 | 36.2 | 24.0 | 31.0 | 33.0 | 13.4 | 16.7 | 19.9 |
| Mar | 2.0 | 2.0 | 1.0 | 65.0 | 77.0 | 94.0 | 20.1 | 24.8 | 27.3 | 17.0 | 21.0 | 23.0 | 11.4 | 13.7 | 16.9 |
| Apr | 4.0 | 4.0 | 4.0 | 77.0 | 98.0 | 96.0 | 22.6 | 27.6 | 34.2 | 18.0 | 22.0 | 28.0 | 14.8 | 17.7 | 20.7 |
| May | 5.0 | 6.0 | 4.0 | 87.0 | 99.0 | 97.0 | 26.2 | 30.7 | 34.9 | 23.0 | 28.0 | 32.0 | 15.0 | 16.4 | 19.2 |
| Jun | 5.0 | 6.0 | 6.0 | 71.0 | 84.0 | 100.0 | 29.8 | 35.2 | 43.7 | 28.0 | 33.0 | 41.0 | 13.9 | 16.3 | 20.4 |
| Jul | 8.0 | 11.0 | 6.0 | 74.0 | 85.0 | 96.0 | 28.5 | 33.4 | 41.4 | 26.0 | 31.0 | 39.0 | 12.5 | 13.7 | 17.4 |
| Aug | 8.0 | 8.0 | 7.0 | 85.0 | 89.0 | 98.0 | 31.9 | 37.2 | 41.6 | 30.0 | 36.0 | 38.0 | 14.3 | 16.0 | 18.3 |
| Sep | 4.0 | 4.0 | 3.0 | 98.0 | 92.0 | 98.0 | 25.8 | 30.2 | 32.9 | 22.0 | 28.0 | 30.0 | 13.5 | 13.9 | 16.4 |
| Oct | 5.0 | 7.0 | 2.0 | 91.0 | 89.0 | 93.0 | 22.9 | 26.4 | 29.8 | 20.0 | 23.0 | 26.0 | 12.4 | 13.7 | 15.8 |
| Nov | 7.0 | 5.0 | 3.0 | 79.0 | 92.0 | 89.0 | 25.0 | 27.9 | 31.3 | 22.0 | 25.0 | 28.0 | 10.4 | 13.7 | 15.8 |
| Dec | 6.0 | 7.0 | 6.0 | 89.0 | 83.0 | 88.0 | 24.9 | 28.4 | 34.0 | 24.0 | 26.0 | 28.5 | 9.8 | 12.8 | 19.1 |
Appendix C. Air Pressure Tables
This is the final compendium of all the numerical air pressure statistical results (Table A5–Table A7).
Table A5.
Monthly statistics on daytime and nighttime air pressure data at Lenghu (LS), Mahai (MS), and Dafengshan (DS) stations.
Table A5.
Monthly statistics on daytime and nighttime air pressure data at Lenghu (LS), Mahai (MS), and Dafengshan (DS) stations.
| Month | Min | Max | Mean | Median | Std | ||||||||||
|---|---|---|---|---|---|---|---|---|---|---|---|---|---|---|---|
| LS | MS | DS | LS | MS | DS | LS | MS | DS | LS | MS | DS | LS | MS | DS | |
| Daytime Data | |||||||||||||||
| Jan | 713.6 | 719.9 | 724.0 | 739.5 | 739.5 | 742.6 | 726.0 | 730.1 | 732.4 | 725.9 | 730.2 | 731.8 | 4.2 | 4.1 | 3.7 |
| Feb | 708.1 | 713.1 | 720.2 | 740.6 | 742.8 | 745.6 | 724.3 | 728.2 | 734.1 | 724.4 | 728.7 | 733.9 | 4.9 | 5.6 | 5.1 |
| Mar | 711.4 | 718.5 | 722.6 | 738.8 | 738.5 | 742.4 | 726.0 | 728.3 | 731.5 | 726.0 | 728.7 | 731.2 | 4.3 | 4.0 | 4.4 |
| Apr | 710.1 | 717.9 | 720.2 | 738.6 | 740.6 | 742.4 | 727.0 | 729.0 | 732.1 | 727.2 | 729.2 | 732.3 | 4.0 | 3.3 | 3.3 |
| May | 715.8 | 719.4 | 726.1 | 740.9 | 739.2 | 741.8 | 727.0 | 729.8 | 733.1 | 727.0 | 729.8 | 732.9 | 3.5 | 3.7 | 3.2 |
| Jun | 716.7 | 718.5 | 723.5 | 736.9 | 738.0 | 738.3 | 726.2 | 728.9 | 733.0 | 726.3 | 729.3 | 733.4 | 2.9 | 3.2 | 2.5 |
| Jul | 717.9 | 719.8 | 725.2 | 733.8 | 736.3 | 738.2 | 726.2 | 728.6 | 731.9 | 726.2 | 728.5 | 731.8 | 2.7 | 2.8 | 3.0 |
| Aug | 718.8 | 721.2 | 725.8 | 735.5 | 735.8 | 739.1 | 727.5 | 729.5 | 732.9 | 727.5 | 729.6 | 732.9 | 2.6 | 2.6 | 2.6 |
| Sep | 718.9 | 723.4 | 729.3 | 741.5 | 743.8 | 741.3 | 729.5 | 732.4 | 735.9 | 729.5 | 732.4 | 735.9 | 2.9 | 2.8 | 2.3 |
| Oct | 719.1 | 722.3 | 726.0 | 740.2 | 743.0 | 742.0 | 731.3 | 733.7 | 735.2 | 731.5 | 734.1 | 735.4 | 3.2 | 3.4 | 3.3 |
| Nov | 715.6 | 721.7 | 728.8 | 741.0 | 740.7 | 743.5 | 729.9 | 732.6 | 735.7 | 729.9 | 732.6 | 734.7 | 3.8 | 3.6 | 3.7 |
| Dec | 715.4 | 718.7 | 725.6 | 738.8 | 740.9 | 742.8 | 728.6 | 732.2 | 735.2 | 728.7 | 732.3 | 735.3 | 3.9 | 3.8 | 3.9 |
| Nighttime Data | |||||||||||||||
| Jan | 713.0 | 719.5 | 724.4 | 737.2 | 739.8 | 742.3 | 725.8 | 729.6 | 732.1 | 725.8 | 729.5 | 731.7 | 4.2 | 3.9 | 3.6 |
| Feb | 707.3 | 712.5 | 718.5 | 738.5 | 741.4 | 744.0 | 724.1 | 728.0 | 733.8 | 724.0 | 728.4 | 733.7 | 4.8 | 5.9 | 5.2 |
| Mar | 713.8 | 719.9 | 723.3 | 737.0 | 737.1 | 741.4 | 726.0 | 727.9 | 731.4 | 726.2 | 727.6 | 731.3 | 4.1 | 3.4 | 4.1 |
| Apr | 711.1 | 718.6 | 721.5 | 738.5 | 737.6 | 740.0 | 727.3 | 729.3 | 732.5 | 727.4 | 729.5 | 732.9 | 3.8 | 3.3 | 3.3 |
| May | 717.7 | 720.2 | 727.4 | 740.3 | 737.4 | 740.8 | 727.5 | 730.1 | 733.8 | 727.4 | 730.4 | 733.3 | 3.3 | 3.4 | 3.2 |
| Jun | 717.3 | 720.5 | 724.5 | 737.0 | 736.6 | 737.4 | 726.6 | 729.2 | 733.4 | 726.8 | 729.7 | 733.9 | 2.8 | 3.1 | 2.5 |
| Jul | 718.7 | 720.9 | 727.1 | 733.1 | 735.1 | 737.7 | 726.7 | 728.7 | 732.5 | 726.7 | 728.6 | 732.6 | 2.6 | 2.6 | 2.9 |
| Aug | 720.7 | 723.0 | 727.5 | 734.6 | 734.6 | 738.1 | 727.9 | 729.8 | 733.4 | 727.9 | 729.6 | 733.3 | 2.5 | 2.5 | 2.4 |
| Sep | 721.4 | 724.6 | 730.6 | 740.1 | 742.8 | 741.4 | 730.0 | 732.7 | 736.4 | 730.1 | 732.7 | 736.4 | 2.7 | 2.7 | 2.1 |
| Oct | 720.5 | 723.7 | 727.1 | 739.3 | 741.1 | 742.0 | 731.4 | 733.6 | 735.6 | 731.6 | 733.9 | 735.5 | 3.1 | 3.2 | 3.5 |
| Nov | 716.4 | 723.5 | 728.1 | 739.6 | 740.7 | 742.6 | 729.8 | 733.1 | 735.4 | 729.7 | 733.4 | 734.4 | 3.7 | 3.4 | 3.8 |
| Dec | 715.3 | 720.1 | 726.2 | 738.9 | 741.5 | 741.1 | 728.3 | 731.7 | 735.2 | 728.5 | 732.1 | 735.2 | 3.8 | 3.6 | 3.8 |
Table A6.
Monthly statistics on daytime and nighttime air pressure data at S3311, S3790, and S4167 stations.
Table A6.
Monthly statistics on daytime and nighttime air pressure data at S3311, S3790, and S4167 stations.
| Month | Min | Max | Mean | Median | Std | ||||||||||
|---|---|---|---|---|---|---|---|---|---|---|---|---|---|---|---|
| S3311 | S3790 | S4167 | S3311 | S3790 | S4167 | S3311 | S3790 | S4167 | S3311 | S3790 | S4167 | S3311 | S3790 | S4167 | |
| Daytime Data | |||||||||||||||
| Jan | 657.7 | 616.6 | 593.2 | 684.9 | 641.0 | 616.0 | 673.6 | 630.2 | 604.9 | 674.1 | 630.6 | 604.7 | 3.6 | 3.5 | 3.4 |
| Feb | 660.1 | 619.3 | 593.8 | 681.4 | 637.8 | 613.4 | 672.5 | 629.3 | 604.7 | 672.4 | 629.3 | 604.9 | 3.7 | 3.7 | 3.7 |
| Mar | 661.1 | 620.3 | 595.1 | 685.7 | 642.4 | 617.8 | 675.3 | 633.2 | 607.8 | 675.0 | 632.8 | 607.5 | 4.0 | 3.5 | 3.7 |
| Apr | 665.2 | 624.0 | 600.4 | 685.9 | 643.2 | 618.9 | 675.9 | 634.2 | 609.7 | 675.8 | 634.2 | 609.8 | 3.6 | 3.2 | 3.4 |
| May | 667.9 | 627.7 | 600.4 | 684.7 | 642.2 | 618.6 | 677.0 | 636.1 | 612.1 | 677.2 | 636.4 | 612.3 | 3.1 | 3.0 | 3.0 |
| Jun | 670.8 | 630.6 | 607.3 | 682.6 | 641.7 | 618.3 | 677.6 | 637.1 | 613.3 | 677.9 | 637.4 | 613.7 | 2.2 | 2.0 | 2.2 |
| Jul | 671.1 | 631.4 | 606.9 | 684.0 | 643.2 | 619.9 | 677.8 | 637.8 | 614.3 | 677.7 | 637.8 | 614.5 | 2.5 | 2.2 | 2.4 |
| Aug | 672.5 | 633.5 | 607.6 | 684.9 | 643.6 | 619.9 | 678.6 | 638.7 | 614.9 | 678.6 | 638.7 | 615.0 | 2.3 | 1.9 | 2.3 |
| Sep | 671.1 | 631.4 | 607.0 | 687.4 | 645.8 | 622.2 | 680.0 | 639.3 | 615.5 | 680.1 | 639.4 | 615.6 | 2.6 | 2.3 | 2.5 |
| Oct | 673.9 | 633.1 | 606.7 | 687.0 | 644.4 | 620.0 | 680.6 | 638.8 | 614.0 | 680.8 | 638.9 | 614.1 | 2.5 | 2.2 | 2.4 |
| Nov | 667.3 | 624.8 | 600.8 | 688.6 | 644.7 | 618.9 | 678.7 | 636.0 | 610.1 | 678.7 | 635.9 | 610.6 | 3.4 | 3.2 | 3.4 |
| Dec | 665.5 | 623.4 | 600.0 | 684.6 | 640.3 | 615.9 | 676.4 | 632.9 | 606.9 | 676.2 | 632.6 | 606.8 | 3.3 | 3.1 | 3.1 |
| Nighttime Data | |||||||||||||||
| Jan | 657.7 | 616.8 | 593.5 | 685.0 | 641.2 | 616.3 | 673.3 | 629.9 | 604.7 | 673.8 | 630.0 | 604.4 | 3.5 | 3.5 | 3.4 |
| Feb | 657.9 | 618.1 | 593.3 | 681.6 | 638.1 | 613.1 | 672.0 | 629.0 | 604.6 | 672.0 | 628.8 | 604.8 | 3.9 | 3.8 | 3.8 |
| Mar | 666.7 | 625.2 | 595.7 | 684.7 | 641.7 | 617.1 | 675.3 | 633.0 | 607.7 | 674.9 | 632.7 | 607.7 | 3.9 | 3.4 | 3.6 |
| Apr | 667.2 | 624.6 | 600.9 | 684.1 | 641.6 | 617.4 | 676.1 | 634.2 | 609.7 | 675.7 | 634.2 | 609.9 | 3.4 | 3.1 | 3.3 |
| May | 668.7 | 628.1 | 601.9 | 683.7 | 642.4 | 618.7 | 677.0 | 636.1 | 612.2 | 677.3 | 636.4 | 612.3 | 3.1 | 2.9 | 2.9 |
| Jun | 671.2 | 630.8 | 607.3 | 681.7 | 640.7 | 617.6 | 677.8 | 637.2 | 613.4 | 678.1 | 637.6 | 613.8 | 2.1 | 2.0 | 2.1 |
| Jul | 671.2 | 630.9 | 607.1 | 683.5 | 642.7 | 619.7 | 677.9 | 637.9 | 614.4 | 677.7 | 638.0 | 614.6 | 2.4 | 2.1 | 2.3 |
| Aug | 672.9 | 633.7 | 607.8 | 683.6 | 642.7 | 619.5 | 678.8 | 638.8 | 615.0 | 678.6 | 638.6 | 615.2 | 2.2 | 1.9 | 2.2 |
| Sep | 671.4 | 631.7 | 607.5 | 686.3 | 644.8 | 621.6 | 680.0 | 639.3 | 615.5 | 680.1 | 639.4 | 615.6 | 2.6 | 2.3 | 2.5 |
| Oct | 674.0 | 632.9 | 607.6 | 686.2 | 643.9 | 619.7 | 680.6 | 638.8 | 614.0 | 680.7 | 638.8 | 614.1 | 2.4 | 2.1 | 2.3 |
| Nov | 666.2 | 624.2 | 600.4 | 689.0 | 645.1 | 618.3 | 678.5 | 635.7 | 609.9 | 678.4 | 635.7 | 610.3 | 3.4 | 3.3 | 3.4 |
| Dec | 665.0 | 623.1 | 599.8 | 684.8 | 641.4 | 614.5 | 676.2 | 632.8 | 606.8 | 675.9 | 632.3 | 606.7 | 3.3 | 3.0 | 3.1 |
Table A7.
Monthly distribution of nighttime hours with air pressure below theoretical value (in parentheses) at each station (%).
Table A7.
Monthly distribution of nighttime hours with air pressure below theoretical value (in parentheses) at each station (%).
| Month | Lenghu Region | Saishiteng Mountain | ||||
|---|---|---|---|---|---|---|
| LS | MS | DS | S3311 | S3790 | S4167 | |
| (721.70 hPa) | (724.21 hPa) | (726.67 hPa) | (673.79 hPa) | (633.45 hPa) | (603.10 hPa) | |
| Jan | 15.51 | 8.88 | 3.58 | 50.00 | 82.75 | 35.81 |
| Feb | 28.68 | 21.26 | 10.09 | 65.74 | 87.17 | 33.08 |
| Mar | 13.87 | 12.68 | 14.81 | 35.12 | 60.74 | 7.42 |
| Apr | 6.65 | 4.08 | 4.28 | 18.46 | 36.82 | 4.20 |
| May | 3.56 | 4.04 | 0 | 11.85 | 18.67 | 0.85 |
| Jun | 5.24 | 7.06 | 2.13 | 4.14 | 4.03 | 0 |
| Jul | 2.10 | 4.88 | 0 | 2.94 | 1.37 | 0 |
| Aug | 0.21 | 1.68 | 0 | 1.93 | 0 | 0 |
| Sep | 0.03 | 0 | 0 | 1.12 | 0.68 | 0 |
| Oct | 0.30 | 0.89 | 0 | 0 | 0.54 | 0 |
| Nov | 1.99 | 0.42 | 0 | 7.53 | 21.58 | 4.67 |
| Dec | 5.41 | 2.83 | 1.43 | 19.66 | 62.18 | 13.10 |
Appendix D. Wind Speed Tables
This is the final compendium of all the numerical wind speed statistical results (Table A8 and Table A9).
Table A8.
Monthly statistics on daytime and nighttime wind speed data at Lenghu (LS), Mahai (MS), and Dafengshan (DS) stations.
Table A8.
Monthly statistics on daytime and nighttime wind speed data at Lenghu (LS), Mahai (MS), and Dafengshan (DS) stations.
| Month | Max | Mean | Median | Std | ||||||||
|---|---|---|---|---|---|---|---|---|---|---|---|---|
| LS | MS | DS | LS | MS | DS | LS | MS | DS | LS | MS | DS | |
| Daytime Data | ||||||||||||
| Jan | 17.9 | 11.1 | 13.6 | 2.5 | 1.9 | 2.4 | 1.7 | 1.6 | 1.9 | 2.6 | 1.4 | 2.1 |
| Feb | 18.9 | 12.8 | 14.3 | 3.6 | 2.5 | 3.0 | 2.5 | 1.8 | 2.2 | 3.3 | 2.0 | 2.6 |
| Mar | 19.3 | 15.3 | 17.4 | 4.4 | 3.5 | 4.2 | 3.4 | 2.5 | 3.0 | 3.5 | 2.7 | 3.4 |
| Apr | 20.1 | 19.8 | 18.7 | 4.5 | 3.9 | 4.9 | 3.7 | 3.0 | 3.9 | 3.4 | 2.8 | 3.8 |
| May | 20.9 | 18.6 | 21.7 | 4.6 | 4.3 | 5.7 | 3.9 | 3.5 | 4.9 | 3.3 | 2.9 | 4.0 |
| Jun | 21.5 | 16.3 | 18.7 | 4.5 | 4.8 | 5.7 | 3.9 | 4.2 | 4.7 | 2.9 | 3.0 | 3.9 |
| Jul | 17.7 | 14.6 | 19.8 | 4.4 | 4.3 | 5.9 | 3.9 | 3.4 | 4.7 | 2.8 | 2.8 | 4.1 |
| Aug | 17.2 | 13.7 | 21.8 | 4.2 | 4.0 | 6.3 | 3.7 | 3.2 | 4.5 | 2.8 | 2.6 | 4.7 |
| Sep | 18.6 | 17.8 | 17.7 | 3.9 | 3.5 | 4.5 | 3.3 | 2.8 | 3.4 | 2.7 | 2.4 | 3.5 |
| Oct | 16.9 | 15.5 | 14.3 | 3.5 | 2.9 | 3.4 | 2.7 | 2.2 | 2.5 | 3.0 | 2.3 | 2.9 |
| Nov | 18.8 | 11.5 | 15.4 | 2.8 | 2.4 | 2.9 | 1.9 | 1.9 | 2.1 | 2.9 | 1.8 | 2.7 |
| Dec | 16.6 | 15.6 | 10.4 | 2.4 | 1.9 | 1.9 | 1.5 | 1.5 | 1.6 | 2.7 | 1.5 | 1.5 |
| Nighttime Data | ||||||||||||
| Jan | 16.4 | 10.6 | 7.1 | 2.2 | 1.8 | 2.1 | 1.4 | 1.6 | 1.9 | 2.5 | 1.1 | 1.3 |
| Feb | 18.4 | 11.5 | 14.2 | 3.3 | 2.2 | 2.6 | 2.0 | 1.9 | 2.1 | 3.2 | 1.5 | 2.0 |
| Mar | 16.1 | 10.8 | 12.3 | 3.5 | 2.9 | 3.2 | 2.5 | 2.4 | 2.7 | 3.0 | 2.0 | 2.3 |
| Apr | 16.8 | 16.1 | 17.4 | 3.3 | 3.6 | 4.3 | 2.7 | 3.1 | 3.6 | 2.6 | 2.3 | 2.9 |
| May | 15.3 | 16.7 | 16.5 | 3.3 | 4.6 | 4.3 | 2.7 | 4.2 | 3.5 | 2.5 | 2.6 | 2.9 |
| Jun | 12.9 | 14.1 | 14.0 | 3.2 | 4.9 | 4.7 | 2.7 | 4.5 | 4.2 | 2.3 | 2.5 | 3.0 |
| Jul | 12.8 | 13.9 | 15.0 | 3.3 | 5.2 | 5.2 | 2.8 | 4.8 | 4.6 | 2.2 | 2.6 | 3.3 |
| Aug | 14.7 | 15.9 | 15.8 | 3.1 | 4.8 | 6.4 | 2.7 | 4.5 | 5.7 | 2.1 | 2.4 | 3.8 |
| Sep | 17.2 | 13.9 | 14.4 | 2.8 | 3.6 | 4.9 | 2.4 | 3.0 | 4.1 | 2.0 | 2.3 | 3.3 |
| Oct | 17.6 | 12.9 | 13.0 | 2.9 | 2.6 | 3.3 | 2.2 | 2.2 | 2.7 | 2.5 | 1.7 | 2.3 |
| Nov | 15.8 | 11.4 | 10.7 | 2.4 | 2.0 | 2.7 | 1.4 | 1.7 | 2.1 | 2.6 | 1.4 | 2.0 |
| Dec | 15.5 | 9.1 | 5.5 | 2.0 | 1.8 | 2.0 | 1.2 | 1.6 | 1.8 | 2.4 | 1.1 | 1.2 |
Table A9.
Monthly statistics on daytime and nighttime wind speed data at S3311, S3790, and S4167 stations.
Table A9.
Monthly statistics on daytime and nighttime wind speed data at S3311, S3790, and S4167 stations.
| Month | Max | Mean | Median | Std | ||||||||
|---|---|---|---|---|---|---|---|---|---|---|---|---|
| S3311 | S3790 | S4167 | S3311 | S3790 | S4167 | S3311 | S3790 | S4167 | S3311 | S3790 | S4167 | |
| Daytime Data | ||||||||||||
| Jan | 14.0 | 17.4 | 13.2 | 3.1 | 3.5 | 3.6 | 2.8 | 2.9 | 3.1 | 1.8 | 2.4 | 2.1 |
| Feb | 12.7 | 15.8 | 14.5 | 3.3 | 4.0 | 3.6 | 2.9 | 3.5 | 3.2 | 2.0 | 2.6 | 2.0 |
| Mar | 12.3 | 16.4 | 20.8 | 4.2 | 5.3 | 4.3 | 3.8 | 4.8 | 3.9 | 2.2 | 2.9 | 2.3 |
| Apr | 13.2 | 19.5 | 16.0 | 4.4 | 5.4 | 4.4 | 4.2 | 5.0 | 4.1 | 2.3 | 3.0 | 2.4 |
| May | 13.7 | 24.5 | 19.2 | 4.1 | 5.1 | 4.5 | 3.6 | 4.2 | 3.8 | 2.5 | 3.4 | 2.8 |
| Jun | 15.5 | 21.5 | 16.3 | 4.4 | 5.6 | 4.4 | 4.0 | 4.5 | 3.7 | 2.5 | 3.9 | 2.8 |
| Jul | 18.3 | 22.3 | 16.6 | 4.1 | 5.0 | 4.3 | 3.6 | 4.2 | 3.6 | 2.4 | 3.3 | 2.8 |
| Aug | 11.9 | 18.5 | 14.7 | 3.7 | 4.2 | 3.9 | 3.4 | 3.6 | 3.3 | 2.1 | 2.6 | 2.4 |
| Sep | 12.6 | 16.8 | 14.4 | 3.7 | 4.4 | 3.5 | 3.4 | 3.8 | 3.2 | 2.0 | 2.7 | 2.0 |
| Oct | 11.7 | 17.8 | 11.8 | 3.2 | 4.0 | 3.2 | 3.0 | 3.7 | 2.9 | 1.8 | 2.3 | 1.7 |
| Nov | 14.8 | 18.8 | 14.4 | 3.4 | 4.0 | 3.6 | 2.9 | 3.3 | 3.2 | 2.2 | 2.8 | 2.0 |
| Dec | 15.5 | 22.2 | 13.4 | 3.0 | 3.1 | 3.3 | 2.5 | 2.6 | 3.0 | 2.3 | 2.9 | 1.9 |
| Nighttime Data | ||||||||||||
| Jan | 13.1 | 18.8 | 18.7 | 2.2 | 3.6 | 3.7 | 2.0 | 2.8 | 3.1 | 1.5 | 2.9 | 2.5 |
| Feb | 14.5 | 17.5 | 14.5 | 2.5 | 3.9 | 3.6 | 2.1 | 3.0 | 3.3 | 1.8 | 3.1 | 2.2 |
| Mar | 10.7 | 17.6 | 21.0 | 3.3 | 5.0 | 4.1 | 2.8 | 4.4 | 3.7 | 2.0 | 3.3 | 2.5 |
| Apr | 11.4 | 16.5 | 16.6 | 3.3 | 4.7 | 3.9 | 2.7 | 3.7 | 3.3 | 2.2 | 3.5 | 2.7 |
| May | 14.9 | 23.8 | 19.7 | 3.6 | 5.3 | 4.8 | 2.8 | 4.1 | 3.9 | 2.8 | 4.1 | 3.5 |
| Jun | 13.0 | 20.0 | 16.0 | 4.6 | 6.3 | 4.8 | 3.9 | 5.3 | 3.8 | 2.9 | 4.6 | 3.4 |
| Jul | 12.8 | 19.6 | 14.9 | 3.8 | 5.0 | 4.3 | 3.1 | 3.8 | 3.3 | 2.6 | 3.8 | 3.3 |
| Aug | 13.1 | 18.4 | 16.5 | 2.7 | 3.3 | 3.4 | 2.1 | 2.4 | 2.4 | 2.1 | 2.9 | 2.9 |
| Sep | 10.8 | 15.4 | 17.3 | 2.7 | 3.7 | 3.0 | 2.2 | 2.8 | 2.4 | 1.8 | 2.9 | 2.2 |
| Oct | 11.4 | 18.6 | 13.3 | 2.5 | 3.5 | 2.9 | 2.2 | 2.6 | 2.4 | 1.6 | 2.9 | 2.0 |
| Nov | 13.4 | 21.4 | 20.2 | 2.4 | 3.5 | 3.5 | 2.0 | 2.8 | 3.2 | 1.9 | 2.8 | 2.2 |
| Dec | 10.8 | 16.8 | 12.1 | 2.1 | 3.0 | 3.4 | 1.8 | 2.5 | 3.1 | 1.6 | 2.8 | 2.0 |
References
- Graham, E.; Sarazin, M.; Beniston, M.; Collet, C.; Hayoz, M.; Neun, M.; Casals, P. Climate-based site selection for a Very Large Telescope using GIS techniques. Meteorol. Appl. 2005, 12, 77–81. [Google Scholar] [CrossRef]
- Varela, A.M.; Bertolin, C.; Muñoz-Tuñón, C.; Ortolani, S.; Fuensalida, J.J. Astronomical site selection: On the use of satellite data for aerosol content monitoring. Mon. Not. R. Astron. Soc. 2008, 391, 507–520. [Google Scholar] [CrossRef]
- Hellemeier, J.A.; Yang, R.; Sarazin, M.; Hickson, P. Weather at selected astronomical sites—An overview of five atmospheric parameters. Mon. Not. R. Astron. Soc. 2019, 482, 4941–4950. [Google Scholar] [CrossRef]
- Yao, Y. The Astronomical Site Survey in West China. J. Korean Astron. Soc. 2005, 38, 113–116. [Google Scholar] [CrossRef]
- Aksaker, N.; Yerli, S.K.; Erdoǧan, M.A.; Kurt, Z.; Kaba, K.; Bayazit, M.; Yesilyaprak, C. Global Site Selection for Astronomy. Mon. Not. R. Astron. Soc. 2020, 493, 1204–1216. [Google Scholar] [CrossRef]
- Cao, Z.H.; Liu, L.Y.; Zhao, Y.H.; Feng, L.; Jones, H.R.A.; Shen, H.; Hao, J.X.; Xue, Y.J.; Yao, Y.Q.; Xu, J.; et al. Long-term analysis of clear nights using satellite data considering astronomical sites in western China. Res. Astron. Astrophys. 2020, 20, 081. [Google Scholar] [CrossRef]
- Tian, J.F.; Deng, L.C.; Zhang, X.B.; Lu, X.M.; Sun, J.J.; Liu, Q.L.; Zhou, Q.; Yan, Z.Z.; Xin, Y.; Wang, K.; et al. Optical Observing Conditions at Delingha Station. Publ. Astron. Soc. Pac. 2016, 128, 105003. [Google Scholar] [CrossRef]
- Schöck, M.; Els, S.; Riddle, R.; Skidmore, W.; Travouillon, T.; Blum, R.; Bustos, E.; Chanan, G.; Djorgovski, S.G.; Gillett, P.; et al. Thirty Meter Telescope Site Testing I: Overview. Publ. Astron. Soc. Pac. 2009, 121, 384. [Google Scholar] [CrossRef]
- Vernin, J.; Muñoz-Tuñón, C.; Sarazin, M.; Vazquez Ramió, H.; Varela, A.M.; Trinquet, H.; Delgado, J.M.; Jiménez Fuensalida, J.; Reyes, M.; Benhida, A.; et al. European Extremely Large Telescope Site Characterization I: Overview. Publ. Astron. Soc. Pac. 2011, 123, 1334. [Google Scholar] [CrossRef]
- Deng, L.; Yang, F.; Chen, X.; He, F.; Liu, Q.; Zhang, B.; Zhang, C.; Wang, K.; Liu, N.; Ren, A.; et al. Lenghu on the Tibetan Plateau as an astronomical observing site. Nature 2021, 596, 353–356. [Google Scholar] [CrossRef] [PubMed]
- Yang, C.; Deng, L.C.; Yang, F.; He, F.; Wang, K.; Li, R.Y.; Lan, T.; Ren, A.B.; Liu, N.; Zhang, C.G.; et al. Optical Observatory Site Selection in the Qinghai-Tibet Plateau: Lenghu as a Promising Site for the Future Development of Optical Astronomy in China. Prog. Astron. 2024, 42, 257–275. [Google Scholar] [CrossRef]
- Zhao, Y.; Yang, F.; Chen, X.; Zhang, X.; Ma, J.; Kong, X.; Fu, X.; Li, R.; Wei, Y.; Yao, Z.; et al. Long-term variations in precipitable water vapor and temperature at Lenghu Site. Astron. Instrum. 2022, 663, A34. [Google Scholar] [CrossRef]
- Li, J.; Ma, B.; Dong, Z.; Zhang, H. Preliminary results of sky brightness measurements in near-infrared at Lenghu, China. In Proceedings of the Ground-Based and Airborne Telescopes X, Yokohama, Japan, 16–21 June 2024; Marshall, H.K., Spyromilio, J., Usuda, T., Eds.; Society of Photo-Optical Instrumentation Engineers (SPIE) Conference Series. SPIE: Bellingham, WA, USA, 2024; Volume 13094, p. 130945C. [Google Scholar] [CrossRef]
- Muñoz-Tuñón, C. The astroclimatic station: A Must for any major observatory (Invited Speaker). In Proceedings of the Astronomical Site Evaluation in the Visible and Radio Range, Marrakech, Morocco, 13–17 November 2002; Vernin, J., Benkhaldoun, Z., Muñoz-Tuñón, C., Eds.; Astronomical Society of the Pacific Conference Series. ASP: San Francisco, CA, USA, 2002; Volume 266, p. 498. [Google Scholar]
- Jabiri, A.; Benkhaldoun, Z.; Vernin, J.; Muñoz-Tuñón, C. A meteorological and photometric study of the Oukaimeden site. Comparison with the Observatorio del Roque de los Muchachos using Carlsberg Automatic Meridian Circle data. Astron. Instrum. 2000, 147, 271–284. [Google Scholar] [CrossRef]
- Cantalloube, F.; Milli, J.; Böhm, C.; Crewell, S.; Navarrete, J.; Rehfeld, K.; Sarazin, M.; Sommani, A. The impact of climate change on astronomical observations. Nat. Astron. 2020, 4, 826–829. [Google Scholar] [CrossRef]
- Bolbasova, L.A.; Kopylov, E.A. Long-Term Trends of Astroclimatic Parameters above the Terskol Observatory. Atmosphere 2023, 14, 1264. [Google Scholar] [CrossRef]
- Zhao, Y.; He, F.; Li, R.; Yang, F.; Deng, L. Variability in Meteorological Parameters at the Lenghu Site on the Tibetan Plateau. Atmosphere 2025, 16, 1210. [Google Scholar] [CrossRef]
- van Kooten, M.A.M.; Izett, J.G. Climate Change and Astronomy: A Look at Long-term Trends on Maunakea. Publ. Astron. Soc. Pac. 2022, 134, 095001. [Google Scholar] [CrossRef]
- Li, R.; He, F.; Deng, L.; Chen, X.; Yang, F.; Zhao, Y.; Zhang, B.; Zhang, C.; Yang, C.; Lan, T. The cloud cover and meteorological parameters at the Lenghu site on the Tibetan Plateau. Mon. Not. R. Astron. Soc. 2024, 535, 1278–1292. [Google Scholar] [CrossRef]
- Bi, C.; Qing, C.; Qian, X.; Zhu, W.; Luo, T.; Li, X.; Cui, S.; Weng, N. Astroclimatic parameters characterization at lenghu site with ERA5 products. Mon. Not. R. Astron. Soc. 2024, 527, 4616–4631. [Google Scholar] [CrossRef]
- Morrison, D.; Murphy, R.E.; Cruikshank, D.P.; Sinton, W.M.; Martin, T.Z. Evaluation of Mauna Kea, Hawaii, as an Observatory Site. Publ. Astron. Soc. Pac. 1973, 85, 255. [Google Scholar] [CrossRef]
- Liu, L.Y.; Yao, Y.Q.; Wang, Y.P.; Ma, J.L.; He, B.L.; Wang, H.S. Seeing measurements for the Guoshoujing Telescope (LAMOST) site with DIMM. Res. Astron. Astrophys. 2010, 10, 1061–1070. [Google Scholar] [CrossRef]
- Varela, A.M.; Vázquez Ramió, H.; Vernin, J.; Muñoz-Tuñón, C.; Sarazin, M.; Trinquet, H.; Delgado, J.M.; Jiménez Fuensalida, J.; Reyes, M.; Benhida, A.; et al. European Extremely Large Telescope Site Characterization III: Ground Meteorology. Publ. Astron. Soc. Pac. 2014, 126, 412. [Google Scholar] [CrossRef]
- Murdin, P. Nighttime skies above the Canary Islands. Vistas Astron. 1985, 28, 449–465. [Google Scholar] [CrossRef]
- Lombardi, G.; Zitelli, V.; Ortolani, S. The astroclimatological comparison of the Paranal Observatory and El Roque de Los Muchachos Observatory. Mon. Not. R. Astron. Soc. 2009, 399, 783–793. [Google Scholar] [CrossRef]
- Mendoza-Torres, J.E.; Colín-Beltrán, E.; Ferrusca, D.; Contreras, R.J. Local dew-point temperature, water vapor pressure, and millimeter-wavelength opacity at the Sierra Negra volcano. Astron. Instrum. 2021, 649, A12. [Google Scholar] [CrossRef]
- Geissler, K.; Masciadri, E. Meteorological Parameter Analysis above Dome C Using Data from the European Centre for Medium-Range Weather Forecasts. Publ. Astron. Soc. Pac. 2006, 118, 1048–1065. [Google Scholar] [CrossRef]
- Feng, L.; Hao, J.X.; Cao, Z.H.; Bai, J.M.; Yang, J.; Zhou, X.; Yao, Y.Q.; Hou, J.L.; Zhao, Y.H.; Liu, Y.; et al. Site testing campaign for the Large Optical/infrared Telescope of China: Overview. Res. Astron. Astrophys. 2020, 20, 080. [Google Scholar] [CrossRef]
- Tovmassian, G.; Hernandez, M.S.; Ochoa, J.L.; Ernenwein, J.P.; Mandat, D.; Pech, M.; Plauchu Frayn, I.; Colorado, E.; Murillo, J.M.; Ceseña, U.; et al. Astroclimatic Characterization of Vallecitos: A Candidate Site for the Cherenkov Telescope Array at San Pedro Mártir. Publ. Astron. Soc. Pac. 2016, 128, 035004. [Google Scholar] [CrossRef]
- Xu, J.; Esamdin, A.; Hao, J.X.; Bai, J.M.; Yang, J.; Zhou, X.; Yao, Y.Q.; Hou, J.L.; Pu, G.X.; Feng, G.J.; et al. Site-testing at Muztagh-ata site I: Ground meteorology and sky brightness. Res. Astron. Astrophys. 2020, 20, 086. [Google Scholar] [CrossRef]
- Bolton, D. The Computation of Equivalent Potential Temperature. Mon. Weather. Rev. 1980, 108, 1046–1053. [Google Scholar] [CrossRef]
- Radu, A.A.; Angelescu, T.; Curtef, V.; Felea, D.; Hasegan, D.; Lucaschi, B.; Manea, A.; Popa, V.; Ralita, I. An astroclimatological study of candidate sites to host an imaging atmospheric Cherenkov telescope in Romania. Mon. Not. R. Astron. Soc. 2012, 422, 2262–2273. [Google Scholar] [CrossRef]
- Bradley, E.S.; Roberts, L.C., Jr.; Bradford, L.W.; Skinner, M.A.; Nahrstedt, D.A.; Waterson, M.F.; Kuhn, J.R. Characterization of Meteorological and Seeing Conditions at Haleakala. Publ. Astron. Soc. Pac. 2006, 118, 172–182. [Google Scholar] [CrossRef]
Disclaimer/Publisher’s Note: The statements, opinions and data contained in all publications are solely those of the individual author(s) and contributor(s) and not of MDPI and/or the editor(s). MDPI and/or the editor(s) disclaim responsibility for any injury to people or property resulting from any ideas, methods, instructions or products referred to in the content. |
© 2025 by the authors. Licensee MDPI, Basel, Switzerland. This article is an open access article distributed under the terms and conditions of the Creative Commons Attribution (CC BY) license (https://creativecommons.org/licenses/by/4.0/).