Abstract
The Ogasawara (Bonin) Islands, consisting of more than 30 islands and located approximately 1000 km south of central Tokyo, occasionally experience severe droughts. Severe drought does not typically occur during El Niño (EN) events in the Ogasawara Islands because convective activity around the tropical western Pacific is inactive during EN events and correspondingly induces substantial precipitation around the Ogasawara Islands through the Pacific–Japan (P-J) pattern. However, a severe drought in 2018–2019 occurred during EN. In this study, we investigated the causes of drought occurrence. In 2018–2019, the El Niño Modoki (EN Modoki) event occurred simultaneously with EN, which decreased precipitation around the Ogasawara Islands from autumn to the following spring. This was induced by the positive sea level pressure anomaly and anticyclonic circulation around the Ogasawara Islands peculiar to the EN Modoki condition. In relation to the 2018–2019 drought, the investigation of past drought events at the Ogasawara Islands revealed that the drought in the spring and summer of 1991 also occurred during the simultaneous occurrence of the EN and EN Modoki events.
1. Introduction
The Ogasawara (Bonin) Islands are located approximately 1000 km south of central Tokyo (Figure 1). They consist of more than 30 islands, and it is difficult to draw the exact range of these islands in Figure 1a. Because the Ogasawara Islands are located in the mid-latitudinal and are frequently covered by anticyclones, the annual precipitation on the islands is lower than that in central Tokyo. The annual precipitation in Chichi-jima (a representative meteorological station in the Ogasawara Islands) was 1292.5 mm/y during 1981–2010, whereas that in central Tokyo (Otemachi) was 1528.8 mm/y [1].
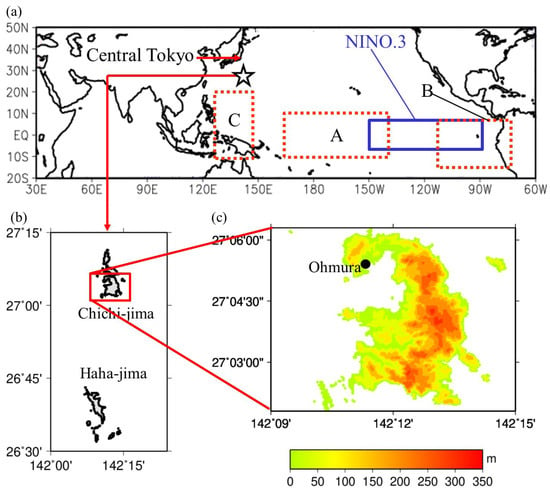
Figure 1.
(a) Locations of the Ogasawara (Bonin) Islands, along with the regions used for defining El Niño (NINO.3, marked in blue) and El Niño Modoki (regions A, B, and C, marked in dashed red). (b) Enlarged map showing the Chichi-jima and Haha-jima Islands. (c) The topography of Chichi-jima. Meteorological observations are conducted at Ohmura by the Japan Meteorological Agency.
Seasonal changes in precipitation in Chichi-jima are shown in Figure 2. In comparison with that of central Tokyo, precipitation at Chichi-jima in May is larger than that in central Tokyo. This rainy season corresponds to the Bai-u season in other regions of Japan. Precipitation in Chichi-jima from August to November reflects the effects of tropical cyclones such as typhoons.
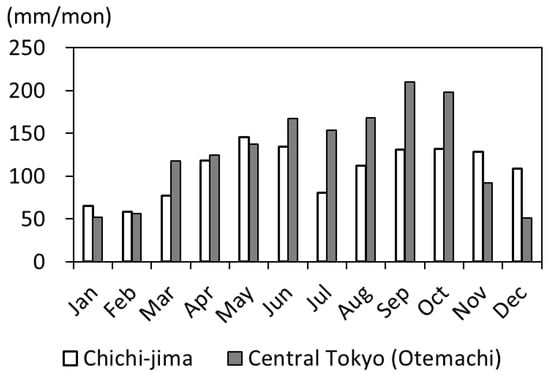
Figure 2.
Average monthly precipitation in Chichi-jima from 1981 to 2010, along with that in central Tokyo (Otemachi) [1].
The Ogasawara Islands have experienced severe drought twice in recent years: May 2016–April 2017 [2] and August 2018–April 2019 [3] (Figure 3). As these droughts occurred in the 2010s, the climate normal was calculated for the period 1981–2010 in this study. Both the severe drought events terminated in May. From May 2016 to April 2017, a negative anomaly of precipitation continued, resulting in 12 months of precipitation in Chichi-jima of 641.0 mm. This is less than half of the normal precipitation. The reduced precipitation depleted the water storage of dams at Chichi-jima below 20% of the normal value (Figure 3b). Between August 2018 and April 2019, the total precipitation was 449.5 mm. The normal precipitation from August to April is 931.5 mm at Chichi-jima; therefore, the severe drought during this period also resulted in less than half of the normal precipitation. The water storage of dams at Chichi-jima also decreased to nearly 20% of the normal value (Figure 3b).
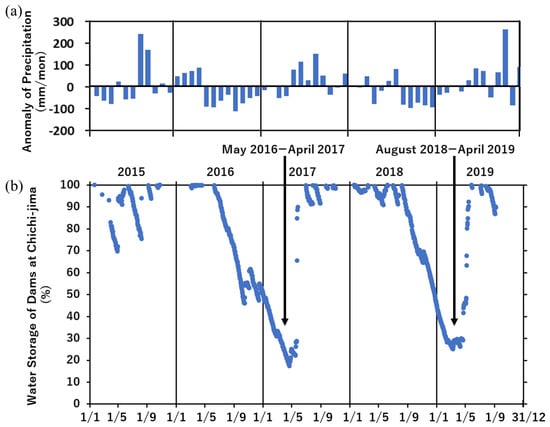
Figure 3.
Yearly variations in the (a) anomaly of precipitation from 1981 to 2010 at Chichi-jima [1] and (b) water storage of dams at Chichi-jima (courtesy of the Construction and Water Supply Division, Ogasawara Village). The drought periods are indicated by arrows (modified after [3]).
The Ogasawara Islands do not typically experience drought during El Niño (EN) events. Convective activity in the tropical western Pacific is inactive during EN because the sea surface temperature (SST) is lower than that during normal conditions there [4]. Active convection in the tropical western Pacific enhances the development of North Pacific High, especially in summer, in a normal year through the Pacific–Japan (P-J) pattern [4]. Therefore, La Niña (LN) events are more favorable for the occurrence of drought around the Ogasawara Islands.
In contrast, during EN events, precipitation in Japan (including the Ogasawara Islands) is expected to be high because of inactive convection around the tropical western Pacific. However, the severe drought at the Ogasawara Islands in 2018–2019 occurred during the EN event ([5], Figure 4). This implies that past knowledge of teleconnection patterns from the tropics to the subtropics may not be applicable in an era of changing climate.
Concerning the long-term variability of precipitation around the Ogasawara Islands, precipitation in Chichi-jima from 1968 to 2000 was approximately 20% lower than that before World War II (1907–1943) [6]. The Ogasawara Islands were returned to Japan in 1968. The occurrence of summer water shortages increased from the pre-war period to the post-return period, indicating that the degree of water shortage has intensified [6]. Hydrometeorological data from 1998 to 2007 demonstrate that this tendency has continued into the 21st century [7]. In contrast, the possibility of cyclic variation in precipitation at the Ogasawara Islands was reported by reproducing the precipitation in Chichi-jima before 1906 by analyzing historical documents [8]. Precipitation before 1906 at Chichi-jima was also lower than that after 1907, indicating no unilateral decrease from the pre-war to postwar periods [6]. However, none of these studies have mentioned the causes of these characteristics.
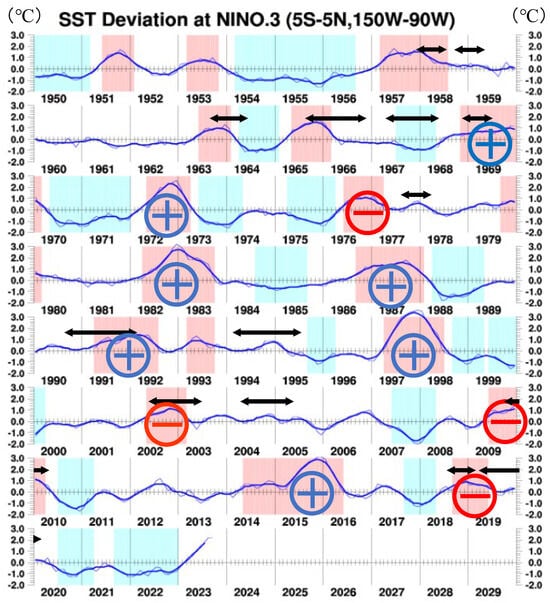
Figure 4.
SSTA at the NINO.3 region, and the occurrences of EN (red hatch) and LN (blue hatch) events [5], along with the occurrence of EN Modoki (black arrow, calculated from [9]). The plus/minus signs inside the circles represent positive/negative precipitation anomalies at Chichi-jima, respectively, during EN events after June 1968 [1].
2. Data and Methods
First, we investigated whether the Ogasawara Islands did not experience a severe drought during EN. For this analysis, we used SST anomaly (SSTA) data from the NINO.3 region ([5], Figure 1a) and precipitation data from Chichi-jima [1] after June 1968. The occurrence of EN was confirmed when the 5-month running mean of SSTA at the NINO.3 region was larger than or equal to 0.5 ℃ for at least six consecutive months [5].
We then investigated the effect of El Niño Modoki (EN Modoki, [10]) events on precipitation variability in Chichi-jima. EN Modoki appears as the second mode of the empirical orthogonal function applied to the monthly tropical Pacific SSTA [10], which indicates that EN Modoki is not related to conventional EN events. The EN Modoki Index (EMI) is expressed by Equation (1) and is used to confirm the occurrence of EN Modoki using SSTA at three regions (Figure 1a), namely, regions A (165° E–140° W, 10° S–10° N), B (110° W–70° W, 15° S–5° N), and C (125° E–145° E, 10° S–20° N).
where [SSTA]A, [SSTA]B, and [SSTA]C are the SSTAs in regions A, B, and C, respectively. Ashok et al. [10] used the EMI normalized by its standard deviation (σ) in 1979–2004 (0.52 °C). In our study, we used the EMI value that is normalized by its σ in 1991–2020 (0.53 °C) as calculated by APEC [9], which is almost equal to the σ value of 1979–2004.
EMI = [SSTA]A −0.5 × [SSTA]B −0.5 × [SSTA]C,
The occurrence of EN Modoki is defined as the period when the EMI is larger than or equal to 0.7σ [10]. In this definition, σ is calculated by the season, and the years with EN Modoki occurrences after 1979 were 1986, 1990, 1991, 1992, 1994, 2002, and 2004, along with the winter season of 1979–1980. However, methods for determining the respective periods of EN Modoki occurrence have not been concretely described [10]. Following the definition of EN, we defined the occurrence of EN Modoki as follows: The occurrence of EN Modoki was confirmed when the 5-month running mean of EMI was greater than or equal to 0.37 °C (=0.7σ from 1991 to 2020) and observed for at least 6 consecutive months. The validity of this method was confirmed by comparing the time series of EMI in [10].
To investigate the temporal evolution of SSTAs, we adopted the National Oceanic and Atmospheric Administration’s (NOAA) Extended Reconstructed Sea Surface Temperature (ERSST) V5 dataset [11], which was used to calculate the EMI [10]. To analyze the anomaly of the atmospheric field, we used the Climate Prediction Center (CPC) Merged Analysis of Precipitation (CMAP) [12] and the National Centers for Environmental Prediction/National Center for Atmospheric Research (NCEP/NCAR) reanalysis [13], as we have already analyzed the drought at the Ogasawara Islands from 2016 to 2017 using these atmospheric data [2].
3. Results and Discussion
3.1. Is It True that the Ogasawara Islands Do Not Suffer from Severe Drought during EN?
EN events have occurred 11 times since June 1968 (Table 1, Figure 4). Although the period of occurrence differed among the 11 cases, the precipitation anomaly at Chichi-jima was positive in seven cases (Table 1). In general, the Ogasawara Islands do not suffer from severe droughts during EN events. As presented in Table 1, all 11 EN events occurred in September–January; that is, EN usually develops in winter [14].

Table 1.
Periods of EN after June 1968 and related metrics, including precipitation anomalies at Chichi-jima. The base period of precipitation in Chichi-jima is 1981–2010.
Based on the data in Table 1, a positive correlation was observed between the EN period (duration) and the size of the average precipitation anomaly (mm/mon). However, the correlation coefficient of 0.52 is not statistically significant at the 5% level. We also investigated the relationship between the EN intensity and the average precipitation anomaly. The intensity of EN is defined as the average of SSTA in the NINO.3 region during EN (Figure 1a). We found a positive correlation; that is, the larger the SSTA, the larger the average precipitation anomaly. The correlation coefficient of 0.79 is statistically significant at the 1% level.
Table 2 lists the monthly precipitation anomalies of the 11 cases from September to January. Among the four exceptions when the precipitation was below normal during EN (Table 1), the precipitation anomaly during 2018–2019 was abnormal. The other 10 cases show both positive and negative monthly anomalies from September to January (Table 2); however, only the negative precipitation anomaly occurred in 2018–2019. This resulted in a severe drought during this period (Figure 3).

Table 2.
Monthly precipitation anomalies at Chichi-jima from September to January during EN events after June 1968. The base period is 1981–2010.
3.2. Relationship between EN and EN Modoki, and the Effect of the Latter on the Atmospheric Field around the Ogasawara Islands
Figure 5 shows the interannual variability in EMI from 1948 to 2021. A composite analysis of the years of EN Modoki occurrence after 1979 was conducted by [10]; therefore, we followed the periods, i.e., 1986, 1990, 1991, 1992, 1994, 2002, and 2004. Although the winter of 1979–1980 was included as a year of EN Modoki occurrence [10], we omitted it because the EMI during this period fell below the threshold of 0.7 σ (Figure 5). In contrast, the years of EN after 1979 are 1982, 1986, 1991, 1997, 2002, 2009, 2014, and 2015 [10]. The EN and EN Modoki periods, along with other data, are shown in Figure 4. The plus/minus signs within the circles in Figure 4 represent positive/negative precipitation anomalies at Chichi-jima during the EN after June 1968 (Table 1).
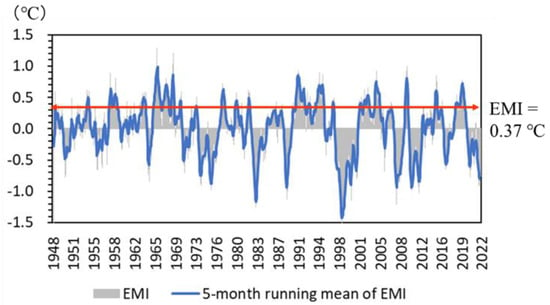
Figure 5.
Interannual variability in EMI and its 5-month running mean from 1948 to 2022. The red arrow indicates an EMI value of 0.37 °C. It is calculated as 0.7σ (σ = 0.53 °C) from 1991 to 2020 [9].
Because the period when EMI is larger than or equal to 0.7σ is regarded as the occurrence of EN Modoki [10], it has often occurred after 2004 in the 21st century (Figure 4, [15]). Figure 5 also shows that EN Modoki occurred from 2018 to 2019, although the EMI value from February to April 2019 was slightly below the threshold (Table 3). Accordingly, the severe drought at the Ogasawara (Bonin) Islands in 2018–2019 not only occurred during EN but also during EN Modoki, because they can simultaneously occur (Figure 4). Numerically, EN and EN Modoki, respectively, appear as EOF1 and EOF2 of the monthly SSTA in the Pacific [10]. They are uncorrelated; however, an investigation of the SSTA indices of EN and EN Modoki allows for the simultaneous coexistence of EN and EN Modoki [10].

Table 3.
Periods of EN, EN Modoki, and drought at the Ogasawara Islands after June 1968.
The effect of EN Modoki on global atmospheric fields was described in a previous study [10] by conducting a composite analysis of the aforementioned years of EN Modoki. We found that precipitation in the Ogasawara Islands decreased in both June–September and December–February, aligning with the findings of [10]. This characteristic is in accordance with the severe drought in 2018–2019.
The impact of EN Modoki on the global atmospheric field is similar to that of La Niña (LN) during the boreal summer [17]. In boreal winter, cold air is more likely to blow into the Far East and east coast of the United States, which contrasts with the warm winter during EN. Moreover, the importance of precise studies on the effect of EN Modoki on the regional atmospheric field has been pointed out in previous studies [17,18].
3.3. Temporal Evolution of SSTA during EN, EN Modoki, and 2018–2019
The SSTA of 2018–2019 is more similar to the EN Modoki condition than to the EN (Figure 6, Figure 7 and Figure 8). These figures show the seasonal composites of the SSTA during EN, EN Modoki, and 2018–2019 from September to May, although some cases of EN and EN Modoki did not continue until spring. The composites of eight EN events, seven EN Modoki events, and September 2018–May 2019 are denoted for September–November (SON), December–February (DJF), and March–May (MAM), respectively. Seasonal precipitation at Chichi-jima from 1981 to 2010 and the ratios of precipitation during the aforementioned events to the climatological mean are listed in Table 4.
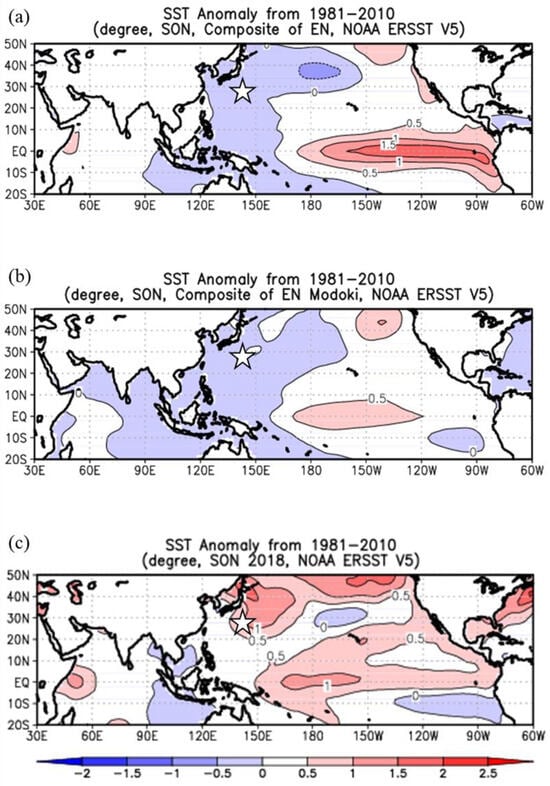
Figure 6.
SSTA from 1981 to 2010, from September to November. (a) Composite of eight EN events (beginning of EN: 1982, 1986, 1991, 1997, 2002, 2009, 2014, and 2015); (b) composite of seven EN Modoki events (beginning of EN Modoki: 1976, 1990, 1991, 1992, 1994, 2002, and 2004); and (c) composite of the condition in 2018. The white stars indicate Chichi-jima. The spatial correlations between (a) and (b), (a) and (c), and (b) and (c) are, respectively, 0.71, 0.15, and 0.41.
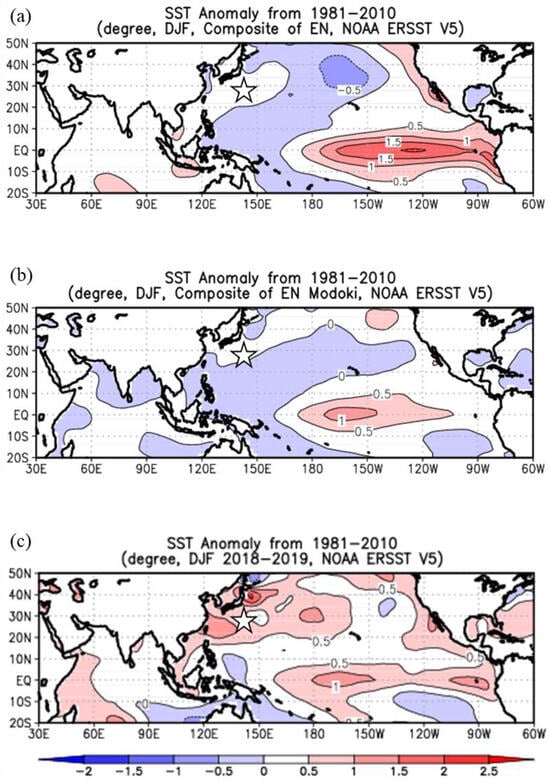
Figure 7.
Same as Figure 6, but from December to the following February. The spatial correlations between (a) and (b), (a) and (c), and (b) and (c) are, respectively, 0.72, 0.23, and 0.34. The white stars indicate Chichi-jima.
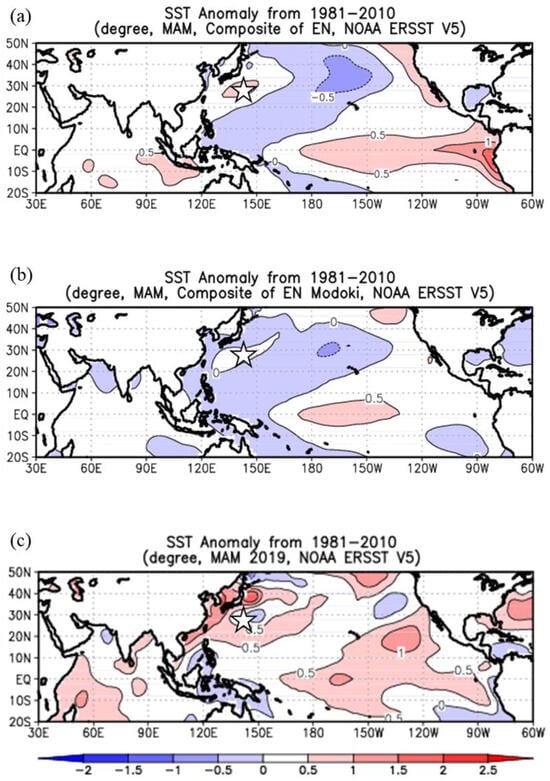
Figure 8.
Same as Figure 6, but from the following March to May. The spatial correlations between (a) and (b), (a) and (c), and (b) and (c) are, respectively, 0.66, 0.16, and 0.30. The white stars indicate Chichi-jima.

Table 4.
Seasonal mean precipitations at Chichi-jima (1981–2010) from September to the following May and the ratios of seasonal precipitation during eight EN events, seven EN Modoki events, and September 2018–May 2019 to the seasonal mean.
During SON, positive SSTA values above 1.5 °C already appeared around the tropical eastern Pacific during EN (Figure 6a), whereas those over 0.5 °C were observed in the tropical central Pacific during EN Modoki (Figure 6b). The positive anomaly encompassed the central-eastern tropical Pacific during SON 2018 (Figure 6c); however, the anomaly in the tropical eastern Pacific was not as large as that during EN (Figure 6a). Positive SSTA values above 1 °C were observed in the central tropical Pacific during SON 2018 (Figure 6c). However, the most profound difference between Figure 6c and Figure 6a,b is the large positive SSTA (above 1 °C) around the Ogasawara Islands. The spatial correlations between Figure 6a and Figure 6b, Figure 6a and Figure 6c, and Figure 6b and Figure 6c are, respectively, 0.71, 0.15, and 0.41. Namely, SSTA during SON 2018 is more similar to that during EN Modoki than EN.
During SON, the precipitation at Chichi-jima was larger than the climatological mean during EN, whereas it was smaller during both EN Modoki and 2018; the latter was lower than half of the climatological mean (Table 4). The relationship between SSTA and precipitation is further discussed in Section 3.4.
Both the EN and EN Modoki matured during the boreal winter (Figure 7a,b). From December 2018 to February 2019, positive SSTA values above 1.0 °C were observed in both the central and eastern tropical Pacific (Figure 7c). However, the most profound difference between Figure 7c and Figure 7a,b is the large positive SSTA (above 1 °C) around the Ogasawara Islands. The spatial correlations between Figure 7a and Figure 7b, Figure 7a and Figure 7c, and Figure 7b and Figure 7c are, respectively, 0.72, 0.23, and 0.34. Namely, SSTA during DJF 2018–2019 is more similar to that during EN Modoki than EN.
During DJF, the precipitation in Chichi-jima was higher than the climatological mean during EN, whereas it was lower during both EN Modoki and 2018–2019 (Table 4). In particular, the precipitation from December 2018 to February 2019 was 26% of the climatological mean, which induced severe drought during this period (Figure 3).
EN declines in boreal springs (Figure 8a). Additionally, the occurrence of EN Modoki reduced the positive SSTA in the central tropical Pacific (Figure 8b). However, positive SSTA values larger than 1 °C are observed in the central tropical Pacific in MAM 2019, but SSTA off the west coast of South America is negative in MAM 2019 (Figure 8c). This is in contrast to the EN condition. A positive SSTA prevails in the mid-latitudes; however, the Ogasawara Islands are located around the periphery of positive and negative SSTAs. The spatial correlations between Figure 8a and Figure 8b, Figure 8a and Figure 8c, and Figure 8b and Figure 8c are, respectively, 0.66, 0.16, and 0.30. Namely, SSTA during MAM 2019 is more similar to that during EN Modoki than EN.
During MAM, the precipitation at Chichi-jima was almost the same as the climatological mean during both EN and EN Modoki (Table 4). In contrast, the precipitation in MAM 2019 was higher than the climatological mean. This can be explained as follows:
The severe drought in Chichi-jima terminated on 9 May 2019 (announced on the website of Ogasawara Village on the day: https://www.vill.ogasawara.tokyo.jp/, accessed on 9 May 2019), and the precipitation was greater than the normal amount in May 2019. Because the analysis was based on seasonal values, the effect of precipitation being higher than normal (145.4 mm in May) in May 2019 (183.5 mm) was observed during MAM 2019 (Table 4).
Thus far, we have demonstrated that the temporal evolution of SSTA during September 2018–May 2019 is more similar to that of the EN Modoki condition than to that of the EN. The spatial correlation in each season supports this idea (Figure 6, Figure 7 and Figure 8). In the next section, we compare the seasonal changes in the atmospheric field anomaly between the seven composites of EN Modoki and that of 2018–2019.
3.4. Temporal Evolution of Atmospheric Field Anomaly during EN Modoki and 2018–2019
We first describe the temporal evolution of the atmospheric field anomaly during the seven composites of EN Modoki that began in 1986, 1990, 1991, 1992, 1994, 2002, and 2004. Next, we describe the characteristics of the 2018–2019 EN Modoki event.
Figure 9, Figure 10 and Figure 11, respectively, illustrate sea level pressure (SLP), surface wind, and precipitation anomalies in SON, DJF, and MAM during the seven composites of EN Modoki. In SON, positive pressure anomalies prevailed in the northwestern Pacific, including the Ogasawara Islands, along with the anticyclonic circulation anomaly (Figure 9a). As a result, precipitation around the Ogasawara Islands showed a negative anomaly. These characteristics are in accordance with SSTA in SON, where a negative SSTA widely covers the western part of the Pacific (Figure 6b).
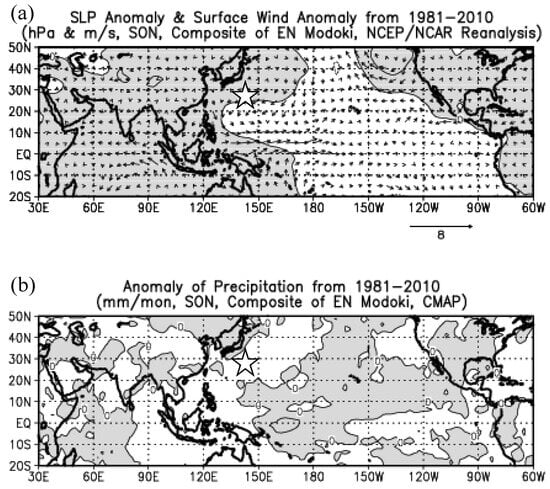
Figure 9.
(a) Sea level pressure (SLP) and surface wind anomalies from 1981 to 2010 during September to November in the seven composites of EN Modoki (1986, 1990, 1991, 1992, 1994, 2002, and 2004). (b) Same as (a), but for precipitation. The white stars represent Chichi-jima. Positive anomalies are shaded in both figures.
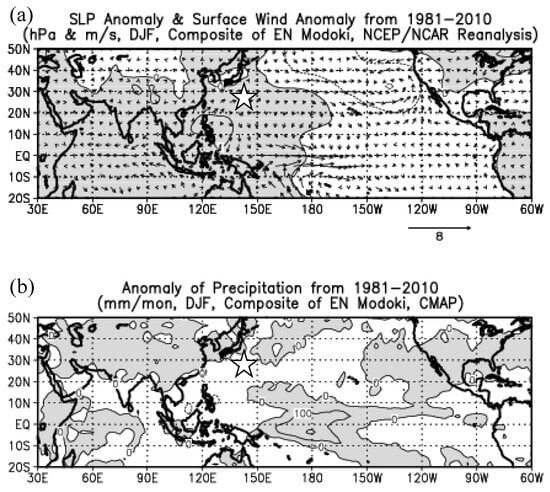
Figure 10.
Same as Figure 9, but for December–February.
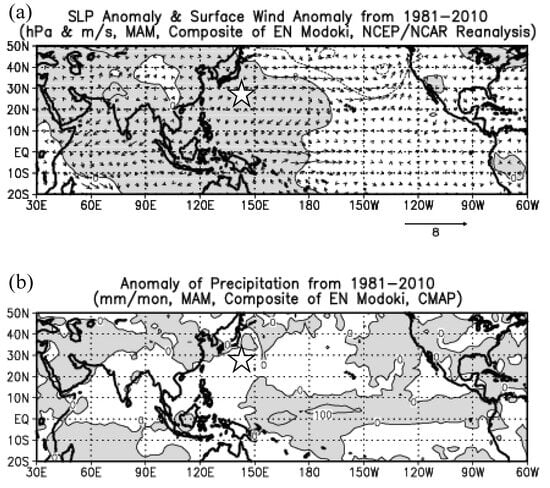
Figure 11.
Same as Figure 9, but for March–May. The white stars indicate Chichi-jima.
The positive pressure anomaly continued until DJF, which resulted in a negative precipitation anomaly around the Ogasawara Islands (Figure 10). Although the Ogasawara Islands are located around the periphery of SSTA at 0 °C (Figure 7b), the overall atmospheric characteristics of SON are taken over to the following DJF and to the following MAM as well (Figure 7b and Figure 11). The oceanic–atmospheric interaction around the Ogasawara Islands during EN Modoki is schematically illustrated in Figure 12.
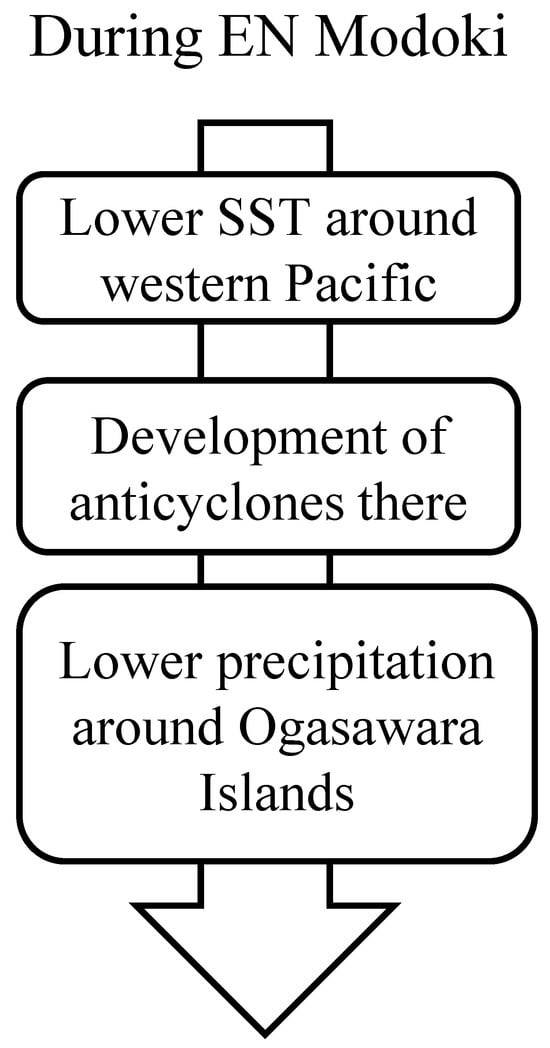
Figure 12.
Summary of the oceanic–atmospheric interaction during EN Modoki around the Ogasawara Islands.
Figure 13, Figure 14 and Figure 15 illustrate the SLP, surface wind, and precipitation anomalies during SON 2018, DJF 2018–2019, and MAM 2019, respectively. During SON 2018, a positive SLP anomaly was prevalent on the Ogasawara Islands, resulting in a negative precipitation anomaly. During this period, no wind anomalies were apparent (Figure 13). In DJF 2018–2019, the positive SLP anomaly persisted, and the wind anomaly around the Ogasawara Islands showed a small divergence. This resulted in a continuous negative precipitation anomaly (Figure 14). During MAM 2019, this situation changed; a cyclonic circulation anomaly appeared around the Ogasawara Islands, resulting in a negative SLP anomaly. The Ogasawara Islands were located around the periphery of the 0 mm precipitation anomaly during this period (Figure 15). These characteristics follow the seasonal precipitation anomalies presented in Table 4.
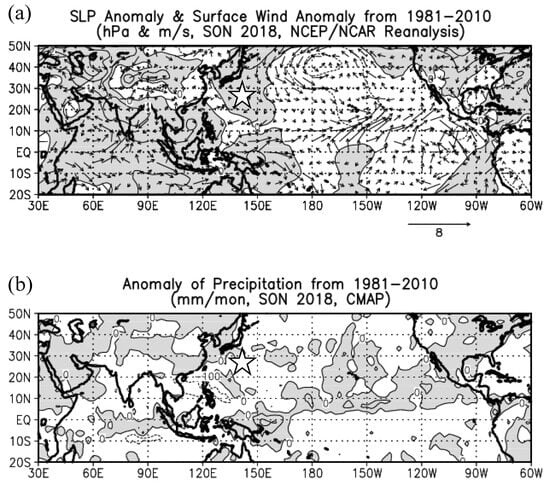
Figure 13.
Same as Figure 9, but from September to November 2018. The white stars indicate Chichi-jima.
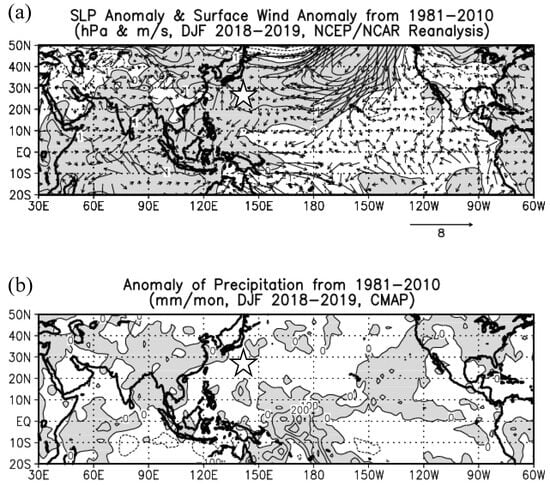
Figure 14.
Same as Figure 9, but from December 2018 to February 2019. The white stars indicate Chichi-jima.
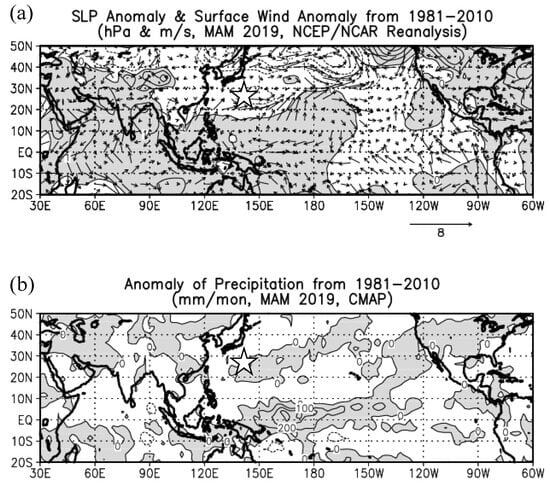
Figure 15.
Same as Figure 9, but from March to May 2019. The white stars indicate Chichi-jima.
Notably, in Figure 6c, Figure 7c and Figure 8c, SSTA around the Ogasawara Islands was positive from September 2018 to May 2019. This characteristic during 2018–2019 was different from that during EN Modoki, as shown in Figure 6b, Figure 7b and Figure 8b. In particular, from the perspective of the hydrological cycle, i.e., enhanced evaporation from the ocean, water vapor transport by the atmosphere, and precipitation on the island, considerable precipitation was expected to occur around the Ogasawara Islands from 2018 to 2019; however, the opposite was observed (Figure 3, Table 1, Table 2 and Table 4). This implies that in 2018–2019, the large-scale atmospheric circulation anomaly (EN Modoki) was more important than the local conditions, such as the warm SSTA around the Ogasawara Islands.
3.5. Past Drought Events at the Ogasawara Islands during the Simultaneous Occurrence of EN and EN Modoki, along with the Case Study of Spring–Summer 1991
The history of drought on the Ogasawara Islands was compiled in [16]. Combined with the results shown in Figure 4, we prepared Table 3. EN Modoki years are shown in Figure 5.
As shown in Table 3, the EN and EN Modoki occurred five times simultaneously after June 1968. Drought events on the Ogasawara Islands occurred ten times during the same period; however, they did not occur during EN except for October 1990–July 1991 and autumn 2018–spring 2019. This is in general agreement with the findings presented in Section 3.1.
From October 1990 to July 1991. EN Modoki occurred in August 1990, followed by EN in April 1991. Although drought occurred at Haha-jima (Figure 1b) from October 1990 to July 1991 (Table 3), here we investigate the situations of MAM 1991 and JJA 1991 when EN and EN Modoki occurred simultaneously after April 1991.
Figure 16 depicts the SLP, surface wind, and precipitation anomalies in MAM 1991. As shown in Figure 16a, positive anomalies of SLP widely prevailed in the North Pacific. In comparison with Figure 11a, which contains the seven EN Modoki events, positive SLP anomalies were found in the eastern part of the North Pacific in Figure 16a. As for precipitation, Figure 11b and Figure 16b showed negative anomalies around the Ogasawara Islands, which are sandwiched by positive anomalies lying in both the north and south. Although a slightly positive SSTA was observed around the Ogasawara Islands, the SSTA in Figure 16c was fairly different from that in Figure 8b, especially in the mid-latitudes around Japan. In MAM 1991 (Figure 16c), a positive SSTA was observed, whereas the EN Modoki composite (Figure 8b) did not exhibit such a characteristic. In Figure 8b, the Ogasawara Islands were surrounded by positive SSTA; however, negative SSTA widely prevailed in the mid-latitudes around Japan.
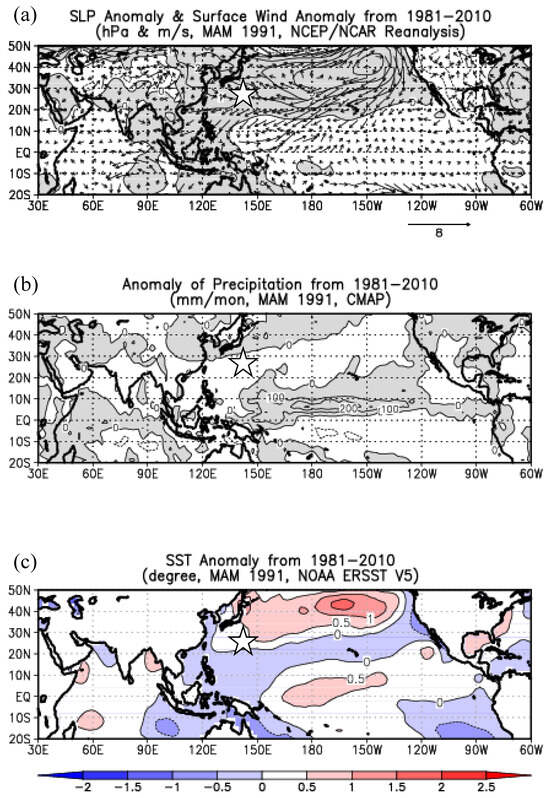
Figure 16.
(a) SLP and surface wind anomalies from 1981 to 2010 during March to May in 1991. (b) Same as (a), but for precipitation. (c) Same as (a), but for SST. The white stars represent Chichi-jima. Positive anomalies are shaded in (a,b).
We did not analyze the characteristics of EN Modoki in JJA for 2018–2019 in Section 3.3 and Section 3.4. Therefore, we briefly explain the characteristics of EN Modoki in JJA and compare them with those in JJA 1991. Figure 17 shows the SLP, surface wind, and precipitation anomalies in the seven composites of EN Modoki. Negative SLP anomalies prevailed widely throughout the Pacific, whereas precipitation also showed negative anomalies around the Ogasawara Islands. SSTAs around the Ogasawara Islands were at the periphery of positive and negative anomalies.
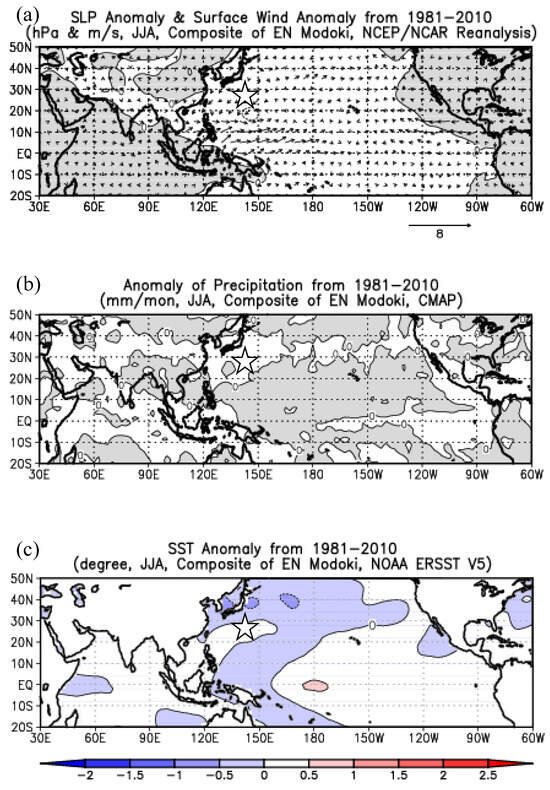
Figure 17.
Same as Figure 16, but for the seven composites of EN Modoki (1987, 1991, 1992, 1993, 1995, 2003, and 2005) during June to August. The white stars indicate Chichi-jima.
Figure 18 is similar to Figure 17, but for JJA1991. Although the SLP showed a negative anomaly around the Ogasawara Islands along with cyclonic circulation, precipitation still showed a negative anomaly. This characteristic is the same as that shown in Figure 17b. SSTA around the Ogasawara Islands showed positive ones of approximately 1 °C, along with the positive anomalies extending in a northeast direction. From the distribution of the SSTA, a positive precipitation anomaly was expected around the Ogasawara Islands; however, this was not observed. Therefore, global atmospheric conditions are more important than local atmospheric conditions in this case, as discussed in Section 3.4.
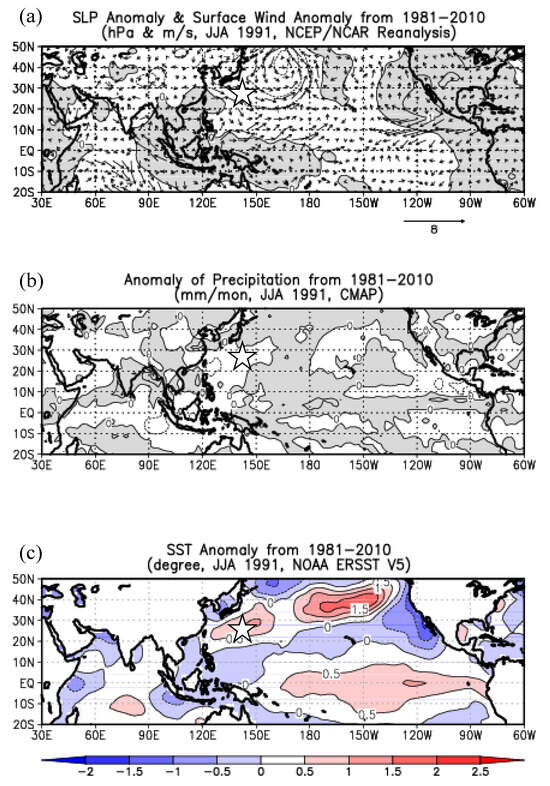
Figure 18.
Same as Figure 16, but for June–August in 1991. The white stars indicate Chichi-jima.
During SON 2018–MAM 2019 and spring–summer 1991, drought occurred at the Ogasawara Islands under the simultaneous occurrence of EN and EN Modoki (Table 3). However, it is difficult to discuss common features and differences between these drought events, along with their possible reasons, because only MAM overlaps between the two events (Figure 8, Figure 15 and Figure 16). In addition, the drought event terminated in the spring of 2019, whereas it began in the spring of 1991.
In 2018–2019, slightly positive SSTA (Figure 8), negative SLP and cyclonic circulation (Figure 15a), and positive precipitation (Figure 15b) were observed around the Ogasawara Islands as expected. In MAM 1991 (Figure 16), slightly positive SSTA (Figure 16c), positive SLP and anticyclonic circulation (Figure 16a), and negative precipitation (Figure 16b) were observed. Figure 16a and Figure 16b coincides with each other; however, Figure 16c is opposed to the expectation. This means that local SSTA around the Ogasawara Islands may not be so important for the occurrence of the drought there. The role of local SSTA around the Ogasawara Islands on the drought events should be further investigated in future studies.
4. Conclusions
In this study, we investigated the causes of the occurrence of severe drought in the Ogasawara Islands during the EN of 2018–2019. The following conclusions were drawn:
- In general, the Ogasawara Islands did not experience drought during EN events (7 out of 11 cases).
- The severe drought that occurred during the EN event in 2018–2019 corresponded to the simultaneous occurrence of EN and EN Modoki events.
- During EN Modoki, the precipitation around the Ogasawara Islands was less than the climatological mean from autumn to the following spring.
- From an analysis of past drought events on the Ogasawara Islands, we found that drought events from October 1990 to July 1991 partially overlapped with the simultaneous occurrence of EN and EN Modoki events. The analysis of the data from spring to summer 1991 demonstrated that global atmospheric conditions are more important than local conditions.
This study elucidated the effect of EN Modoki on the severe drought that occurred in the Ogasawara Islands during EN. Because the necessity of precise studies on the effect of EN Modoki on the regional atmospheric field has been suggested in previous studies [17,18], this study is regarded as one of such expected examples. We believe that the present study will contribute to clarifying the regional atmospheric field during the simultaneous occurrence of the EN and EN Modoki events. Such case studies will be necessary in the near future.
As a remaining problem, we should investigate the role of local SSTA around the Ogasawara Islands in the occurrence of the drought there. This is also a future study.
Funding
This study was partly supported by the Ogasawara Research Committee of Tokyo Metropolitan University and a Grant-in-Aid for Scientific Research provided by the Japan Society for the Promotion of Sciences (21H00630-1, PI: H. Matsuyama).
Institutional Review Board Statement
Not applicable.
Informed Consent Statement
Not applicable.
Data Availability Statement
The water storage ratio of the dams at Chichi-jima was obtained from the Construction and Water Supply Division of Ogasawara Village. Restrictions apply to the availability of these data, which were used under license for the current study and are not publicly available. SST in the NINO.3 region and precipitation at Chichi-jima are available from [5] and [1], respectively. The EMI is available in [9]. The NOAA ERSST V5 [11], CMAP [12], and NCEP/NCAR reanalysis [13] are available in [19]. The drought history of the Ogasawara Islands was obtained from [16].
Acknowledgments
The author is grateful to the Construction and Water Supply Division, Ogasawara Village, for allowing him to use the water storage ratio of the dams at Chichi-jima.
Conflicts of Interest
The author declares no conflicts of interest.
References
- Japan Meteorological Agency. Search for Past Meteorological Data. Available online: https://www.data.jma.go.jp/obd/stats/etrn/index.php? (accessed on 7 February 2024). (In Japanese).
- Matsuyama, H. Severe drought after an absence of 37 years: Less precipitation on Chichi-jima in the Ogasawara (Bonin) Islands from 2016 to 2017. J. Geogr. (Chigaku Zasshi) 2018, 127, 1–19, (In Japanese with English abstract). [Google Scholar] [CrossRef]
- Miyoshi, S.; Matsuyama, H. Investigating the effects of drought on the vegetation activity using remote sensing data: A case study at Chichi-jima, Ogasawara (Bonin) Islands. J. Geogr. (Chigaku Zasshi) 2022, 131, 365–380, (In Japanese with English abstract). [Google Scholar] [CrossRef]
- Nitta, Ts. Convective activities in the tropical western Pacific and their impact on the northern hemisphere summer circulation. J. Meteorol. Soc. Jpn. 1987, 65, 373–390. [Google Scholar] [CrossRef]
- Japan Meteorological Agency. El Niño/La Niña Phenomena. Available online: https://www.data.jma.go.jp/cpd/elnino/index.html (accessed on 7 February 2024). (In Japanese).
- Yoshida, K.; Iwashita, H.; Iijima, Y.; Oka, S. Long-term change in the hydroclimatic environment during the 20th century on Chichi-jima in the Ogasawara (Bonin) Islands. Geogr. Rev. Jpn. 2006, 79, 516–526, (In Japanese with English abstract). [Google Scholar] [CrossRef] [PubMed]
- Yoshida, K.; Iijima, Y. Hydroclimatic conditions during last decade in the Ogasawara (Bonin) Islands. Jpn. J. Limnol. 2009, 70, 13–20, (In Japanese with English abstract). [Google Scholar] [CrossRef]
- Kanno, H.; Matsuyama, H. Pre-1906 extension of precipitation data for Chichi-jima in the Ogasawara (Bonin) Islands based on the analysis of historical documents. SOLA 2021, 17, 170–176. [Google Scholar] [CrossRef]
- APEC Climate Center. Climate Indices. Available online: https://www.apcc21.org/main.do?lang=len (accessed on 7 February 2024).
- Ashok, K.; Behera, S.K.; Rao, S.A.; Weng, H.; Yamagata, T. El Niño Modoki and its possible teleconnection. J. Geophys. Res. 2007, 112, C11007. [Google Scholar] [CrossRef]
- Huang, B.; Thorne, P.W.; Banzon, V.F.; Boyer, T.; Chepurin, G.; Lawrimore, J.H.; Menne, M.J.; Smith, T.M.; Vose, R.S.; Zhang, H.M. NOAA Extended Reconstructed Sea Surface Temperature (ERSST), Version 5. NOAA National Centers for Environmental Information. Available online: https://www.esrl.noaa.gov/psd/ (accessed on 7 February 2024).
- Xie, P.; Arkin, P.A. Global precipitation: A 17-year monthly analysis based on gauge observations, satellite estimates, and numerical model outputs. Bull. Am. Meteorol. Soc. 1997, 78, 2539–2558. [Google Scholar] [CrossRef]
- Kalnay, E.; Kanamitsu, M.; Kistler, R.; Collins, W.; Deaven, D.; Gandin, L.; Iredell, M.; Saha, S.; White, G.; Woollen, J.; et al. The NCEP/NCAR 40-year reanalysis project. Bull. Am. Meteorol. Soc. 1996, 77, 437–471. [Google Scholar] [CrossRef]
- Ropelewski, C.F.; Halpert, M.S. Global and regional scale precipitation patterns associated with the El Niño/Southern Oscillation. Mon. Weather. Rev. 1987, 115, 1606–1626. [Google Scholar] [CrossRef]
- McPhaden, M.J. A 21st century shift in the relationship between ENSO SST and warm water volume anomalies. Geophys. Res. Lett. 2012, 39, L09706. [Google Scholar] [CrossRef]
- Suzuki, H. Climate disaster session report. Ogasawara Res. 2022, 48, 161–172, (In Japanese with English abstract). [Google Scholar]
- Yamagata, T. El Niño Modoki. Tenki 2011, 58, 228–230. (In Japanese) [Google Scholar]
- Weng, H.; Behera, S.K.; Yamagata, T. Anomalous winter climate conditions in the Pacific rim during recent El Niño Modoki and El Niño events. Clim. Dyn. 2009, 32, 663–674. [Google Scholar] [CrossRef]
- National Oceanic and Atmospheric Administration (NOAA)/Physical Sciences Laboratory (PSL) Monthly/Seasonal Climate Composites. Available online: https://psl.noaa.gov/cgi-bin/data/composites/printpage.pl (accessed on 7 February 2024).
Disclaimer/Publisher’s Note: The statements, opinions and data contained in all publications are solely those of the individual author(s) and contributor(s) and not of MDPI and/or the editor(s). MDPI and/or the editor(s) disclaim responsibility for any injury to people or property resulting from any ideas, methods, instructions or products referred to in the content. |
© 2024 by the author. Licensee MDPI, Basel, Switzerland. This article is an open access article distributed under the terms and conditions of the Creative Commons Attribution (CC BY) license (https://creativecommons.org/licenses/by/4.0/).